Introduction
Breast cancer is still the leading cause of death in
women worldwide (1). Although the
detection rate of breast carcinoma has improved, many female
patients die from metastatic relapse. Mammography is the best
available method for detection of breast cancer after the age of
50; although, the detection rate of mammography is not as good in
younger women due to their high density breast tissue (2). Early detection is beneficial in the
fight against breast cancer. Currently, there are no clinical
biomarkers available for early detection of breast cancer. Markers
such as CA15.3 and CEA are useful, in combination with imaging and
physical examination, for monitoring ongoing treatment in breast
cancer patients with metastatic disease; although, they both lack
the clinical specificity and sensitivity to be used routinely as a
clinical diagnostic tool (3).
The development of high-throughput techniques in
Proteomics expanded the search for new biomarkers and enabled the
identification of proteins that may have a crucial role in emerging
and progressing breast cancer. Proteome analysis of body fluids,
such as sera, tear film, or urine, is a hot topic in Proteomics
(4–6). Li et al found three differently
regulated proteins in the sera of breast cancer patients and
healthy subjects using surface-enhanced laser desorption/ionization
time-of-flight based protein profiling in 2002 and Mathelin et
al tried to validate these putative biomarkers, determining
only two of them could be used for the discrimination of cancer
patients (7,8) (reviewed in refs. 9,10).
Some studies examined the nipple aspirate fluid of breast cancer
patients and healthy patients (11). In 2005, Pawlik et al showed
17 distinctly regulated peptides; whereas, Li et al found
different protein distribution patterns in the nipple aspirate
fluid and ductal lavage with the use of SELDI-TOF mass spectrometry
(12,13). Since then, many other protein
profiling studies were published that used matrix-assisted laser
desorption/ionization time-of-flight/time-of-flight mass
spectrometry with differently regulated proteins (14–16).
The advantage of the MALDI-TOF-TOF MS is the subsequent
identification of the proteins of interest. In a previous study, we
reported data from MALDI-TOF-TOF-based profiling of the sera that
could distinguish breast cancer patients from age-matched healthy
controls, and we could classify cancer patients with a high
sensitivity of 89% (17).
Another proteomics-based approach for the
exploration of cancer-derived differences is the highly-precise
microarray platform. This approach can serve, instead of the common
ELISA test, as a validation tool for the biomarkers identified from
prior MALDI-TOF-TOF-based explorations of the proteome. Here, the
antibodies are fixed on a highly-optimized surface. In this manner,
several protein levels can be measured simultaneously due to the
small required volume (nl) of the reagents. After fixation of the
antibodies, the surfaces can be incubated with body fluids
containing the appropriate proteins. This high-throughput technique
is also very common for the profiling of carcinoma tissue or body
fluids of diseased patients due to its miniaturized size, accuracy,
and automated handling (18–20)
(reviewed in ref. 21). Several
comparative studies of breast cancer and healthy sera have been
published. Our study group reported the regulation of several
proteins were significantly different in the sera of breast cancer
patients (22). The discovery of
different protein patterns in diseased cohorts and control samples
and subsequent identification of these biomarkers is a promising
method of obtaining knowledge about the effects of several diseases
(6,23,24). A
well-developed and clinically proven biomarker signature could lead
to early detection of cancer, which can have great benefits for
patients.
Most proteomic studies of breast carcinoma published
so far concentrate on profiling the tissue or body fluids near the
emergence spot. Little is known about the proteome changes of
distant body fluids. Some research groups examined the protein
profiles of alternative body fluids such as urine or saliva and
several differently regulated proteins were reported (reviewed in
refs. 25,26). Previously, we showed different
protein distributions in the tear fluid of breast cancer patients
and healthy controls in a SELDI-TOF-based profiling study (17,27).
Another comparative MALDI-TOF-TOF-driven analysis of healthy dog’s
tear fluid and dogs diagnosed with cancer has been published
(28). To our knowledge, no other
comparative tear fluid proteomic studies for breast cancer have
been reported. Tear fluid has unique properties as retrieval is
minimally invasive and it does not contain as many highly-abundant
proteins as serum.
Herein, we report a MALDI-TOF-TOF-driven
semi-quantitative comparison of tear protein levels in cancer (CA)
and control (CTRL) using a de novo approach in pooled
samples. Using a signature of biomarkers significantly decreased or
increased in groups of CA and CTRL could help to discriminate
diseased women from the healthy population with high specificity
and sensitivity and possibly lead to the establishment of a
molecular diagnostic tool for breast cancer.
Materials and methods
Comparison of tear protein levels in
pooled samples from CA and CTRL
This de novo study included 50 female
subjects, 25 patients were diagnosed with primary invasive breast
carcinoma and treated at the University Medical Center Mainz. At
the time of diagnosis, none of the patients had developed distant
metastases. Patients’ characteristics are summarized in Table I. The healthy control subjects were
25 age-matched women without any known malignancies who were
treated at the University of Mainz medical center. All study
members gave their informed consent for voluntary participation in
this study. The protocols were approved by the institutional ethics
committee in accordance with the ethical standard of Declaration of
Helsinki (1964).
 | Table ICharacteristics of breast cancer
patients. |
Table I
Characteristics of breast cancer
patients.
| Characteristic | Breast cancer
patients
n=25 (%) | Healthy
controls
n=25 |
|---|
| Mean age
(distribution) | 58 (39–85) | 58 (39–85) |
| Tumor size |
| pT1 | 16 (64) | |
| pT2 | 9 (36) | |
| Nodal status |
| Negative | 18 (72) | |
| Positive | 7 (28) | |
| Grading |
| Well
differentiated (G1) | 6 (24) | |
| Moderately
differentiated (G2) | 14 (56) | |
|
Poor/undifferentiated (G3) | 5 (20) | |
| Distant
metastases |
| M0 | 25 (100) | |
| M1 | 0 (0) | |
Sample retrieval
Tear fluid was obtained from all participants using
a Schirmer Strip. After the samples were drawn, the strips were
frozen immediately at −80°C to prevent protein degradation. Tear
proteins were prepared under strict and identical conditions for
all patients. Prior to the experiments, the wet strip part was cut
into small pieces and incubated with n-Dodecyl-β-D-maltoside
overnight at 4°C with constant shaking. The next day, the eluates
were briefly centrifuged and transferred into fresh tubes. All
samples were stored prior to analysis at −20°C.
Sample processing
For the comparison of protein levels in CTRL and CA,
each of the 25 tear eluates were pooled together accordingly to the
group and precipitated with three times the volume of acetone
overnight at −80°C. The next day, tear proteins were centrifuged at
14000 × g and 4°C to prevent protein degradation. The supernatant
was discarded and the proteins were resuspended in PBS. Protein
concentrations were measured with the BCA Protein Assay kit (Thermo
Scientific, Rockford IL, USA), according to the manufacturer’s
protocol.
1D SDS-PAGE and sample purification
Pooled tear proteins (60 μg) from CTRL and CA were
separated by molecular weight using 1D SDS-PAGE (gels, buffers, and
equipment all purchased from Invitrogen, Darmstadt, Germany). After
gel electrophoresis, the lanes were stained overnight and then
rinsed with double-distilled water. In the next step, the lanes
were subdivided into 32 bands and the proteins were digested with
endopeptidase trypsin according to the modified digestion protocol
from Shevchenko et al(29).
For the purification and desalting of peptides, automated sample
handling was preferred to reduce the fluctuations from measured
proteins due to manual processing of the samples. The purification
and the stepwise elution of the peptides with 10–50% acetonitrile
were performed using C18 ZipTips (Millipore, Billerica, USA) on the
Freedom EVO®, purification station (Tecan Group Ltd.,
Männedorf, Switzerland). The eluted proteins (3 μl) were directly
spotted on the MALDI TOF/TOF polished steel target and coated with
3 μl crystallization matrix (20 mg cinnamic acid/50%
acetonitrile/2% trifluoroacetic acid). The matrix included 0.5 μl
of a Reserpine solution (1 mg/ml) dissolved in methanol for signal
normalization. All samples were measured head-to-head to avoid
protein degradation and measurement fluctuations in the
MALDI-TOF/TOF mass spectrometer (UltraflexII, Bruker Daltonik GmbH,
Bremen, Germany). The peak detection was performed with internal
calibration mix (Peptide calibration standard II, Bruker Daltonik
GmbH).
Data processing
After MALDI-TOF/TOF measurements, the spectra were
exported into Proteomics Pipeline Mainz (P2M) software,
developed in-house, and normalized according to the Reserpine
peaks. Proteins were identified using the MASCOT protein search
tool (30). The Swissprot database
was chosen for the identification of proteins (31). The following general parameters were
used: carbamidomethyl as a global modification and oxidation (M) as
a variable modification with an MS tolerance of 100 ppm and MS/MS
tolerance of 0.8. Only one miscleaved site was allowed and the
MudPIT scoring system was used. For further analysis of the protein
regulation levels, the intensities of the peptides for each protein
were summed and the ratio of the intensity between both groups was
calculated for each protein. Significant differences in protein
expression levels were defined as at least two times higher or
lower expression than the other group. STRING and Cytoscape
software were used for the analysis of protein-protein interactions
(32,33).
Results
In this study we conducted an explorative and
comparative analysis of the tear proteome of breast carcinoma
patients and age-matched healthy controls. We tried to minimize
protein degradation and fluctuations of protein measurements to
achieve a precise comparison of protein levels. One person
performed the experimental steps for the preparation of tear
samples for 1D SDS-PAGE until the transfer of digested fractions
onto the sample plate for the robotic purification station. The
peptide purification was performed automatically to avoid
fluctuations due to the manual handling of samples. Likewise, the
experimental steps from the precipitation of the tear eluates were
also performed by the same person.
Semiquantitative comparison of protein
levels in CA and CTRL
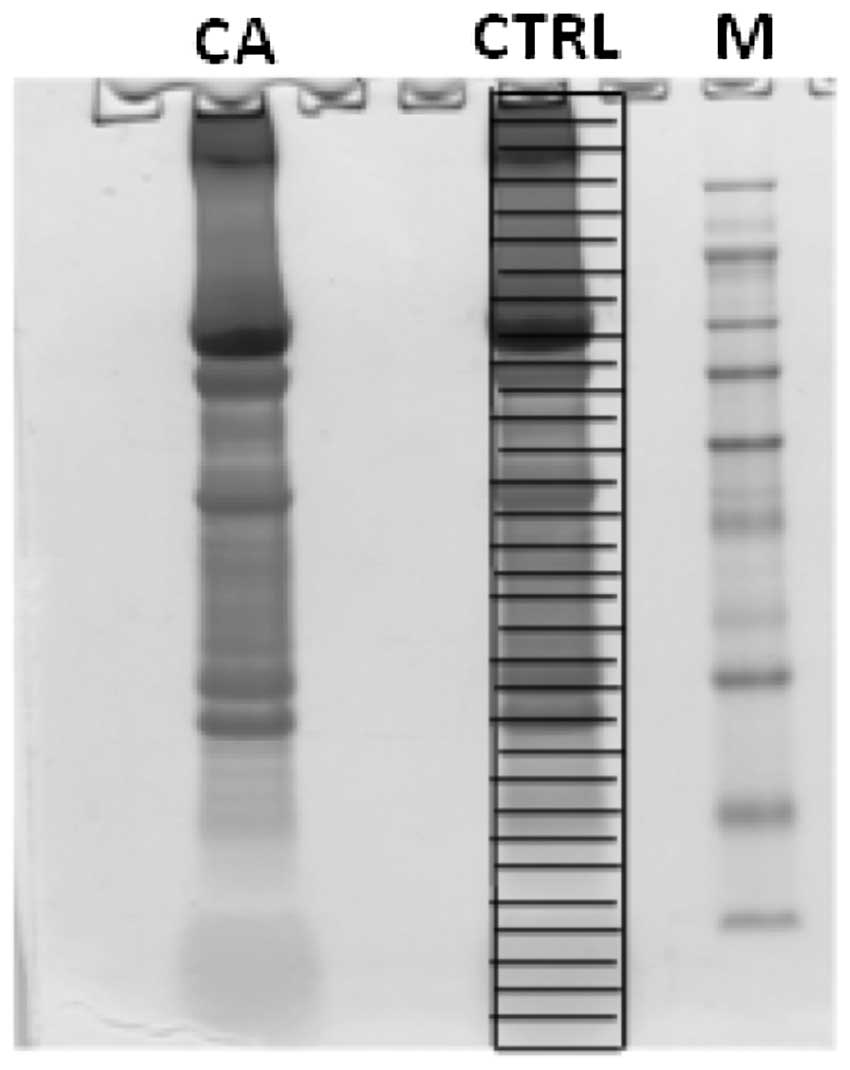
After destaining, a grid made of 32 bands was put
under the gel for a more accurate comparison of the proteins. Each
of the 32 bands from CTRL and CA were cut out and digested with
trypsin overnight. Fig. 1 shows the
samples after 1D SDS-PAGE separation and staining with Coomassie
dye (Colloidal Blue Staining kit, Invitrogen). After digestion and
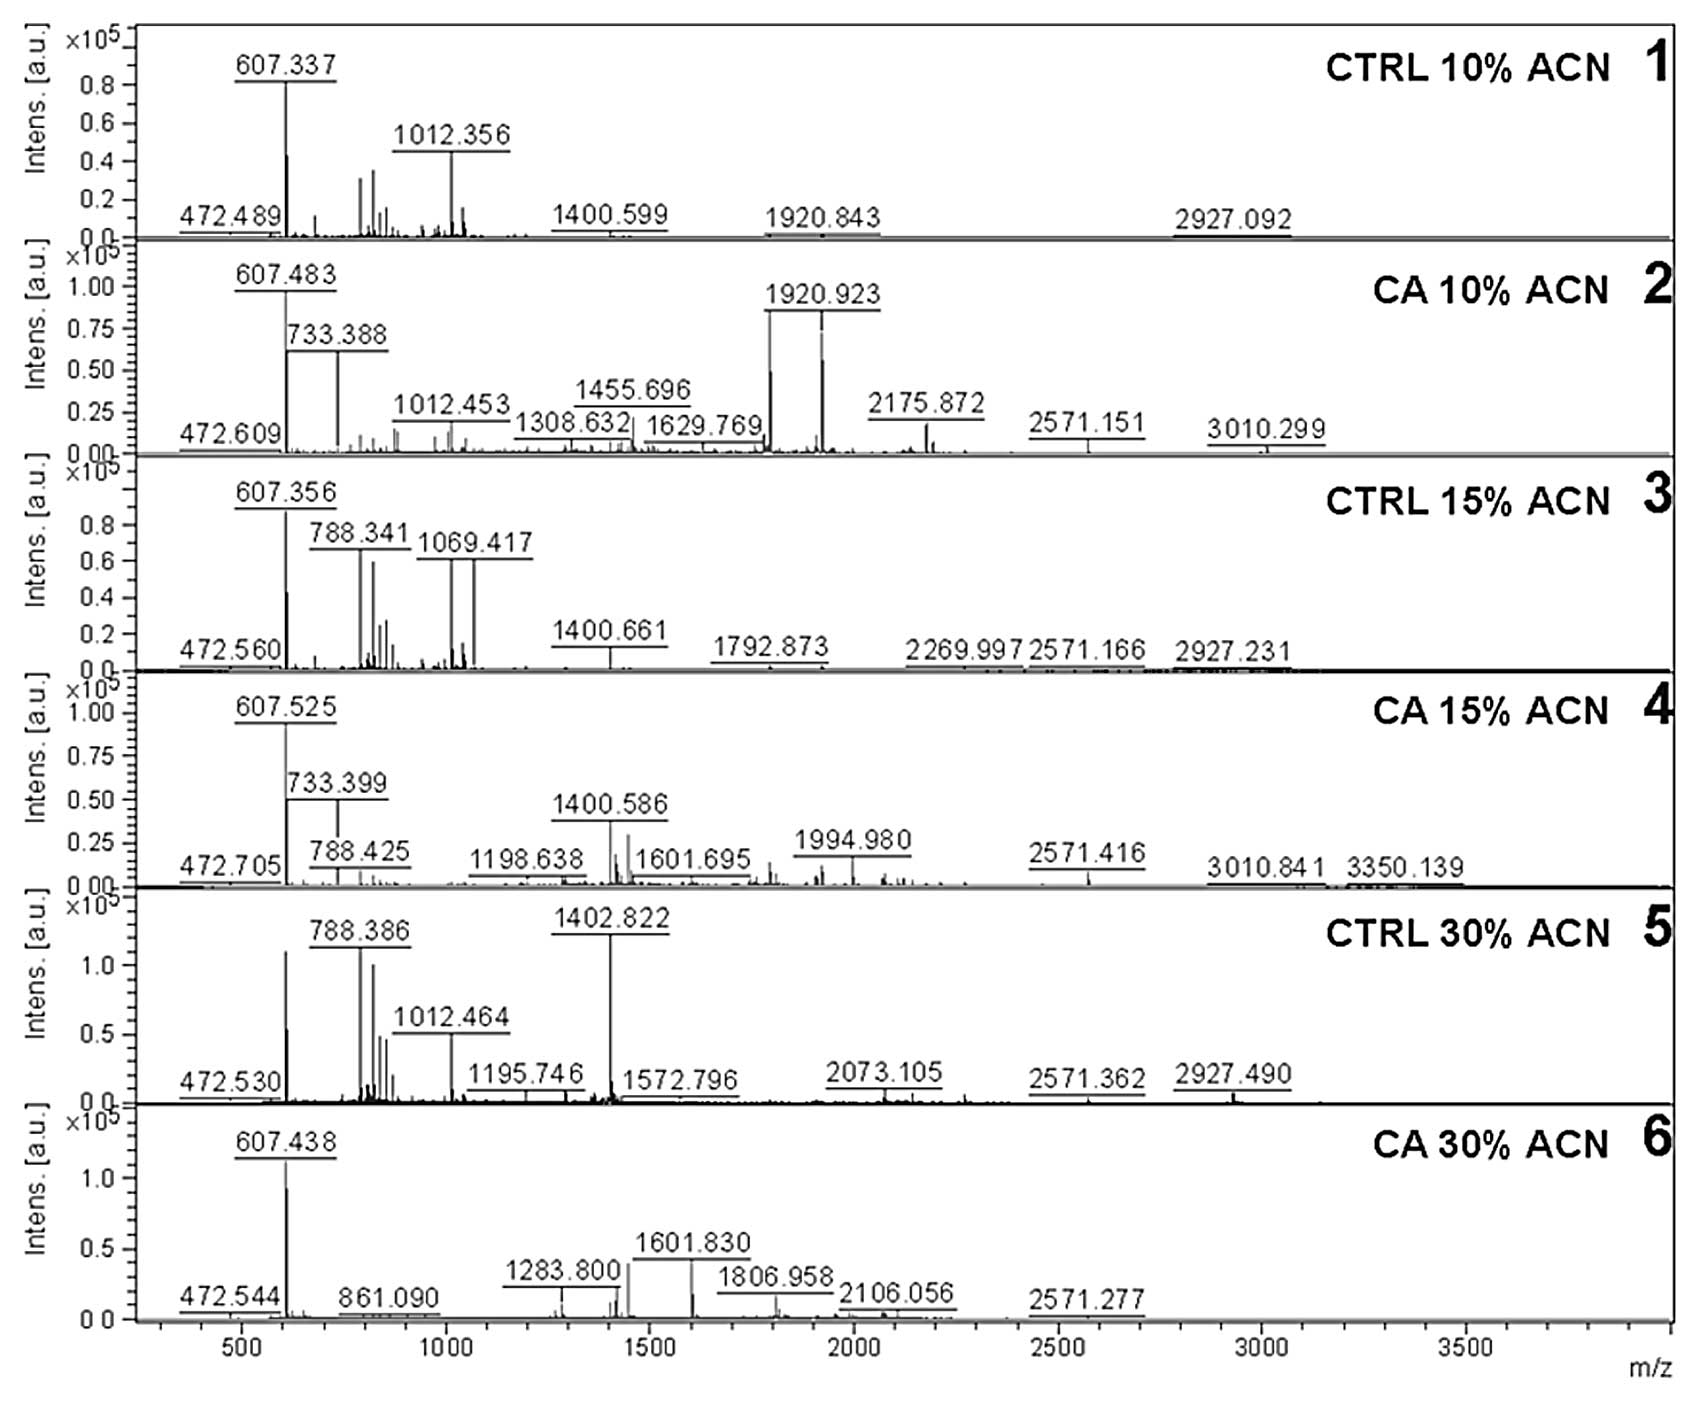
automated fractionation, the peptides were measured in a
MALDI-TOF-TOF mass spectrometer. Representative fractions from both
groups are shown in Fig. 2. All
spectra were normalized using Protein Pipeline Mainz software,
which was developed in-house, and the appropriate tear proteins
were identified with the MASCOT search tool.
Protein identification
After extensive comparison of the spectra obtained
using the annotated proteins in the SWISSPROT Homo sapiens database
under the given conditions and MOWSE score, we were able to
identify over 150 proteins in the CTRL and CA. The complete merged
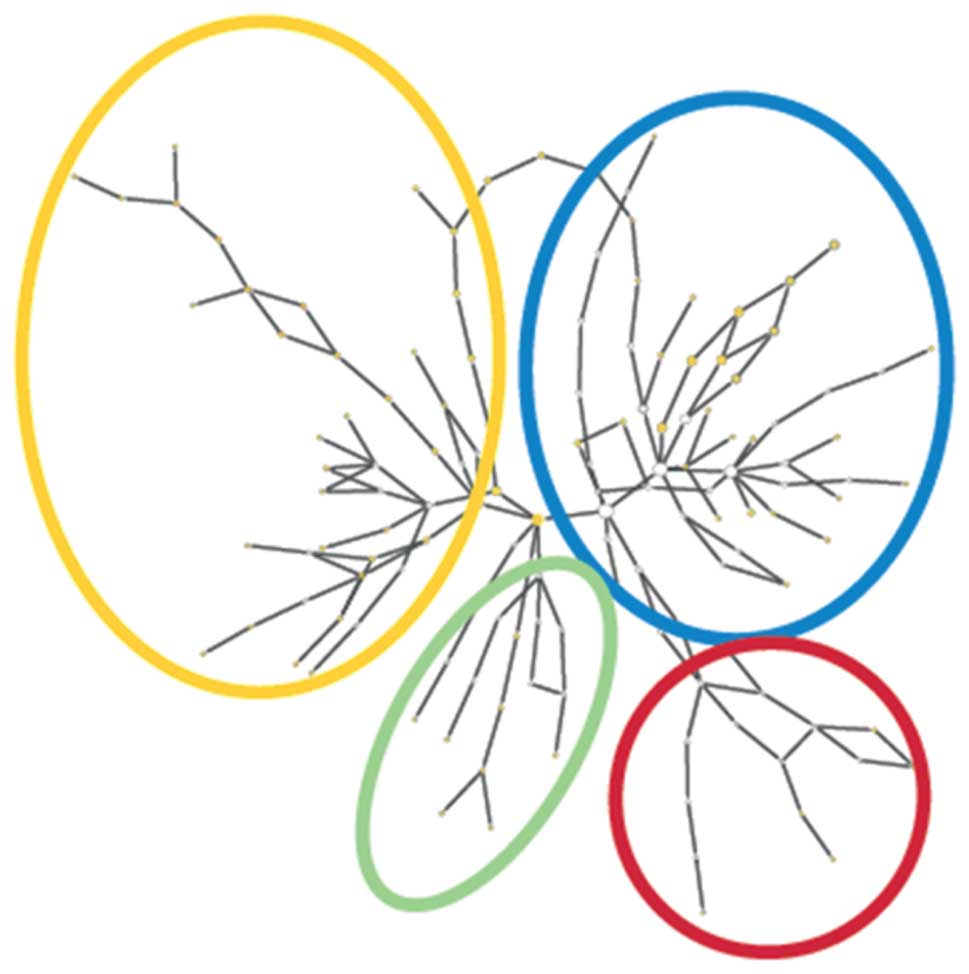
list of identified proteins is summarized in Table II. To obtain an overview on the
relevance and role of the identified proteins, we clustered the
proteins in accordance to their molecular functions using the
software Cytoscape 2.7.0, as shown in Fig. 3. The Cytoscape software often shows
several overlapping molecular functions and distributions into
several biological processes; therefore, we created an overview of
one mapping possibility for a large number of the identified tear
proteins.
| Table IIProteins identified from tear
proteomes of CA and CTRL. |
Table II
Proteins identified from tear
proteomes of CA and CTRL.
| Protein | Description | Organism species
(OS) | Gene name (GN) |
|---|
| TRFL_HUMAN |
Lactotransferrin | Homo sapiens | LTF |
| LCN1_HUMAN | Lipocalin-1 | Homo sapiens | LCN1 |
| ALBU_HUMAN | Serum albumin | Homo sapiens | ALB |
| IGKC_HUMAN | Ig κ chain C
region | Homo sapiens | IGKC |
| SG2A1_HUMAN | Mammaglobin-B | Homo sapiens | SCGB2A1 |
| LYSC_HUMAN | Lysozyme C | Homo sapiens | LYZ |
| PIP_HUMAN | Prolactin-inducible
protein | Homo sapiens | PIP |
| DMBT1_HUMAN | Deleted in
malignant brain tumors 1 protein | Homo sapiens | DMBT1 |
| IGHA1_HUMAN | Ig α-1 chain C
region | Homo sapiens | IGHA1 |
| IGHA2_HUMAN | Ig α-2 chain C
region | Homo sapiens | IGHA2 |
| GSTP1_HUMAN | Glutathione
S-transferase P | Homo sapiens | GSTP1 |
| ZA2G_HUMAN |
Zinc-α-2-glycoprotein | Homo sapiens | AZGP1 |
| ACTB_HUMAN | Actin, cytoplasmic
1 | Homo sapiens | ACTB |
| CYTN_HUMAN | Cystatin-SN | Homo sapiens | CST1 |
| LC1L1_HUMAN | Putative lipocalin
1-like protein 1 | Homo sapiens | LCN1L1 |
| PROL4_HUMAN | Proline-rich
protein 4 | Homo sapiens | PRR4 |
| CYTS_HUMAN | Cystatin-S | Homo sapiens | CST4 |
| ACTBL_HUMAN | β-actin-like
protein 2 | Homo sapiens | ACTBL2 |
| POTEE_HUMAN | POTE ankyrin domain
family member E | Homo sapiens | POTEE |
| POTEF_HUMAN | POTE ankyrin domain
family member F | Homo sapiens | POTEF |
| ACTC_HUMAN | Actin, α cardiac
muscle 1 | Homo sapiens | ACTC1 |
| LAC2_HUMAN | Ig λ-2 chain C
regions | Homo sapiens | IGLC2 |
| SG1D1_HUMAN | Secretoglobin
family 1D member 1 | Homo sapiens | SCGB1D1 |
| S10A9_HUMAN | Protein
S100-A9 | Homo sapiens | S100A9 |
| K1C9_HUMAN | Keratin, type I
cytoskeletal 9 | Homo sapiens | KRT9 |
| TMC8_HUMAN | Transmembrane
channel-like protein 8 | Homo sapiens | TMC8 |
| K2C1_HUMAN | Keratin, type II
cytoskeletal 1 | Homo sapiens | KRT1 |
| LAC1_HUMAN | Ig λ-1 chain C
regions | Homo sapiens | IGLC1 |
| CYTT_HUMAN | Cystatin-SA | Homo sapiens | CST2 |
| PIGR_HUMAN | Polymeric
immunoglobulin receptor | Homo sapiens | PIGR |
| S10A8_HUMAN | Protein
S100-A8 | Homo sapiens | S100A8 |
| APOA1_HUMAN | Apolipoprotein
A-I | Homo sapiens | APOA1 |
| PROL1_HUMAN | Proline-rich
protein 1 | Homo sapiens | PROL1 |
| HSPB1_HUMAN | Heat shock protein
β-1 | Homo sapiens | HSPB1 |
| LACRT_HUMAN | Extracellular
glycoprotein lacritin | Homo sapiens | LACRT |
| ABCA3_HUMAN | ATP-binding
cassette sub-family A member 3 | Homo sapiens | ABCA3 |
| IGJ_HUMAN | Immunoglobulin J
chain | Homo sapiens | IGJ |
| ANXA2_HUMAN | Annexin A2 | Homo sapiens | ANXA2 |
| SSH2_HUMAN | Protein phosphatase
Slingshot homolog 2 | Homo sapiens | SSH2 |
| KV301_HUMAN | Ig κ chain V-III
region B6 | Homo sapiens | |
| KV307_HUMAN | Ig κ chain V-III
region GOL | Homo sapiens | |
| TPIS_HUMAN | Triosephosphate
isomerase | Homo sapiens | TPI1 |
| LEG3_HUMAN | Galectin-3 | Homo sapiens | LGALS3 |
| NGAL_HUMAN | Neutrophil
gelatinase-associated lipocalin | Homo sapiens | LCN2 |
| POP1_HUMAN | Ribonucleases P/MRP
protein subunit POP1 | Homo sapiens | POP1 |
| ZC3H1_HUMAN | Zinc finger C3H1
domain-containing protein | Homo sapiens | ZFC3H1 |
| CLIC1_HUMAN | Chloride
intracellular channel protein 1 | Homo sapiens | CLIC1 |
| LIME1_HUMAN | Lck-interacting
transmembrane adapter 1 | Homo sapiens | LIME1 |
| HV307_HUMAN | Ig heavy chain
V-III region CAM | Homo sapiens | |
| GNL3_HUMAN | Guanine
nucleotide-binding protein-like 3 | Homo sapiens | GNL3 |
| POTEI_HUMAN | POTE ankyrin domain
family member I | Homo sapiens | POTEI |
| ENOA_HUMAN | α-enolase | Homo sapiens | ENO1 |
| PRDX1_HUMAN |
Peroxiredoxin-1 | Homo sapiens | PRDX1 |
| MECP2_HUMAN | Methyl-CpG-binding
protein 2 | Homo sapiens | MECP2 |
| K2C78_HUMAN | Keratin, type II
cytoskeletal 78 | Homo sapiens | KRT78 |
| ZG16B_HUMAN | Zymogen granule
protein 16 homolog B | Homo sapiens | ZG16B |
| YM012_HUMAN | Uncharacterized
protein DKFZp434B061 | Homo sapiens | |
| YV021_HUMAN | Uncharacterized
protein LOC284861 | Homo sapiens | |
| ILEU_HUMAN | Leukocyte elastase
inhibitor | Homo sapiens | SERPINB1 |
| ANXA1_HUMAN | Annexin A1 | Homo sapiens | ANXA1 |
| POTEJ_HUMAN | POTE ankyrin domain
family member J | Homo sapiens | POTEJ |
| PLSL_HUMAN | Plastin-2 | Homo sapiens | LCP1 |
| NCOA5_HUMAN | Nuclear receptor
coactivator 5, protein existence (PE), 1; sequence version (SV),
2 | Homo sapiens | NCOA5 |
| B2MG_HUMAN |
β-2-microglobulin | Homo sapiens | B2M |
| KLH34_HUMAN | Kelch-like protein
34 | Homo sapiens | KLHL34 |
| ANX13_HUMAN | Annexin A13 | Homo sapiens | ANXA13 |
| MDHC_HUMAN | Malate
dehydrogenase, cytoplasmic | Homo sapiens | MDH1 |
| AIFM2_HUMAN | Apoptosis-inducing
factor 2 | Homo sapiens | AIFM2 |
| STAG3_HUMAN | Cohesin subunit
SA-3 | Homo sapiens | STAG3 |
| SMCA4_HUMAN | Transcription
activator BRG1 | Homo sapiens | SMARCA4 |
| DDB1_HUMAN | DNA damage-binding
protein 1 | Homo sapiens | DDB1 |
| RM18_HUMAN | 39S ribosomal
protein L18, mitochondrial | Homo sapiens | MRPL18 |
| KRIT1_HUMAN | Krev interaction
trapped protein 1 | Homo sapiens | KRIT1 |
| PERT_HUMAN | Thyroid
peroxidase | Homo sapiens | TPO |
| HPT_HUMAN | Haptoglobin | Homo sapiens | HP |
| F184A_HUMAN | Protein
FAM184A | Homo sapiens | FAM184A |
| AAKG2_HUMAN | 5′-AMP-activated
protein kinase subunit γ-2 | Homo sapiens | PRKAG2 |
| AAKG3_HUMAN | 5′-AMP-activated
protein kinase subunit γ-3 | Homo sapiens | PRKAG3 |
| EIF2A_HUMAN | Eukaryotic
translation initiation factor 2A | Homo sapiens | EIF2A |
| RGPA2_HUMAN | Ral
GTPase-activating protein subunit α-2 | Homo sapiens | RALGAPA2 |
| TUT4_HUMAN | Terminal
uridylyltransferase 4 | Homo sapiens | ZCCHC11 |
| ATP4A_HUMAN |
Potassium-transporting ATPase α chain
1 | Homo sapiens | ATP4A |
| YJ017_HUMAN | Putative
uncharacterized protein LOC439951 | Homo sapiens | |
| AINX_HUMAN | α-internexin | Homo sapiens | INA |
| TTBK2_HUMAN | Tau-tubulin kinase
2 | Homo sapiens | TTBK2 |
| SPTN2_HUMAN | Spectrin β chain,
brain 2 | Homo sapiens | SPTBN2 |
| MDGA1_HUMAN | MAM
domain-containing glycosylphosphatidylinositol anchor protein
1 | Homo sapiens | MDGA1 |
| FREM3_HUMAN | FRAS1-related
extracellular matrix protein 3 | Homo sapiens | FREM3 |
| PDE4C_HUMAN | cAMP-specific
3′,5′-cyclic phosphodiesterase 4C | Homo sapiens | PDE4C |
| SULF1_HUMAN | Extracellular
sulfatase Sulf-1 | Homo sapiens | SULF1 |
| LRC4C_HUMAN | Leucine-rich
repeat-containing protein 4C | Homo sapiens | LRRC4C |
| S10A4_HUMAN | Protein
S100-A4 | Homo sapiens | S100A4 |
| LRFN6_HUMAN | Leucine-rich repeat
and fibronectin type-III domain-containing protein 6 | Homo sapiens | ELFN2 |
| IGHG3_HUMAN | Ig γ-3 chain C
region | Homo sapiens | IGHG3 |
| IGHG2_HUMAN | Ig γ-2 chain C
region | Homo sapiens | IGHG2 |
| ELOA1_HUMAN | Transcription
elongation factor B polypeptide 3 | Homo sapiens | TCEB3 |
| DLG3_HUMAN | Disks large homolog
3 | Homo sapiens | DLG3 |
| PDZD7_HUMAN | PDZ
domain-containing protein 7 | Homo sapiens | PDZD7 |
| HV315_HUMAN | Ig heavy chain
V-III region WAS | Homo sapiens | |
| HV304_HUMAN | Ig heavy chain
V-III region TIL | Homo sapiens | |
| WBS23_HUMAN | Williams-Beuren
syndrome chromosomal region 23 protein | Homo sapiens | WBSCR23 |
| PKHH3_HUMAN | Pleckstrin homology
domain-containing family H member 3 | Homo sapiens | PLEKHH3 |
| DMXL2_HUMAN | DmX-like protein
2 | Homo sapiens | DMXL2 |
| CBR3_HUMAN | Carbonyl reductase
[NADPH] 3 | Homo sapiens | CBR3 |
| CE164_HUMAN | Centrosomal protein
of 164 kDa | Homo sapiens | CEP164 |
| USPL1_HUMAN | Ubiquitin-specific
peptidase-like protein 1 | Homo sapiens | USPL1 |
| TRFE_HUMAN |
Serotransferrin | Homo sapiens | TF |
| MPPA_HUMAN |
Mitochondrial-processing peptidase subunit
α | Homo sapiens | PMPCA |
| CABP1_HUMAN | Calcium-binding
protein 1 | Homo sapiens | CABP1 |
| TFR1_HUMAN | Transferrin
receptor protein 1 | Homo sapiens | TFRC |
| ZN446_HUMAN | Zinc finger protein
446 | Homo sapiens | ZNF446 |
| MTDC_HUMAN | Bifunctional
methylenetetrahydrofolate dehydrogenase/cyclohydrolase,
mitochondrial | Homo sapiens | MTHFD2 |
| CT151_HUMAN | Uncharacterized
protein C20orf151 | Homo sapiens | C20orf151 |
| LIPB2_HUMAN | Liprin-β-2 | Homo sapiens | PPFIBP2 |
| ZSWM5_HUMAN | Zinc finger SWIM
domain-containing protein 5 | Homo sapiens | ZSWIM5 |
| WDR60_HUMAN | WD
repeat-containing protein 60 | Homo sapiens | WDR60 |
| C1QC_HUMAN | Complement C1q
subcomponent subunit C | Homo sapiens | C1QC |
| CNOT1_HUMAN | CCR4-NOT
transcription complex subunit 1 | Homo sapiens | CNOT1 |
| CDK13_HUMAN | Cyclin-dependent
kinase 13 | Homo sapiens | CDK13 |
| GLE1_HUMAN | Nucleoporin
GLE1 | Homo sapiens | GLE1 |
| RFIP4_HUMAN | Rab11
family-interacting protein 4 | Homo sapiens | RAB11FIP4 |
| AL3A1_HUMAN | Aldehyde
dehydrogenase, dimeric NADP-preferring | Homo sapiens | ALDH3A1 |
| FRMD7_HUMAN | FERM
domain-containing protein 7 | Homo sapiens | FRMD7 |
| SEM4C_HUMAN | Semaphorin-4C | Homo sapiens | SEMA4C |
| PRTG_HUMAN | Protogenin | Homo sapiens | PRTG |
| PTPRR_HUMAN | Receptor-type
tyrosine-protein phosphatase R | Homo sapiens | PTPRR |
| HV305_HUMAN | Ig heavy chain
V-III region BRO | Homo sapiens | |
| TGS1_HUMAN | Trimethylguanosine
synthase | Homo sapiens | TGS1 |
| LRRK2_HUMAN | Leucine-rich repeat
serine/threonine-protein kinase 2 | Homo sapiens | LRRK2 |
| BMPR2_HUMAN | Bone morphogenetic
protein receptor type-2 | Homo sapiens | BMPR2 |
| F178A_HUMAN | Protein
FAM178A | Homo sapiens | FAM178A |
| MOV10_HUMAN | Putative helicase
MOV-10 | Homo sapiens | MOV10 |
| K0556_HUMAN | Uncharacterized
protein KIAA0556 | Homo sapiens | KIAA0556 |
| KAT2A_HUMAN | Histone
acetyltransferase KAT2A | Homo sapiens | KAT2A |
| EAP1_HUMAN | Enhanced at puberty
protein 1 | Homo sapiens | EAP1 |
| CA175_HUMAN | Uncharacterized
protein C1orf175 | Homo sapiens | C1orf175 |
| ENOG_HUMAN | γ-enolase | Homo sapiens | ENO2 |
| ENOB_HUMAN | β-enolase | Homo sapiens | ENO3 |
| LOX5_HUMAN | Arachidonate
5-lipoxygenase | Homo sapiens | ALOX5 |
| MTMR4_HUMAN |
Myotubularin-related protein 4 | Homo sapiens | MTMR4 |
| YQ050_HUMAN | Putative
uncharacterized protein FLJ45831 | Homo sapiens | |
| TRI75_HUMAN | Tripartite
motif-containing protein 75 | Homo sapiens | TRIM75 |
| LRIG3_HUMAN | Leucine-rich
repeats and immunoglobulin-like domains protein 3 | Homo sapiens | LRIG3 |
| DSCL1_HUMAN | Down syndrome cell
adhesion molecule-like protein 1 | Homo sapiens | DSCAML1 |
| CD20_HUMAN | B-lymphocyte
antigen CD20 | Homo sapiens | MS4A1 |
| IGHG4_HUMAN | Ig γ-4 chain C
region | Homo sapiens | IGHG4 |
| MIDA_HUMAN | Protein midA
homolog, mitochondrial | Homo sapiens | C2orf56 |
| SI1L3_HUMAN | Signal-induced
proliferation-associated 1-like protein 3 | Homo sapiens | SIPA1L3 |
| TLE2_HUMAN | Transducin-like
enhancer protein 2 | Homo sapiens | TLE2 |
| KLH17_HUMAN | Kelch-like protein
17 | Homo sapiens | KLHL17 |
| CO7A1_HUMAN | Collagen α-1(VII)
chain | Homo sapiens | COL7A1 |
| MRGRD_HUMAN | Mas-related
G-protein coupled receptor member D | Homo sapiens | MRGPRD |
| MCF2L_HUMAN | Guanine nucleotide
exchange factor DBS | Homo sapiens | MCF2L |
| MTUS1_HUMAN |
Microtubule-associated tumor suppressor
1 | Homo sapiens | MTUS1 |
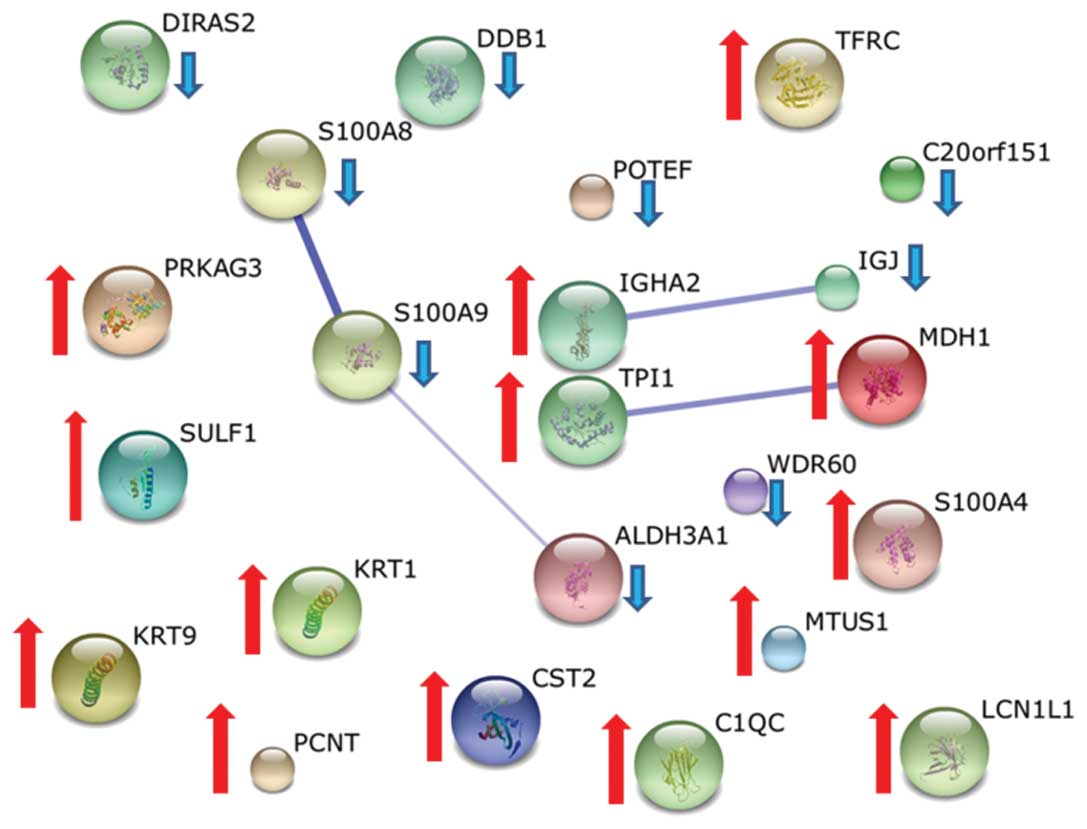
Using the in-house-developed algorithm, we compared
the protein levels in both groups. More than 20 proteins were
distinctly upregulated or downregulated in the CTRL and CA groups
and were involved in many biological processes such as metabolism
(ALDH3A or TPI) or immune response (e.g., C1Q1 or S100A8). Table III shows a detailed list of the
increased or decreased proteins in the tear fluid of breast cancer
patients. Of note, the findings include inflammation proteins or
complement factors for pathologic processes such as cancer that
have already been described (34–36).
Moreover, several proteins show at least four-fold higher
(Extracellular sulfatase Sulf-1, Cystatin SA, cst2; 5-AMP-activated
protein kinase subunit gamma-3, prkag3; Triosephosphate isomerase,
tpi1; Microtubule-associated tumor suppressor 1, mtus1; Transferrin
receptor protein 1, trfc; and Putative lipocalin 1-like protein 1,
lcn1l1) or lower levels (DNA damage-binding protein 1, ddb1;
Protein S100-A9, s100a9; and GTP-binding protein Di-Ras2, diras2)
in CA. An overview of the proteins differently regulated in the CA
group was constructed according to their regulation using the
STRING tool and is shown in Fig.
4(32).
| Table IIIProteins increased or decreased at
least 2-fold in CA. |
Table III
Proteins increased or decreased at
least 2-fold in CA.
| A, Increased
proteins in CA with fold increase |
|---|
|
|---|
| Protein ID | Fold decrease | Number of compared
peptides |
|---|
| Extracellular
sulfatase Sulf-1 | 44 | 1 |
| Cystatin-SA | 9 | 2 |
| 5-AMP-activated
protein kinase subunit γ-3 | 6 | 1 |
| Triosephosphate
isomerase | 5.5 | 5 |
|
Microtubule-associated tumor suppressor
1 | 4.7 | 13 |
| Transferrin
receptor protein 1 | 4.5 | 6 |
| Keratin, type I
cytoskeletal 9 | 4.4 | 17 |
| Putative lipocalin
1-like protein 1 | 4.1 | 1 |
| Malate
dehydrogenase, cytoplasmic | 4 | 5 |
| Ig α-2 chain C
region | 3.2 | 2 |
| Ig heavy chain
V-III region BRO | 3.2 | 6 |
| Protein
S100-A4 | 3.2 | 1 |
| Keratin, type II
cytoskeletal 1 | 3.1 | 36 |
| Pericentrin | 2.8 | 49 |
| Ig heavy chain
V-III region WEA | 2.7 | 2 |
| Complement C1q
subcomponent subunit C | 2.6 | 1 |
|
| B, Decreased
proteins in CA with fold increase |
|
| Protein ID | Fold decrease | Number of compared
peptides |
|
| Aldehyde
dehydrogenase, dimeric NADP-preferring | 2.1 | 6 |
| Immunoglobulin J
chain | 2.4 | 14 |
| Ig γ-3 chain C
region | 2.4 | 12 |
| POTE ankyrin domain
family member F | 2.5 | 6 |
| Protein
S100-A8 | 2.5 | 18 |
| Uncharacterized
protein C20orf151 | 2.9 | 9 |
| Ig γ-4 chain C
region | 3 | 1 |
| WD
repeat-containing protein 60 | 3 | 3 |
| DNA damage-binding
protein 1 | 3.3 | 3 |
| Protein
S100-A9 | 3.3 | 11 |
| GTP-binding protein
Di-Ras2 | 10 | 1 |
Discussion
Data from high-throughput proteomic technologies,
such as SELDI-TOF MS, MALDI-TOF-TOF MS, and microarray platforms,
have recently increased. These techniques allow simultaneous
protein profiling and subsequent identification of proteins and
their subunits (5,37,38). A
huge number of proteome studies have been published for proteome
comparison of cancer patients and controls. Likewise, different
proteomic studies reported significant differences in protein
levels in the body fluids of breast cancer patients and healthy
subjects (38,39). In our study, we concentrated on the
tear proteome for several reasons. First, the sample retrieval is
minimally invasive for the participants and tear fluid is easy to
obtain with a simple Schirmer test. Second, the tear proteome
contains no high-abundant proteins, such as albumin and
immunoglobulins that are found in serum; therefore, it is not
necessary to perform additional depletion steps that may cause
distortion of potentially important proteins. In addition, we find
it very intriguing to explore the tear proteome for potential
biomarkers of breast cancer as it is an uncommon approach.
Some of the differently regulated proteins in our
de novo pooled experiment have been reported to be altered
in the tear fluid of patients with ophthalmic disease. Zhou et
al reported S100A8 and S100A9 are increased in patients with
dry eyes and Grus et al reported an increase in protein
S100A8 (34,40). Both proteins belong to the family of
S100 calcium-binding proteins, whose members seem to be involved in
pro-inflammatory pathways as previously reported by Nacken et
al(35). Some of the proteins
may be of high interest, e.g., Mitochondrial tumor suppressor 1,
MTUS1 and DNA damage binding protein, DDB1. MTUS1 regulates the
cell cycle by acting as a tumor suppressor and DDB1 is involved in
nucleotide excision repair. In addition, many of the differently
regulated proteins are involved in metabolic processes, e.g., TPI
or MDH1 in glycolysis and the citric acid cycle, which are both
increased in the tear fluid of cancer patients. However, higher
levels of autoantibodies against TPI1 have been reported in the
sera of breast cancer patients (36). In our previous studies, we found
several alterations in protein expression in the sera and tear
fluid of breast cancer patients (22,41).
Further analysis of the SELDI-TOF-based tear proteome profiling
identified the protein S100A4 to be increased in the tears of
breast cancer patients (data not shown). This result was confirmed
in this study. The protein S100A4 was also previously found to be
upregulated in patients with dry eye syndrome (40). Noteworthy, we observed several
alterations in the level of proteins involved in immune response,
such as complement factor C1Q1 or fragments of immunoglobulins
(Table II). Also, several
complement factors have been reported to be differentially
regulated in the sera of cancer patients (42,43).
Although, some of the results were controversial and may have
resulted from different storage and handling conditions (44). Thus, members of the complement
system may have additional roles. Markiewski et al reported
tumor growth was promoted by C5a in their experiments with a
cervical cancer mouse model (45,46).
To our knowledge, little is known about protein
expression in the tear fluid of breast cancer patients. Only a very
small number of tear proteome studies concerning proteome changes
during breast cancer or cancer in general have been published.
Further subsequent analyses and validation of our results in a tear
protein study with an independent population and a higher number of
participants will follow that also includes individual profiling.
The findings from this study are intriguing as they may deepen the
understanding of the impact of cancer and several cancer-driven
pathways. Our study demonstrates that different biological
processes are altered not only in prominent and broadly
investigated body fluids such as serum and plasma, but also in
discrete fluids such as tears that are located far away from the
cancer site. As we already mentioned, several proteins have been
reported to be modified in various types of body fluids, such as
nipple aspirate fluid or urine. Our pilot study adds to these
findings and shows again the complexity and multiple impacts of
breast cancer while emerging and developing in the host, affecting
biological processes and signal cascades. Moreover, we propose that
a biomarker panel consisting of different proteins could accurately
discriminate cancer patients from healthy controls. Therefore, it
is important to examine the protein levels in an independent study
population using individual protein profiling to validate our
results. Further de novo approaches and validation of our
results could lead to a better understanding of the pathological
mechanism of breast cancer.
Acknowledgements
This study was partially supported by funding from
the Mainz research program (MAIFOR NR. 122), University Medical
Centre Mainz. Some of the data were developed within the doctoral
thesis of Julia Pieter.
References
|
1
|
Jemal A, Bray F, Center MM, Ferlay J, Ward
E and Forman D: Global cancer statistics. CA Cancer J Clin.
61:69–90. 2011. View Article : Google Scholar
|
|
2
|
Brekelmans CT, Seynaeve C, Bartels CC, et
al: Effectiveness of breast cancer surveillance in BRCA1/2 gene
mutation carriers and women with high familial risk. J Clin Oncol.
19:924–930. 2001.PubMed/NCBI
|
|
3
|
Harris L, Fritsche H, Mennel R, et al:
American Society of Clinical Oncology 2007 update of
recommendations for the use of tumor markers in breast cancer. J
Clin Oncol. 25:5287–5312. 2007. View Article : Google Scholar : PubMed/NCBI
|
|
4
|
Tyers M and Mann M: From genomics to
proteomics. Nature. 422:193–197. 2003. View Article : Google Scholar
|
|
5
|
Elrick MM, Walgren JL, Mitchell MD and
Thompson DC: Proteomics: recent applications and new technologies.
Basic Clin Pharmacol Toxicol. 98:432–441. 2006. View Article : Google Scholar : PubMed/NCBI
|
|
6
|
Banks RE, Dunn MJ, Hochstrasser DF, et al:
Proteomics: new perspectives, new biomedical opportunities. Lancet.
356:1749–1756. 2000. View Article : Google Scholar : PubMed/NCBI
|
|
7
|
Li J, Zhang Z, Rosenzweig J, Wang YY and
Chan DW: Proteomics and bioinformatics approaches for
identification of serum biomarkers to detect breast cancer. Clin
Chem. 48:1296–1304. 2002.PubMed/NCBI
|
|
8
|
Mathelin C, Cromer A, Wendling C,
Tomasetto C and Rio MC: Serum biomarkers for detection of breast
cancers: A prospective study. Breast Cancer Res Treat. 96:83–90.
2006. View Article : Google Scholar : PubMed/NCBI
|
|
9
|
Baskin Y and Yigitbasi T: Clinical
proteomics of breast cancer. Curr Genomics. 11:528–536. 2010.
View Article : Google Scholar : PubMed/NCBI
|
|
10
|
Huijbers A, Velstra B, Dekker TJ, et al:
Proteomic serum biomarkers and their potential application in
cancer screening programs. Int J Mol Sci. 11:4175–4193. 2010.
View Article : Google Scholar : PubMed/NCBI
|
|
11
|
Paweletz CP, Trock B, Pennanen M, et al:
Proteomic patterns of nipple aspirate fluids obtained by SELDI-TOF:
potential for new biomarkers to aid in the diagnosis of breast
cancer. Dis Markers. 17:301–307. 2001. View Article : Google Scholar : PubMed/NCBI
|
|
12
|
Li J, Zhao J, Yu X, et al: Identification
of biomarkers for breast cancer in nipple aspiration and ductal
lavage fluid. Clin Cancer Res. 11:8312–8320. 2005. View Article : Google Scholar : PubMed/NCBI
|
|
13
|
Pawlik TM, Fritsche H, Coombes KR, et al:
Significant differences in nipple aspirate fluid protein expression
between healthy women and those with breast cancer demonstrated by
time-of-flight mass spectrometry. Breast Cancer Res Treat.
89:149–157. 2005. View Article : Google Scholar
|
|
14
|
de Noo ME, Deelder A, van der Werff M,
Ozalp A, Mertens B and Tollenaar R: MALDI-TOF serum protein
profiling for the detection of breast cancer. Onkologie.
29:501–506. 2006.
|
|
15
|
Villanueva J, Shaffer DR, Philip J, et al:
Differential exoprotease activities confer tumor-specific serum
peptidome patterns. J Clin Invest. 116:271–284. 2006. View Article : Google Scholar : PubMed/NCBI
|
|
16
|
Engwegen JY, Gast MC, Schellens JH and
Beijnen JH: Clinical proteomics: searching for better tumour
markers with SELDI-TOF mass spectrometry. Trends Pharmacol Sci.
27:251–259. 2006. View Article : Google Scholar : PubMed/NCBI
|
|
17
|
Lebrecht A, Boehm D, Schmidt M, Koelbl H
and Grus FH: Surface-enhanced laser desorption/ionisation
time-of-flight mass spectrometry to detect breast cancer markers in
tears and serum. Cancer Genomics Proteomics. 6:75–83.
2009.PubMed/NCBI
|
|
18
|
Hudson ME, Pozdnyakova I, Haines K, Mor G
and Snyder M: Identification of differentially expressed proteins
in ovarian cancer using high-density protein microarrays. Proc Natl
Acad Sci USA. 104:17494–17499. 2007. View Article : Google Scholar : PubMed/NCBI
|
|
19
|
Hodgkinson VC, ElFadl D, Drew PJ, Lind MJ
and Cawkwell L: Repeatedly identified differentially expressed
proteins (RIDEPs) from antibody microarray proteomic analysis. J
Proteomics. 74:698–703. 2011. View Article : Google Scholar
|
|
20
|
Shi W, Meng Z, Chen Z, Luo J and Liu L:
Proteome analysis of human pancreatic cancer cell lines with highly
liver metastatic potential by antibody microarray. Mol Cell
Biochem. 347:117–125. 2011. View Article : Google Scholar : PubMed/NCBI
|
|
21
|
Yang L, Guo S, Li Y, Zhou S and Tao S:
Protein microarrays for systems biology. Acta Biochim Biophys Sin
(Shanghai). 43:161–171. 2011. View Article : Google Scholar
|
|
22
|
Bohm D, Keller K, Boehm N, et al: Antibody
microarray analysis of the serum proteome in primary breast cancer
patients. Cancer Biol Ther. 12:772–779. 2011. View Article : Google Scholar : PubMed/NCBI
|
|
23
|
Bertucci F, Birnbaum D and Goncalves A:
Proteomics of breast cancer: principles and potential clinical
applications. Mol Cell Proteomics. 5:1772–1786. 2006. View Article : Google Scholar : PubMed/NCBI
|
|
24
|
Diamandis EP: Analysis of serum proteomic
patterns for early cancer diagnosis: drawing attention to potential
problems. J Natl Cancer Inst. 96:353–356. 2004. View Article : Google Scholar : PubMed/NCBI
|
|
25
|
Downes MR, Byrne JC, Dunn MJ, Fitzpatrick
JM, Watson RW and Pennington SR: Application of proteomic
strategies to the identification of urinary biomarkers for prostate
cancer: a review. Biomarkers. 11:406–416. 2006. View Article : Google Scholar : PubMed/NCBI
|
|
26
|
Radpour R, Barekati Z, Kohler C, Holzgreve
W and Zhong XY: New trends in molecular biomarker discovery for
breast cancer. Genet Test Mol Biomarkers. 13:565–571. 2009.
View Article : Google Scholar : PubMed/NCBI
|
|
27
|
Lebrecht A, Boehm D, Schmidt M, Koelbl H,
Schwirz RL and Grus FH: Diagnosis of breast cancer by tear
proteomic pattern. Cancer Genomics Proteomics. 6:177–182.
2009.PubMed/NCBI
|
|
28
|
de Freitas Campos C, Cole N, Van Dyk D, et
al: Proteomic analysis of dog tears for potential cancer markers.
Res Vet Sci. 85:349–352. 2008.PubMed/NCBI
|
|
29
|
Shevchenko A, Loboda A, Ens W, Schraven B,
Standing KG and Shevchenko A: Archived polyacrylamide gels as a
resource for proteome characterization by mass spectrometry.
Electrophoresis. 22:1194–1203. 2001.PubMed/NCBI
|
|
30
|
Perkins DN, Pappin DJ, Creasy DM and
Cottrell JS: Probability-based protein identification by searching
sequence databases using mass spectrometry data. Electrophoresis.
20:3551–3567. 1999. View Article : Google Scholar : PubMed/NCBI
|
|
31
|
UniProt Consortium. Ongoing and future
developments at the Universal Protein Resource. Nucleic Acids Res.
39:D214–D219. 2011.PubMed/NCBI
|
|
32
|
Szklarczyk D, Franceschini A, Kuhn M, et
al: The STRING database in 2011: functional interaction networks of
proteins, globally integrated and scored. Nucleic Acids Res.
39:D561–D568. 2011. View Article : Google Scholar : PubMed/NCBI
|
|
33
|
Cline MS, Smoot M, Cerami E, et al:
Integration of biological networks and gene expression data using
Cytoscape. Nat Protoc. 2:2366–2382. 2007. View Article : Google Scholar : PubMed/NCBI
|
|
34
|
Grus FH, Podust VN, Bruns K, et al:
SELDI-TOF-MS ProteinChip array profiling of tears from patients
with dry eye. Invest Ophthalmol Vis Sci. 46:863–876. 2005.
View Article : Google Scholar : PubMed/NCBI
|
|
35
|
Nacken W, Roth J, Sorg C and Kerkhoff C:
S100A9/S100A8: Myeloid representatives of the S100 protein family
as prominent players in innate immunity. Microsc Res Tech.
60:569–580. 2003. View Article : Google Scholar : PubMed/NCBI
|
|
36
|
Tamesa MS, Kuramitsu Y, Fujimoto M, et al:
Detection of autoantibodies against cyclophilin A and
triosephosphate isomerase in sera from breast cancer patients by
proteomic analysis. Electrophoresis. 30:2168–2181. 2009. View Article : Google Scholar : PubMed/NCBI
|
|
37
|
El Yazidi-Belkoura I, Adriaenssens E,
Vercoutter-Edouart AS, Lemoine J, Nurcombe V and Hondermarck H:
Proteomics of breast cancer: outcomes and prospects. Technol Cancer
Res Treat. 1:287–296. 2002.PubMed/NCBI
|
|
38
|
Gast MC, Schellens JH and Beijnen JH:
Clinical proteomics in breast cancer: a review. Breast Cancer Res
Treat. 116:17–29. 2009. View Article : Google Scholar : PubMed/NCBI
|
|
39
|
Shin BK, Wang H and Hanash S: Proteomics
approaches to uncover the repertoire of circulating biomarkers for
breast cancer. J Mammary Gland Biol Neoplasia. 7:407–413. 2002.
View Article : Google Scholar : PubMed/NCBI
|
|
40
|
Zhou P, Lowery M, JAD and Kuiken T:
Towards improved myoelectric prosthesis control: high density
surface EMG recording after targeted muscle reinnervation. Conf
Proc IEEE Eng Med Biol Soc. 4:4064–4067. 2005.PubMed/NCBI
|
|
41
|
Böhm D, Keller K, Wehrwein N, et al: Serum
proteome profiling of primary breast cancer indicates a specific
biomarker profile. Oncol Rep. 26:1051–1056. 2011.PubMed/NCBI
|
|
42
|
Oner F, Savas I and Numanoglu N:
Immunoglobulins and complement components in patients with lung
cancer. Tuberk Toraks. 52:19–23. 2004.PubMed/NCBI
|
|
43
|
Liu W, Liu B, Xin L, et al: Down-regulated
expression of complement factor I: a potential suppressive protein
for gastric cancer identified by serum proteome analysis. Clin Chim
Acta. 377:119–126. 2007. View Article : Google Scholar : PubMed/NCBI
|
|
44
|
Gast MC, van Gils CH, Wessels LF, et al:
Influence of sample storage duration on serum protein profiles
assessed by surface-enhanced laser desorption/ionisation
time-of-flight mass spectrometry (SELDI-TOF MS). Clin Chem Lab Med.
47:694–705. 2009.
|
|
45
|
Markiewski MM, DeAngelis RA, Benencia F,
et al: Modulation of the antitumor immune response by complement.
Nat Immunol. 9:1225–1235. 2008. View
Article : Google Scholar : PubMed/NCBI
|
|
46
|
Markiewski MM and Lambris JD: Is
complement good or bad for cancer patients? A new perspective on an
old dilemma. Trends Immunol. 30:286–292. 2009. View Article : Google Scholar : PubMed/NCBI
|