Introduction
Colorectal cancer is the second most commonly
diagnosed cancer in females and the third in males (1). There are several causes for the onset
of colorectal cancers, which are currently more effectively
diagnosed and classified according to several criteria.
Consistently, different treatments and prognostic measures are
currently used to successfully or attempt to cure this type of
cancer (2). Colorectal cancer
originates from the epithelial lining, most often as a consequence
of mutations in the Wnt signaling pathway, in tumor suppressors, in
apoptotic genes and oncogenes (3).
Signs and symptoms of colorectal cancer, as well as its treatment,
greatly depend on its location and ability to metastasize (4). Recently, research has shifted towards
finding targeted therapies for cancer. The molecular basis of cell
survival, cell cycle and cell death is at present a ‘hot’ topic
(5).
One of the most important survival pathways is the
phosphatidylinositol 3-kinase (PI3-K) signaling pathway. When
activated by countless stimuli, this pathway regulates essential
cellular functions, including apoptosis, cell cycle progression,
gene transcription, growth and proliferation (5,6). One
main downstream effector of PI3K is Akt. It controls cell survival
by phosphorylating several substrates that are in turn involved in
apoptotic and survival pathways. The pro-apoptotic protein Bad, of
the Bcl-2 family, is a main target of Akt. Thus, following Akt
activation, it phosphorylates Bad. This releases the associated
apoptosis inhibitory protein and blocks the apoptotic pathway.
Among the most important members of the tumor-
suppressor proteins, p53, mainly a transcription factor, has a
significant role in the regulation of cellular responses to a range
of stress signals. Thus, the end result favors apoptosis, cell
cycle arrest or senescence (7). In
response to DNA damage, p53 enhances the transcription of genes
that are involved in repair mechanisms, angiogenesis, apoptosis and
cellular growth. It can also have non-transcriptional activities
that promote cell survival (8). In
turn, if DNA repair is defective, tumor suppressors are
inactivated, and thus, might lead to cancer such as hereditary and
sporadic colon cancers (9).
Numerous physiological events, such as
embryogenesis, tissue regeneration, inflammation and wound healing,
greatly depend on cellular motility. Yet, cellular motility is also
crucial for cancer cell invasion and metastasis. It occurs usually
as a response to growth factors or chemoattractants found in the
extracellular matrix (ECM) around the cell. This process is known
as chemotaxis (10). Due to its
major role, cell motility has been a highly researched phenomenon.
Scientists have been directing their studies towards understanding
its molecular basis, as this might lead to novel targeted
therapeutic treatments inhibiting tumor growth, development and
metastasis (11).
Cell motility occurs in an amoeboid-like manner,
after a signal is detected. The family of Rho GTPases, including
all of its members, plays a main role in regulating the cycle of
cell motility, through the reorganization of the actin cytoskeleton
(12). Cell motility is an
intricate multistep process, integrating numerous regulatory and
signaling pathways. Any slight deviation or malfunction at any step
of the pathway may radically affect normal functions, resulting in
transformation and carcinogenesis (10). Acquiring a motile phenotype is an
important characteristic of cancerous cells. It is a critical step
towards gaining metastatic competence. Thus, targeting cell
motility processes will help in introducing novel therapeutic
agents against metastatic and invasive tumors (13). Cell invasion is referred to as the
shift from primary benign tumors to malignant-acquired phenotypes.
This involves the coordination and organization of both
extracellular and intracellular communications (14).
A series of events must occur accordingly for the
epithelial-mesenchymal transition (EMT) of cancer to progress.
Epithelial markers must be downregulated, while mesenchymal
proteins must be upregulated. Morphologically, this is portrayed by
increased motility, loss of cell-cell adhesion, pseudopodium
formation and elongated polarized shapes (15,16).
EMT favors the progression and stability of metastasized tumors, by
overcoming safeguard mechanisms and attenuating the immune system.
This is accomplished by overcoming apoptotic pathways and premature
senescence (17). In addition, EMT
functions in acquiring resistance against radiotherapy and
chemotherapy. However, in order for secondary site tumors to
stabilize and colonize, they must revert back to their epithelial
nature, a process known as mesenchymal-epithelial transition (MET)
(16,17).
The family of Rho GTPases consists of small
GTP-binding proteins, ranging between 20 and 40 kDa. They are key
members in cancer cell motility and invasion. They play important
roles in signal transduction, cytoskeleton re-organization and
cellular polarity (18). The
gravity of their role lies in the fact that a simple biochemical
idea is behind these biological complexities. By switching on only
one single GTPase, a number of pathways will be activated
co-ordinately. Thus, the harmonization of spatial and temporal
switching of several GTPases is what makes this family prominent in
eukaryotic cell biology (19). The
three most considered Rho GTPases are Rho, Rac and Cdc42. They have
distinct functions when compared to the other members of their
family (20,21).
The tight control over the activity of Rho GTPases
is based on their subcellular localization and nucleotide binding
(22). Thus, they switch between an
inactive form when bound to GDP and localized in the cytoplasm, and
an active form when bound to GTP and recruited to the plasma
membrane (21). The regulation of a
Rho protein and its switch from the inactive to the active form is
conducted by guanine nucleotide exchange factors (GEFs),
GTPase-activating proteins (GAPs) and guanine nucleotide
dissociation inhibitors (GDIs). GEFs activate Rho GTPases (23,24).
GAPs negatively regulate Rho GTPases, rendering them inactive
(25). GDIs inhibit GEFs and GAPs.
They prevent the GDP dissociation of inactive Rho GTPases and the
interaction of active forms with GAPs. Continuously, they aid in
the cycling of Rho GTPases between the cell membrane and the
cytoplasm (23,26,27).
GEFs have a PH domain with high affinity to
phosphoinositides, such as PI(4,5)P2 found on the plasma membrane
(28). PI(4,5)P2 binds to GEFs,
favoring the interaction between PH and DH domains of GEFs. It is
then phosphorylated by PI3K forming PI(3,4,5)P3, inducing its
binding to the PH domain. This leads to the dissociation of the DH
catalytic domain, which in turn activates GEFs. Consecutively, GEFs
bind and activate Rho GTPases (24).
Several studies have shown that PI3K works upstream
of Rho GTPases. Insulin, EGF, PDGF and LPA are external signals
triggering the activation of Rho GTPases through the PI3K pathway.
This was shown by treating fibroblasts with wortmannin, which is a
PI3K inhibitor. Rho and Rac, members of the Rho GTPase family, were
inhibited, suggesting that in response to growth factors, GTPases
are downstream of PI3K (29).
Research has shown that Rho GTPases and PI3K are highly involved in
cancer cell motility, by stimulating lamellipodium formation. This
was further confirmed by showing that Rac and Cdc42 are upstream of
PI3K (30).
Major downstream effectors of the PI3K signaling
pathway are small GTPases, such as Rho, Rac and Cdc42. These are
important regulators of the cell cytoskeleton, and promote
actomyosin assembly, stress fiber formation, actin nucleation and
polymerization (19,31,32).
Primary research has shown that each of the different proteins in
the family of Rho GTPases has a well-defined unique role in actin
regulation and adhesion dynamics during cell migration.
Nevertheless, recent research has proved the presence of a
prominent crosstalk among all the signaling pathways of Rho, Rac
and Cdc42 (33). For instance, Rho
and Rac have antagonistic relationships, where the activation of
one leads to the inactivation of the other. This is mainly carried
out through stimulation of either a GAP or a GEF (34,35).
Another example is the crosstalk between RhoA and Rac and Cdc42 at
the rear end of the cell, which aids in the regulation of the actin
cytoskeleton (36).
Genetic screening studies have found that RhoA and
RhoC, two members of the Rho GTPase family, are hyperactive and
overexpressed in colorectal cancer cells, as well as many other
types of tumors (37). Furthermore,
the inactivity or the expression of the negatively dominant form of
Rho was found to lead to the inhibition of motility (38). Important proteins, GAPs and GEFs,
have major roles in the dominant inhibition or activation of Rho
GTPases. This in turn affects motility, invasion and metastasis of
colorectal cancer cells (39,40).
Furthermore, it is not necessary for the dysfunction to occur at
the level of Rho GTPases only. Any inhibition in the downstream
effectors in these pathways will lead to malfunctions in the
processes.
StarD13, or START-GAP2, is also known as the
DLC2 gene. It was first identified by Ching et
al(41) to be downregulated in
hepatocellular carcinoma. It is located on position
13q12.3(42). StarD13, or
steriodogenic acute regulatory protein-related lipid transfer
domain-containing protein 13, has a C-terminal START domain and an
N-terminal SAM domain. In between, it holds a GAP domain for Rho
GTPases. It has four known isoforms: α, β, γ and δ (41,43,44).
StarD13 is a member of the DLC (deleted in liver
cancer) family, which is known to be a family of tumor suppressors.
It has 64% homology with DLC-1 (44,45).
Research conducted on DLC-1 has shown that it is underexpressed in
many types of cancer, such as stomach, uterus, breast, colon,
kidney, prostate and lung (46).
DLC-2 was also found to be overexpressed in cells exhibiting low
rates of growth and proliferation (41). All the above suggest a prominent
role of StarD13 as a tumor suppressor (47).
Studies have demonstrated that StarD13 inhibits
Cdc42 and RhoA, which in turn inhibits the formation of actin
stress fibers (41). Furthermore,
StarD13 is targeted towards the mitochondria through its START
domain. This demonstrates its potential role in regulating the
permeability of the mitochondrial membrane, activating pathways of
apoptosis (48). Another domain
that targets StarD13 to focal adhesions is the N-terminal FAT
domain, which interacts with a constituent of focal adhesions named
tensin 2 (49). Moreover, research
has confirmed the RhoGAP activity of StarD13 on RhoA, i.e. RhoA is
inhibited by StarD13. This is through the inhibition of actin
stress fiber assembly, mediated by RhoA. Successively, and through
this Rho-mediated pathway, cell transformation is inhibited, as
well as the modulation of cell attachment, cell migration and cell
differentiation (50–52).
The aim of the present study was to investigate the
role of StarD13 in the proliferation and motility of colorectal
cancer cell lines. First, we studied its effect on cellular
proliferation and viability by knocking down and overexpressing
StarD13. Then, we examined its Rho GAP activity as well as its
possible interaction with Rac1 and Cdc42, and their effect on the
migration, invasion and adhesion of colon cancer cells.
Materials and methods
Cell culture
Human colorectal cancer cell lines (Caco-2 and
HT-29) obtained from ATCC (Manassas, VA, USA) were cultured in
Dulbecco’s modified Eagle’s medium (DMEM) (Sigma-Aldrich)
supplemented with 10% fetal bovine serum (FBS; Sigma-Aldrich) and
100 U or 1% (v/v) penicillin/streptomycin (Sigma-Aldrich) in a
humidified chamber at 37°C with 5% CO2. Cells were
cultured in T-75 flasks (Corning, Corning, NY, USA).
Antibodies and reagents
Goat polyclonal anti-StarD13 antibody was obtained
from Santa Cruz Biotechnology (Santa Cruz, CA, USA). Rabbit
monoclonal anti-RhoA, mouse monoclonal anti-Rac1, mouse monoclonal
anti-Cdc42 and mouse monoclonal anti-vinculin antibodies were
purchased from Upstate Biotechnology Inc. (Lake Placid, NY, USA).
Anti-goat, anti-rabbit and anti-mouse HRP-conjugated secondary
antibodies were obtained from Promega (Madison, WI, USA).
Fluorescent secondary antibodies (Alexa Fluor 488) were obtained
from Invitrogen. To visualize the actin cytoskeleton, cells were
stained with Rhodamine phalloidin (Invitrogen).
Cell transfection with siRNA
Goat FlexiTube siRNA (5 nmol) for StarD13, RhoA,
Rac1 and Cdc42 were obtained from Qiagen. Consecutively, their
target sequences were as follows: Hs_StarD13_3,
5′-CCCGCAATACGCTCAGTTATA-3′ and Hs_StarD13_8,
5′-ATGGCTACATCCCTACTAATA-3′; Hs_RhoA_6,
5′-TTCGGAATGATGAGCACACAA-3′; Hs_Rac1_6, 5′-ATGCATTTCCTGGAGAATATA-3′
and Hs_Cdc42_7, 5′-CATCAGATTTGAAATATTTAA-3′.
Cells were transfected with the siRNA at a final
concentration of 10 nM using HiPerFect (Qiagen) as described by the
manufacturer. Control cells were transfected with siRNA sequences
targeting Luciferase GL2 (Qiagen). After 72 h, protein levels in
the total cell lysates were pulled down and/or analyzed by western
blotting using the appropriate antibodies. The effect of the
corresponding knockdown was also investigated.
Cell transfection with vectors
Cells were transfected with 5 μg GFP-StarD13, or
empty control vectors using Lipofectamine® LTX and Plus™
reagent (Invitrogen), as described by the manufacturer. Cells were
incubated with the transfection complexes for 5 h then refed with
DMEM including 30% FBS. The experiments were carried out 24 h after
transfection.
The GFP-StarD13 construct was a generous gift from
Dr Hitoshi Yagisawa from the University of Hyogo, Japan.
The constructs were transformed into One
Shot® TOP10 chemically competent E. coli
(Invitrogen), after which they were grown on selective media
containing the appropriate antibiotic. The vectors were then
extracted using the Plasmid Maxiprep plasmid extraction kit
(Qiagen).
Western blotting
Cell lysates were prepared by scraping the cells in
a sample buffer consisting of 4% SDS, 10% β-mercaptoethanol, 20%
glycerol, 0.004% bromophenol blue, and 0.125 M Tris-HCl at a pH
6.8. The resulting lysates were boiled for 5 min. Protein samples
were separated by SDS-PAGE on 8% (for StarD13) or 15% (for RhoA and
Rac) gels and transferred to PVDF membranes overnight at 30 V. The
membranes were then blocked with 5% non-fat dry milk in PBS
containing 0.1% Tween-20 for 1 h at room temperature and incubated
with the primary antibody at a concentration of 1:1,000 for 2 h at
room temperature. After incubation with the primary antibody, the
membranes were washed and incubated with the secondary antibody at
a concentration of 1:2,000 for 1 h at room temperature. The
membranes were then washed, and the bands were visualized by
treating the membranes with western blotting enhanced
chemiluminescent ECL reagent (GE Healthcare). The results were
obtained on X-ray film (Agfa HealthCare). The levels of protein
expression were compared by densitometry using ImageJ software.
RT-PCR
Cells were grown in 6-well plates at a density of
1×10⁶ cells/ml and were transfected by either control or
StarD13 siRNA for 72 h. Total RNA was extracted using the RNeasy
extraction kit (Qiagen) according to the manufacturer’s
instructions.
Reverse transcriptase-polymerase chain reaction
(RT-PCR) was used to amplify RNA of StarD13. RNA (2 μg) was
converted to cDNA using the OneStep RT-PCR kit (Qiagen) as
described by the manufacturer. Briefly, gene-specific primers
designed to detect cDNA were obtained from TIB MolBiol GmbH using
the following sequences: forward, 5′-AGCCCCTGCCTCAAAGTATT-3′ and
reverse: 5′-AGC CCCTGCCTCAAAGTATT-3′.
β-actin was used as a control with primers obtained
from Sigma-Aldrich having the following sequences: forward,
5′-ATGAAGATCCTGACCGAGCGT-3′ and reverse, 5′-AAC
GCAGCTCAGTAACAGTCCG-3′.
Primers were used at a final concentration of 0.6
μM. Primers were added to 5X Qiagen OneStep RT-PCR buffer providing
a final concentration of 2.5 mM MgCl2 in the reaction
mix. A final concentration of 400 μM of each dNTP was added along
with 2.0 μl/reaction of enzyme mix. Final Master Mix volume was
adjusted to 50 μl using RNase-free water.
Thermal cycler conditions, for both reverse
transcription and PCR, were programmed as follows: reverse
transcription at 50°C for 30 min, initial PCR activation step at
95°C for 15 min, followed by 25 cycles of denaturation at 94°C for
1 min, annealing for StarD13 at 50°C, for actin at 50°C, for TGF-α
at 48°C, and for TGF-β at 50°C for 1 min and extension at 72°C for
1 min followed by a final extension step at 72°C for 10 min.
PCR products (10 μl) were run on 1% agarose gel
stained with ethidium bromide at 100 V for 30 min. The resulting
bands were visualized under UV light and photographed. β-actin was
used as a loading control.
Trypan blue exclusion method
Cells were grown in 24-well plates (growth area, 2
cm2) at a density of 2×10⁶ cells/ml.
Depending on the experiment, cells were transfected with either
StarD13 siRNA or GFP-StarD13 construct. Following the treatment
period, the supernatant from each well was collected, cells were
washed with PBS, and the PBS washes were added to the supernatant
of each well. Cells were then trypsinized and collected separately
from the well contents and PBS. Each collection tube (20 μl) was
mixed with 20 μl of trypan blue. This mixture (10 μl) was placed in
a counting chamber under a microscope, and the number of living and
dead cells was recorded accordingly. For each well, two countings
were carried out separately, PBS washes/well supernatant and
trypsinized cells. Under the microscope, dead cells appear blue,
since they are permeable to trypan blue, while viable cells exclude
the stain thus appearing bright. The percentage of dead cells was
reported.
Cell proliferation reagent (WST-1)
Cells were seeded in 96-well plates (growth area,
0.6 cm2) at a concentration of 1×10⁶
cells/ml. Depending on the experiment, cells were transfected with
either StarD13 siRNA or GFP-StarD13 construct with the relevant
controls. Following the treatment period, 10 μl of cell
proliferation reagent (WST-1; Roche, Mannheim, Germany) was added
to each well. The plates were incubated in a humidified incubator
(37°C) in 95% air and 5% CO2 for 2 h. WST-1 is a
tetrazolium salt that on contact with metabolically active cells is
cleaved to produce formazan dye by mitochondrial dehydrogenases.
Quantitation of the formazan was carried out colorimetrically at
450 nm. The absorbance of each blank well was subtracted from the
corresponding sample well. The results were normalized to the
corresponding controls, and the percentage of cell proliferation
was reported.
Cell Proliferation Kit I (MTT)
Cells were cultured in 96-well flat bottom
microplates (100 μl/well) in a humidified incubator for 72 h at
37°C following treatment. The MTT labelling reagent (10 μl) was
added to each well and then incubated for 4 h. Afterwards, 100 μl
of the solubilization solution was added to each well, and the
plate was incubated overnight. MTT is a tetrazolium salt that forms
formazan when in contact with metabolically active cells.
Quantitation of the formazan was carried out colorimetrically,
using ELISA at 595 nm. The absorbance of each blank well was
subtracted from the corresponding sample well. The results were
normalized to the corresponding controls, and the percentage of
cell proliferation was reported.
Immunostaining
Cells were plated on coverslips and the appropriate
treatment was applied. They were then fixed with 4%
paraformaldehyde for 10 min and permeabilized with 0.5% Triton
X-100 for 10 min. To decrease background fluorescence, cells were
rinsed with 0.1 M glycine then incubated with 0.1 M glycine for 10
min. For blocking, cells were incubated 4 times with 1% BSA and 1%
FBS in PBS for 5 min. Samples were stained with the primary
antibodies for 2 h and with fluorophore-conjugated secondary
antibodies for 2 h. Fluorescent images were captured using a ×60
objective on a fluorescence microscope.
Pull down assay
Cells were lysed and incubated with GST-CRIB or
GST-RBD and the pull-down assay was performed using the
RhoA/Rac1/Cdc42 Activation Assay Combo kit (Cell BioLabs) following
the manufacturer’s instructions. Lysates were incubated with
GST-RBD (for RhoA) or GST-PAK (for Rac1/Cdc42) for 1 h at 4°C.
GTP-RhoA, GTP-Rac1 or GTP-Cdc42 was detected by western blotting
using the anti-RhoA, anti-Rac1 or anti-Cdc42 antibodies provided in
the kit. Total proteins were collected prior to the incubation with
GST beads and used as a loading control.
Wound healing assay
Cells were grown to confluence on culture plates and
a wound was made in the monolayer with a sterile pipette tip. Cells
were then washed twice with PBS to remove debris and new medium was
added. Phase-contrast images of the wounded area were captured at 0
and 24 h after wounding. Wound widths were measured at 11 different
points for each wound, and the average rate of wound closure was
calculated (in μm/h).
Adhesion assay
Ninety-six-well plates were coated with collagen
using collagen solution, type I from rat tail (Sigma) overnight at
37°C then washed with washing buffer (0.1% BSA in DMEM). The plates
were then blocked with 0.5% BSA in DMEM at 37°C in a CO2
incubator for 1 h. Plates were then washed and put on ice.
Meanwhile, the cells were trypsinized and counted to
4×10⁵ cell/ml. Cells (50 μl) were added to each well and
incubated at 37°C in a 5% CO2 incubator for 30 min. The
plates were shaken and washed 3 times. Cells were then fixed with
4% paraformaldehyde at room temperature for 10 min, washed and
stained with crystal violet (5 mg/ml in 2% ethanol) for 10 min.
After staining, plates were washed extensively with water and left
to dry completely. Crystal violet was solubilized by incubating the
cells with 2% SDS for 30 min. The absorption of the plates was read
at 550 nm using ELISA.
Invasion assay
Cells were transfected with either control or
StarD13 siRNAs, and the invasion assay was performed 48 h following
the treatment period using the collagen-based invasion assay
(Millipore) according to the manufacturer’s instructions. Briefly,
24 h prior to the assay, cells were starved with serum-free medium.
Cells were harvested, centrifuged and then resuspended in quenching
medium (without serum). Cells were then brought to a concentration
of 1×10⁶ cells/ml. In the meantime, inserts were
prewarmed with 300 μl of serum-free medium for 30 min at room
temperature. After rehydration, 250 μl of medium was removed from
the inserts, and 250 μl of cell suspension was added. Inserts were
then placed in a 24-well plate, and 500 μl of complete medium (with
10% serum) was added to the lower wells. Plates were incubated for
24 h at 37°C in a CO2 incubator. Following the
incubation period, inserts were stained for 20 min at room
temperature with 400 μl of cell stain provided with the kit. The
stain was then extracted with extraction buffer (also provided).
The extracted stain (100 μl) was then transferred to a 96-well
plate suitable for colorimetric measurement using a plate reader.
Optical density was then measured at 560 nm.
Statistical analysis
All the results reported represent average values
from three independent experiments. All error estimates are
expressed as ± SEM. The P-values were calculated by t-tests or
Chi-square tests depending on the experiment using the VassarStats:
Website for Statistical Computation (http://vassarstats.net/). All results were considered
to be statistically significant at P-values ≤0.05.
Results
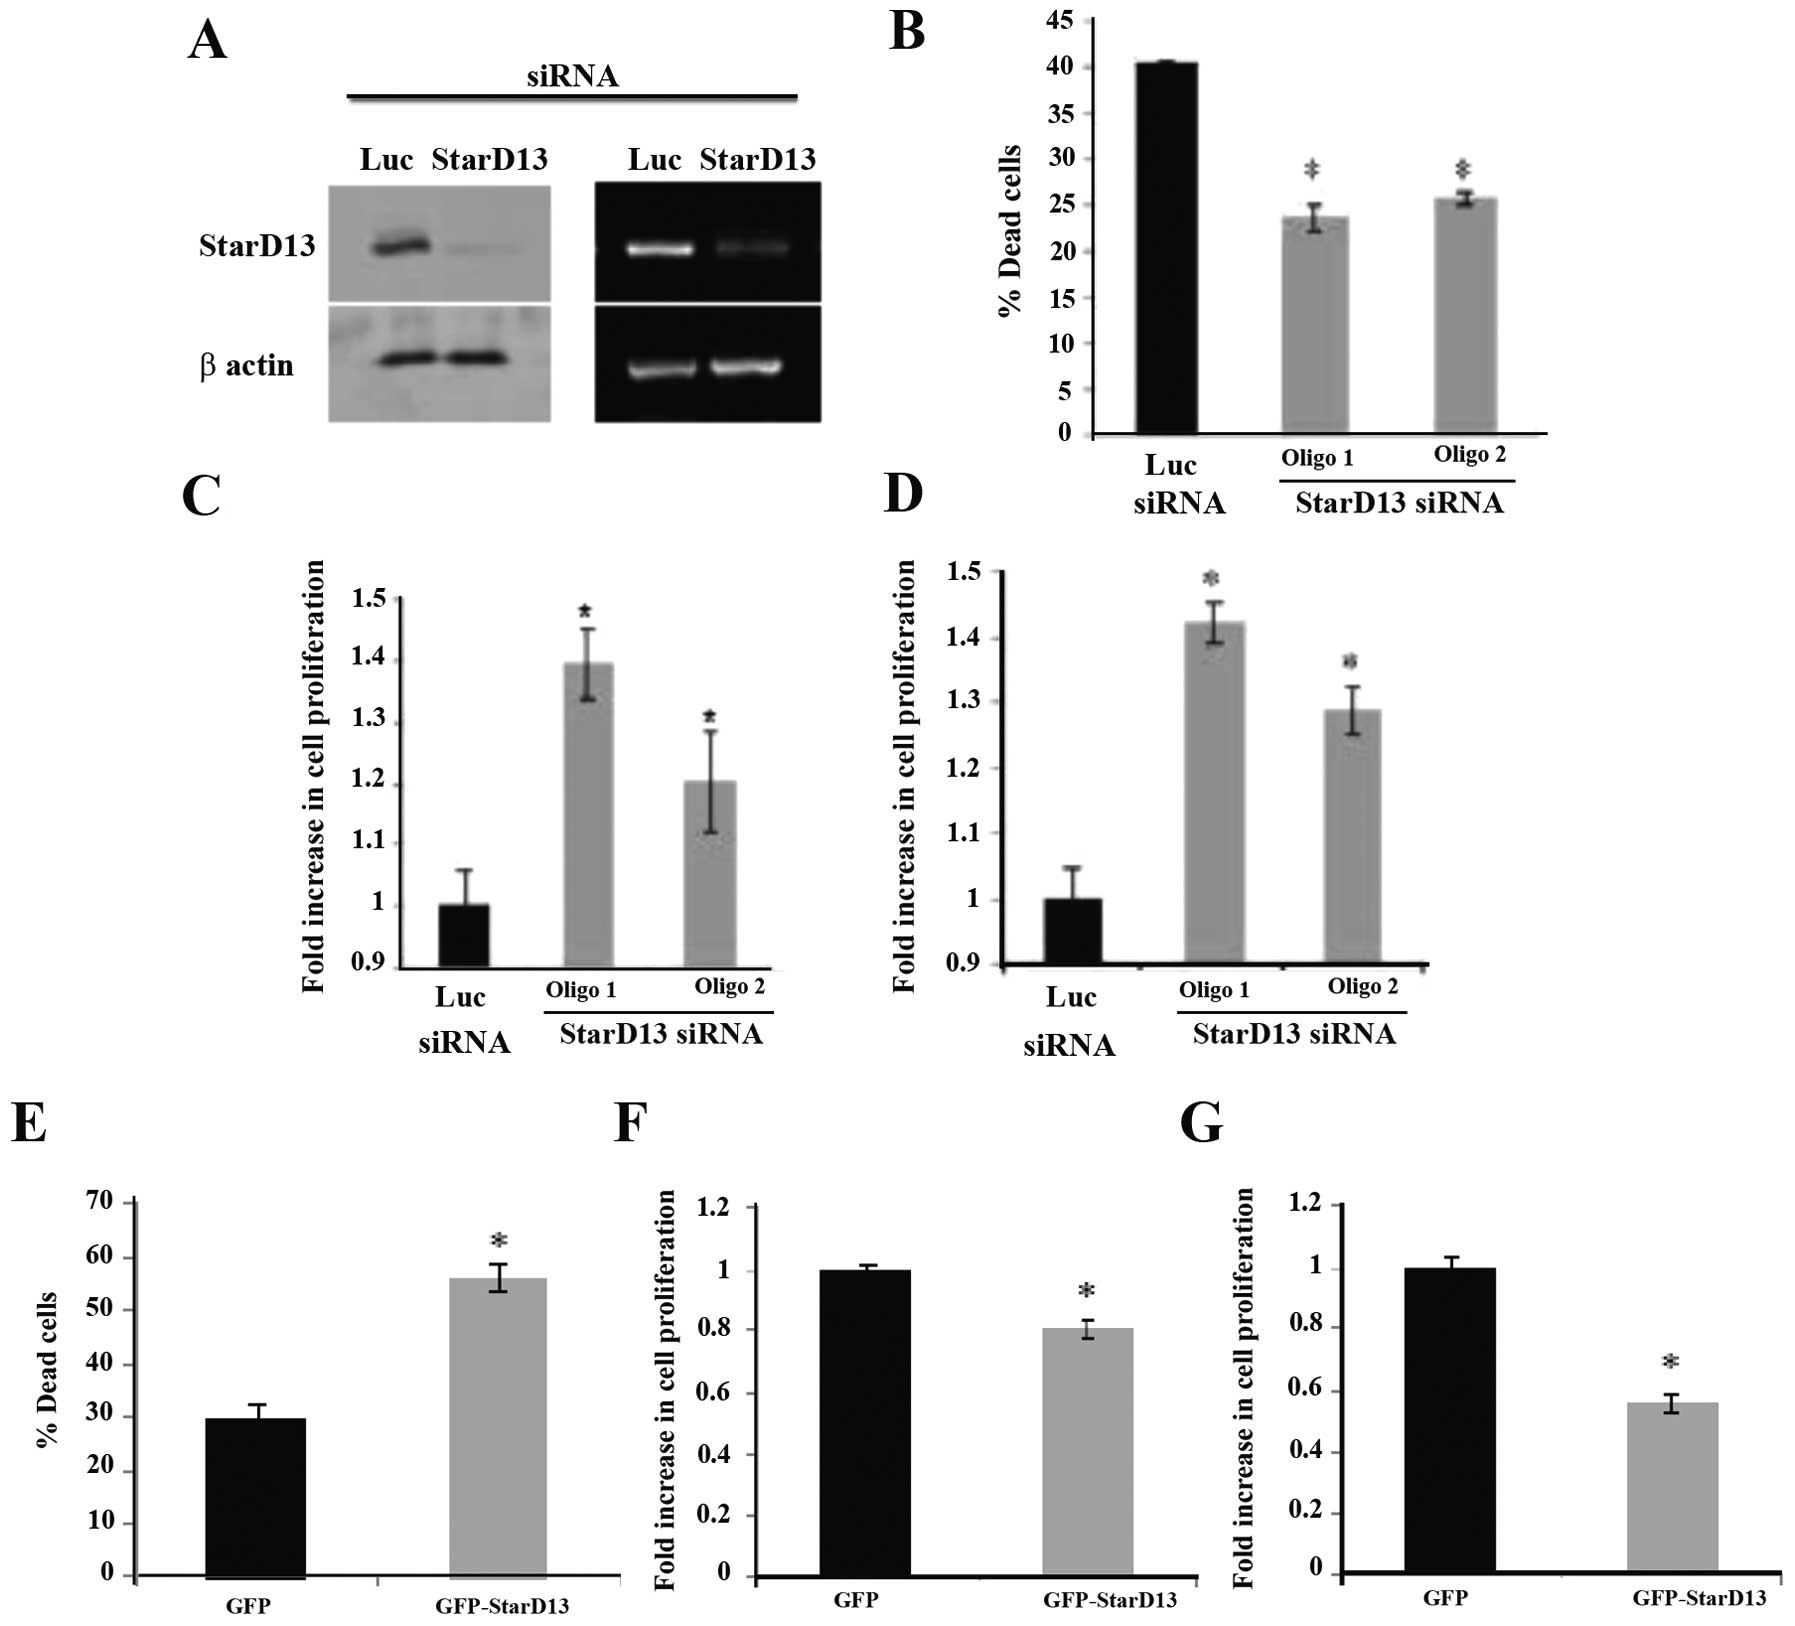
StarD13 decreases cell viability
We initially investigated the effect of StarD13 on
colorectal cancer cell viability. We knocked down StarD13 using two
different siRNA oligos. The inhibition results were determined by
western blot analysis and RT-PCR. The loading control was β-actin
(Fig. 1A). Following knockdown,
~38% decrease in dead cells was observed, using the exclusion
method (Fig. 1B). Correspondingly,
WST-1 and MTT assays showed an ~40% increase in cellular
proliferation of the StarD13 siRNA-transfected cells (Fig. 1C and D).
Using an opposing approach, control cells were
transfected with the GFP vector alone, while treated cells were
transfected with the GFP-StarD13 vector. Cell viability was then
compared between samples. The overexpression of StarD13 in cells
led to a significant increase in the percentage of dead cells, as
determined using the trypan blue exclusion method (Fig. 1E). Consistently, a decrease in 20
and 45% in cell proliferation, using WST-1 and MTT assay,
respectively, was noted (Fig. 1F and
G).
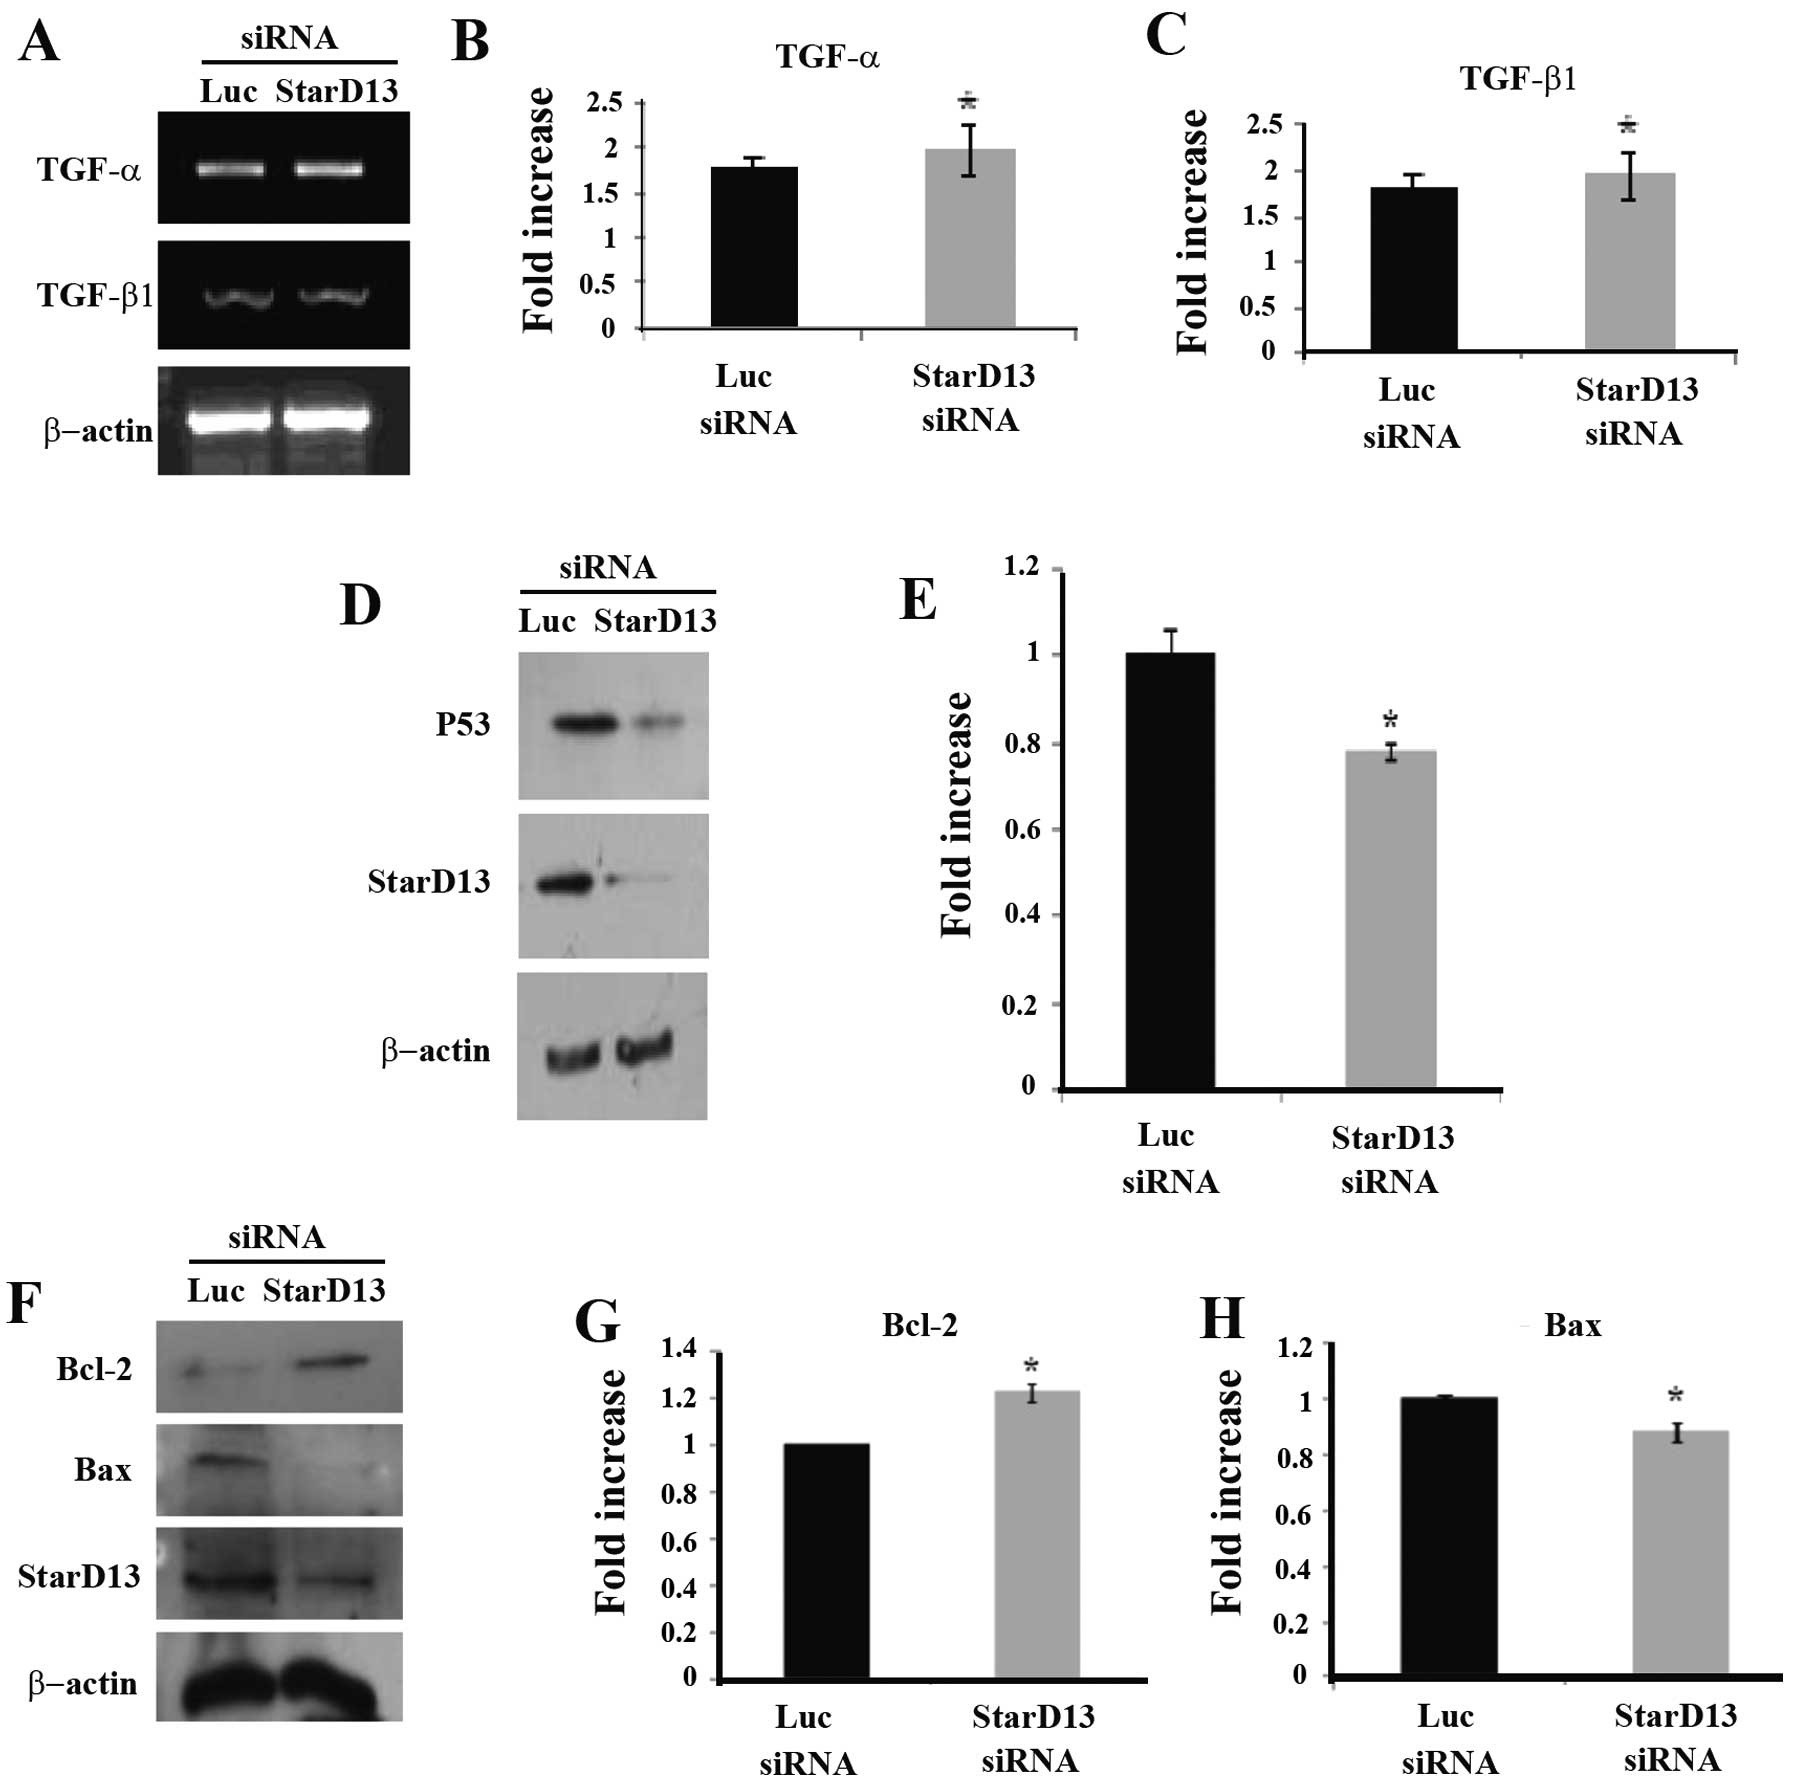
Effect of StarD13 knockdown on the
expression of TGF-α and TGF-β1 mRNAs
After investigating the phenotype of cells affected
by StarD13 knockdown at the level of proliferation and viability,
we assessed the effects of StarD13 knockdown at the molecular
level. Thus, we investigated the potential role of StarD13 in the
TGF-α and TGF-β1 pathways. However, no significant effect was
conferred (Fig. 2A–C).
StarD13 knockdown downregulates tumor
suppressor p53
The mechanism by which StarD13 knockdown increases
cellular proliferation was further investigated by assessing the
protein level of the tumor suppressor p53. Cells were transfected
with a StarD13 siRNA for 72 h and then lysed, and the total
proteins were extracted. Immunoblotting was performed using the
anti-p53 antibody. A 25% decrease in the expression level of the
p53 protein was noted upon StarD13 knockdown (Fig. 2D and E).
StarD13 knockdown upregulates
anti-apoptotic protein Bcl-2 and downregulates the pro-apoptotic
protein BAX
Furthermore, the effects of StarD13 knockdown on
cellular proliferation through its effect on the expression levels
of the anti-apoptotic protein Bcl-2 and pro-apoptotic protein BAX
were investigated. Cells were transfected with a StarD13 siRNA for
72 h, and then lysed, and the total proteins were extracted.
Immunoblotting was performed using anti-Bcl-2 and anti-BAX
antibodies. A 30% increase in the expression level of the Bcl-2
protein was noted upon StarD13 knockdown (upper gel), while a
consistent 20% decrease in the level of BAX protein expression
(second gel) was observed (Fig. 2F and
G).
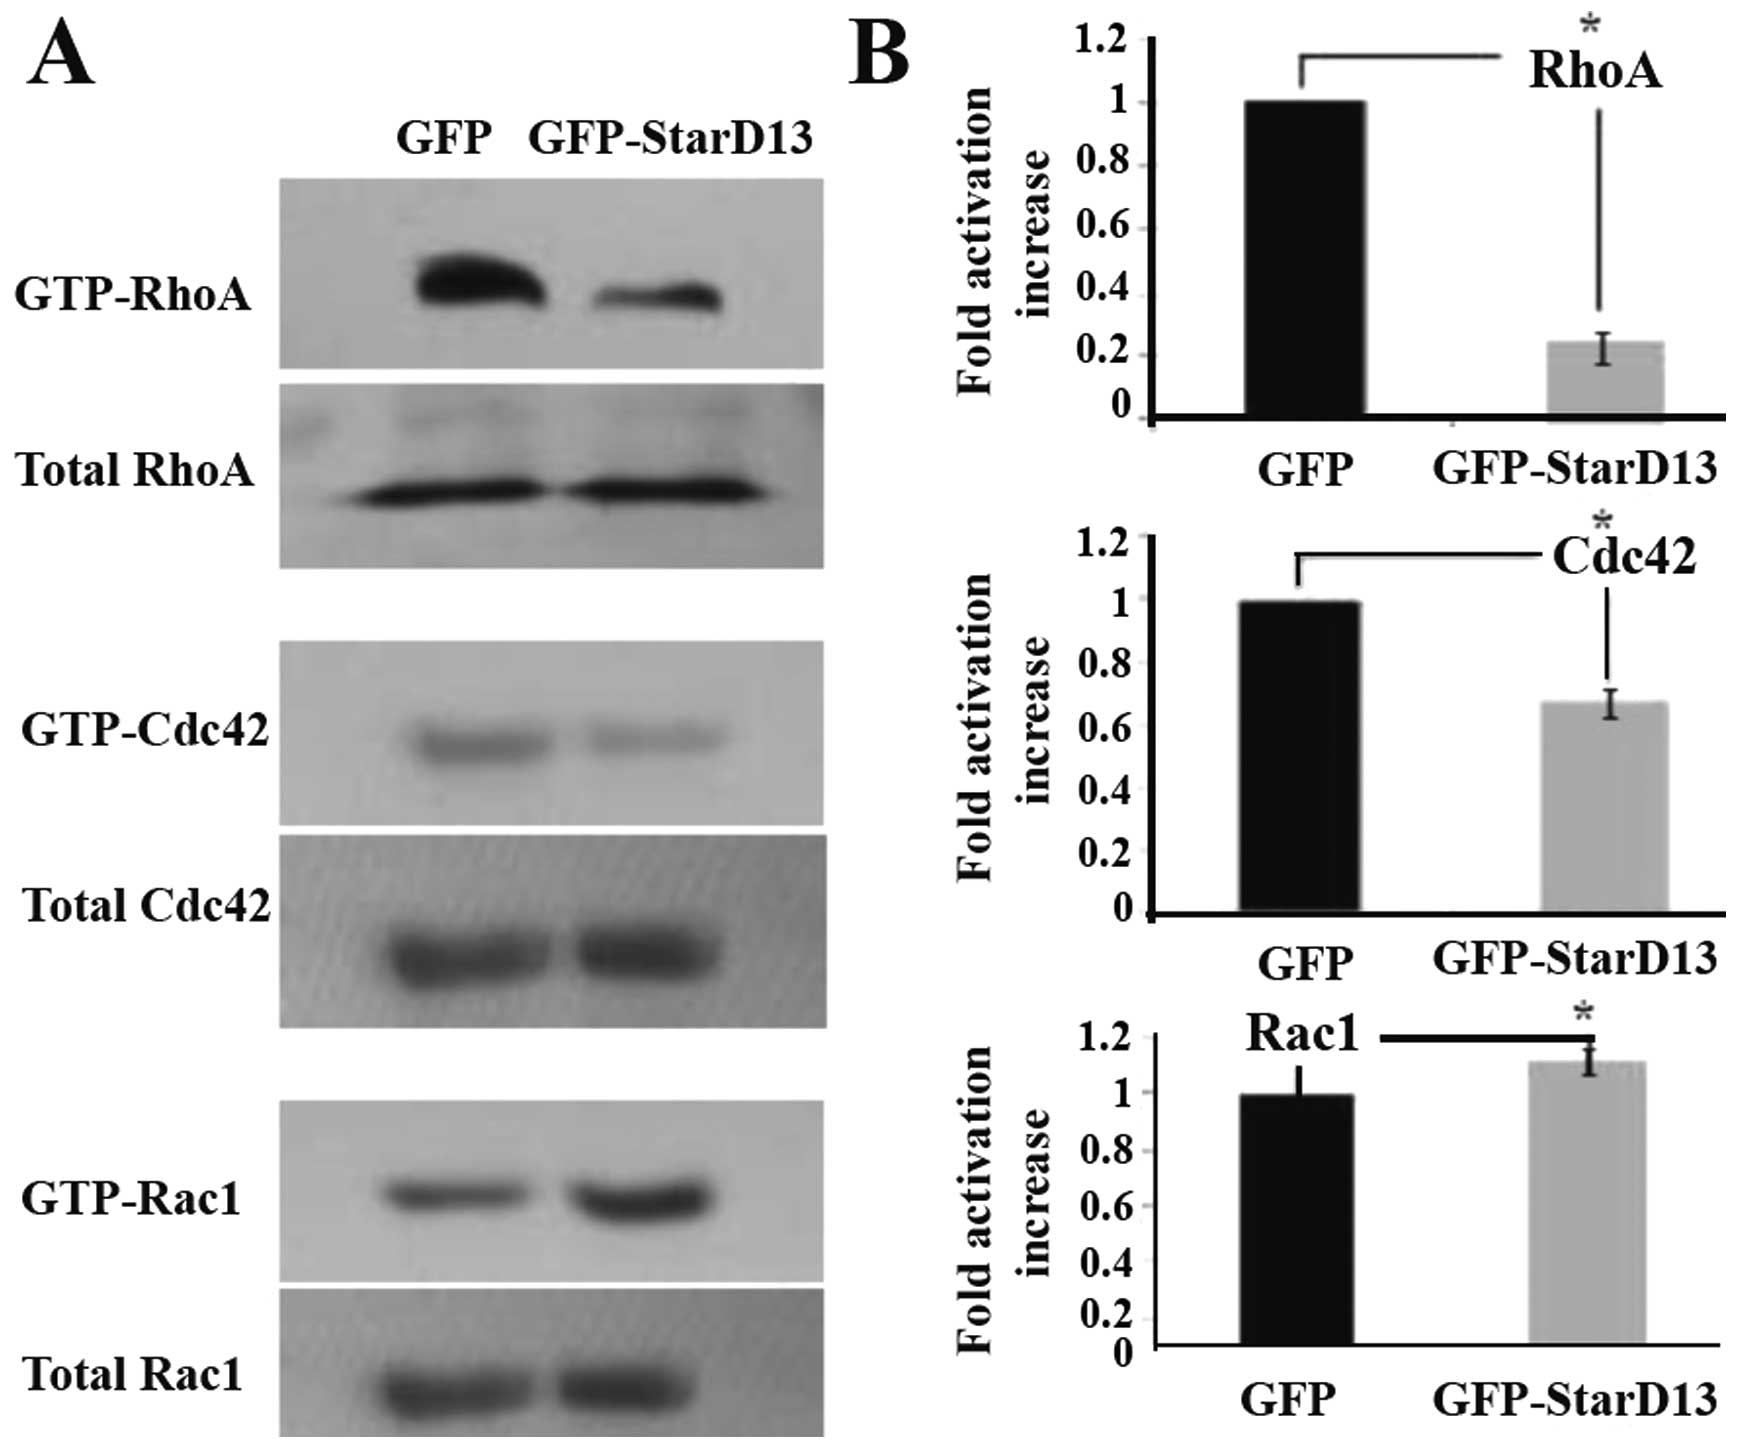
StarD13 is a specific GAP for RhoA and
Cdc42
The effect of StarD13 overexpression on the
activation of members of the family of RhoGTPases was investigated.
Toward this aim, we performed a pull-down assay to detect the
levels of active RhoA, Cdc42 and Rac1 in cells transfected with the
siRNA as compared to the activation levels in cells transfected
with control vectors. An 80% decrease in RhoA activation, a
1.5-fold decrease in Cdc42 activation, and a mild increase in Rac1
activation were observed (Fig.
3).
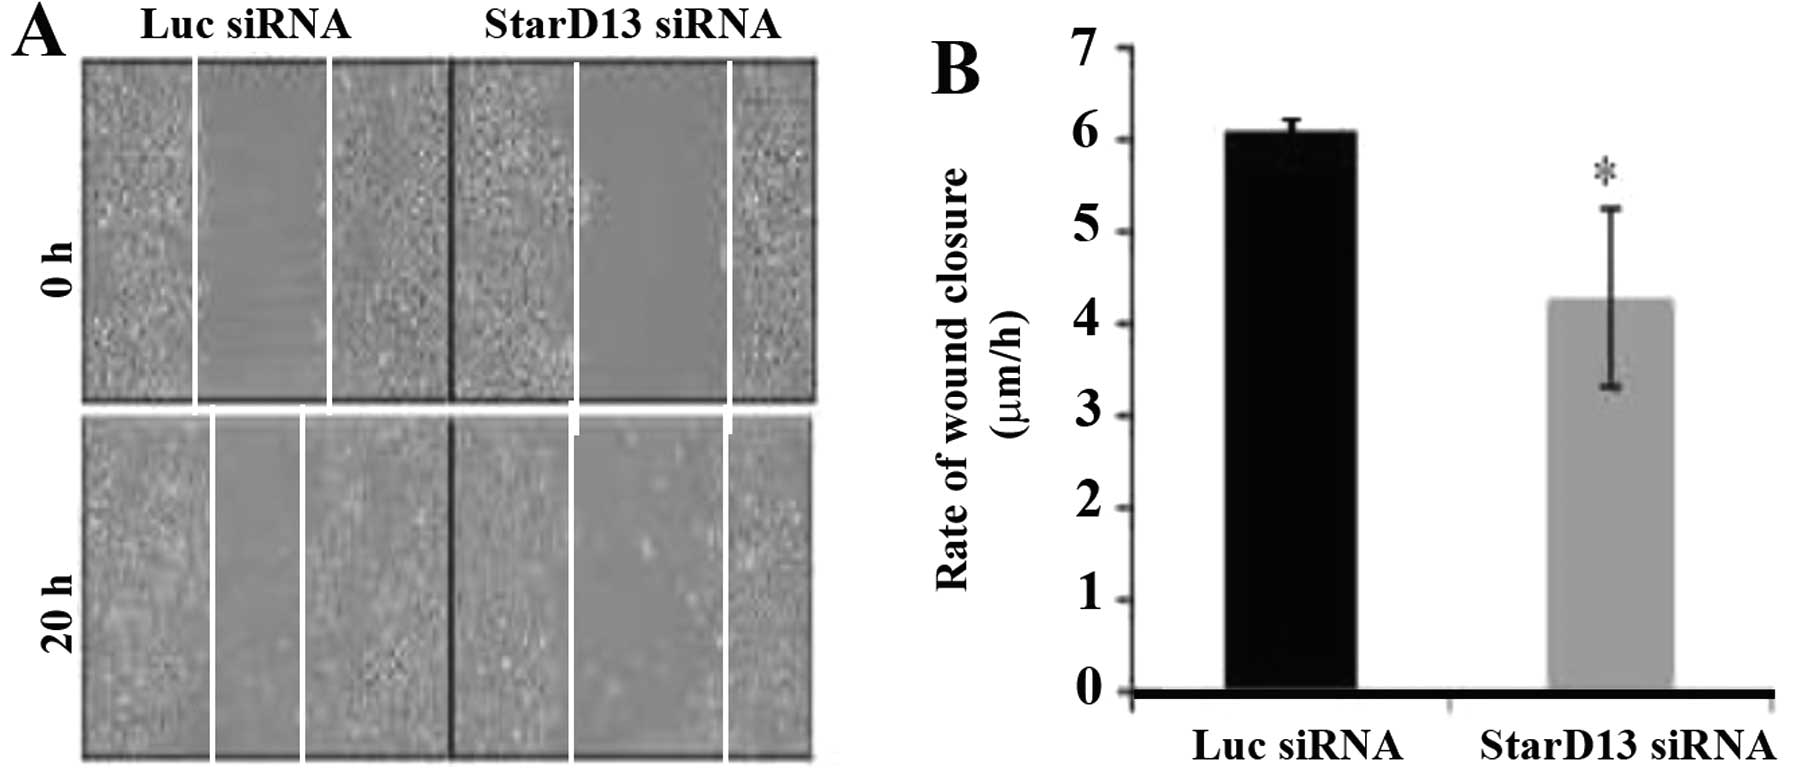
StarD13 is required for cell
motility
After confirming that StarD13 plays a major role in
cancer cell proliferation, and establishing that it is a Rho GAP,
we further assessed its role in 2D motility. Thus, we knocked down
StarD13, and its effect was assayed using a wound healing assay. A
relative decrease in motility of ~1.5-fold in terms of wound
closure was noted in the cells following StarD13 knockdown (4.28
μm/h) in respect to the control cells (6.1 μm/h) (Fig. 4).
To further investigate the phenotypic nature of
cells following StarD13 knockdown, the control and treated cells
were immunostained with Rhodamine phalloidin to stain actin stress
fibers. The knockdown of StarD13 promoted the formation and
stabilization of actin stress fibers (data not shown).
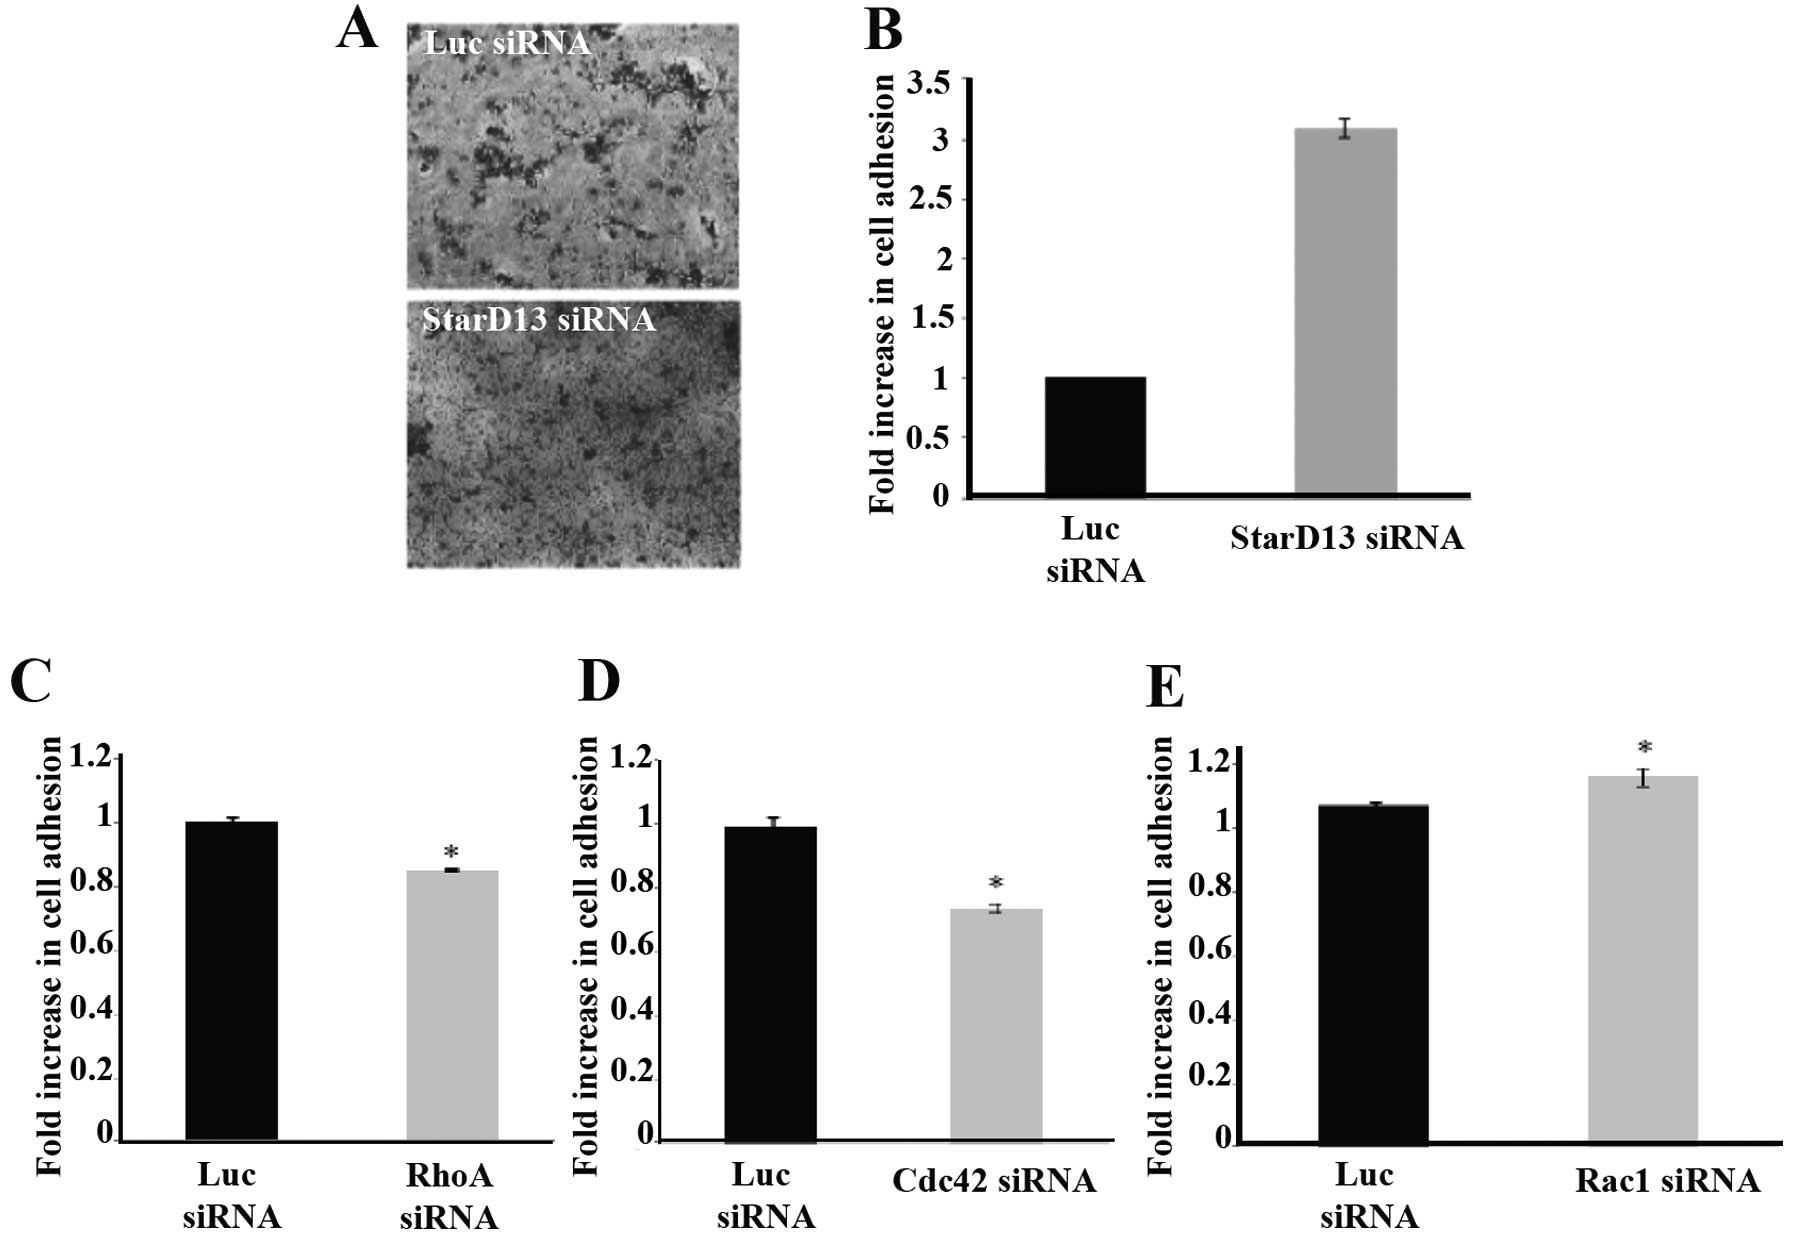
StarD13 regulates Rho GTPases which in
turn regulate cell adhesion
Since StarD13 knockdown was shown to increase actin
stress fiber formation and stabilization, we investigated the
effect of this same knockdown treatment on the adhesion of the
colorectal cancer cells to collagen, which is a main component of
the ECM. An ~3-fold increase in the adhesion of these cells
following knockdown was noted when compared to the control cells
(Fig. 5A and B).
Given that StarD13 is a RhoGAP and was shown to be
involved in the regulation of cellular adhesion, we studied the
direct effect of three members of the Rho GTPase family, RhoA,
Cdc42 and Rac1. A 20% decrease in cellular adhesion was noted upon
RhoA knockdown (Fig. 5C) and an
~25% decrease was noted upon Cdc42 knockdown (Fig. 5D). However, the knockdown of Rac1
showed an antagonistic result, with a 10% increase in cellular
adhesion to collagen (Fig. 5E).
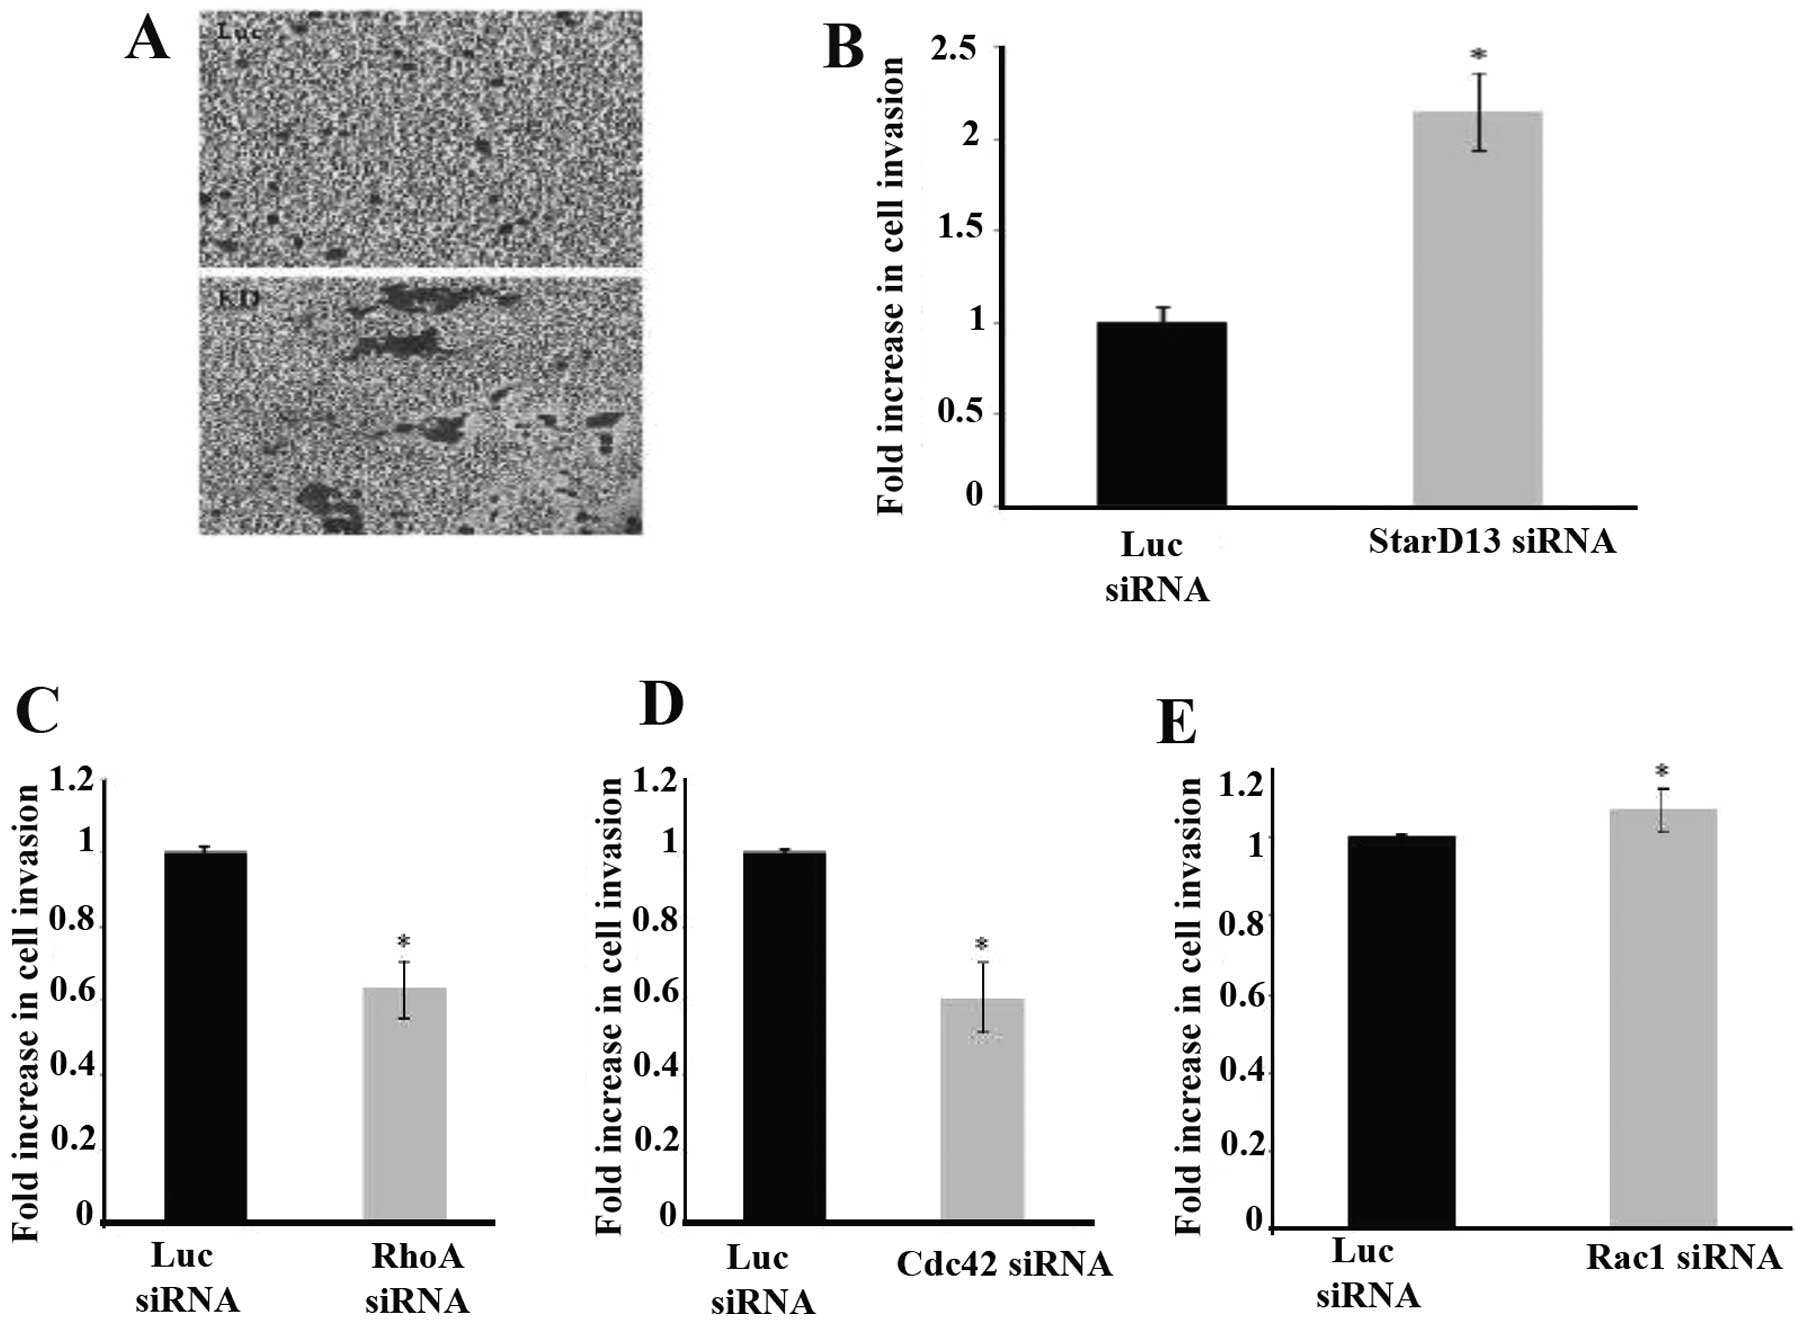
StarD13 negatively regulates cell
invasion
After studying the effect on adhesion, we then
assayed the effect of StarD13 knockdown on cellular invasion, using
an in vitro collagen-based invasion assay with FBS as a
chemoattractant. In contrast to the results for the 2D motility, an
~2-fold increase in cell invasion in cells was noted following
StarD13 knockdown when compared to the control cells (Fig. 6A and B).
Furthermore, we studied the direct effect of three
members of the Rho GTPase family, RhoA, Cdc42 and Rac1, on cellular
invasion, with collagen as a chemoattractant. An ~40% decrease in
cellular invasion was noted upon RhoA and Cdc42 knockdown (Fig. 6C and D). However, the knockdown of
Rac1 showed an antagonistic result, with a 10% increase in cellular
invasion (Fig. 6E).
Discussion
StarD13 was previously identified to be a tumor
suppressor gene in hepatocellular carcinoma (41). More recent studies showed that it
localizes to focal adhesions in HeLa cells (49). In the present study, an overall
characterization of StarD13 in colorectal cancer is provided, in
terms of its effect on cellular viability and proliferation,
subcellular localization, GAP activity and motility and
invasion.
We considered an in vitro model of colorectal
cancer cell lines, Caco-2 and HT-29, to first investigate the
effect of StarD13 on cell proliferation and viability. The
silencing of StarD13 in both cell lines led to a decrease in cell
death, as determined by the trypan blue exclusion method and an
increase in cellular viability, as determined by the WST-1 and MTT
proliferation assays. Consistently, StarD13 overexpression using a
GFP vector led to an increase in cell death, as shown by the
exclusion method, and a decrease in cell proliferation by the WST-1
and MTT assays. This was consistent with several previous studies
carried out on astrocytoma and breast cancer cell lines in our
laboratory (47). Accordingly,
StarD13 appears to play a role as a tumor suppressor in different
types of cancers particularly colorectal cancer cells, consistent
with previous findings.
In order to explain how the silencing and
overexpression of StarD13 affect cell viability and proliferation
at the molecular level, we performed RT-PCR runs, using primers
specific for the mitogen TGF-α and the tumor suppressor TGF-β1.
Contrary to our expectations, there was no effect at the mRNA level
for both proteins. This suggests that StarD13 knockdown affects
cellular viability and proliferation through a different pathway.
Thus, to further investigate the molecular pathway, we evaluated
the protein expression of other tumor suppressors, through western
blot analysis. We found that silencing of StarD13 downregulated p53
tumor suppressor genes. We also assessed the expression of
anti-apoptotic Bcl-2 protein and pro-apoptotic BAX protein. As
expected, Bcl-2 exhibted increased expression and BAX exhibited
decreased expression upon StarD13 knockdown. These results
confirmed the effect of StarD13 on colorectal cancer cellular
viability, proliferation, through the regulation of tumor
suppressor, anti-apoptotic and pro-apoptotic proteins.
Previous studies have shown that StarD13 has a GAP
domain (44) and localizes to focal
adhesions (49). In our system, we
further confirmed its function as a Rho GAP, as detected by the
increase in RhoA and Cdc42 activation, while a decrease in Rac1
activation was noted following the downregulation of the expression
of StarD13. Previous studies, carried out on hepatocellular
carcinoma, showed consistent results, thus, supporting our findings
(52). The effect of StarD13 on Rac
activation was possibly due to the antagonistic relationship
between RhoA and Rac. These data suggest that StarD13 might have a
role in regulating RhoA, consequently affecting cellular
motility.
After performing a series of experiments regarding
proliferation and viability of colorectal cancer cells, we next
investigated the effect of StarD13 on 2D cell motility. Knockdown
of StarD13 in the cell lines inhibited cell motility. Thus,
although it is known to be a tumor suppressor, StarD13 is required
for 2D cell motility. This was in accordance with previous studies
in our laboratory, in which the silencing of StarD13 inhibited the
migration of astrocytoma and breast cancer cells (data not shown).
Moreover, our immunostaining results showed that StarD13 promotes
actin stress fiber formation and stabilization. Nevertheless,
contradictory to our results, a previous study on normal
endothelial cells reported that StarD13 inhibition led to an
increase in cell migration (51).
This inconsistency can be explained by the fact that normal cells
are exceedingly different than colorectal cancer cell systems. The
cancer cells used in the present study typically display distinct
cell morphology and altered signaling pathways.
To further investigate the inhibition of 2D cell
motility due to StarD13 knockdown, we performed an adhesion assay,
which showed a major increase in the stabilization and adhesion of
cells to collagen upon silencing of StarD13. Based on the fact that
StarD13 is a RhoGAP, and since RhoA has been widely proven to be
indispensible for the formation of focal adhesions (53,54),
and that increasing Rho activation stabilizes focal adhesions
inhibiting cell motility (35,55),
we formulated a hypothesis that StarD13 knockdown maintains RhoA
activity in focal adhesions. Thus, we evaluated the dynamics of
cellular adhesion following RhoA, Cdc42 and Rac1 knockdown. RhoA
and Cdc42 knockdown resulted in decreased adhesion, while Rac1
knockdown resulted in an increase in cellular adhesion to collagen.
Consistent with our present findings, studies carrried out on
breast cancer cell lines showed that silencing of RhoA decreased
cellular adhesion to collagen I (56).
Another recent study carried out on normal prostate
cells showed that silencing of DLC1 reduces cell migration
(57). In fact, recent studies
conducted on DLC1 showed that DLC1 plays differential roles in
regulating cell migration and transformation depending on its
interaction with tensins (58).
This highlights the differential role of the DLC family of proteins
as tumor suppressors which are also required for cell motility. A
comparable dilemma was illustrated in a recent review on TGF-β that
is known to exert tumor-suppressive effects in normal cells; yet
paradoxically, in protumorigenic cells its role was reversed
(59).
After determining the mechanism by which StarD13
might affect random 2D cell motility, its effect on cellular
invasion, i.e. 3D motility was investigated. We transfected the
cells with siRNA against StarD13 and performed a collagen-based
Transwell invasion assay. Knowing that StarD13 knockdown inhibits
cellular motility in 2D, it was assumed that it would also inhibit
cell invasion. However, notably, silencing of StarD13 had a
positive effect on cellular invasion, despite the fact that StarD13
knockdown stabilizes focal adhesions. We then performed RhoA, Cdc42
and Rac1 knockdown. This resulted in conflicting data as compared
to the findings of the adhesion assay. RhoA and Cdc42 knockdown led
to decreased invasion, while Rac1 knockdown led to an increase in
cellular invasion. This can be explained by focal adhesions that
might play an alternative role in cellular invasion. In fact, a
recent study investigated the involvement of focal adhesions in the
degradation of the surrounding matrix. Results revealed that
specifically at focal adhesion sites, several cell lines degraded
underlying ECM. This process was proved to have occurred through
the proteolytic activity of MMPs and not due to physical tension
exerted by FAs onto the matrix (60). This supports our data using StarD13
knockdown, in which we typically noted an increase in RhoA
activity, thus, promoting cellular invasion. Furthermore, it was
formerly discovered that in 3D matrices, cancer cells can switch
between diverse means of movement (37). This pertains to the interaction
between dissimilar signaling conditions. Hence, cells can change
between an elongated protrusive and a more rounded blebbing
movement fashion. Thus, in the present study, the silencing of
StarD13 amplified cellular adhesion to the ECM, obstructing 2D
cellular migration of mesenchymal cells. Nonetheless, this was
reflected in an increase in 3D movement, suggesting that cells tend
to switch to a more amoeboid-like motility when they cannot move in
an adhesion-dependent manner. Therefore, the ability of tumor cells
to switch between modes of motility may limit the effectiveness of
prospective inhibitory strategies targeting particular cell
morphology, thus promoting the selection of a different mode to
escape inhibition.
Acknowledgements
The present study was supported by the Natural
Science Department of the Lebanese American University (LAU), by
the University Research Council (URC) at LAU and by the Lebanese
National Center for Scientific Research (L-NCSR) (ref.
03-06-10).
References
|
1
|
World Health Organization. Cancer
Statistics. 4–February. 2010, (Online). Available: http://www.who.int/cancer/detection/colorectalcancer/en/.
|
|
2
|
Cunningham D, Atkin W, Lenz H-J, Lynch H,
Minsky B, Nordlinger B and Starling N: Colorectal cancer. Lancet.
375:1030–1047. 2010. View Article : Google Scholar
|
|
3
|
Ionov Y, Peinado MA, Malkhosyan S, Shibata
D and Perucho M: Ubiquitous somatic mutations in simple repeated
sequences reveal a new mechanism for colonic carcinogenesis.
Nature. 363:558–561. 1993. View
Article : Google Scholar : PubMed/NCBI
|
|
4
|
Alpers DH, Kalloo AN, Owyang C, Powell DW
and Kaplowitz N: Principles of Clinical Gastroenterology. 5th
edition. Wiley-Blackwell Publishing; Oxford: pp. 380–382. 2009
|
|
5
|
Maddika S, Ande SR, Panigrahi S,
Paranjothy T, Weglarczyk K, Zuse A, Eshraghi M, Manda KD, Wiechec E
and Los M: Cell survival, cell death and cell cycle pathways are
interconnected: Implications for cancer therapy. Drug Resist Updat.
10:13–29. 2007. View Article : Google Scholar : PubMed/NCBI
|
|
6
|
Vivanco I and Sawyers CL: The
phosphatidylinositol 3-kinase AKT pathway in human cancer. Nat Rev
Cancer. 2:489–501. 2002. View
Article : Google Scholar : PubMed/NCBI
|
|
7
|
Levine AJ, Momand J and Finlay CA: The p53
tumour suppressor gene. Nature. 351:453–456. 1991. View Article : Google Scholar : PubMed/NCBI
|
|
8
|
Brown C, Lain S, Verma CS, Fersht AR and
Lane DP: Awakening guardian angels: drugging the p53 pathway. Nat
Rev Cancer. 9:862–873. 2009. View
Article : Google Scholar : PubMed/NCBI
|
|
9
|
Markowitz S: DNA repair defects inactivate
tumor suppressor genes and induce hereditary and sporadic colon
cancers. J Clin Oncol. 18(21 Suppl): 75S–80S. 2000.PubMed/NCBI
|
|
10
|
Lauffenburger DA and Horwitz AF: Cell
migration: a physically integrated molecular process. Cell.
84:359–369. 1996. View Article : Google Scholar : PubMed/NCBI
|
|
11
|
El Zouhairi M, Charabaty A and Pishvaian
MJ: Molecularly targeted therapy for metastatic colon cancer:
proven treatments and promising new agents. Gastrointest Cancer
Res. 4:15–21. 2011.PubMed/NCBI
|
|
12
|
Condeelis JS: How is actin polymerization
nucleated in vivo? Trends Cell Biol. 11:288–293. 2001. View Article : Google Scholar : PubMed/NCBI
|
|
13
|
Silva D: Signaling pathways responsible
for cancer cell invasion as targets for cancer therapy. Curr Cancer
Drug Targets. 4:327–336. 2004. View Article : Google Scholar : PubMed/NCBI
|
|
14
|
Calvo F and Sahai E: Cell communication
networks in cancer invasion. Curr Opin Cell Biol. 23:621–629. 2011.
View Article : Google Scholar : PubMed/NCBI
|
|
15
|
Morra L and Moch H: Periostin expression
and epithelial-mesenchymal transition in cancer: a review and an
update. Virchows Arch. 459:465–475. 2011. View Article : Google Scholar : PubMed/NCBI
|
|
16
|
Thierry JP: Epithelial-mesenchymal
transitions in tumour progression. Nat Rev Cancer. 2:442–454. 2002.
View Article : Google Scholar : PubMed/NCBI
|
|
17
|
Nieto MA: The ins and outs of the
epithelial to mesenchymal transition in health and disease. Ann Rev
Cell Dev Biol. 27:347–376. 2011. View Article : Google Scholar : PubMed/NCBI
|
|
18
|
Boettner B and Van Aelst L: The role of
Rho GTPases in disease development. Gene. 286:155–174. 2002.
View Article : Google Scholar : PubMed/NCBI
|
|
19
|
Etienne-Manneville S and Hall A: Rho
GTPases in cell biology. Nature. 420:629–635. 2002. View Article : Google Scholar
|
|
20
|
Takai Y, Sasaki T and Matozaki T: Small
GTP-binding proteins. Physiol Rev. 81:153–208. 2001.PubMed/NCBI
|
|
21
|
Vega FM and Ridley AJ: Rho GTPases in
cancer cell biology. FEBS Lett. 582:2093–2101. 2008. View Article : Google Scholar : PubMed/NCBI
|
|
22
|
Wennerberg K and Der CJ: Rho-family
GTPases: it’s not only Rac and Rho (and I like it). J Cell Sci.
117:1301–1312. 2004.
|
|
23
|
Grise F, Bidaud A and Moreau V: Rho
GTPases in hepatocellular carcinoma. Biochim Biophys Acta.
1795:137–151. 2009.PubMed/NCBI
|
|
24
|
Schmidt A and Hall A: Guanine nucleotide
exchange factors for Rho GTPases: turning on the switch. Genes Dev.
16:1587–1609. 2002. View Article : Google Scholar : PubMed/NCBI
|
|
25
|
Moon SY and Zheng Y: Rho GTPase-activating
proteins in cell regulation. Trends Cell Biol. 13:13–22. 2003.
View Article : Google Scholar : PubMed/NCBI
|
|
26
|
Der Mardirossian C and Bokoch GM: GDIs:
central regulatory molecules in Rho GTPase activation. Trends Cell
Biol. 15:356–363. 2005.PubMed/NCBI
|
|
27
|
Garcia-Mata R, Boulter E and Burridge K:
The ‘invisible hand’: regulation of RHO GTPases by RHOGDIs. Nat Rev
Mol Cell Biol. 12:493–504. 2011.
|
|
28
|
Macias MJ, Musacchio A, Ponstingl H,
Nilges M, Saraste M and Oschkinat H: Structure of the pleckstrin
homology domain from β-spectrin. Nature. 369:675–677. 1994.
|
|
29
|
Nobes CD, Hawkins P, Stephens L and Hall
A: Activation of the small GTP-binding proteins rho and rac by
growth factor receptors. J Cell Sci. 108:225–233. 1995.PubMed/NCBI
|
|
30
|
Keely PJ, Westwick JK, Whitehead IP, Der
CJ and Parise LV: Cdc42 and Rac1 induce integrin-mediated cell
motility and invasiveness through PI(3)K. Nature. 390:632–636.
1997. View Article : Google Scholar : PubMed/NCBI
|
|
31
|
Ananthakrishnan R and Ehrlicher A: The
forces behind cell movement. Int J Biol Sci. 3:303–317. 2007.
View Article : Google Scholar : PubMed/NCBI
|
|
32
|
Zhou FQ and Sinder WD: Intracellular
control of developmental and regenerative axon growth. Philos Trans
R Soc Biol Sci. 361:1575–1592. 2006. View Article : Google Scholar : PubMed/NCBI
|
|
33
|
Khalil BD and El-Sibai M: Rho GTPases in
primary brain tumor malignancy and invasion. J Neurooncol.
108:333–339. 2012. View Article : Google Scholar : PubMed/NCBI
|
|
34
|
Burridge K and Wennerberg K: Rho and Rac
take center stage. Cell. 116:167–179. 2004. View Article : Google Scholar : PubMed/NCBI
|
|
35
|
Sander EE, ten Klooster JP, van Delft S,
van der Kammen RA and Collard JG: Rac downregulates Rho activity:
reciprocal balance between both GTPases determines cellular
morphology and migratory behavior. J Cell Biol. 147:1009–1022.
1999. View Article : Google Scholar : PubMed/NCBI
|
|
36
|
El-Sibai M, Pertz O, Pang H, Yip SC,
Lorenz M, Symons M, Condeelis JS, Hahn KM and Backer JM:
RhoA/ROCK-mediated switching between Cdc42- and Rac1-dependent
protrusion in MTLn3 carcinoma cells. Exp Cell Res. 4:1540–1552.
2008. View Article : Google Scholar : PubMed/NCBI
|
|
37
|
Sahai E and Marshall CJ: RHO-GTPases and
cancer. Nat Rev Cancer. 2:133–142. 2002. View Article : Google Scholar
|
|
38
|
Clark EA, Golub TR, Lander ES and Hynes
RO: Genomic analysis of metastasis reveals an essential role for
RhoC. Nature. 406:532–535. 2000. View Article : Google Scholar : PubMed/NCBI
|
|
39
|
Brabletz T, Hlubek F, Spaderna S,
Schmalhofer O, Hiendelmeyer E, Jung A and Kirchner T: Invasion and
metastasis in colorectal cancer: epithelial-mesenchymal transition,
mesenchymal-epithelial transition, stem cells and β-catenin. Cells
Tissues Organs. 179:56–65. 2005.
|
|
40
|
Jaffe AB and Hall A: Rho GTPases:
biochemistry and biology. Ann Rev Cell Dev Biol. 21:247–269. 2005.
View Article : Google Scholar : PubMed/NCBI
|
|
41
|
Ching YP, Wong CM, Chan SF, Leung TH, Ng
DC, Jin DY and Ng IO: Deleted in liver cancer (DLC) 2 encodes a
RhoGAP protein with growth suppressor function and is
underexpressed in hepatocellular carcinoma. J Biol Chem.
278:10824–10830. 2003. View Article : Google Scholar : PubMed/NCBI
|
|
42
|
Popescu NC and Durkin ME: Rho GTPase
activating protein cDNA on chromosome 13q12 is the deleted in liver
cancer (DLC2) gene. Biochem Biophys Res Commun. 315:7812004.
View Article : Google Scholar : PubMed/NCBI
|
|
43
|
Thorsell AG, Lee WH, Persson C, Siponen
MO, Nilsson M, Busam RD, Kotenyova T, Schuler H and Lehtio L:
Comparative structural analysis of lipid binding START domains.
PLos One. 6:e195212011. View Article : Google Scholar : PubMed/NCBI
|
|
44
|
Ullmannova V and Popescu NC: Expression
profile of the tumor suppressor genes DLC-1 and DLC-2 in solid
tumors. Int J Oncol. 29:1127–1132. 2006.PubMed/NCBI
|
|
45
|
Durkin ME, Yuan BZ, Zhou X, Zimonjic DB,
Lowy DR, Thorgeirsson SS and Popescu NC: DLC-1: a Rho
GTPase-activating protein and tumour suppressor. J Cell Mol Med.
11:1185–1207. 2007. View Article : Google Scholar : PubMed/NCBI
|
|
46
|
Liao YC and Lo SH: Deleted in liver
cancer-1 (DLC-1): a tumor suppressor not just for liver. Int J
Biochem Cell Biol. 40:843–847. 2008. View Article : Google Scholar : PubMed/NCBI
|
|
47
|
El-Sitt S, Khalil BD, Hanna S, El-Sabban
M, Fakhreddine N and El-Sibai M: DLC2/StarD13 plays a role of a
tumor suppressor in astrocytoma. Oncol Rep. 28:511–518.
2012.PubMed/NCBI
|
|
48
|
Ng DC, Chan SF, Kok KH, Yam JW, Ching YP,
Ng IO and Jin DY: Mitochondrial targeting of growth suppressor
protein DLC2 through the START domain. FEBS Lett. 580:191–198.
2006. View Article : Google Scholar : PubMed/NCBI
|
|
49
|
Kawai K, Seike J, Iion T, Kiyota M, Iwamae
Y, Nishitani H and Yagisawa H: START-GAP2/DLC2 is localized in
focal adhesions via its N-terminal region. Biochem Biophys Res
Commun. 380:736–741. 2009. View Article : Google Scholar : PubMed/NCBI
|
|
50
|
Leung TH, Ching YP, Yam JW, Wong CM, Yau
TO, Jin DY and Ng IO: Deleted in liver cancer 2 (DLC2) suppresses
cell transformation by means of inhibition of RhoA activity. Proc
Natl Acad Sci USA. 102:15207–15212. 2005. View Article : Google Scholar : PubMed/NCBI
|
|
51
|
Lin Y, Chen NT, Shih YP, Liao YC, Xue L
and Lo SH: DLC2 modulates angiogenic responses in vascular
endothelial cells by regulating cell attachment and migration.
Oncogene. 29:3010–3016. 2010. View Article : Google Scholar : PubMed/NCBI
|
|
52
|
Xiaorong L, Wei W, Liyuan Q and Kaiyan Y:
Underexpression of deleted in liver cancer 2 (DLC2) is associated
with overexpression of RhoA and poor prognosis in hepatocellular
carcinoma. BMC Cancer. 23:205–211. 2008. View Article : Google Scholar : PubMed/NCBI
|
|
53
|
Arjonen A, Kaukonen R and Ivaska J:
Filopodia and adhesion in cancer cell motility. Cell Adh Migr.
5:421–430. 2011. View Article : Google Scholar : PubMed/NCBI
|
|
54
|
Wolfenson H, Henis YI, Geiger B and
Bershadsky AD: The heel and toe of the cell’s foot: a multifaceted
approach for understanding the structure and dynamics of focal
adhesions. Cell Motil Cytoskeleton. 66:1017–1029. 2009.
|
|
55
|
Cox EA, Sastry SK and Huttenlocher A:
Integrin-mediated adhesion regulates cell polarity and membrane
protrusion through the Rho family of GTPases. Mol Biol Cell.
12:265–277. 2001. View Article : Google Scholar : PubMed/NCBI
|
|
56
|
Wu M, Wu Z, Rosenthal DT, Rhee EM and
Merajver SD: Characterization of the roles of RhoC and RhoA GTPases
in invasion, motility, and matrix adhesion in inflammatory and
aggressive breast cancers. Cancer. 116:2768–2782. 2010. View Article : Google Scholar : PubMed/NCBI
|
|
57
|
Shih YP, Takada Y and Lo SH: Silencing of
DLC1 upregulates PAI-1 expression and reduces migration in normal
prostate cells. Mol Cancer Res. 10:34–39. 2012. View Article : Google Scholar : PubMed/NCBI
|
|
58
|
Cao X, Voss C, Zhao B, Kaneko T and Li SS:
Differential regulation of the activity of deleted in liver cancer
1 (DLC1) by tensins controls cell migration and transformation.
Proc Natl Acad Sci USA. 109:4708–4718. 2012. View Article : Google Scholar : PubMed/NCBI
|
|
59
|
Massagué J: TGFβ in cancer. Cancer Cell.
134:215–230. 2008.
|
|
60
|
Wang Y and McNiven MA: Invasive matrix
degradation at focal adhesions occurs via protease recruitment by a
FAK-p130Cas complex. J Cell Biol. 196:375–385. 2012. View Article : Google Scholar : PubMed/NCBI
|