Introduction
Endometrial cancer (EC) is the most frequent
malignancy of the female genital tract in the Western world, with
an estimated incidence of 10–20 per 100,000 women (1). There were 5,594 new cases and 1,028
deaths estimated in 2012 in Poland (2). The prevalence of EC is increasing
annually (3). Despite the high
prevalence, our understanding of the molecular background of EC
with regard to its pathogenesis, tumour growth and disease
progression remains insufficient. Data concerning copy number
variations within EC are scarce.
EC encompasses a group of histologically and
biologically diverse tumours, which are characterised by a distinct
pathogenesis. Two pathogenic types have been distinguished based on
the differential characteristics, as proposed by Bokhman (4). This classification has been challenged
in daily practice, as some tumours possess overlapping or combined
morphologic and molecular characteristics. Nevertheless, the
dualistic model is still followed in clinical practice (5), with endometrial carcinomas being
classified as either type I or II.
The more frequent endometrioid type I carcinomas
(80%) (6) are rather
well-differentiated, with high oestrogen receptor α (ERα) and
progesterone receptor (PR) expression. They are generally confined
to the uterus and carry a favourable prognosis. Type II carcinomas,
which have non-endometrioid serous or clear cell histology, follow
an oestrogen-unrelated pathway. Such poorly-differentiated tumours
behave in a more aggressive manner, resulting in a poor prognosis
(4,7,8). Type
II carcinomas appear spontaneously and they are not clearly related
to the transition from atypical hyperplasia; rather, they arise in
the background of an atrophic or inert endometrium (9).
Type I endometrioid carcinomas have a near-diploid
karyotype and are associated with microsatellite instability, which
is the consequence of alterations in the mismatch repair genes,
MLH1, MSH6 and MSH3. Aberrations of
K-RAS oncogene together with tumour-suppressor gene
mutations, especially PTEN, have also been reported.
Additionally, type I ECs contain PI3K and β-catenin mutations. On
the other hand, type II serous carcinomas are known for their
chromosome aneuploidy, ERBB2 overexpression and mutant p53
protein accumulation within the nucleus. Other mutations,
encountered in both types of EC, include aberrations of MYC,
INT2 and CTNNB1 (6,10–15).
The prognostic value of the EC dualistic model is
limited. Up to 20 and 50% of type I and II carcinomas,
respectively, recur (16). The aim
of the present study was to further explore the molecular basis of
EC by developing a quantitative PCR (qPCR) platform that would
allow for more precise tumour characterisation. We searched for
potential molecular markers that may be of diagnostic and
prognostic significance.
We analysed the RNA expression level of the
MGB1 gene (mammaglobin), as this secretory protein is
recognised as a sensitive marker in breast cancer and was also
found to be expressed in the female genital tract and in EC
(17). We also measured the copy
number variations of the following genes: ESR1 (oestrogen
receptor 1), ERBB1 (epidermal growth factor receptor),
ERBB2 (v-erb-b2 erythroblastic leukaemia viral oncogene
homolog 2, also known as HER2), ERBB3 (receptor
tyrosine-protein kinase erbB-3), ERBB4 (receptor
tyrosine-protein kinase erbB-4), PI3K (phosphatidylinositol
3-kinases), MYC (cellular homolog of the retroviral v-myc
oncogene), CCND1 (cyclin D1) and TOP2A (DNA
topoisomerase 2-α).
ERBB2 is a central oncogene of prognostic and
predictive value. Its amplification and increased expression have
been reported in EC, indicating a higher stage and poor
differentiation (18). Previous
reports indicated the importance of the interaction of ERBB2 with
other ERBB receptors (ERBB1 ERBB3, ERBB4). This interaction may be
associated with a more aggressive phenotype (19,20).
PI3K and MYC are downstream effectors of ERBB receptors. Excessive
activation of PI3K, as a result of amplification, is associated
with a poorer prognosis in EC patients (21). Expression of the MYC oncogene
is often impaired in several types of cancer and gene amplification
is one of the mechanisms of its activation (22). Another gene implicated in
endometrial carcinogenesis is CCND1; its amplification may
result in cyclin D1 overexpression, which is found in 40–56% of EC
cases (23). TOP2A is an enzyme
that plays a key role in maintaining the integrity of the genome.
In addition, TOP2A is a target of many anticancer drugs.
Amplification and overexpression of TOP2A has been observed in 7.5
and 45% of EC cases, respectively (24).
The gene dosage of the aforementioned genes seems to
be of clinical importance in EC. However, these genes have not been
examined together in EC. Therefore, we developed a potentially
highly sensitive and reproducible qPCR-based platform for the
reliable assessment of specific genes associated with EC and in
order to analyse its utility in a representative group of EC
samples.
Materials and methods
Patients and tissues
The present study included 157 fresh frozen tumour
samples retrospectively collected from a cohort of EC patients who
were operated on in the Department of Gynaecology, Gynaecological
Oncology and Gynaecological Endocrinology (Medical University of
Gdańsk) between 2005 and 2011. Each patient was primarily treated
by surgery, with the possible option of radiotherapy and/or
chemotherapy administration. The inclusion criteria were operable
EC (IVB stage patients underwent cytoreductive surgery) confirmed
by histological examination and a signed consent form. The present
study was approved by the Ethics Committee of the Medical
University of Gdańsk.
The samples were collected from the core of the
tumour by surgical excision prior to any systemic treatment and
were immediately frozen and stored at −80°C. The samples were kept
on ice during transport. The tissue samples included all pathologic
stages of endometrial carcinoma, from non-invasive IA to metastatic
IVB cancer as distinguished by the International Federation of
Gynecology and Obstetrics (FIGO) in 2009 (25). The patient characteristics are
summarized in Table I. The mean age
was 63.6 years (range 30–87 years). Patients with a body mass index
>30 were classified as obese (26). The PgR, ER and ERBB2 status was
determined immunohistochemically (IHC) using Allred score
(positivity cut-off, ≥3) for PgR and ER and the HercepTest score
(positivity cut-off, 3) for ERBB2. A survival analysis was
performed for 82 patients. After a median follow-up of 4.4 years
(range 0.04–7.58 years), 15 patients (18%) had died. The last
follow-up data were collected in January 2013.
 | Table IClinicopathological data (N=157). |
Table I
Clinicopathological data (N=157).
| Variable | No. of cases
(%) |
|---|
| Menopausal
status |
| Premenopausal | 8 (5.1) |
|
Perimenopausal | 11 (7) |
|
Postmenopausal | 124 (79) |
| Missing data | 14 (8.9) |
| Histology |
| Endometroid | 123 (78.3) |
|
Non-endometroid | 34 (21.7) |
| Stage (FIGOa) |
| IA-IB | 112 (71.3) |
| II | 22 (14) |
| IIIA-IIIC | 20 (12.7) |
| IVA-IVB | 3 (1.9) |
| Grade |
| I | 60 (38.2) |
| II | 69 (43.9) |
| III | 24 (15.3) |
| Missing data | 4 (2.5) |
| Obesity |
| Absent | 68 (43.3) |
| Present | 87 (55.4) |
| Missing data | 2 (1.3) |
| Cervical
invasion |
| Absent | 113 (72) |
| Present | 42 (26.8) |
| Missing data | 2 (1.3) |
| Myometrial
infiltration |
| ≤1/2 | 87 (55.4) |
| >1/2 | 69 (43.9) |
| Missing data | 1 (0.6) |
| Metastases |
| Absent | 105 (66.9) |
| Present | 49 (31.2) |
| Missing data | 3 (1.9) |
| PgR status |
| Negative | 12 (7.6) |
| Positive | 94 (59.9) |
| Missing data | 51 (32.3) |
| ER status |
| Negative | 8 (5.1) |
| Positive | 98 (62.4) |
| Missing data | 51 (32.3) |
| ERBB2 status |
| Negative | 89 (56.7) |
| Positive | 17 (10.8) |
| Missing data | 51 (32.3) |
Controls
Healthy endometrium from patients treated for
ailments other than EC was collected as control samples. Control
samples were accessed histopathologically; no hyperplasia was
observed. Pooled DNA and RNA was isolated from frozen tissue
samples of five healthy donors and used for qPCR assay
optimisation, standard curve generation and as a calibrator for the
gene dosage and expression evaluation test in 157 EC tumour
samples.
The utility of the assay was verified using the
human cancer cell line SK-BR-3 with confirmed amplification of the
genes ERBB2, MYC, TOP2A and human cancer cell
line MDA-MB-361 with confirmed amplification of ERBB2
(27). Additionally, we used
reference DNA (Roche, Switzerland) and DNA isolated from healthy
breast tissue to verify the performance of the EC DNA.
DNA and RNA isolation
Prior to nucleic acid isolation, tissue specimens
(25 mg/sample) were homogenised (1 min, 6,000 rpm speed) using a
MagNA Lyser (Roche). DNA and RNA were isolated with AllPrep DNA/RNA
Mini kit (Qiagen, Germany) according to the manufacturer’s
instructions. After the isolation, the DNA/RNA concentration and
purity were determined using a Spectrophotometer ND-1000 (NanoDrop,
USA). Good quality of the DNA was defined as an A260/280 nm ratio
between 1.70 and 1.90. Good quality of the RNA was defined as an
A260/280 nm ratio of ~2. The DNA and RNA samples were stored at −20
and −80°C, respectively.
RNA was subsequently reverse transcribed to cDNA
with the Transcriptor First Strand cDNA synthesis kit (Roche)
according to the manufacturer’s instructions using random hexamer
primers. The total amount of 1,000 ng RNA was used per each reverse
transcription reaction.
Genes and primers
The gene dosages of ERBB1, ERBB2,
ERBB3, ERBB4, MYC, CCND1, ESR1,
PI3K and TOP2A were determined by qPCR with Power
SYBR-Green Mastermix (Applied Biosystems, USA), using the amyloid
precursor protein (APP) gene and 3P (RNA, U4 small
nuclear pseudogene) gene as a reference. The potential reference
genes were chosen based on a search performed in the Atlas of
Genetics and Cytogenetics in Oncology and Haematology (http://www.atlasgeneticsoncology.org/).
APP and 3P stability was verified against superoxide
dismutase 2 (SOD2) using geNorm software (28). The primers were designed using
Beacon Designer Software version 7.6 (Bio-Rad, USA). Their
specificity was examined by PCR, followed by electrophoretic
separation on 1.5% agarose gel stained with ethidium bromide (final
concentration of 0.5 μg/ml). Electrophoresis was performed in 0.5X
TBE buffer at 100 V (5 V/cm) for 30 min. For visualisation of the
bands, the gel was placed in a Molecular Imager® GelDoc™
XR photoimaging system and analysed using Quantity-One software
(both from Bio-Rad) after irradiation with UV light (302 nm). The
primer parameters are summarised in Table II. The quantity of DNA/well was 40
ng.
| Table IIPrimer parameters. |
Table II
Primer parameters.
| Name | Sequence
5′>3′ | No. of base
pairs | Product length
(bp) | Reference
sequence | Final primer
concentration (nM) |
|---|
| 3P | F: CTC ATA GGC GAA
GGC ACC AG | 20 | 112 | NT_022517 | 300 |
| 3P | R: GGT CAA GTT CCG
CAC ACA CC | 20 | | | 300 |
| APP | F: AGC CCA GAA GGT
GTC AAA CA | 20 | 60 | NG_007376 | 300 |
| APP | R: CAT CTT CAT GTC
CGT TGC AT | 20 | | | 300 |
| CCND1 | F: AGG AGG TGT GAG
GAG GAG | 18 | 102 | NG_007375 | 300 |
| CCND1 | R: CTG GAA GTC AAC
GGT AGC | 18 | | | 300 |
| MYC | F: CGT GAC CAG ATC
CCG GAG TT | 20 | 134 | NG_007161 | 300 |
| MYC | R: CGT TTC CGC AAC
AAG TCC TCT | 21 | | | 200 |
| ERBB1 | F: GCA GAC AGG ATG
ACC AAG AG | 20 | 91 | NG_007726 | 300 |
| ERBB1 | R: GTA GGC AGA TGA
ACA GGA ACC | 21 | | | 300 |
| ERBB2 | F: CTG CTG GTC GTG
GTC TTG G | 19 | 93 | NG_007503 | 300 |
| ERBB2 | R: CTG CAG CAG TCT
CCG CAT C | 19 | | | 300 |
| ERBB3 | F: GAG AGG TGT GAG
GTG GTG ATG G | 22 | 114 | NG_011529 | 300 |
| ERBB3 | R:AAG AGG AGC AGG
TTG AGG AAG G | 22 | | | 300 |
| ERBB4 | F: CGC TTC GTC TCT
TCT CGT TTC C | 22 | 90 | NG_011805 | 300 |
| ERBB4 | R: GAA CAA CAA TGG
CAC GCT AAT CC | 23 | | | 200 |
| ESR1 | F: ACA TGG ACA CCT
CCC AGT C | 19 | 60 | NG_008493.1 | 300 |
| ESR1 | R: ACA GAC TAA CAC
AGC CCA TC | 20 | | | 300 |
| PI3K | F: GCT TCC AAC AAT
CCT CTT CCG TAG | 24 | 118 | NG_012113.1 | 200 |
| PI3K | R: GCA CTG AAT CTG
TAG CGA ACT TCC | 24 | | | 300 |
| TOP2A | F: GCC AAC TCA GCC
GTT CAT AGG | 21 | 101 | NG_027678 | 200 |
| TOP2A | R: CGA AGC AGA CCA
GCC AAT CC | 20 | | | 200 |
The MGB1 RNA expression level was determined
by RT-qPCR with TaqMan® Universal PCR Master Mix
(Applied Biosystems), using hypoxanthine phosphoribosyltransferase
1 (HPRT1) as a reference. The stability of the HPRT1
gene expression was verified relative to the expression of
glyceraldehyde 3-phosphate dehydrogenase (GAPDH) and β-actin
(ACTB). We used TaqMan® Expression Assays
(Applied Biosystems) as follows: HPRT1 Endogenous Control
Hs99999909_m1; MGB1 Gene Expression Assay Hs00935948_m1. The
quantity of cDNA/well was 75 ng.
Calculating the optimal primer
concentration
The optimal forward/reverse primer concentration was
based on determination of the minimum quantification cycle (Cq) and
the maximum ΔRn while minimizing nonspecific
amplification. The reaction volumes were 20 μl. We used 40 ng of
genomic DNA as a template. Each of the nine forward/reverse primer
concentration combinations (200/200, 300/200, 400/200, 200/300,
300/300, 400/300, 200/400, 300/400 and 400 nM/400 nM) was run in
triplicate. Quantities of gene expression assays and
TaqMan® Universal PCR Master Mix were used according to
the manufacturer’s instructions.
Assessment of gene dosage and mRNA
expression
After the optimisation, the components of the
prepared mastermix in the final protocol used for qPCR standard
curve generation as well as ERBB1, ERBB2,
ERBB3, ERBB4, MYC, CCND1, ESR1,
PI3K and TOP2A gene dosage determination in 157 EC
tumour samples were: 10 μl of 2X Power SYBR-Green Mastermix,
0.4–0.6 μl of 10 μM forward/reverse primer (Sigma-Aldrich,
Germany), 40 ng of DNA in the volume of 4 μl and water added into
the reaction mixture to obtain a final volume of 20 μl.
Reactions amplifying ERBB1, ERBB2,
ERBB3, ERBB4, MYC, CCND1, ESR1,
PI3K, TOP2A and two reference genes (APP and
3P) were performed in separate wells. The reactions were
always prepared in duplicate on 96-well plates and sealed with
optical tape (both from Applied Biosystems). For each tested gene,
a negative control (no template DNA) was always included. A melting
curve analysis was also included in all gene dosage
determinations.
Reactions amplifying MGB1 and HPRT1
cDNA were performed in separate wells. The reactions were always
prepared in triplicate on 96-well plates and sealed with optical
tape (both from Applied Biosystems). For each tested gene, a
negative control (RNA and reverse transcription mix without reverse
transcriptase) was always included.
The thermal profiles used were the default settings
of the manufacturer for either SYBR-Green or TaqMan®
probe assays. Reports containing the Cq values were generated using
StepOne Software v2.2.2 (Applied Biosystems).
Assay evaluation and quality control
To overcome the shortcomings of the in-built
StepOnePlus™ software normally used to analyse data, we utilized
qbasePLUS software, version 2.3 (Biogazelle, Belgium)
(29) for gene dosage and
expression quantification. The software uses a modified ΔΔCt method
based on multiple reference genes and gene specific amplification
efficiencies. It also possesses an algorithm that allows for
inter-run calibration, thus taking into account run-to-run
variation.
Average Cq values from the duplicates/triplicates
were used for gene dosage/mRNA expression calculation. Inter-run
calibration was implemented. The reference target stability was
verified, the values of M and CV were <0.5 and 0.2,
respectively. The targets were scaled to the average. User-defined
amplification efficiencies separate for each gene were assumed. The
reaction efficiencies of ERBB1, ERBB2, ERBB3,
ERBB4, MYC, CCND1, ESR1, PI3K,
TOP2A, APP, 3P, MGB1 and HPRT1
under the optimised conditions were calculated from the five-point
standard curves prepared by amplifying the pooled control genomic
DNA/cDNA, diluted over four orders of magnitude. Standard curves
were automatically generated by the StepOne Software v2.2.2.
Baseline cycles and thresholds were set manually and the Cqs were
calculated automatically by the software using an in-built
algorithm.
The integrity of the nucleic acids in randomly
selected samples was checked by visualisation of the
electrophoretically separated post-PCR products (6,4 kb fragment of
CYP2D6 gene) and when compared with the molecular marker
GeneRuler™ 1 kb DNA Ladder (Thermo Scientific, USA).
The presence of the PCR inhibitors was evaluated by
performing qPCR with pooled control DNA and genomic DNA from
healthy breast tissue and reference DNA from Roche, followed by
comparison of the Cq values. The reactions were conducted in
triplicate on a test plate, with a negative control (no template
DNA) included.
The reaction specificity was verified through a melt
curve analysis (included in every run) and by visualisation of the
electrophoretically separated random post-PCR products for all
studied genes.
Statistical analysis
STATISTICA software version 10 (StatSoft Co., USA)
was used for all calculations, with the exception of unsupervised
hierarchical clustering. Data visualisation, dendrograms and
complete linkage computations were performed with the use of the
Java Development kit 7u21 script running in Java Runtime
Environment 7. The tests that were used and their applications
were: testing normality of the data set, Shapiro-Wilk test,
correlations between continuous relative gene quantities,
Spearman’s correlation, correlations between continuous or
categorical relative gene quantities and clinicopathological data
of the patients, Mann-Whitney U test or crosstabs statistics with
Pearson’s Chi-square test, respectively. The Kaplan-Meier estimator
was employed for survival analysis and the results were verified
with the Cox F-test. The endpoint for the present study was overall
survival (OS). OS was defined as the time from sample collection to
mortality or censoring. Censoring was defined as loss of follow-up
or alive at the end of follow-up. Statistical significance in all
the aforementioned tests was assumed when p≤0.05. Cox proportional
hazards regression analysis was used to identify the independent
predictors of OS. Univariate predictors significant with a value of
p≤0.10 were entered into a step-wise multivariate model to identify
those with independent prognostic information. The study was
performed in accordance with the REMARK criteria (30).
Results
Flow of samples
Of the 157 RNA samples, 156 (99.4%) had amplifiable
cDNA. Amplifiability of the DNA samples differed depending on the
target, ranging from 152 (97.5%) to 156 (99.4%).
Assay evaluation and quality control
results
The parameters of the standard curves obtained for
ERBB1, ERBB2, ERBB3, ERBB4, MYC,
CCND1, ESR1, PI3K, TOP2A, APP,
3P, MGB1 and HPRT1 indicated good reaction
performance and the calculated efficiencies of the reactions were
within the range of 90.4–109.9% (Table III).
| Table IIIReaction efficiencies. |
Table III
Reaction efficiencies.
| Gene | Efficiency | Slope | R2 |
|---|
| APP | 109.6 | −3.112 | 0.997 |
| 3P | 109.7 | −3.106 | 0.999 |
| MYC | 91.4 | −3.546 | 0.993 |
| CCND1 | 97.3 | −3.389 | 0.992 |
| ERBB1 | 96.6 | −3.406 | 0.994 |
| ERBB2 | 90.4 | −3.575 | 0.987 |
| ERBB3 | 91.7 | −3.536 | 0.987 |
| ERBB4 | 96.7 | −3.404 | 0.98 |
| ESR1 | 109.9 | −3.104 | 0.992 |
| PI3K | 90.5 | −3.572 | 0.98 |
| TOP2A | 96.8 | −3.4 | 0.992 |
| HPRT1 | 96.8 | −3.4 | 0.999 |
| MGB1 | 108.2 | −3.14 | 0.964 |
The isolated genomic DNA was confirmed to have high
integrity and was seen as a single band on the electrophoretic gel.
To confirm the high quality of the DNA, we performed a long PCR
reaction on randomly chosen isolated material; the amplified
CYP2D6 gene (6,4 kb) was seen as a single clear band. Each
of the analysed targets was examined through a melt curve analysis
and electrophoresis for the presence of primer dimers or unspecific
bands; none were observed. No inhibition of the real-time PCR
reaction was observed as the recorded Cq values for the APP
and 3P reference genes in the calibrator DNA, the DNA from
healthy breast tissue, and the DNA supplied by Roche, the latter
being free of qPCR inhibitors, had differences in Cqs <0.5.
The repeatability (intra-assay variation) and
reproducibility (inter-assay variation) of the assay were measured
as the average mRNA expression/gene dosage in pooled controlled
mRNA/DNA on one plate (three reactions) or on four randomly
selected separate plates, respectively. The assay was characterised
by low intra-assay and inter-assay variation (data not shown).
The utility of the assay was verified with the use
of the cell lines SK-BR-3 and MDA-MB-361, which had confirmed
amplification of the genes ERBB2, MYC, TOP2A
and ERBB2, respectively (27). Additionally, one copy of the
TOP2A gene is known to be deleted in MDA-MB-361 (31). All recorded values for ERBB2,
MYC and TOP2A in the cell line SK-BR-3 were higher
than the assumed cut-offs. The ERBB2 gene dosage in
MDA-MB-361 was also higher than the cut-off and, although the assay
is not designed to measure deletions, the relative quantity of
TOP2A was indeed decreased in this cell line (data not
shown).
mRNA expression and gene dosage in
clinical samples, cut-point determination and unsupervised data
analysis
The relative quantities of gene expression and gene
dosage were scaled to average. MGB1 overexpression was
recognised when there was at least 2-fold change of MGB1
expression in comparison to the calibrator sample. The
experimentally determined cut-off values were used in the
evaluation of gene aberrations; as cut-offs, we used the most
extreme values within the control samples.
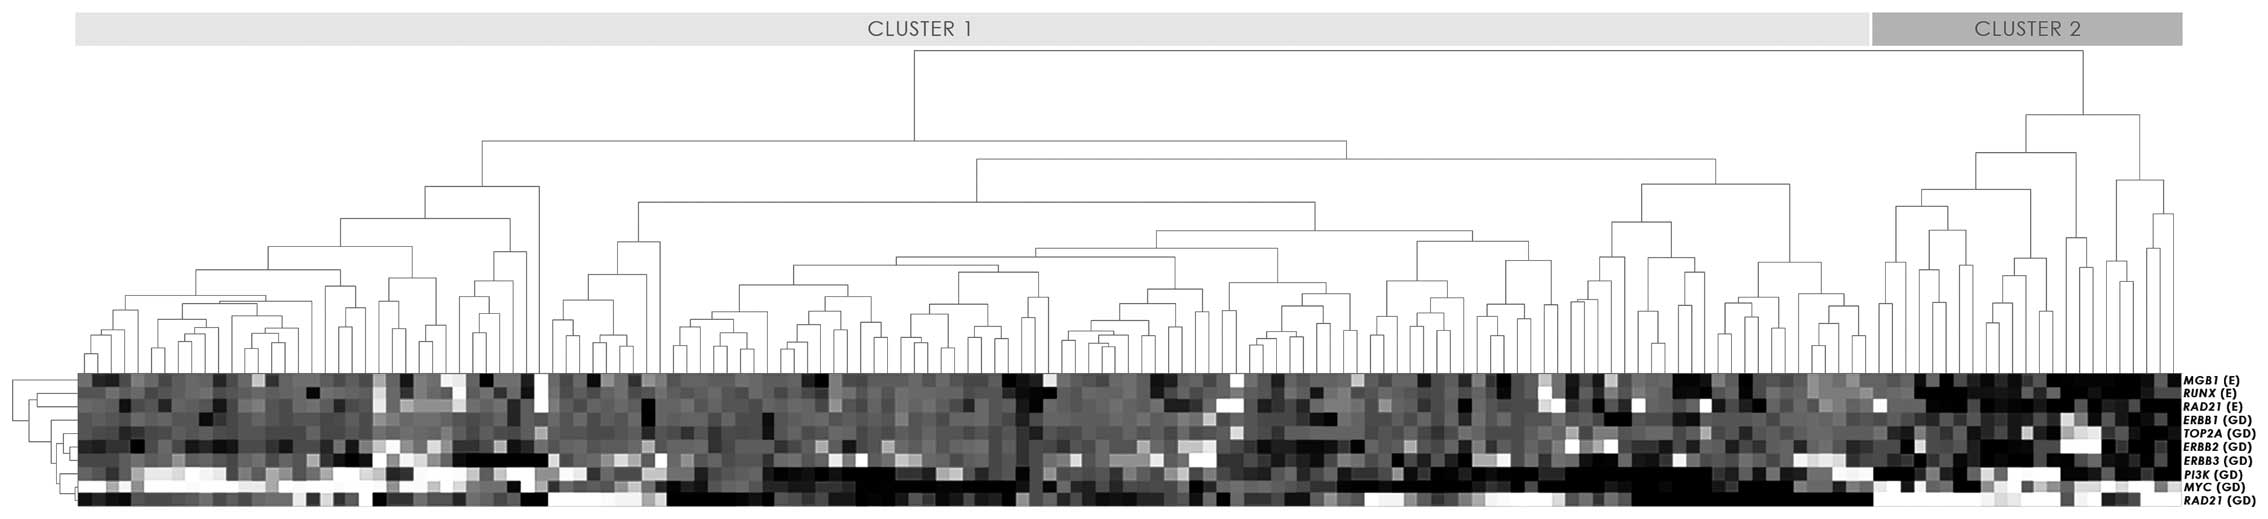
Unsupervised hierarchical clustering was implemented
to distinguish the gene aberration/expression profiles within the
group of 157 EC patients. Out of the studied genes, ERBB4,
CCND1 and ESR1 were excluded from the analysis as
factors carrying little information. Instead, we included the
RUNX1 and RAD21 mRNA expression levels, which were
previously reported (32).
Unsupervised analysis of gene aberrations and mRNA expression
distinguished two major groups of tumours (clusters 1 and 2;
Fig. 1). Patients within cluster 2
generally had increased gene dosages of ERBB3 and elevated
expression of MGB1, RUNX1 and RAD21.
Correlation of gene dosages and mRNA
expression with clinical and pathological data
The gene dosages of the individual genes often
correlated with each other. Particularly strong correlations
occurred in the case of ERBB1 and CCND1 (p=0.000002),
ERBB1 and ERBB3 (p=0.000003), PI3K and
MGB1 (p=0.00003), ERBB3 and TOP2A (p=0.00005)
and ERBB3 and PI3K (p=0.00005). A higher stage of the
disease was correlated with increased levels of ERBB2,
ERBB3, ERBB4, PI3K, MYC and
TOP2A (p=0.05, p=0.003, p=0.02, p=0.02, p=0.007, p=0.04,
respectively). Histology type II was associated with elevated
levels of ERBB1 (p=0.002), ERBB3 (p=0.01),
PI3K (p=0.05) and MYC (p=0.02), and decreased
expression of MGB1 (p=0.002). The presence of metastases was
associated with higher PI3K, MYC and ESR1 gene
dosage (p=0.04, p=0.002, p=0.02, respectively), while a high grade
was associated with increased levels of ERBB1 (p=0.02),
PI3K (p=0.04) and MYC (p=0.006) and decreased level
of MGB1 (p=0.0008). Cervical invasion was correlated with
increased gene dosage of MYC (p=0.05) and ESR1
(p=0.02). Myometrial infiltration was associated with elevated
TOP2A levels (p=0.02; Table
IV).
| Table IVMedian gene dosage and expression in
the context of clinicopathological data. |
Table IV
Median gene dosage and expression in
the context of clinicopathological data.
| | CCND1 | | | ERBB1 | | | ERBB2 | | | ERBB3 | | | ERBB4 | |
|---|
| No. of cases | Median gene
dosage | P-value | No. of cases | Median gene
dosage | P-value | No. of cases | Median gene
dosage | P-value | No. of cases | Median gene
dosage | P-value | No. of cases | Median gene
dosage | P-value |
|---|
| Histology | | | 0.15 | | | 0.002 | | | 0.28 | | | 0.01 | | | 0.33 |
| Type I | 121 | 1.00 | | 121 | 0.98 | | 123 | 0.97 | | 121 | 0.97 | | 123 | 0.97 | |
| Type II | 32 | 1.01 | | 32 | 1.08 | | 33 | 0.99 | | 32 | 1.00 | | 33 | 1.00 | |
| Stage | | | 0.09 | | | 0.22 | | | 0.05 | | | 0.003 | | | 0.02 |
| I, II | 133 | 1.00 | | 133 | 0.98 | | 134 | 0.97 | | 133 | 0.97 | | 134 | 0.97 | |
| III, IV | 20 | 1.04 | | 20 | 1.03 | | 22 | 0.99 | | 20 | 1.10 | | 22 | 1.03 | |
| Grade | | | 0.07 | | | 0.02 | | | 0.38 | | | 0.06 | | | 0.20 |
| 1, 2 | 127 | 1.00 | | 127 | 0.98 | | 129 | 0.97 | | 127 | 0.97 | | 129 | 0.97 | |
| 3 | 22 | 1.03 | | 22 | 1.11 | | 23 | 0.99 | | 22 | 1.00 | | 23 | 1.00 | |
| Cervical
invasion | | | 0.55 | | | 0.75 | | | 0.34 | | | 0.64 | | | 0.35 |
| Absent | 111 | 1.00 | | 111 | 0.98 | | 112 | 0.97 | | 111 | 0.98 | | 112 | 0.97 | |
| Present | 40 | 1.01 | | 40 | 0.99 | | 42 | 1.00 | | 40 | 0.95 | | 42 | 1.01 | |
| Myometrial
infiltration | | | 0.64 | | | 0.40 | | | 0.25 | | | 0.38 | | | 0.72 |
| ≤1/2 | 87 | 1.01 | | 87 | 0.97 | | 87 | 0.99 | | 87 | 0.98 | | 87 | 1.00 | |
| >1/2 | 65 | 0.99 | | 65 | 1.00 | | 68 | 0.96 | | 65 | 0.96 | | 68 | 0.96 | |
| Distant
metastases | | | 0.26 | | | 0.23 | | | 0.43 | | | 0.56 | | | 0.18 |
| Absent | 105 | 0.99 | | 105 | 0.98 | | 105 | 0.97 | | 105 | 0.97 | | 105 | 0.97 | |
| Present | 46 | 1.01 | | 46 | 1.00 | | 48 | 0.99 | | 46 | 0.97 | | 48 | 1.01 | |
|
| | PI3K | | | MYC | | | ESR1 | | | TOP2A | | | MGB1 | |
|
| Histology | | | 0.05 | | | 0.02 | | | 0.27 | | | 0.38 | | | 0.002 |
| Type I | 123 | 0.96 | | 123 | 0.94 | | 121 | 1.00 | | 121 | 1.00 | | 122 | 1.49 | |
| Type II | 33 | 1.00 | | 33 | 1.01 | | 31 | 1.05 | | 32 | 0.99 | | 34 | 0.19 | |
| Stage | | | 0.02 | | | 0.007 | | | 0.06 | | | 0.04 | | | 0.50 |
| I, II | 134 | 0.96 | | 134 | 0.93 | | 132 | 1.00 | | 133 | 1.00 | | 134 | 1.08 | |
| III, IV | 22 | 1.02 | | 22 | 1.00 | | 20 | 1.22 | | 20 | 1.05 | | 22 | 0.89 | |
| Grade | | | 0.04 | | | 0.006 | | | 0.20 | | | 0.56 | | | 0.0008 |
| 1, 2 | 129 | 0.96 | | 129 | 0.93 | | 127 | 1.01 | | 127 | 1.00 | | 128 | 1.49 | |
| 3 | 23 | 1.02 | | 23 | 1.04 | | 21 | 1.18 | | 22 | 0.99 | | 24 | 0.10 | |
| Cervical
invasion | | | 0.08 | | | 0.05 | | | 0.02 | | | 0.88 | | | 0.53 |
| Absent | 112 | 0.96 | | 112 | 0.93 | | 110 | 0.99 | | 111 | 1.00 | | 113 | 0.95 | |
| Present | 42 | 0.99 | | 42 | 0.98 | | 40 | 1.17 | | 40 | 1.00 | | 41 | 1.21 | |
| Myometrial
infiltration | | | 0.82 | | | 0.33 | | | 0.20 | | | 0.02 | | | 0.82 |
| ≤1/2 | 87 | 0.96 | | 87 | 0.93 | | 87 | 1.00 | | 87 | 1.02 | | 87 | 0.95 | |
| >1/2 | 68 | 0.98 | | 68 | 0.95 | | 64 | 1.06 | | 65 | 0.98 | | 68 | 1.67 | |
| Distant
metastases | | | 0.04 | | | 0.002 | | | 0.02 | | | 0.42 | | | 0.84 |
| Absent | 105 | 0.95 | | 105 | 0.93 | | 103 | 0.98 | | 105 | 1.00 | | 105 | 0.95 | |
| Present | 48 | 0.99 | | 48 | 0.99 | | 46 | 1.17 | | 46 | 1.00 | | 48 | 1.15 | |
When we compared the groups of positive vs. negative
samples within all the studied genes, particularly strong positive
correlations were observed between the ERBB1 status and
histology type II (p=0.00001), the ERBB1 status and a higher
grade (p=0.00005), the ERBB3 status and a higher stage
(p=0.00005) and the ESR1 status and cervical invasion
(p=0.0003). Based on the analysis of separate genes, the gene
dosage pattern of the ERBB family and its downstream effectors,
PI3K and MYC, was analysed in more detail. Upregulation of the ERBB
PI3K/Akt pathway was assumed whenever any of the ERRB genes
together with PI3K and/or MYC were found to be
amplified. The ERBB PI3K/Akt pathway was upregulated in 31 (20%) of
156 cases. Activation of the pathway was positively correlated with
a higher stage: p=0.001, 21/134 (15.7%) positive cases vs. 10/22
(45.5%); grade: p=0.001, 19/129 (14.7%) vs. 10/23 (43.5%);
histological type II of the disease: p=0.0003, 17/123 (13.8%) vs.
14/33 (42.4%), as well as with the presence of metastases: p=0.02,
16/105 (15.2%) vs. 15/48 (31.3%).
Although the clusters were distinctive with
generally higher gene dosages reported for cluster 2, there was no
correlation between the results of the clustering and the
clinicopathological characteristics.
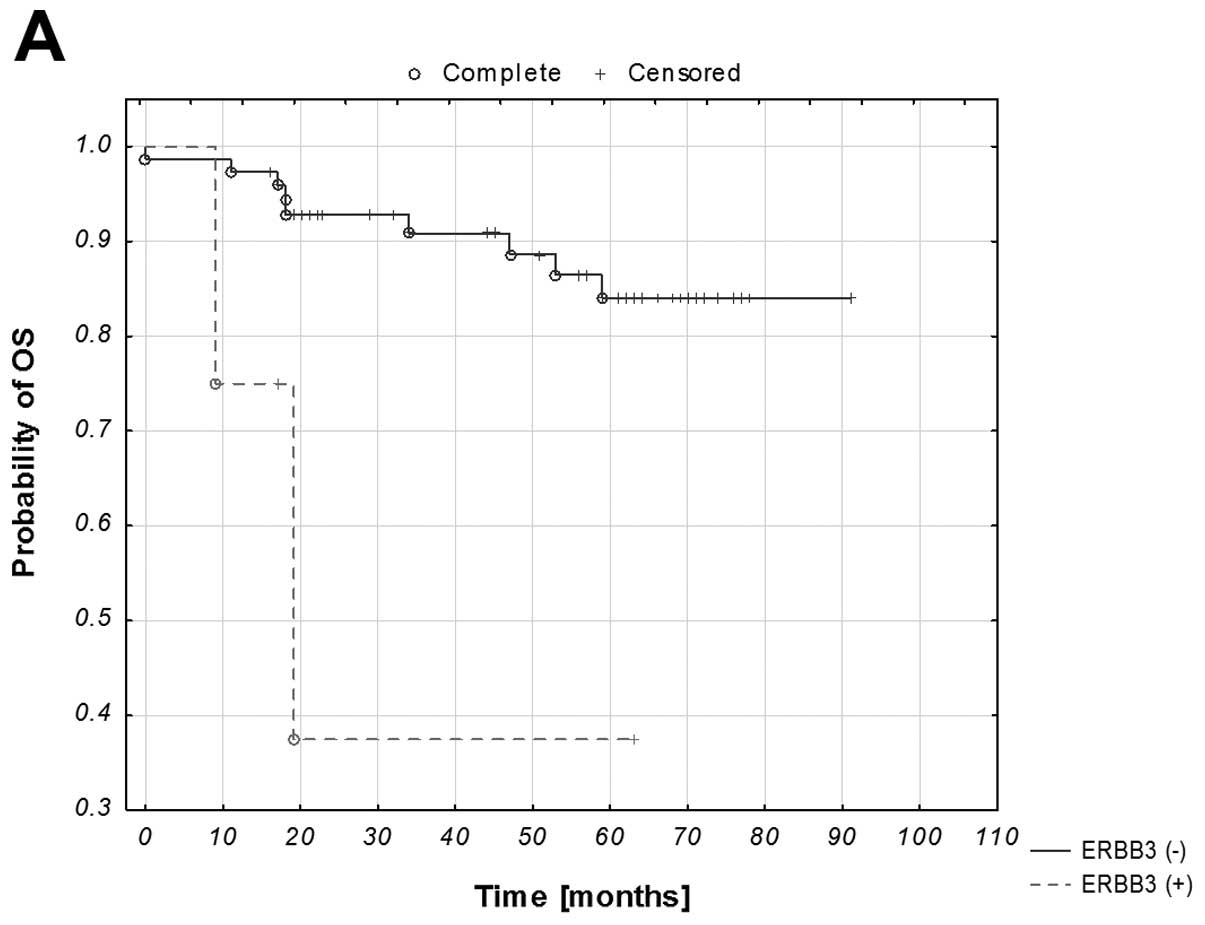
Survival analysis
Of all the studied genes, with additional analysis
of the ERBB PI3K/Akt pathway and hierarchical clustering,
statistical significance with respect to the OS was reached only in
the case of ERBB3 and the generated clusters (both p=0.05;
Fig. 2A and B). The pattern of the
remaining graphs, with p-values >0.05, either had the expected
tendency (shorter OS within the groups with gene amplification) or
was inconclusive.
A univariate analysis was performed for all the
clinicopathological data, the studied genes and the distinguished
clusters. Stage, grade, PR status, ERBB3 status and the
clusters correlated with shorter OS (all p≤0.10), and these
parameters were included in a step-wise multivariate analysis,
eventually yielding p-values of 0.01 and 0.13 for the stage, and
ERBB3, respectively. The hazard ratios for the stage and
ERBB3 were: 4.94 (95% CI, 1.40–17.40), 3.27 (95%CI,
0.68–15.65; Table V).
| Table VUnivariate and multivariate analysis
of clinicopathological and molecular parameters as prognostic
factors in endometrial cancer patients. |
Table V
Univariate and multivariate analysis
of clinicopathological and molecular parameters as prognostic
factors in endometrial cancer patients.
| Univariate
analysis | Multivariate
analysis |
|---|
| Variable | HR | 95% CI | P-value | HR | 95% CI | P-value |
|---|
| Histology (type II
vs. I) | 2.08 | 0.71–6.16 | 0.18 | | | |
| Stage (III, IV vs.
I, II) | 6.02 | 1.84–19.66 | 0.003 | 4.94 | 1.4–17.40 | 0.01 |
| Grade (3 vs. 1,
2) | 1.87 | 1.07–3.25 | 0.03 | | NS | |
| Obesity (present
vs. absent) | 1.70 | 0.54–5.36 | 0.36 | | | |
| Cervical invasion
(present vs. absent) | 1.45 | 0.46–4.59 | 0.52 | | | |
| Myometrial
infiltration (present vs. absent) | 2.23 | 0.80–6.25 | 0.13 | | | |
| Metastases (present
vs. absent) | 2.34 | 0.83–6.61 | 0.11 | | | |
| PgR status
(positive vs. negative) | 0.33 | 0.10–1.05 | 0.06 | | NS | |
| ER status (positive
vs. negative) | 0.30 | 0.07–1.35 | 0.12 | | | |
| ERBB2 status
(positive vs. negative) | 1.43 | 0.40–5.12 | 0.58 | | | |
| Clusters (2 vs.
1) | 2.57 | 0.87–7.54 | 0.09 | | NS | |
| CCND1 status
(positive vs. negative) | 1.53 | 0.23–10.19 | 0.66 | | | |
| ERBB1 status
(positive vs. negative) | 1.05 | 0.27–4.13 | 0.94 | | | |
| ERBB2 status
(positive vs. negative) | 2.72 | 0.78–9.55 | 0.12 | | | |
| ERBB3 status
(positive vs. negative) | 5.31 | 1.24–22.90 | 0.02 | 3.27 | 0.68–15.65 | 0.13 |
| ERBB4 status
(positive vs. negative) | 1.08 | 0.25–4.61 | 0.91 | | | |
| PI3K status
(positive vs. negative) | 0.82 | 0.11–5.90 | 0.84 | | | |
| MYC status
(positive vs. negative) | 1.73 | 0.56–5.37 | 0.34 | | | |
| ESR1 status
(positive vs. negative) | 0.12 | 0.00–495.96 | 0.62 | | | |
| TOP2A status
(positive vs. negative) | 2.12 | 0.51–8.80 | 0.30 | | | |
| MGB1 status
(positive vs. negative) | 0.46 | 0.13–1.64 | 0.23 | | | |
Discussion
Copy number variations belong to frequently found
genetic alterations within cancerous tissues (33) and we have established a multimarker
quantitative PCR (qPCR) platform to examine genes that may carry
such aberrations and thus be of significance in endometrial cancer
(EC) biology. The gene dosages of TOP2A, ERBB1,
ERBB2, ERBB3, ERBB4, MYC, CCND1,
ESR1, PI3K and RAD21 were determined in
fresh-frozen tumour samples using a SYBR-Green-based qPCR assay.
Additionally, the RNA expression level of the MGB1 gene was
examined by RT-qPCR.
The designed platform, exploited on a large sample
size, proved to be a fast and simple way for direct analysis of the
genes involved in uterine carcinogenesis. The results obtained from
versatile quality control tests showed good reaction performance,
specificity of the designed primers, low intra-assay and
inter-assay variation, high DNA/RNA integrity and quality, and thus
low sample loss. We performed a utility verification using cancer
cell lines, and the results, revealed the same aberrations that
have been reported in the literature. The developed protocol allows
for highly coherent gene dosage and transcriptomic
measurements.
Mammaglobin 1 was first detected as a protein that
is specifically overexpressed in breast cancer (34). Studies by Classen-Linke et al
(35) demonstrated that this
expression is not restricted to breast tissue; it may also be
detected in the endometrium where it changes in a hormone-dependent
manner. To the best of our knowledge, this is the first study to
measure the MGB1 RNA level in EC to understand its clinical
significance. Our findings show that in EC, the loss of MGB1
expression, not overexpression, strongly correlates with a higher
tumour grade and is characteristic of histological type II.
Our results demonstrate that elevated ERBB1,
ERBB3 and MYC gene dosages are correlated with more
aggressive tumour behavior. Yeramian et al also found
MYC to be deregulated in EC (10). However, these findings only involve
gene expression. Data on MYC, ERBB1 and ERBB3
copy number variations in EC are scarce or non-existent. Raeder
et al analysed the amplifications of the 8q24 region in EC
samples but did not observe any link between MYC copy number
alterations and disease progression (36). Esteller et al studied the
role of ERBB1 in EC, but they did not observe the
ERBB1 gene amplification in any of the cases studied
(37). This may be due to the
limitations of the method of differential PCR, which is much less
sensitive than qPCR. Liang et al demonstrated that the
overexpression of wild-type ERBB3 significantly increased the
survival of Ba/F3 cells (38),
which is consistent with the proposed role of ERBB3 as an
oncogene. Our studies are also in agreement with the study of
Saghir et al where ERBB3 overexpression was indicated as a
characteristic typical for EC (39). It is well established in breast
cancer that the amplification of genes belonging to the ERBB family
results in the overexpression of tyrosine kinase receptors and our
findings suggest that the same mechanism occurs in EC.
The borderline statistical significance of
ERBB2 gene dosage in the context of the stage of the disease
may be explained by the fact that ERBB2 amplification was
found to represent a rather rare event in EC (40). Nevertheless, Rolitsky et al
found ERBB2 amplification to be correlated with type II EC,
which supports our findings (41).
We demonstrated that the activation of the PI3K
pathway is crucial in EC. These results are in agreement with
studies by Salvesen et al (21) where amplification of a region
including PIK3CA was significantly associated with unfavourable
recurrence-free survival. Our data also indicated that increased
ERBB/PI3K pathway gene dosage correlated with histological type II,
higher stage and higher grade as well as the presence of
metastases.
The results described in the present study may
facilitate the development of targeted therapies, developed to
inhibit cellular signalling that leads to cell growth and
proliferation in EC. Several tyrosine kinase receptor inhibitors
are available, including ERBB1 inhibitors (gefitinib, erlotinib,
lapatinib, cetuximab) and the ERBB2 inhibitor, trastuzumab. A phase
II study on the use of cetuximab in recurrent EC is currently being
carried out (42). There have also
been trials on the efficacy of trastuzumab in ERBB2-positive EC
patients. Although these studies did not report any activity
(43,44), further clinical evaluation of the
use of trastuzumab or combination regiments may still be worth
verifying as it is possible that this drug may be effective in a
properly selected group of EC patients (45).
Although the clusters generated in the present
study did not possess strikingly different clinical and
histopathologic characteristics, cluster 2 in general did contain
higher gene dosages with the exception of MYC and
RAD21. Additionally, the survival analysis revealed a
significantly shorter OS in cluster 2, suggesting that this
clustering distinction may in fact serve as a prognostic
factor.
The key limitation of this study was the short
follow-up period and lack of survival data for a considerable
number of patients. As a result, the survival analyses rarely
reached statistical significance, not only in the case of the
studied genes but also in the analysis of the clinicopathological
data. Nevertheless, even without statistical significance, almost
all the studied potential markers retained the expected tendency
(shorter OS for increased gene dosage/decreased expression), with
few Kaplan-Meier curves being inconclusive due to a small sample
size. The survival studies by Konecny et al (40), which were performed on a larger
cohort of EC patients, did reach statistical significance, but
these analyses focused mainly on type II EC, with a median
follow-up of 83 months. The survival data for the cohort examined
in the present study are still being collected. The prognostic
value of the studied biomarkers is to be updated.
Another limitation of the present study is
associated with tumour heterogeneity. The samples used for DNA/RNA
isolation may not reflect the heterogeneity across a tumour, as
they were excised manually from a single tumour region and only
small tissue fragments were used. Perhaps a microdissection
technique of formalin-fixed paraffin-embedded EC samples may be
applied in future studies.
Our results demonstrate the utility of cancer
genome characterisation in clinical specimens. The gene dosage
pattern of the ERBB signalling network and the PI3K/Akt pathway
differs in EC depending on the stage of the disease and the
presence of metastases. The PI3K pathway is of particular
importance in patients with aggressive disease. However, the
prognostic value of the genes studied here remains to be determined
in further survival studies. The results facilitate the
understanding of the pathogenesis of EC and may also contribute to
the development of more effective diagnostic tools. The potential
for the application of this direct and rapid assay for EC patients
is demonstrated in the case of the ERBB PI3K/Akt signalling
pathway, whose status may provide additional diagnostic
information. The developed highly sensitive and reproducible
platform is feasible for EC characterisation.
Acknowledgements
The present study was supported by a grant from the
National Science Centre (5715/B/P01/2010/38) and a grant from the
Foundation for Polish Science Parent-Bridge Programme co-financed
by the European Union within the European Regional Development Fund
(DPS-424-5053/11). The present study was co-financed by the
European Commission in the frame of the European Social Fund, by
the European Social Fund, the State Budget, and the Pomorskie
Voivodeship Budget according to the Operational Programme Human
Capital, Priority VIII, Action 8.2, Under-action 8.2.2: ‘Regional
Innovative Strategy’ within the system project of the Pomorskie
Voivodeship ‘InnoDoktorant-Scholarships for PhD students, Vth
edition’. The publication was also financed by the European Social
Fund as a part of the project ‘Educators for the elite-integrated
training program for PhD students, post-docs and professors as
academic teachers at University of Gdansk’ within the framework of
the Human Capital Operational Programme, Action 4.1.1, improving
the quality of educational offer of tertiary education
institutions. The sponsors had no involvement in the present study
design, collection, analysis and interpretation of the data,
writing of the manuscript, or the decision to submit the manuscript
for publication. The authors acknowledge Aleksandra Markiewicz for
her support during the development of the multimarker platform and
Bartosz Supernat for data visualisation, dendrogram generation,
complete linkage computations and artwork adjustments. The
manuscript was edited by Elsevier Language Editing Services.
References
|
1
|
Mirantes C, Espinosa I, Ferrer I, Dolcet
X, Prat J and Matias-Guiu X: Epithelial-to-mesenchymal transition
and stem cells in endometrial cancer. Hum Pathol. 44:1973–1981.
2013. View Article : Google Scholar : PubMed/NCBI
|
|
2
|
Wojciechowska U and Didkowska J: Cancer in
Poland in 2010. Nowotwory. 63:197–216. 2013.
|
|
3
|
Bray F, Dos Santos Silva I, Moller H and
Weiderpass E: Endometrial cancer incidence trends in Europe:
underlying determinants and prospects for prevention. Cancer
Epidemiol Biomarkers Prev. 14:1132–1142. 2005. View Article : Google Scholar : PubMed/NCBI
|
|
4
|
Bokhman JV: Two pathogenetic types of
endometrial carcinoma. Gynecol Oncol. 15:10–17. 1983. View Article : Google Scholar : PubMed/NCBI
|
|
5
|
Horn LC, Meinel A, Handzel R and Einenkel
J: Histopathology of endometrial hyperplasia and endometrial
carcinoma: an update. Ann Diagn Pathol. 11:297–311. 2007.
View Article : Google Scholar
|
|
6
|
Amant F, Moerman P, Neven P, Timmerman D,
Van Limbergen E and Vergote I: Endometrial cancer. Lancet.
366:491–505. 2005. View Article : Google Scholar : PubMed/NCBI
|
|
7
|
Randall TC and Kurman RJ: Progestin
treatment of atypical hyperplasia and well-differentiated carcinoma
of the endometrium in women under age 40. Obstet Gynecol.
90:434–440. 1997. View Article : Google Scholar : PubMed/NCBI
|
|
8
|
Sherman ME, Sturgeon S, Brinton LA, et al:
Risk factors and hormone levels in patients with serous and
endometrioid uterine carcinomas. Mod Pathol. 10:963–968.
1997.PubMed/NCBI
|
|
9
|
Ayhan A, Gultekin M and Dursun P: Textbook
of Gynaecological Oncology. Günes Publishing; Ankara: 2010
|
|
10
|
Yeramian A, Moreno-Bueno G, Dolcet X, et
al: Endometrial carcinoma: molecular alterations involved in tumor
development and progression. Oncogene. 32:403–413. 2012. View Article : Google Scholar : PubMed/NCBI
|
|
11
|
Busmanis I, Ho TH, Tan SB and Khoo KS: p53
and bcl-2 expression in invasive and pre-invasive uterine papillary
serous carcinoma and atrophic endometrium. Ann Acad Med Singapore.
34:421–425. 2005.PubMed/NCBI
|
|
12
|
Caduff RF, Johnston CM and Frank TS:
Mutations of the Ki-ras oncogene in carcinoma of the endometrium.
Am J Pathol. 146:182–188. 1995.PubMed/NCBI
|
|
13
|
Mutter GL, Lin MC, Fitzgerald JT, et al:
Altered PTEN expression as a diagnostic marker for the earliest
endometrial precancers. J Natl Cancer Inst. 92:924–930. 2000.
View Article : Google Scholar : PubMed/NCBI
|
|
14
|
Mutter GL, Boynton KA, Faquin WC, Ruiz RE
and Jovanovic AS: Allelotype mapping of unstable microsatellites
establishes direct lineage continuity between endometrial
precancers and cancer. Cancer Res. 56:4483–4486. 1996.
|
|
15
|
Strissel PL, Ellmann S, Loprich E, et al:
Early aberrant insulin-like growth factor signaling in the
progression to endometrial carcinoma is augmented by tamoxifen. Int
J Cancer. 123:2871–2879. 2008. View Article : Google Scholar : PubMed/NCBI
|
|
16
|
Rose PG: Endometrial carcinoma. N Engl J
Med. 335:640–649. 1996. View Article : Google Scholar : PubMed/NCBI
|
|
17
|
Onuma K, Dabbs DJ and Bhargava R:
Mammaglobin expression in the female genital tract:
immunohistochemical analysis in benign and neoplastic endocervix
and endometrium. Int J Gynecol Pathol. 27:418–425. 2008. View Article : Google Scholar : PubMed/NCBI
|
|
18
|
Grushko TA, Filiaci VL, Mundt AJ, et al:
An exploratory analysis of HER-2 amplification and overexpression
in advanced endometrial carcinoma: a gynecologic oncology group
study. Gynecol Oncol. 108:3–9. 2008. View Article : Google Scholar : PubMed/NCBI
|
|
19
|
Zaczek A, Wełnicka-Jaśkiewicz M, Bielawski
KP, et al: Gene copy numbers of HER family in breast cancer.
J Cancer Res Clin Oncol. 134:271–279. 2008. View Article : Google Scholar
|
|
20
|
Zaczek A, Brandt B and Bielawski KP: The
diverse signaling network of EGFR, HER2, HER3 and HER4 tyrosine
kinase receptors and the consequences for therapeutic approaches.
Histol Histopathol. 20:1005–1015. 2005.PubMed/NCBI
|
|
21
|
Salvesen HB, Carter SL, Mannelqvist M, et
al: Integrated genomic profiling of endometrial carcinoma
associates aggressive tumors with indicators of PI3 kinase
activation. Proc Natl Acad Sci USA. 106:4834–4839. 2009. View Article : Google Scholar : PubMed/NCBI
|
|
22
|
Ponzielli R, Katz S, Barsyte-Lovejoy D and
Penn LZ: Cancer therapeutics: targeting the dark side of Myc. Eur J
Cancer. 41:2485–2501. 2005. View Article : Google Scholar : PubMed/NCBI
|
|
23
|
Semczuk A and Jakowicki JA: Alterations of
pRb1-cyclin D1-cdk4/6-p16INK4A pathway in endometrial
carcinogenesis. Cancer Lett. 203:1–12. 2004. View Article : Google Scholar : PubMed/NCBI
|
|
24
|
Tsiambas E, Alexopoulou D, Lambropoulou S,
Gerontopoulos K, Karakitsos P and Karameris A: Targeting
topoisomerase IIa in endometrial adenocarcinoma: a combined
chromogenic in situ hybridization and immunohistochemistry study
based on tissue microarrays. Int J Gynecol Cancer. 16:1424–1431.
2006. View Article : Google Scholar
|
|
25
|
Pecorelli S: Revised FIGO staging for
carcinoma of the vulva, cervix, and endometrium. Int J Gynaecol
Obstet. 105:103–104. 2009. View Article : Google Scholar : PubMed/NCBI
|
|
26
|
Consultation WE: Appropriate body-mass
index for Asian populations and its implications for policy and
intervention strategies. Lancet. 363:157–163. 2004. View Article : Google Scholar : PubMed/NCBI
|
|
27
|
Jönsson G, Staaf J, Olsson E, et al:
High-resolution genomic profiles of breast cancer cell lines
assessed by tiling BAC array comparative genomic hybridization.
Genes Chromosomes Cancer. 46:543–558. 2007.PubMed/NCBI
|
|
28
|
Vandesompele J, De Preter K, Pattyn F, et
al: Accurate normalization of real-time quantitative RT-PCR data by
geometric averaging of multiple internal control genes. Genome
Biol. 3:research00342002. View Article : Google Scholar : PubMed/NCBI
|
|
29
|
Hellemans J, Mortier G, De Paepe A,
Speleman F and Vandesompele J: qBase relative quantification
framework and software for management and automated analysis of
real-time quantitative PCR data. Genome Biol. 8:R192007. View Article : Google Scholar : PubMed/NCBI
|
|
30
|
McShane LM, Altman DG, Sauerbrei W, et al:
REporting recommendations for tumor MARKer prognostic studies
(REMARK). Nat Clin Pract Oncol. 2:416–422. 2005. View Article : Google Scholar
|
|
31
|
Järvinen TA, Tanner M, Rantanen V, et al:
Amplification and deletion of topoisomerase IIα associate with
ErbB-2 amplification and affect sensitivity to topoisomerase II
inhibitor doxorubicin in breast cancer. Am J Pathol. 156:839–847.
2000.
|
|
32
|
Supernat A, Lapińska-Szumczyk S, Sawicki
S, Wydra D, Biernat W and Zaczek AJ: Deregulation of RAD21
and RUNX1 expression in endometrial cancer. Oncol Lett.
4:727–732. 2012.
|
|
33
|
Inaki K and Liu ET: Structural mutations
in cancer: mechanistic and functional insights. Trends Genet.
28:550–559. 2012. View Article : Google Scholar : PubMed/NCBI
|
|
34
|
Watson MA and Fleming TP: Mammaglobin, a
mammary-specific member of the uteroglobin gene family, is
overexpressed in human breast cancer. Cancer Res. 56:860–865.
1996.PubMed/NCBI
|
|
35
|
Classen-Linke I, Moss S, Gröting K, Beier
HM, Alfer J and Krusche CA: Mammaglobin 1: not only a
breast-specific and tumour-specific marker, but also a
hormone-responsive endometrial protein. Histopathology. 61:955–965.
2012. View Article : Google Scholar : PubMed/NCBI
|
|
36
|
Raeder MB, Birkeland E, Trovik J, et al:
Integrated genomic analysis of the 8q24 amplification in
endometrial cancers identifies ATAD2 as essential to
MYC-dependent cancers. PLoS One. 8:e548732013. View Article : Google Scholar : PubMed/NCBI
|
|
37
|
Esteller M, García A, Martínez i Palones
JM, Cabero A and Reventós J: Detection of c-erbB-2/neu and
fibroblast growth factor-3/INT-2 but not epidermal growth factor
receptor gene amplification in endometrial cancer by differential
polymerase chain reaction. Cancer. 75:2139–2146. 1995. View Article : Google Scholar
|
|
38
|
Liang H, Cheung LW, Li J, et al:
Whole-exome sequencing combined with functional genomics reveals
novel candidate driver cancer genes in endometrial cancer. Genome
Res. 22:2120–2129. 2012. View Article : Google Scholar
|
|
39
|
Saghir FS, Rose IM, Dali AZ, Shamsuddin Z,
Jamal AR and Mokhtar NM: Gene expression profiling and
cancer-related pathways in type I endometrial carcinoma. Int J
Gynecol Cancer. 20:724–731. 2010. View Article : Google Scholar : PubMed/NCBI
|
|
40
|
Konecny GE, Santos L, Winterhoff B, et al:
HER2 gene amplification and EGFR expression in a large cohort of
surgically staged patients with nonendometrioid (type II)
endometrial cancer. Br J Cancer. 100:89–95. 2009. View Article : Google Scholar : PubMed/NCBI
|
|
41
|
Rolitsky CD, Theil KS, McGaughy VR,
Copeland LJ and Niemann TH: HER-2/neu amplification and
overexpression in endometrial carcinoma. Int J Gynecol Pathol.
18:138–143. 1999. View Article : Google Scholar : PubMed/NCBI
|
|
42
|
Tsikouras P, Bouchlariotou S, Vrachnis N,
et al: Endometrial cancer: molecular and therapeutic aspects. Eur J
Obstet Gynecol Reprod Biol. 169:1–9. 2013. View Article : Google Scholar : PubMed/NCBI
|
|
43
|
Fleming GF, Sill MW, Darcy KM, et al:
Phase II trial of trastuzumab in women with advanced or recurrent,
HER2-positive endometrial carcinoma: a Gynecologic Oncology Group
study. Gynecol Oncol. 116:15–20. 2010. View Article : Google Scholar
|
|
44
|
Santin AD, Bellone S, Roman JJ, McKenney
JK and Pecorelli S: Trastuzumab treatment in patients with advanced
or recurrent endometrial carcinoma overexpressing HER2/neu. Int J
Gynaecol Obstet. 102:128–131. 2008. View Article : Google Scholar : PubMed/NCBI
|
|
45
|
Santin AD: Letter to the Editor referring
to the manuscript entitled: ‘Phase II trial of trastuzumab in women
with advanced or recurrent HER-positive endometrial carcinoma: a
Gynecologic Oncology Group study’ recently reported by Fleming et
al, (Gynecol Oncol., 116;15–20;2010). Gynecol Oncol. 118:95–96;
author reply 96–97. 2010.
|