Introduction
Ovarian cancer has the highest mortality rate of all
gynecological cancers and is the fifth leading cause of death among
women (1). Approximately 90% of
human ovarian cancers are thought to originate from the ovarian
surface epithelium (2). Ovarian
cancer is difficult to diagnose at an early stage due to the lack
of specific symptom and physical signs, and ovarian cancer has a
high rate of metastasis in the early stage. Approximately 70% of
the patients are diagnosed with FIGO stage III or IV, with a poor
5-year survival rate. Although the ideal primary cytoreductive
surgery and combination chemotherapy with platinum have improved
the prognosis of patients with advanced ovarian cancer, the 5-year
survival rate remains ~40% (3,4).
Cysteine cathepsins (CTSs) are a family of cysteine proteases which
function primarily in protein degradation in the lysosomes in the
majority of cell types (5). CTSs
are involved in the degradation and remodeling of the extracellular
matrix and are associated with cellular transformation,
differentiation, motility and adhesion. These functions are also
related to cancer cell invasion and metastasis. CTSs are believed
to play important roles in ovarian cancer invasion and metastasis.
Athanassiadou et al (6)
revealed that cathepsin D (CTSD) is an indicator of malignancy in
serous ovarian carcinoma, as its expression is higher in serous
ovarian carcinoma than in benign serous ovarian tumors. In
addition, Nishida et al (7)
observed significantly increased serum levels of CTSL in patients
with ovarian cancer (P<0.05). Moreover, ovarian cancer samples
were found to express higher levels of CTSL mRNA than those of
uterine cancer, benign ovarian tumors, and normal ovarian tissue
samples. Kolwijck et al (8)
found that the ratio of CysC/CatB was significantly lower in
patients with metastasis compared with this ratio in localized
epithelial ovarian cancer (EOC) (P=0.025). The ratios of CysC/CatH
and CysC/CatX differed significantly between histological subtypes
(P=0.012 and P=0.035, respectively) and were significantly higher
in high-grade tumors when compared with the ratios in low-grade
tumors (P=0.031 and P=0.039, respectively). Neither cathepsins nor
their ratios were significant predictors of survival for EOC
patients. Meanwhile, analogical study results have been reported in
other cancer types. Therefore, CTSs are considered to be potential
prognostic factors for the aggressiveness of ovarian cancer, and
may contribute to the invasion of ovarian cancer cells (9). Disappointingly, however, due to the
lack of large sample clinical studies and directly experimental
evidence for the relationship between the expression of CTSs and
invasion and metastasis, the scientific community has not reached a
general consensus on the diagnostic and prognostic value of CTSs in
ovarian cancer progression. In the present study, based on the
analysis of the relationship between the expression of CTSB, CTSL,
CTSD and CC in ovarian epithelial carcinoma tissues and the CTSL
concentration in the serum of patients with ovarian epithelial
carcinoma, we aimed to explain whether CTSs may act as
clinicopathological factors, and whether the overexpression of CTSL
promotes cell invasion and metastasis in ovarian cancer cells.
Materials and methods
Samples
Tissue samples
All tissue samples were obtained from patients who
underwent surgery at the Department of Gynecologic Oncology,
Affiliated Tumor Hospital of Guangxi Medical University, Nanning,
Guangxi from October 2002 to October 2009, and diagnoses were
confirmed by a pathologist. This research included 47 epithelial
malignant ovarian tumors (24 serous, 12 mucinous and 11
undifferentiated), 20 benign ovarian tumors (12 serous and 8
mucinous) and 21 normal ovarian tissues (obtained from patients
with hysteromyoma who received hysterectomy + hapl-oophorotomy). In
the malignant group, the median age of the patients was 45.38 years
(range, 34–73), and 20 patients had stage I–II tumors, and 27
patients had stage III–IV tumors according to the International
Federation of Gynecology and Obstetrics (FIGO) classification, and
17 had high and intermediate degrees of differentiation and 20 had
poor differentiation. All of the patients were followed up (100%).
The survival of the patients ranged from 8 to 67 months, and the
median survival time was 29.81 months. The 3-year survival rate was
49% and the 5-year survival rate was 32%. In the benign group, the
median age of the patients was 40.6 years (range, 24–68), and in
the normal group, the median age of the individuals was 44.8 years
(range, 42–53). All tissue specimens were collected from the
primary tumor lesion during surgery. A portion of each specimen was
sent for histopathological examination, and the remaining portion
was immediately stored in a liquid nitrogen tank ready for RNA
isolation.
Human serum samples
Serum samples were obtained from patients who
underwent surgery at the Department of Gynecologic Oncology,
Affiliated Tumor Hospital of Guangxi Medical University, Nanning,
Guangxi. This research included 177 epithelial malignant ovarian
tumors (109 serous, 54 mucinous and 14 undifferentiated) and 100
benign tumors (62 serous, 24 mucinous and 14 benign teratoma).
Among the patients with malignant tumors, 83 patients had stage
I–II tumors and 134 patients had stage III–IV tumors according to
FIGO classification. The median age of the patients with malignant
tumors was 44.6 years (range, 16–67), and the median age of the
patients with benign tumors was 35.6 years (range, 14–64). Serum
samples of normal controls were obtained from 101 healthy females
undergoing routine physical examinations.
The study was endorsed by the Ethics Committee of
the Guangxi Medical University. All subjects received an
explanation of the aims of the study and signed informed consent.
All subjects understood that they could withdraw from the study at
any time without influencing their oncological or general medical
treatment.
RT-PCR analysis
Total RNA was extracted from frozen tissues by
TRIzol reagent (Invitrogen, Carlsbad, CA, USA), and cDNAs were
synthesized using AccuPower RT PreMix (Invitrogen). The cDNA was
serially diluted 10-fold and quantitatively equalized for PCR
amplification using specific primers (Table I). The PCR amplification was
performed under the following conditions: initial denaturation at
94°C for 5 min, followed by a variable number of 35 cycles: 94°C
for 30 sec, specific annealing temperature for 30 sec, elongation
at 72°C for 45 sec; and a final elongation at 72°C for 5 min. The
PCR products were visualized on 1.5% agarose gels containing
ethidium bromide. GAPDH was used as a control. The ratio of the
grayscale value of the gene to the value of GAPDH was determined as
the relative expression level of the gene.
 | Table ISpecific primers of the genes. |
Table I
Specific primers of the genes.
| Gene | Primer sequence | Fragment size
(bp) |
|---|
| CTSB | F:
5′-CAGATTGCCTCCTTATGAC-3′
R: 5′-GAGAAGTTAAGATGAAGTCCC-3′ | 328 |
| CTSL | F:
5′-ATACAGGGAAGGGAAAC-3′
R: 5′-TAGGGATGTCCACAAAG-3′ | 494 |
| CTSD | F:
5′-GCTCTGTGGAGGACCTGATTG-3′
R: 5′-AGGCTGACGACGCTGACTG-3′ | 378 |
| CC | F:
5′-AACATAGCCAGCTACGAC-3′
R: 5′-GCAAGTAGGATGGAGTGAG-3 | 456 |
| GAPDH | F:
5′-GAAGGTGAAGGTCGGAGT-3′
R: 5′-GAAGATGGTGATGGGATTTC-3′ | 225 |
Enzyme-linked immunosorbent assay
(ELISA) detection
Two microliters of peripheral blood was obtained
from patients prior to any treatment. Sera were collected and
stored at −80°C. ELISA for CTSL was performed using an immunoassay
kit (Boatman Biotech, Shanghai, China) according to the
manufacturer’s instructions. Goat polyclonal antibody against CTSL
and standard substance were purchased from Santa Cruz Biotechnology
(Santa Cruz, CA, USA). The optical density (OD) at 450 was
determined. The standard curve was established by the value of
OD450 vs. the concentration of the standard substance. The level of
protein was calculated in accordance with standard curve, and the
equation of the standard curve for CTSL was y =
a(1-e−bx), where a=1,096.1137, b=0.0416 and
r=0.8578.
Construction of the pcDNA3.1-CTSL
eukaryotic expression plasmid
The construction of the pcDNA3.1-CTSL expression
plasmid was performed as follows. Briefly, the primer was designed
according to the cDNA sequence of CTSL which was deposited in the
GenBank database, for which the restriction sites of XhoI
and BamHI were inserted into both ends of the CTSL open
reading frame. The specific primers were upstream primer,
5′-GCCTCGAGCATGAATCCTACACTCA TCCTTG-3′ and downstream primer,
5′-GCAGGATCCTC ACACAGTGGGGTAGC-3′. The purified PCR product of CTSL
was linked with the pMD18-T vector using T4 DNA ligase (Takara Co),
and the constructed pMD18-T-CTSL plasmid was confirmed by
sequencing. Then the pcDNA3.1 and pMD18-T-CTSL vectors both
digested with BamHI and XhoI were purified and linked
to develop recombinant pcDNA3.1-CTSL. The pcDNA3.1-CTSL DNA was
confirmed by sequencing.
Construction of the CTSL-siRNA
expression vector
Four siRNA primers for CTSL and the primers for the
control genes were designed as follows: i) CTSL-441, GGCGATGCAC
AACAGATTA; ii) CTSL-906, GTATGTTCAGGATAATG GA; iii) CTSL-1202,
GCACAGAATCAGATAACAA; iv) CTSL-1265, CGGATTTGAAAGCACAGAA; v) NC,
TTCT CCGAACGTGTCACGT; vi) GAPDH, GUAUGACAACAG CCUCAAGTT. The target
labeled with fluorescence was transfected into A2780 cells. Total
RNA was extracted by TRIzol reagent, and cDNAs were synthesized
using AccuPower RT PreMix. The expression of CTSL mRNA in cells
transfected with the target and the control was measured by PCR.
The gel imaging system was used to analyze the grayscale ratio of
CTSL vs. β-actin, and the best siRNA silencing efficiency was
determined according to the grayscale.
In accordance with the requirement of the expression
plasmid pSilencer™4.1-CMV-neo (Ambion Co.), the sequence TTCAAGAGA
was selected as the loop. DNA sequence loop ends are complementary
to the siRNA target sequence. The DNA sequence of short hairpin RNA
(small hairpin RNAs, shRNA) with BamH1 and HindIII
sticky ends was designed. At the same time, a non-human short
hairpin RNA sequence was designed as a negative control. The
oligonucleotide sequences for CTSL were 5′-GATCCGCACAGAATCAG
ATAACAATTCAAGAGATTGTTATCTGATTCTGTGCA GA-3′ and
5′-AGCTTCTGCACAGAATCAGATAACAATC TCTTGAATGTTATCTGATTCTGTGCG-3′, and
the oligonucleotide sequences for the control were 5′-GATCCCCGCG
AACGAAATAAAATATTCAAGAGATATTTTATTTCGT TCGCGGAGA-3′ and
5′-AGCTTCTCCGCGAACGAAATA AAATATCTCTTGAATATTTTATTTCGTTCGCGGG-3′.
The oligonucleotide was annealed to form a pair of
oligonucleotides, then pSilencer™4.1-neo vector was digested and
linearization. The oligonucleotide pairs were connected with the
linearization vector in a 2:1 ratio by T4 DNA ligase, and
transformed into DH5a competent cells. The plasmid was extracted
using a plasmid extraction kit (Promega) and confirmed by
sequencing, and named as recombinant plasmids pSilencer™4.1-CTSL
and pSilencer™4.1-Control, respectively.
Transfection of HO8910 and A2780 cells
with plasmid DNA
The plasmid DNA of pcDNA3.1-CTSL and pcDNA3.1 were
transfected into HO8910 cells using liposome Lipofectamine 2000
reagent (Invitrogen), and the plasmid DNA of pSilencer™4.1-CTSL,
pSilencer™4.1-Control and pSilencer™4.1 was transfected into A2780
cells. G418 reagent was used for the selection of the transfected
cells. The CTSL mRNA and protein expression in each subgroup of
cells was measured using RT-PCR and western blotting. The
transfected cells were named HO8910-CTSL, HO8910-pcDNA3.1,
A2780-CTSL, A2780-Control and A2780-pSilencer, respectively.
Methods to determine the cell
biological behavior
Cell growth was measured using the MTT assay, cell
cycle was determined by flow cytometric assay, and DNA content and
the cell number and cell proportion in G1, G2, S phases of the cell
cycle were analyzed by MultiCycle software. Cell invasion in
vitro was measured by Matrigel invasion assay, and cell
migration in vitro was measured by Transwell migration
assay.
Data analysis
SPSS 10.0 statistical software was used for data
analysis. P<0.05 was considered to indicate a statistically
significance result.
Results
mRNA expression of CTSB, CTSL, CC and
CTSD, and their associations with clinicopathological features and
prognosis in ovarian cancer
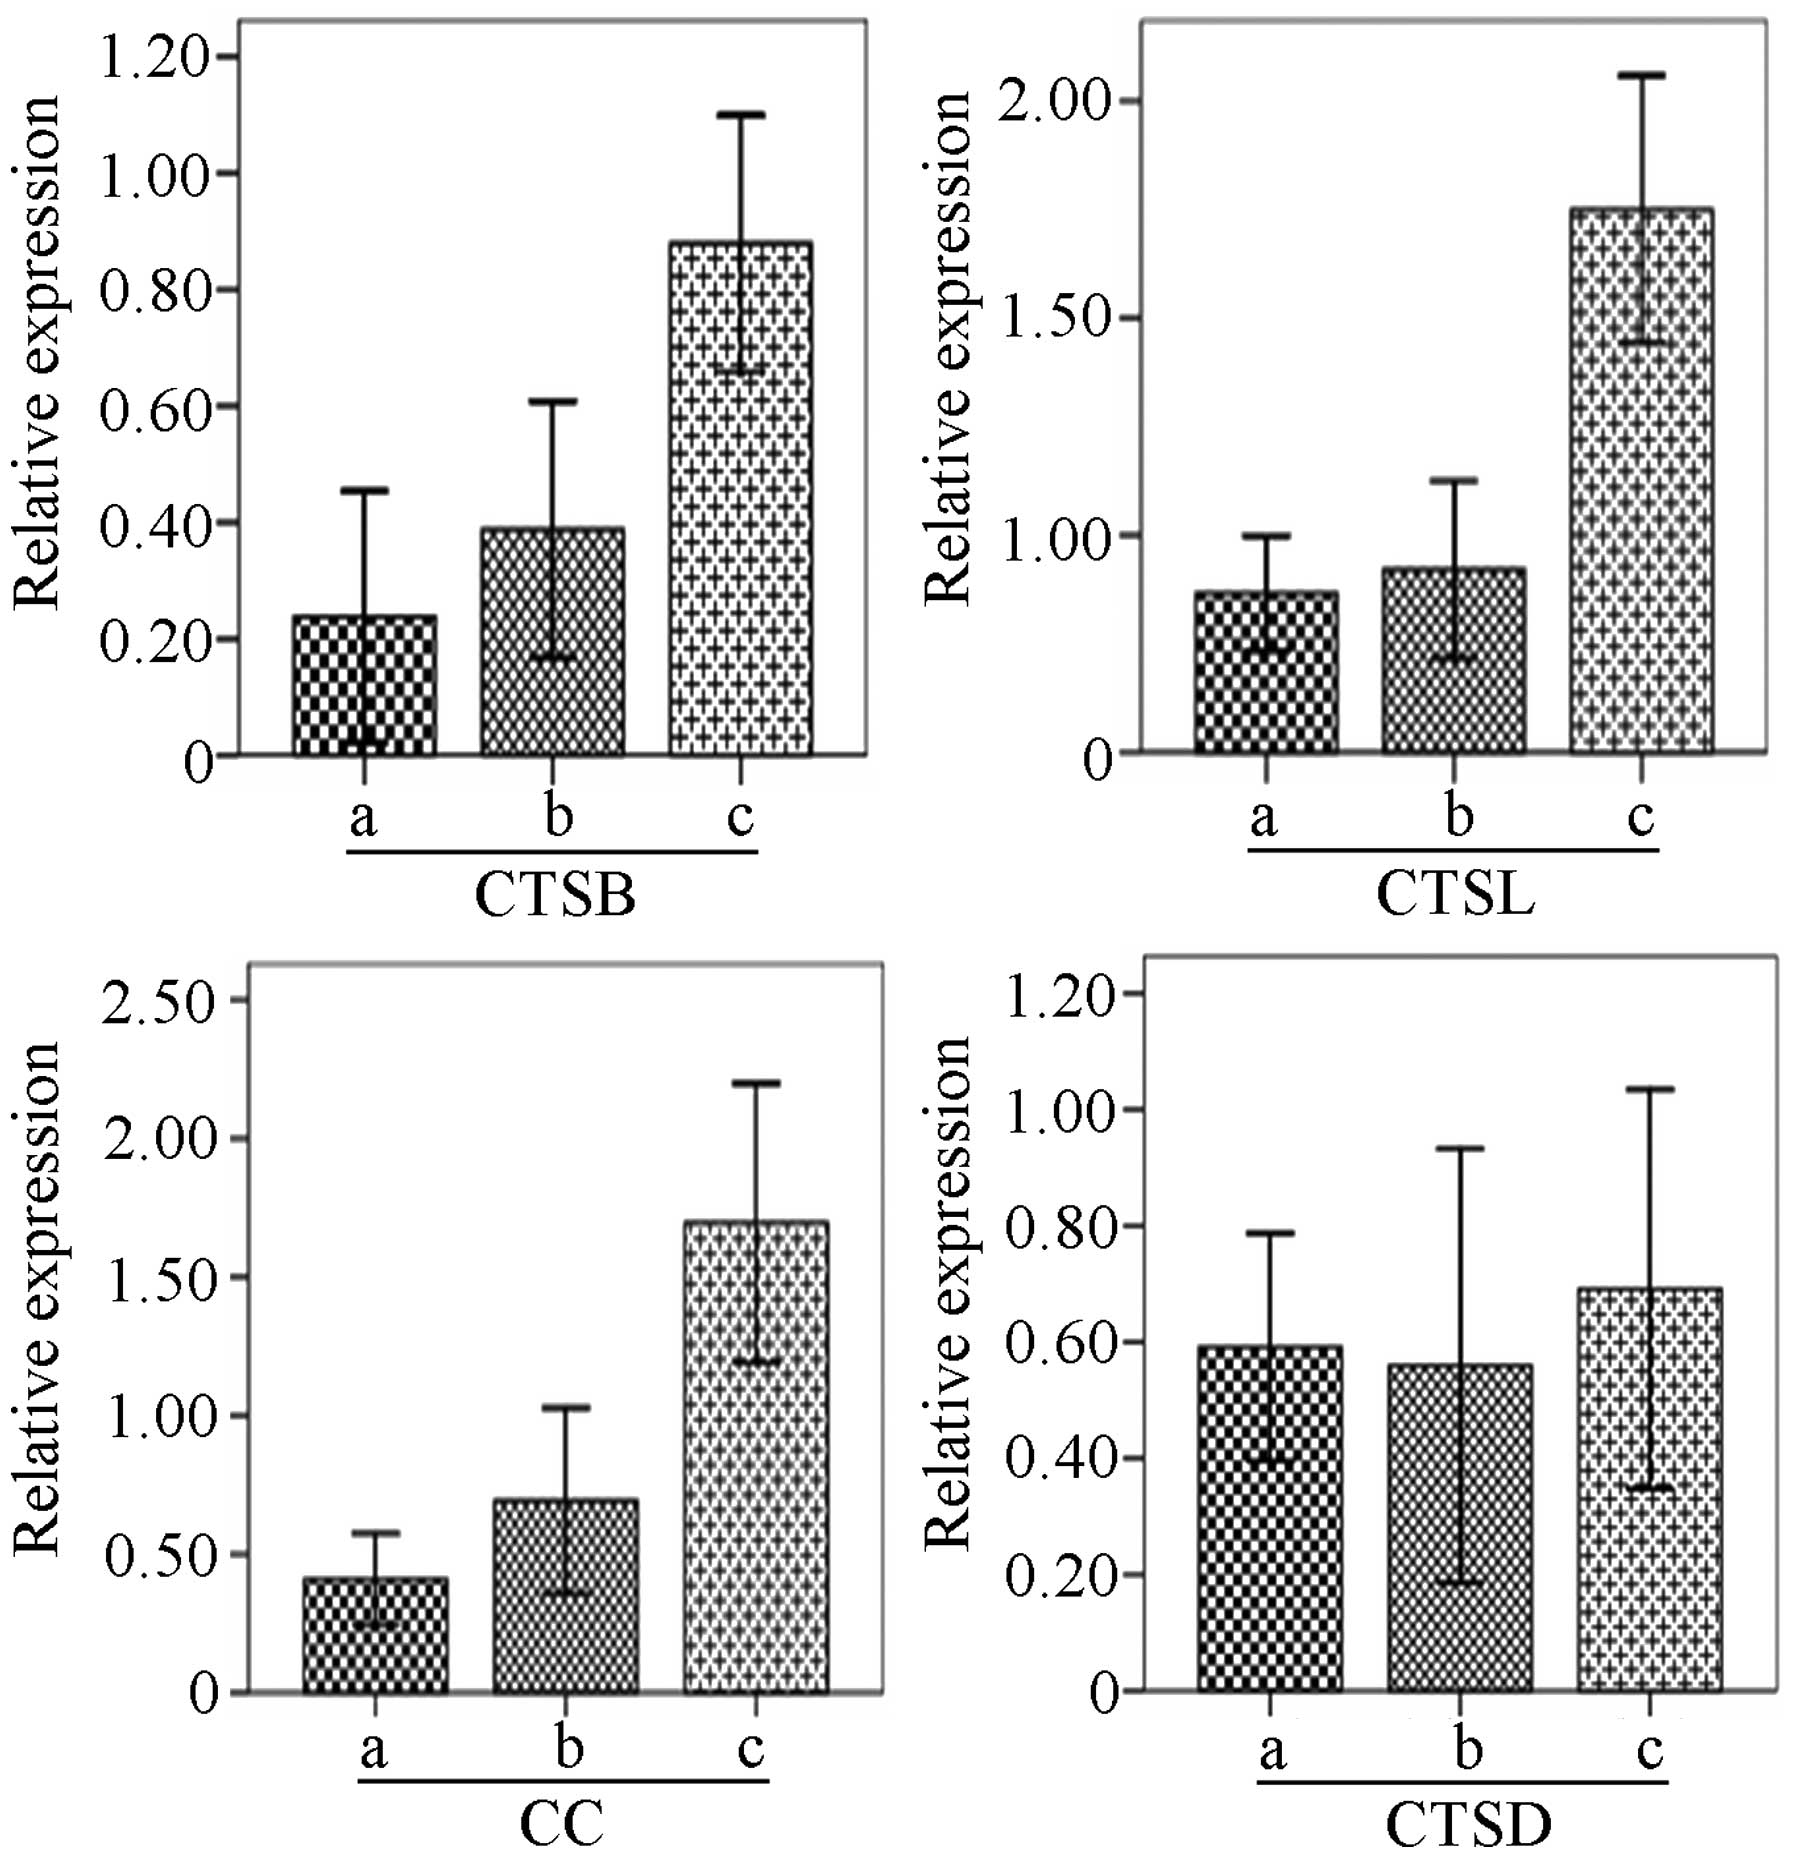
As shown in Fig. 1,
the mRNA expression of CTSB, CTSL and CC in malignant ovarian
tissues was higher than the expression in the normal and benign
tissues (P<0.01), while no significant difference in expression
was observed between the normal and benign ovarian tissues
(P>0.05). In addition, the ratio of CTSB expression vs. CC
expression in benign and malignant tissues was higher than the
ratio in the normal controls (P<0.05), but no difference was
detected between the ratio in the benign and malignant tissues.
Correlation between the expression levels of CTSB,
CTSL, CC and CTSD and clinicopathological features in the ovarian
malignancies was varied (Table
II). The mRNA expression of CTSB had no relationship with
surgical pathological stage, histological grade, lymph node
metastasis, and residual tumor in the malignant ovarian tumors
(P>0.05), while the CTSB expression in patients with ascites
>500 ml was significantly higher than the expression in patients
with ascites <500 ml (P=0.006). In addition, the CTSB expression
in serous carcinoma was higher than the expression in mucinous
carcinoma (P=0.047). The CTSL expression had a weaker association
with histological type, residual tumor, liver metastasis, omental
metastases and ascites (P>0.05), while its expression in stage
III–IV ovarian malignancies was significantly higher than the
expression in stage I–II tumors (P=0.02). Moreover, the CTSL
expression in the highly differentiated malignant ovarian tumors
was significantly higher than that in the poorly differentiated
tumors (P=0.041), and the expression in ovarian malignancies with
lymph node metastasis was significantly higher than the expression
in patients without lymph node metastasis (P=0.026). The CC
expression in malignant ovarian tumors had a limited relationship
with histological type, surgical stage, lymph node metastasis and
the residual tumor (P>0.05). However, the CC expression in
patients with poorly differentiated adenocarcinoma, or with liver
metastasis and omentum metastasis, or with ascites volume >500
ml was significantly higher than the expression in patients with
moderately differentiated adenocarcinomas (P=0.016), or without
metastasis (P=0.027) or with the amount of ascites <500 ml
(P=0.039), respectively. The expression of CTSD had weak
associations with surgical stage, pathological type, histological
grade, lymph node metastasis and residual tumor (P>0.05), while
its expression in patients with liver metastasis was significantly
higher than the expression in patients without liver metastasis
(P=0.029), and the expression in patients with ascites >500 ml
was higher than the expression in patients with ascites <500 ml
(P=0.024).
| Table IIRelationship betweem CTS expression
and the clinicopathological factors in epithelial ovarian cancer
(mean ± SD). |
Table II
Relationship betweem CTS expression
and the clinicopathological factors in epithelial ovarian cancer
(mean ± SD).
| Clinicopathological
factors | n | CTSB | CTSL | CC | CTSD |
|---|
| Epithelial ovarian
cancer | 47 | | | | |
| Serous
cystadenocarcinoma | 21 | 0.763±0.756 | 1.416±1.202 | 1.149±0.667 | 1.122±1.120 |
| Mucinous
cystadenocarcinoma | 9 | 0.191±0.244b | 1.324±1.241 | 1.143±1.521 | 0.583±0.942 |
| Poorly
differentiated adenocarcinoma | 17 | 0.6977±0.504 | 1.143±1.090 | 2.661±2.60 | 1.4062±1.9094 |
| Stage |
| I–II stage | 12 | 0.437±0.320 | 0.632±0.889 | 1.317±0.897 | 1.101±1.368 |
| III–IV stage | 35 | 0.690±0.618 | 1.460±1.068 | 1.824±1.910 | 1.027±1.253 |
| Pathological
gradea |
| G1–G2 | 14 | 0.68±0.783 | 0.748±1.011 | 1.092±0.646 | 0.457±0.665 |
| G3 | 23 | 0.674±0.475 | 1.54±1.103 | 2.060±2.138 | 0.917±1.462 |
| Liver
metastases |
| No | 39 | 0.628±0.606 | 1.12±1.08 | 1.092±0.646 | 0523±0.719 |
| Yes | 8 | 0.608±0.298 | 1.86±0.839 | 2.895±2.367 | 1.504±2.299 |
| Lymph node
metastasis |
| No | 35 | 0.569±0.469 | 1.07±1.14 | 1.441±1.159 | 0.690±1.326 |
| Yes | 12 | 0.766±0.771 | 1.67±0.629 | 2.292±2.557 | 0.691±0.722 |
| Omentum
metastasis |
| No | 20 | 0.648±0.702 | 1.25±1.105 | 1.230±0.947 | 0.707±1.495 |
| Yes | 27 | 0.602±0.417 | 1.24±1.08 | 2.081±2.088 | 0.678±0.889 |
| Ascites (ml) |
| <500 | 26 | 0.6835±0.711 | 1.171±1.174 | 1.203±1.052 | 0.347±0.493 |
| >500 | 21 | 0.540±0.243a | 1.345±0.969 | 2.255±2.241 | 1.115±1.582 |
| Residual tumor
(cm) |
| <2 | 35 | 0.690±0.588 | 1.27±1.16 | 1.655±1.478 | 0.753±1.310 |
| >2 | 12 | 0.432±0.472 | 1.16±0.84 | 1.810±2.048 | 0.508±0.610 |
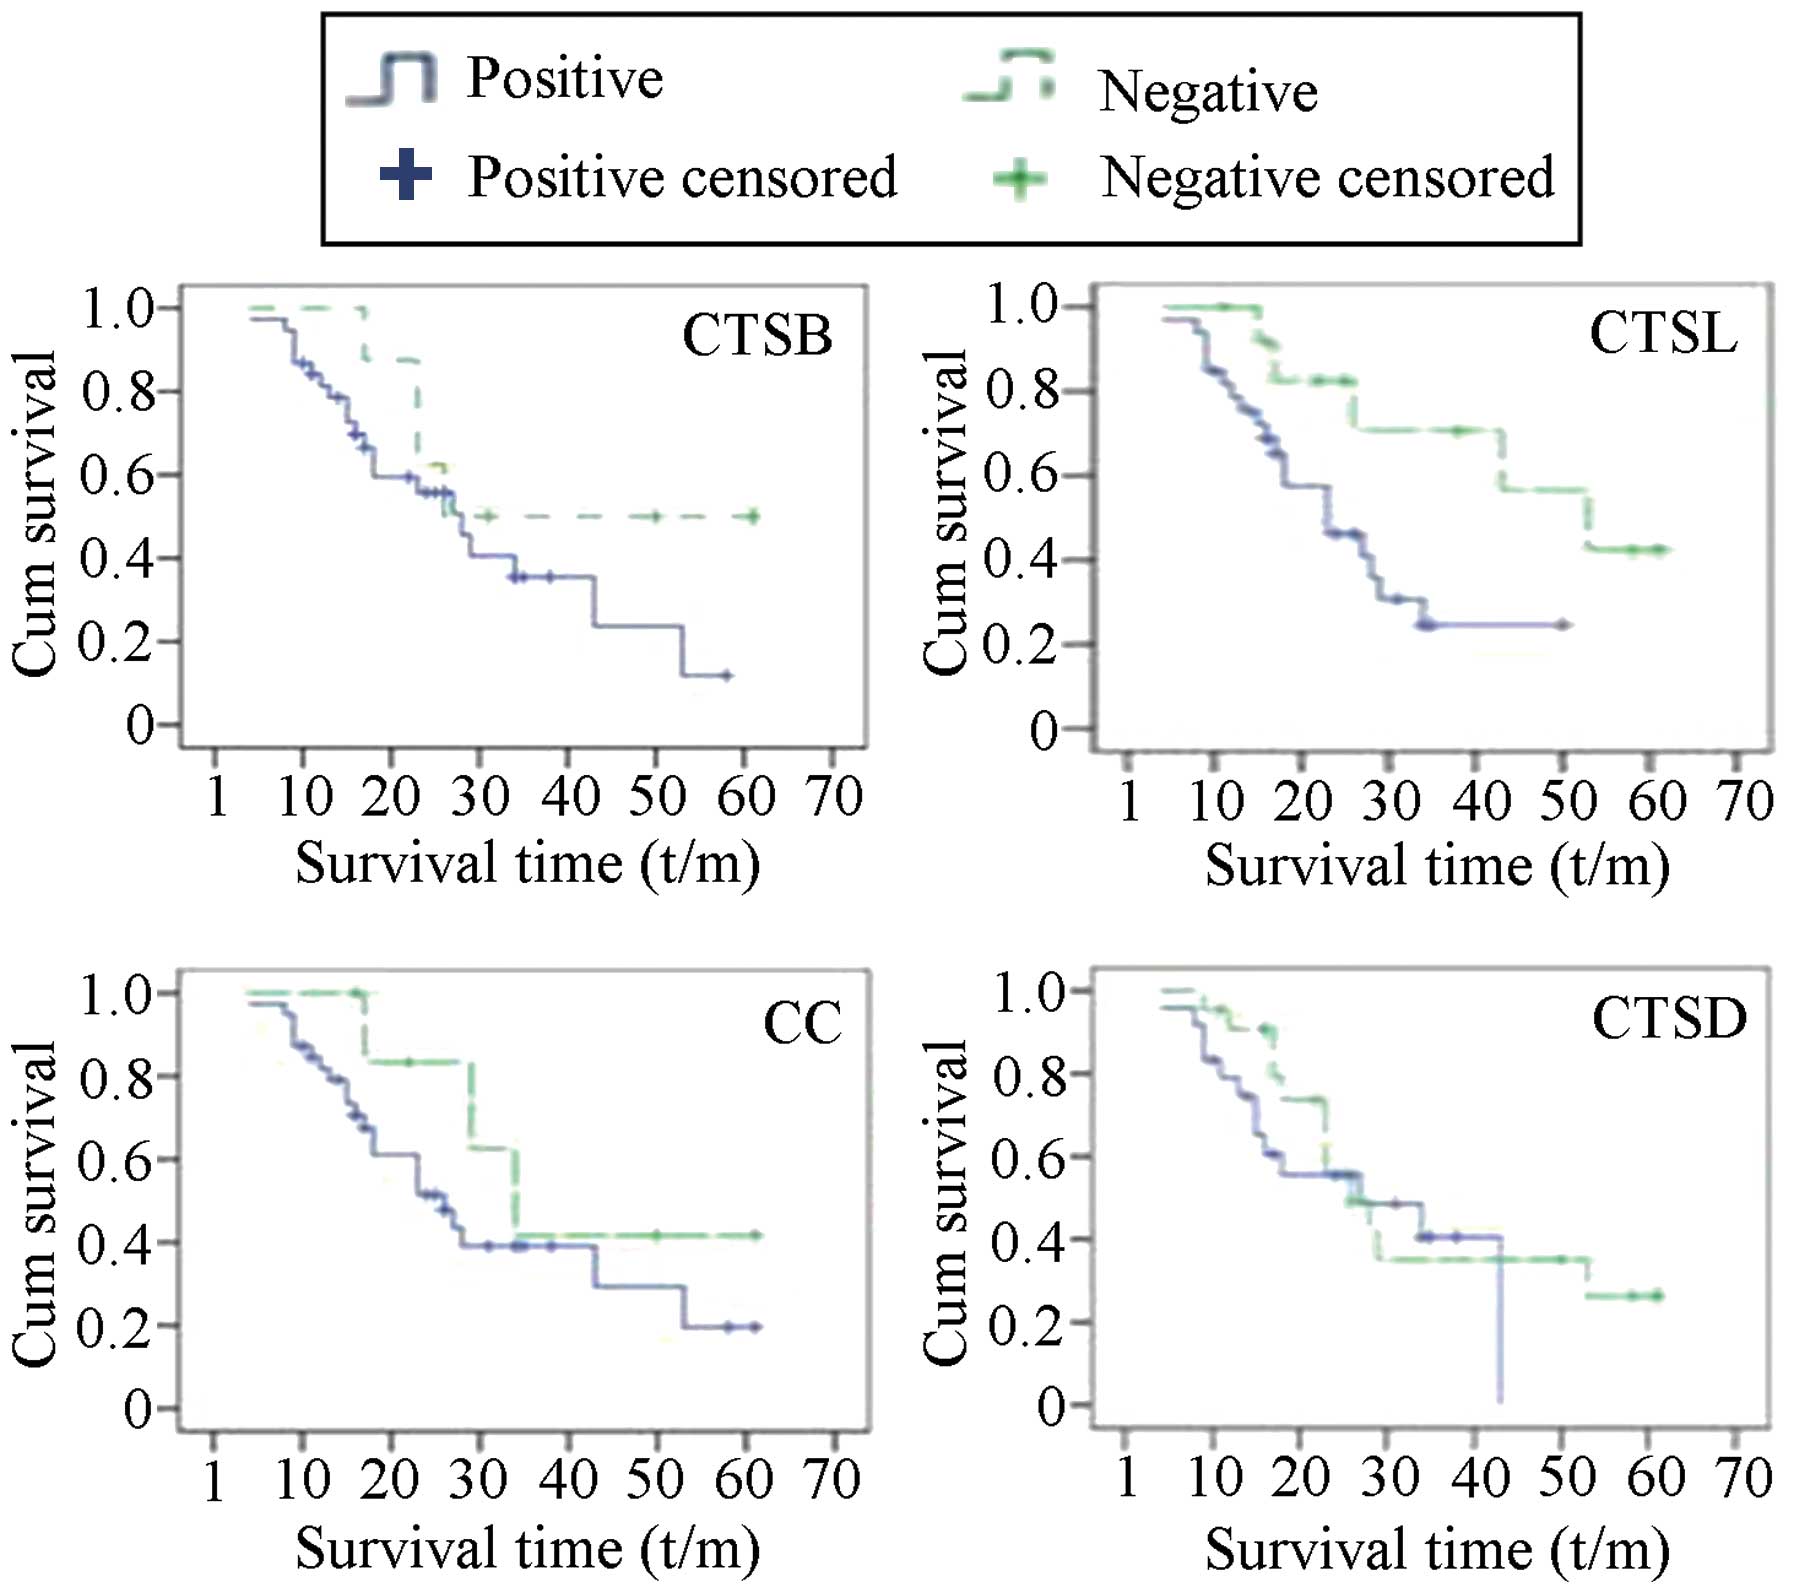
The associations of the expression of the CTS genes
with prognosis in patients with ovarian cancer were analyzed using
Kaplan-Meier survival curve and long-rank testing. As shown in
Fig. 2, the median survival time of
the patients with tumors exhibiting negative CTSB expression was
longer than that of the patients with CTSB-positive expression in
the tumors, but the difference was not statistically significant.
The survival times of the patients with CTSL-positive and
CTSL-negative tumors were 26.64±2.955 and 45.33±5.623 months,
respectively, with statistically significant differences
(P<0.05). The survival times of patients with upregulated and
downregulated expression of CC were 31.83±3.649 and 41.375±7.624
months (P<0.05), respectively, and the survival times of
patients with upregulated and downregulated expression of CTSD were
27.395±3.302 and 34.462±4.617 months (P<0.05), respectively.
To further study whether the expression levels of
CTSB, CTSL, CC and CTSD are independent prognostic indicators for
ovarian cancer, we performed the Cox regression model and
multifactorial survival analysis to illustrate the relationship
between prognosis and factors including age, histological type,
histological grade, clinical stage, liver metastasis, omentum
metastasis, lymph node metastasis, ascites, residual foci and
semi-quantitative expression of CTSB, CTSL, CC and CTSD. As shown
in Table III, expression levels
of CTSB and CTSL were found to be independent prognostic factors
for ovarian cancer.
| Table IIIResults of Cox Proportional-Hazards
Regression. |
Table III
Results of Cox Proportional-Hazards
Regression.
| | | | | | | 95% CI |
|---|
| | | | | | |
|
|---|
| Clinicopathological
factors | B | SE | Wald | df | Sig | Exp (B) | Lower | Upper |
|---|
| Tumor stage | 0.360 | 0.735 | 0.240 | 1 | 0.625 | 1.433 | 0.339 | 6.053 |
| Tumor type | −1.292 | 0.930 | 1.931 | 1 | 0.165 | 0.275 | 0.044 | 1.700 |
| Tumor grade | 0.407 | 0.378 | 1.164 | 1 | 0.281 | 1.503 | 0.717 | 3.150 |
| Liver
metastasis | −1.687 | 1.312 | 1.652 | 1 | 0.199 | 0.185 | 0.014 | 2.424 |
| Omentum
metastasis | 1.756 | 1.087 | 2.607 | 1 | 0.106 | 5.789 | 0.687 | 48.778 |
| Lymph node
metastasis | −0.616 | 1.249 | 0.243 | 1 | 0.622 | 0.540 | 0.047 | 6.243 |
| Ascites | −0.863 | 0.994 | 0.755 | 1 | 0.385 | 0.422 | 0.060 | 2.957 |
| Residual tumor | 0.267 | 1.142 | 0.055 | 1 | 0.815 | 1.307 | 0.139 | 12.262 |
| Age | 0.047 | 0.034 | 1.951 | 1 | 0.162 | 1.049 | 0.981 | 1.121 |
| CTSB
semi-quantitative | 1.640 | 0.803 | 4.165 | 1 | 0.041 | 5.155 | 1.067 | 24.896 |
| CC
semi-quantitative | 0.658 | 0.338 | 3.780 | 1 | 0.052 | 1.931 | 0.995 | 3.749 |
| CTSL
semi-quantitative | −0.208 | 0.295 | 0.497 | 1 | 0.481 | 0.812 | 0.456 | 1.448 |
| CTSD
semi-quantitative | 0.630 | 0.495 | 1.624 | 1 | 0.202 | 1.878 | 0.713 | 4.950 |
| CTSB
expression | −0.257 | 1.576 | 0.027 | 1 | 0.870 | 0.773 | 0.035 | 16.962 |
| CC expression | 0.211 | 1.199 | 0.031 | 1 | 0.860 | 1.235 | 0.118 | 12.959 |
| CTSL
expression | 1.919 | 0.938 | 4.184 | 1 | 0.041 | 6.814 | 1.084 | 42.848 |
| CTSD
expression | 0.412 | 1.032 | 0.159 | 1 | 0.690 | 1.510 | 0.200 | 11.409 |
Serum concentration of CTSL and its
relationship with clinicopathological features, metastasis and
prognosis in patients with malignant ovarian tumors
As shown in Table
IV, the serum concentration of CTSL in patients with malignant
ovarian tumors was significantly higher than the concentration
levels in patients with benign ovarian tumors and in healthy
controls (P=0.000). In addition, the level of CTSL in the benign
group was notably higher than the level in the normal controls
(P=0.000). The serum concentration of CTSL in ovarian cancer
displayed no obvious differences among the pathological types.
Likewise, the serum concentrations of CTSL in patients with
lymphatic and pelvic metastasis, or with distant metastasis showed
no significant differences when compared to the CTSL concentrations
in patients without these metastases. However, the serum levels of
CTSL in patients with low histological grade and advanced stage
were higher than the levels in patients with high grade and early
stage disease (F=12.452, P=0.030 ), and the CTSL level in patients
with peritoneal metastasis was higher than the level in patients
without peritoneal metastasis (F=12.210, P=0.030) (Table V).
| Table IVComparison of the serum levels of
CTSL in different ovarian tissues. |
Table IV
Comparison of the serum levels of
CTSL in different ovarian tissues.
| Group | n | Serum levels of
CTSL [μg/l, (mean ± SD)] |
|---|
| Healthy control
group | 101 | 5.59±1.75a |
| Benign ovarian
tumor group | 100 | 10.97±3.84b |
| Malignant ovarian
tumor group | 177 | 21.59±8.24 |
| Table VRelationship between the CTSL levels
in serum with clinicopathological variables in patients with
ovarian cancers. |
Table V
Relationship between the CTSL levels
in serum with clinicopathological variables in patients with
ovarian cancers.
| Clinicopathologic
factors | n | CTSL [μg/l, (mean ±
SD)] |
|---|
| Pathological
type |
| Serous
cystadenocarcinoma | 109 | 21.62±8.52 |
| Mucinous
cystadenocarcinoma | 54 | 20.28±7.44 |
| Poorly
differentiated adenocarcinoma | 14 | 26.49±7.64 |
| Grade |
| I–II | 29 | 18.54±7.30 |
| III | 148 | 23.04±7.67 |
| FIGO stagea |
| I–II | 62 | 19.66±7.83 |
| III–IV | 115 | 22.64±8.31 |
| Retroperitoneal
lymph node metastasis |
| Positive | 85 | 23.64±8.89 |
| Negative | 92 | 21.42±8.82 |
| Pelvic
metastases |
| Positiveb | 125 | 23.64±8.8 |
| Negative | 52 | 21.42±8.82 |
| Peritoneal
metastases |
| Positivec | 115 | 22.96±8.41 |
| Negative | 62 | 19.07±7.36 |
| Distant
metastasis |
| Positived | 32 | 22.03±8.05 |
| Negative | 145 | 21.50±8.32 |
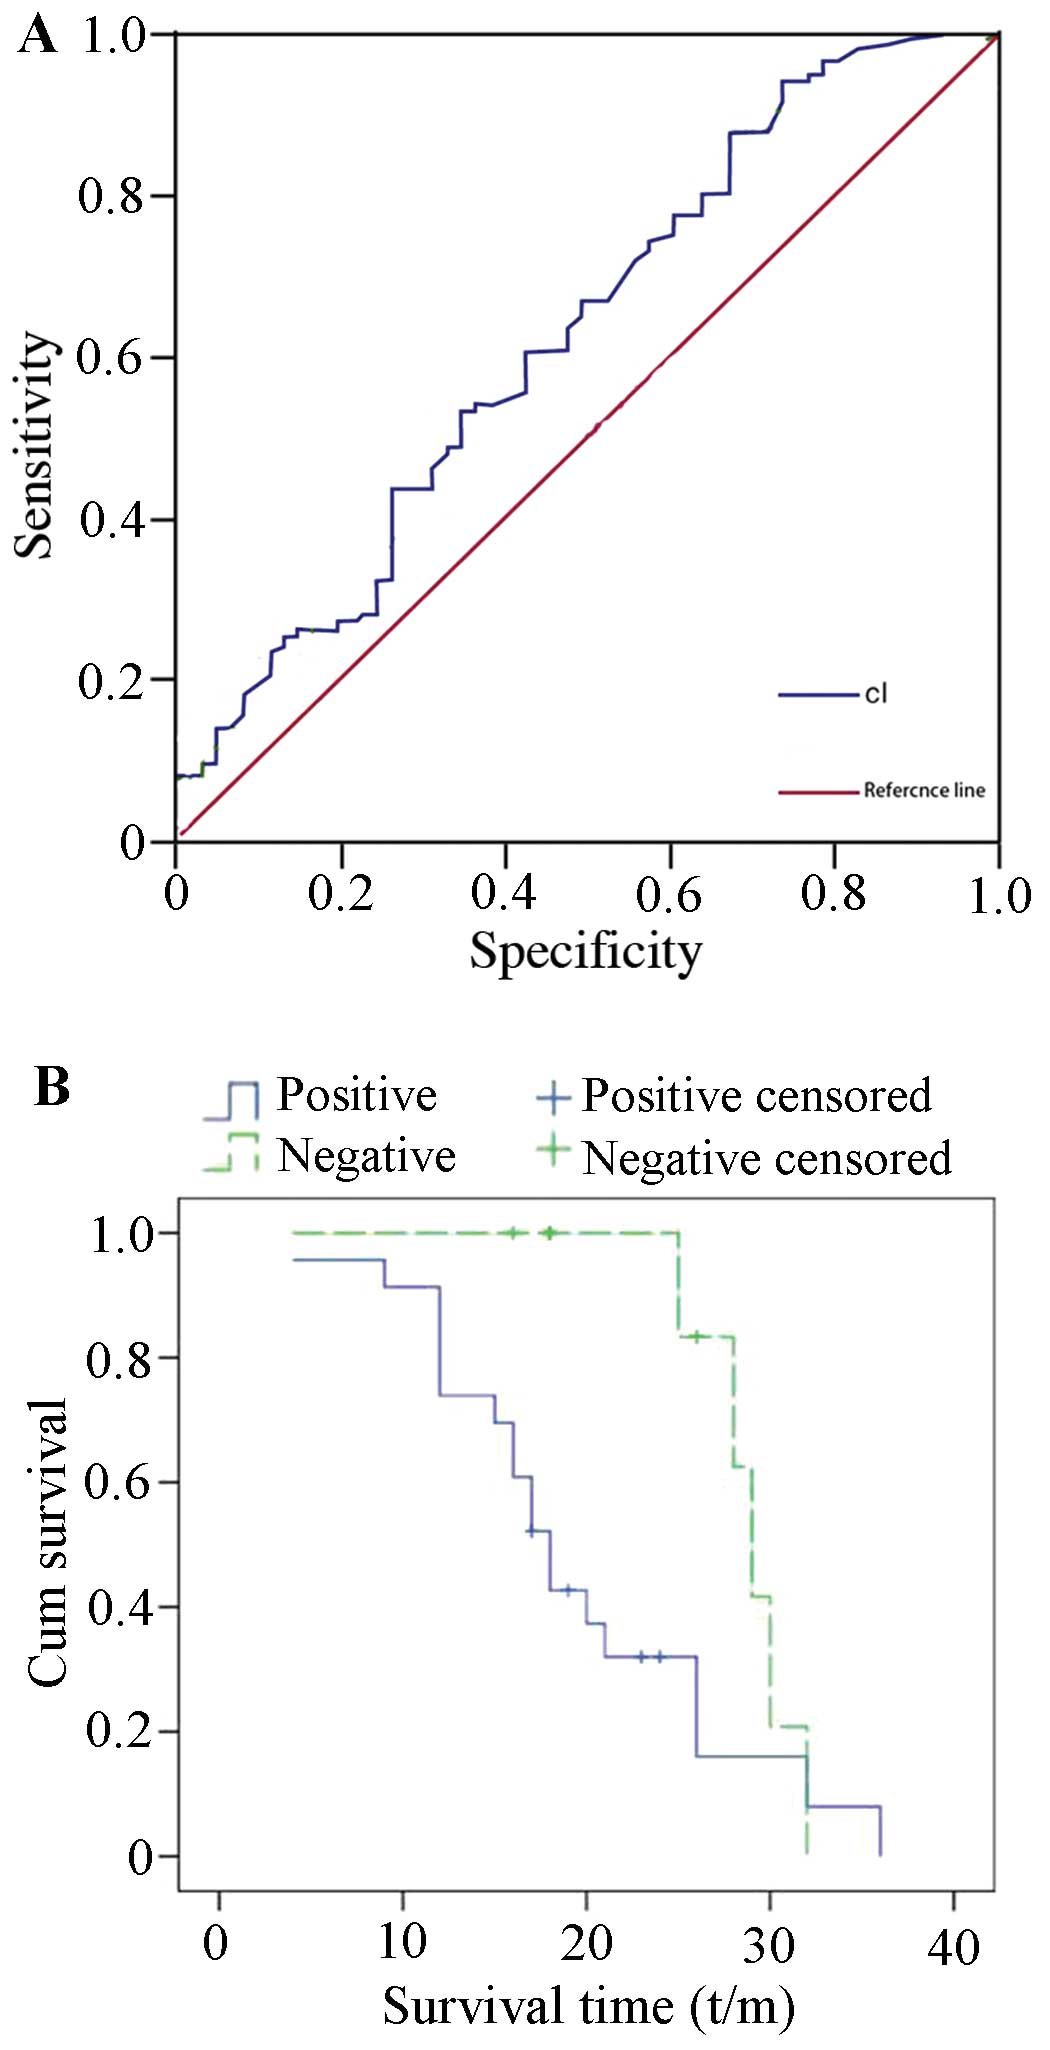
The ROC curve was established based on the serum
levels of CTSL in 177 patients with epithelial ovarian cancer
(Fig. 3A). A comparison of the area
under the curve between 115 patients with pelvic metastasis and 62
patients without metastasis was performed to estimate the
sensitivity and specificity of serum CTSL levels. The results
indicated that the area under the curve was 0.624, and the
sensitivity, specificity, positive likelihood ratio and negative
likelihood ratio were 60.9% (70/115 cases), 57.4% (26/62 cases),
1.4 and 0.7, respectively, suggesting that the serum CTSL levels
may be potential markers for the preoperative assessment of tumor
metastasis in ovarian cancer. As shown in Fig. 3B, the Kaplan-Meier survival curve
showed that the average overall survival of patients with
CTSL-positive tumors was 19.67±1.86 months, while the survival of
the patients with CTSL-negative tumors was 29.9±1.06 months,
indicated a statistically significant difference (P=0.036) in
cumulative survival rate.
Cox regression model and multifactorial survival
analysis were used to determine whether the CTSL expression in
preoperative ovarian cancer patients is an independent prognostic
indicator. Among all the factors including age, histological type,
histological grade, clinical stage, liver metastasis, omentum
metastasis, lymph node metastasis, ascites, residual foci and the
preoperative serous content of CTSL, postoperative residual tumor
size was found to be an independent prognostic factor (P=0.038)
(Table VI), but the preoperative
serum concentration of CTSL had a weaker association with prognosis
(P=0.337).
| Table VIResults of the Cox proportional
hazards regression model analysis. |
Table VI
Results of the Cox proportional
hazards regression model analysis.
| | | | | | | 95% CI |
|---|
| | | | | | |
|
|---|
| Clinicopathological
factors | B | SE | Wald | df | Sig | Exp(B) | Lower | Upper |
|---|
| Tumor stage | 2.921 | 2.316 | 1.590 | 1 | 0.207 | 18.553 | 0.198 | 1,732.209 |
| Tumor type | 12.132 | 7.922 | 2.345 | 1 | 0.126 | 185,779.3 | 0.034 | 1E+012 |
| Tumor grade | −0.878 | 1.076 | 0.666 | 1 | 0.414 | 0.416 | 0.050 | 3.424 |
| Liver
metastasis | −3.197 | 1.723 | 3.444 | 1 | 0.063 | 0.041 | 0.001 | 1.197 |
| Omentum
metastasis | 5.352 | 3.655 | 2.144 | 1 | 0.143 | 211.16 | 0.163 | 272,884.3 |
| Lymph node
metastasis | 3.233 | 2.084 | 2.407 | 1 | 0.121 | 25.368 | 0.427 | 1,507.240 |
| Ascites | −1.103 | 1.589 | 0.482 | 1 | 0.488 | 0.332 | 0.015 | 7.474 |
| Residual tumor | 3.752 | 1.812 | 4.291 | 1 | 0.038 | 42.619 | 1.224 | 1,484.467 |
| Serum concentration
of CTSL | 0.056 | 0.059 | 0.920 | 1 | 0.337 | 1.058 | 0.943 | 1.186 |
Expression of CTSL in ovarian cancer
cells and its influence on cell invasion, metastasis and cell
adhesion
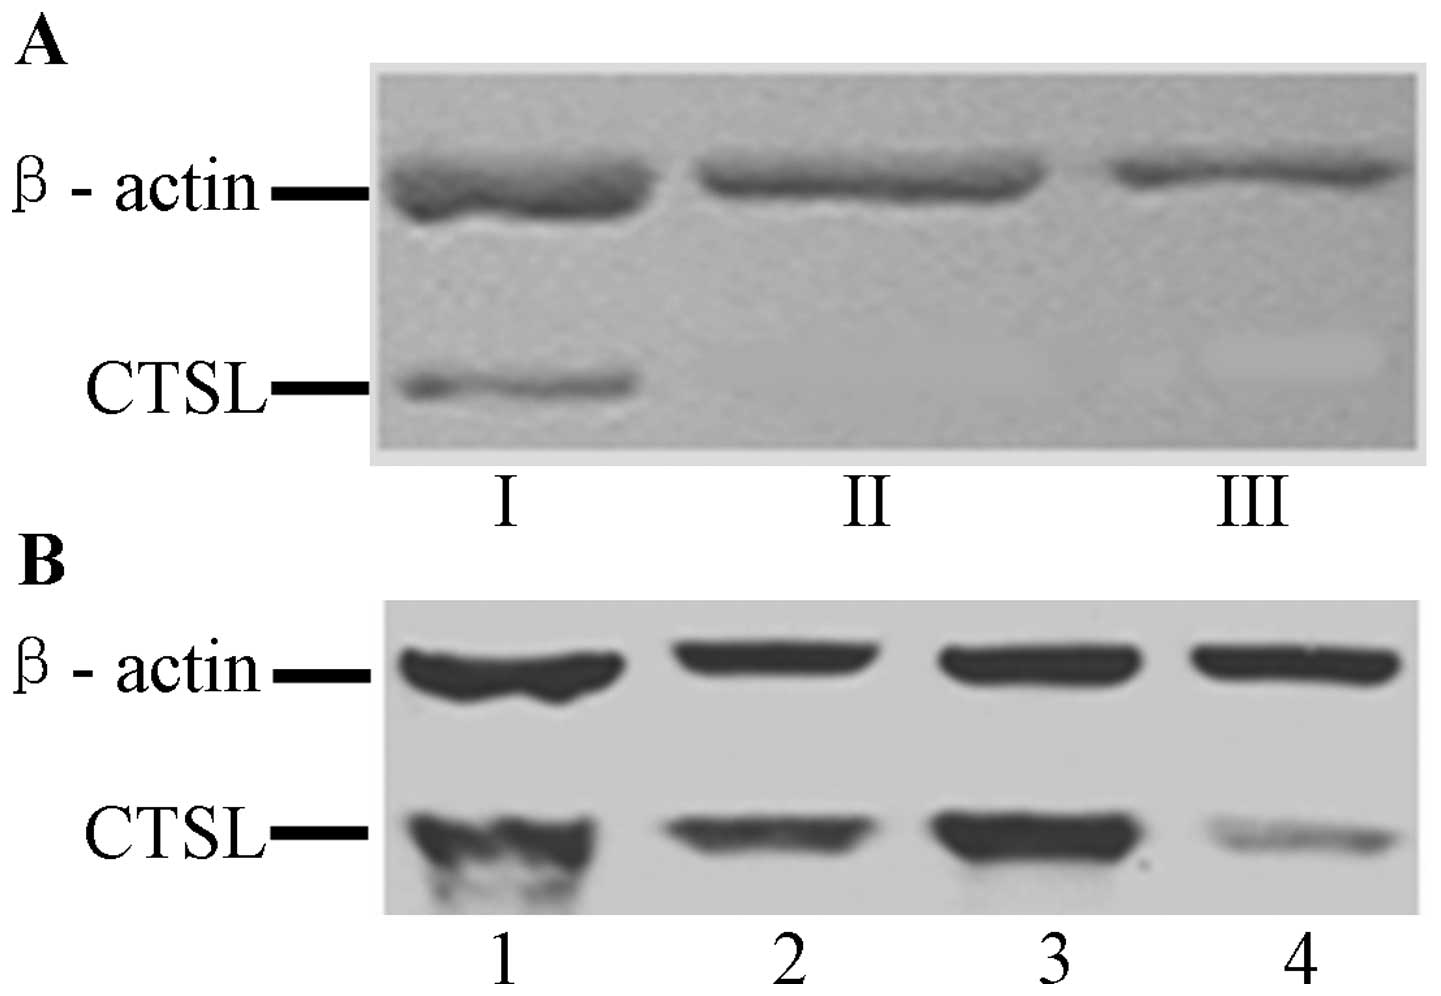
RT-PCR results indicated that CTSL mRNA was
positively expressed in HO8910-CTSL cells, and negatively expressed
in HO8910 and HO8910-pcDNA3.1 cells. The western blotting indicated
that the CTSL protein was positively expressed in HO8910-CTSL cells
but negatively expressed in HO8910 and HO8910-pcDNA3.1 cells
(Fig. 4A). These results indicate
that the expression of CTSL was consistent at both the mRNA and
protein levels.
RT-PCR results showed that the mRNA expression of
CTSL in the A2780 ovarian cancer cells transfected with the siRNA
1202 sequence was obviously lower than the expression in A2780
cells transfected with the other sequence or the control sequence
(P<0.05). Thus, the fragment of 1202 sequence was selected to
construct the siRNA interference eukaryotic expression vector of
CTSL. RT-PCR and western blot results showed that the expression of
CTSL at the mRNA and protein levels was downregulated in A2780-CTSL
cells, but no significant difference in expression was observed
among the A2780, A2780-Control and A2780-pSilencer cells,
respectively (Fig. 4B).
The expression of CTSL had less influence on cell
growth and proliferation in accordance with the cell growth curve
and the cell colony formation assay in the HO8910-CTSL (+),
HO8910-pcDNA3.1 and HO8910 cells, and A2780, A2780-control and
A2780-pSilencer cells, respectively. In addition, on the basis of
FCM analysis, the percentages of cells in the S, G2 and M phases of
the cell cycle in the HO8910-CTSL cell group were higher than these
percentages in the HO8910-pcDNA3.1 and HO8910 cells, and the
percentages of cells in the S, G2 and M phases of the cell cycle in
the A2780-CTSL (−) cell group were lower that these percentages in
the A2780 cells and A2780-controls, although both showed no
statistically significant differences. However, the expression of
CTSL had obvious influences on cell invasion and metastasis. As
shown in Table VII, the cell
invasive and metastatic abilities of the HO8910-CTSL cells were
notably increased when compared with these abilities in the control
cells (P<0.05), and the abilities of the A2780-CTSL(−) cells
were obviously decreased in comparison with the abilities of the
control cells (P<0.05), while no changes were observed in the
cell adhesion ability of HO8910-CTSL and A2780-CTSL(−) cells when
compared with their corresponding controls.
| Table VIIComparison of cell invasive,
metastatic and adhesion abilities of ovarian cancer cells in
vitro (mean ± SD). |
Table VII
Comparison of cell invasive,
metastatic and adhesion abilities of ovarian cancer cells in
vitro (mean ± SD).
| Invasive
ability | Metastatic
ability | Adhesion
ability |
|---|
|
|
|
|
|---|
| Cell groups | Absorbance
values | P-value | Absorbance
values | P-value | Absorbance
values | P-value |
|---|
| HO8910 | 0.159±0.0468 | | 0.459±0.674 | | 0.156±0.035 | |
|
HO8910-pcDNA3.1 | 0.165±0.040 | >0.05a | 0.486±0.027 | 0.687a | 0.193±0.041 | >0.05a |
| HO8910-CTSL | 0.343±0.178 | <0.05a,b | 1.252±0.114 | 0.000a,b | 0.186±0.032 | >0.05b |
| A2780 | 0.4354±0.049 | | 0.2273±0.0746 | | 0.2023±0.080 | |
|
A2780-pSilencer | 0.4370±0.056 | 0.970c | 0.1776±0.0353 | 0.095c | 0.2015±0.044 | 0.969 |
| A2780-Control | 0.3871±0.040 | 0.281c | 0.2083±0.0552 | 0.589c | 0.2073±0.044 | 0.816 |
| A2780-CTSL | 0.2849±0.057 | 0.007c | 0.1340±0.046 | 0.004c | 0.2015±0.040 | 0.969 |
Discussion
CTSs are a family of cysteine proteases which
function primarily in protein degradation in the lysosomes of the
majority of cell types (5), and
specific CTSs are often upregulated in various types of cancers
(10). CTSs are expressed at the
cell surface of cancer cells and are secreted into the
extracellular space, where they degrade ECM components (11,12).
This extracellular proteolytic activity allows cancer cells to
invade surrounding tissue, blood and lymph vessels and to
metastasize to tissues at distant sites (13). The present study aimed to explore
the relationship between CTSB, CTSL, CC and CTSD mRNA expression in
ovarian epithelial cancer and clinicopathological factors and
prognosis. We observed that CTSB, CTSL and CC expression in
malignant ovarian tumors was significantly higher than the
expression levels in benign tumors and normal ovarian tissues, and
CTSB was associated with the amount of ascites and histological
type. CTSL was associated with clinical stage, histological grade
and lymph node metastasis, and CC was associated with pathological
grade, liver metastasis and omentum metastasis. In addition, the
univariate survival analysis showed that CTSL expression was
associated with patient prognosis, and COX analysis indicated that
CTSB and CTSL expression was an independent prognostic factor in
ovarian cancer.
Among all of the CTSs genes, CTSB and CTSL have been
investigated the most intensively and appear to play a role in
cancer based on their increased expression in various human cancers
(14–16). A role of CTSB and CTSL in tumor cell
invasion was suggested by the observation of the increased
invasiveness of cells overexpressing CTSB and CTSL (17) and by the decreased invasion in the
presence of specific inhibitors of CTSB and CTSL (18). Moreover, immunohistochemical
analysis demonstrated that CTSB and CTSL exist in the cytoplasm of
tumor cells in human ovarian cancer (9,19).
Similarly, in the present study increased expression of CTSB and
CTSL was noted in cancer, but not normal ovarian tissue, suggesting
that CTSB and CTSL are survival prognostic factors in ovarian
cancer, and may contribute to the invasiveness of ovarian cancer
cells. Regarding their mechanism of action, previous studies
indicate that they play a catalytic role (20–22).
First, CTSB and CTSL can act as protease, directly or indirectly,
degrading the catalytic extracellular matrix, so that the physical
barrier around the tumor cells is destroyed. Secondly, the
intercellular adhesion is remodeled, so that the tumor cells grow
into the surrounding area. Third, they act on the matrix components
to promote the biological activity of tumor cells; and fourth,
tumor neovascularization is promoted, directly or indirectly, to
promote vascular endothelial cell sprouting and invasive
growth.
Since ovarian cancer tissue is highly heterogeneous,
multiple biopsies are necessary for careful examination (23,24).
This means that the quantitation of cathepsins in biological fluids
from ovarian cancer patients has several clinical advantages over
measurements from ovarian cancer tissue. We found that the serum
levels of CTSL were significantly higher in patients with ovarian
malignant tumors than these levels in benign tumors and healthy
controls, and the CTSL levels were elevated in low grade and
advanced stage disease when compared to the levels in high grade
and early stage disease. Our results were consistent with previous
research (7). Siewinski et
al (25) reported that the
serum level of CTSL was higher in malignant tumors than that in
benign tumors and normal controls. Women with ovarian cancer were
found to have higher levels of CTSB and CTSL in sera (26), and CTSB and CTSL were present in
ascites and cyst fluid of patients with ovarian cancer (15,27).
These results indicate that serum CTSL is increased in patients
with ovarian cancer, and it may be a valuable serum markers for the
diagnosis of ovarian cancer. Due to the occult nature of ovarian
cancer onset, during early diagnosis and preoperative diagnosis it
is difficult to judge the degree of invasion and metastasis
resulting in the difficulty in treatment decision making and
implementation. Based on the fact that the CTSL content in the
peripheral blood of ovarian cancer patients was found to be related
to invasion and metastasis, it is worth investigating whether it
can be used as a marker before surgery to determine the extent of
tumor invasion and metastasis. Observations in this group suggest
that the CTSL content in the peripheral blood of ovarian cancer
patients was positively correlated with the degree of extrapelvic
invasion and metastasis. The ROC and performance analysis of the
degree of invasion and metastasis further indicated that there was
clinical reference value to determine the degree of tumor invasion
and metastasis. Diagnostic and differential diagnoses of ovarian
cancer pelvic metastasis rely mainly on imaging techniques.
Research has confirmed that for ultrasound, calculate scan imaging
(CT) or magnetic resonance imaging (MRI) examination in the
peritoneum, mesentery, omentum, lesions <2 cm in diameter are
difficult to identify. In regards to other diseases such as chronic
inflammation or proliferation-resistant tuberculosis, the mass
identification and performance were similar to ovarian cancer, for
both the clinical misdiagnosis rate was up to 30% (28). The peripheral blood CTSL
concentration was associated with malignant cell degradation in the
matrix, rather than inflammatory lesions. Therefore, determination
of the CTSL content in peripheral blood could be used as a
reference marker to assess the degree of tumor invasion and
metastasis, especially to ascertain whether there is an extrapelvic
metastasis prior to surgery.
Cell adhesion, invasive and migratory abilities are
important for tumor cell invasion and metastasis. Our results
showed that the invasive and migratory abilities of
pcDNA3.1-CTSL(+)-HO8910 cells were significantly greater than the
abilities of the control cells in vitro, suggesting that the
CTSL gene may play important roles in invasion and metastasis of
ovarian cancer cells by hydrolysis of the basement membrane.
Studies have shown that CTSL gene knockout mice exhibit a decline
in tumor cell invasiveness. Levicar et al (29) found that CTSL is a protein which can
modify the degree of malignancy of glioblastoma. In addition, we
found that the cell invasive and migratory abilities of A2780 cells
were decreased significantly while the CTSL expression in A2780
cells was downregulated by siRNA, providing further evidence that
CTSL expression in tumor cells contributes to the invasion and
migration of ovarian cancer cells, and this result is consistent
with the findings of Yang and Cox (30) who reported that the downregulation
of CTSL expression in melanoma cells reduced the ability of tumor
cell invasion and metastasis, but had no influence on cell
adhesion. Similar results in human glioma IPTP24 cells were
reported by Levicar et al (29).
Taken together, on the basis of our findings in
ovarian cancer and the related studies in other types of cancers,
we conclude that the CTSL gene is involved in tumor invasion and
metastasis through degradation of the extracellular matrix, without
affecting the adhesion of ovarian cancer cells. Thus, the CTSL gene
is a possible molecular target for blocking ovarian cancer invasion
and metastasis.
Acknowledgements
The present study was supported by a grant from the
Provincial Research Project Funding of Guangxi, China (no.
2010GXNSFD013053).
References
|
1
|
Jemal A, Thomas A, Murray T and Thun M:
Cancer statistics, 2002. CA Cancer J Clin. 52:23–47. 2002.
View Article : Google Scholar
|
|
2
|
Murdoch WJ, Van Kirk EA and Alexander BM:
DNA damages in ovarian surface epithelial cells of ovulatory hens.
Exp Biol Med (Maywood). 230:429–433. 2005.PubMed/NCBI
|
|
3
|
Deraco M, Baratti D, Laterza B, Balestra
MR, Mingrone E, Macri A, Virzi S, Puccio F, Ravenda PS and Kusamura
S: Advanced cytoreduction as surgical standard of care and
hyperthermic intraperitoneal chemotherapy as promising treatment in
epithelial ovarian cancer. Eur J Surg Oncol. 37:4–9. 2011.
View Article : Google Scholar
|
|
4
|
Johnatty SE, Beesley J, Paul J, Fereday S,
Spurdle AB, Webb PM, Byth K, Marsh S, McLeod H, Harnett PR, Brown
R, DeFazio A and Chenevix-Trench G: ABCB1 (MDR 1)
polymorphisms and progression-free survival among women with
ovarian cancer following paclitaxel/carboplatin chemotherapy. Clin
Cancer Res. 14:5594–5601. 2008. View Article : Google Scholar
|
|
5
|
Turk V, Turk B and Turk D: Lysosomal
cysteine proteases: facts and opportunities. EMBO J. 20:4629–4633.
2001. View Article : Google Scholar : PubMed/NCBI
|
|
6
|
Athanassiadou P, Sakellariou V, Petrakakou
E, Athanassiades P, Zerva C, Liossi A and Michalas S: Cathepsin D
immunoreactivity in ovarian cancer: correlation with prognostic
factors. Pathol Oncol Res. 4:103–107. 1998. View Article : Google Scholar : PubMed/NCBI
|
|
7
|
Nishida Y, Kohno K, Kawamata T, Morimitsu
K, Kuwano M and Miyakawa I: Increased cathepsin L levels in serum
in some patients with ovarian cancer: comparison with CA125 and
CA72–4. Gynecol Oncol. 56:357–361. 1995.PubMed/NCBI
|
|
8
|
Kolwijck E, Kos J, Obermajer N, Span PN,
Thomas CM, Massuger LF and Sweep FC: The balance between
extracellular cathepsins and cystatin C is of importance for
ovarian cancer. Eur J Clin Invest. 40:591–599. 2010. View Article : Google Scholar : PubMed/NCBI
|
|
9
|
Nishikawa H, Ozaki Y, Nakanishi T,
Blomgren K, Tada T, Arakawa A and Suzumori K: The role of cathepsin
B and cystatin C in the mechanisms of invasion by ovarian cancer.
Gynecol Oncol. 92:881–886. 2004. View Article : Google Scholar : PubMed/NCBI
|
|
10
|
Jedeszko C and Sloane BF: Cysteine
cathepsins in human cancer. Biol Chem. 385:1017–1027. 2004.
View Article : Google Scholar : PubMed/NCBI
|
|
11
|
Gocheva V and Joyce JA: Cysteine
cathepsins and the cutting edge of cancer invasion. Cell Cycle.
6:60–64. 2007. View Article : Google Scholar : PubMed/NCBI
|
|
12
|
Mohamed MM and Sloane BF: Cysteine
cathepsins: multifunctional enzymes in cancer. Nat Rev Cancer.
6:764–775. 2006. View
Article : Google Scholar : PubMed/NCBI
|
|
13
|
Lankelma JM, Voorend DM, Barwari T,
Koetsveld J, Van der Spek AH, De Porto AP, Van Rooijen G and Van
Noorden CJ: Cathepsin L, target in cancer treatment? Life Sci.
86:225–233. 2010. View Article : Google Scholar : PubMed/NCBI
|
|
14
|
Yan S, Sameni M and Sloane BF: Cathepsin B
and human tumor progression. Biol Chem. 379:113–123.
1998.PubMed/NCBI
|
|
15
|
Lah TT and Kos J: Cysteine proteinases in
cancer progression and their clinical relevance for prognosis. Biol
Chem. 379:125–130. 1998.PubMed/NCBI
|
|
16
|
Rao JS: Molecular mechanisms of glioma
invasiveness: the role of proteases. Nat Rev Cancer. 3:489–501.
2003. View
Article : Google Scholar : PubMed/NCBI
|
|
17
|
Szpaderska AM and Frankfater A: An
intracellular form of cathepsin B contributes to invasiveness in
cancer. Cancer Res. 61:3493–3500. 2001.PubMed/NCBI
|
|
18
|
Premzl A, Zavasnik-Bergant V, Turk V and
Kos J: Intracellular and extracellular cathepsin B facilitate
invasion of MCF-10A neoT cells through reconstituted extracellular
matrix in vitro. Exp Cell Res. 283:206–214. 2003. View Article : Google Scholar
|
|
19
|
Scorilas A, Fotiou S, Tsiambas E, Yotis J,
Kotsiandri F, Sameni M, Sloane BF and Talieri M: Determination of
cathepsin B expression may offer additional prognostic information
for ovarian cancer patients. Biol Chem. 383:1297–1303. 2002.
View Article : Google Scholar : PubMed/NCBI
|
|
20
|
Wang M, Tang J, Liu S, Yoshida D and
Teramoto A: Expression of cathepsin B and microvascular density
increases with higher grade of astrocytomas. J Neurooncol. 71:3–7.
2005. View Article : Google Scholar : PubMed/NCBI
|
|
21
|
He X, Brenchley PE, Jayson GC, Hampson L,
Davies J and Hampson IN: Hypoxia increases heparanase-dependent
tumor cell invasion, which can be inhibited by antiheparanase
antibodies. Cancer Res. 64:3928–3933. 2004. View Article : Google Scholar : PubMed/NCBI
|
|
22
|
Ricciardelli C and Rodgers RJ:
Extracellular matrix of ovarian tumors. Semin Reprod Med.
24:270–282. 2006. View Article : Google Scholar : PubMed/NCBI
|
|
23
|
Hogdall EV, Christensen L, Hogdall CK,
Blaakaer J, Gayther S, Jacobs IJ, Christensen IJ and Kjaer SK:
Prognostic value of estrogen receptor and progesterone receptor
tumor expression in Danish ovarian cancer patients: from the
‘MALOVA’ ovarian cancer study. Oncol Rep. 18:1051–1059.
2007.PubMed/NCBI
|
|
24
|
Falcetta F, Lupi M, Colombo V and Ubezio
P: Dynamic rendering of the heterogeneous cell response to
anticancer treatments. PLoS Comput Biol. 9:e10032932013. View Article : Google Scholar : PubMed/NCBI
|
|
25
|
Siewinski M, Saleh Y, Gryboc M, Murawski
M, Ekonjo GB, Ziolkowski P, Janocha A and Symonowicz K:
Determination of cysteine peptidases-like activity and their
inhibitors in the serum of patients with ovarian cancer treated by
conventional chemotherapy and vitamin E. J Exp Ther Oncol.
4:189–193. 2004.PubMed/NCBI
|
|
26
|
Warwas M, Haczynska H, Gerber J and Nowak
M: Cathepsin B-like activity as a serum tumour marker in ovarian
carcinoma. Eur J Clin Chem Clin Biochem. 35:301–304.
1997.PubMed/NCBI
|
|
27
|
Kolwijck E, Massuger LF, Thomas CM, Span
PN, Krasovec M, Kos J and Sweep FC: Cathepsins B, L and cystatin C
in cyst fluid of ovarian tumors. J Cancer Res Clin Oncol.
136:771–778. 2010. View Article : Google Scholar : PubMed/NCBI
|
|
28
|
Epelman M, Chikwava KR, Chauvin N and
Servaes S: Imaging of pediatric ovarian neoplasms. Pediatr Radiol.
41:1085–1099. 2011. View Article : Google Scholar : PubMed/NCBI
|
|
29
|
Levicar N, Dewey RA, Daley E, Bates TE,
Davies D, Kos J, Pilkington GJ and Lah TT: Selective suppression of
cathepsin L by antisense cDNA impairs human brain tumor cell
invasion in vitro and promotes apoptosis. Cancer Gene Ther.
10:141–151. 2003. View Article : Google Scholar : PubMed/NCBI
|
|
30
|
Yang Z and Cox JL: Cathepsin L increases
invasion and migration of B16 melanoma. Cancer Cell Int. 7:82007.
View Article : Google Scholar : PubMed/NCBI
|