Introduction
The efficacy of chemotherapeutic treatments for the
majority of cancer types has improved in the last three decades,
although the highly toxic effects of chemotherapeutic drugs still
cause severe reductions in quality of life that present serious
problems in clinical medicine (1).
Therefore, developing effective low-toxicity anticancer drugs,
including those based on natural products, is important. In recent
years, polysaccharides from natural sources have received
increasing attention as an efficient herbal medicine for the
prevention and treatment of cancer because of their antitumor and
immunomodulatory activities and low toxicity (2,3). The
antitumor properties are generally related to their ability to
induce tumor cell apoptosis and activate macrophages (4).
Macrophages occupy a unique position in the immune
system because they can initiate natural immune responses and then
act as effector cells that help manage immune responses (5,6), such
as inflammation, angiogenesis and fighting an infection.
Macrophages can eliminate the advanced stage of tumors because of
their powerful functions, including phagocytosis and the release of
numerous proinflammatory cytokines [interleukin (IL) and tumor
necrosis factor (TNF)] and cytotoxic and inflammatory molecules
[nitric oxide (NO) and reactive oxygen species (ROS)] that
contribute to direct and/or indirect antitumor activities (7–9).
Recently, polysaccharides obtained from
microorganisms, fungi and plants have become regarded as the most
effective immune-regulating substances, and they have been shown to
be clinically effective. Polysaccharides have anti-inflammatory,
antihypoglycemic, antibacterial, and antitumor activities, and the
basic mechanisms underlying the therapeutic effects of fungal
polysaccharides, including their antitumor and immunostimulatory
activities, likely occur through the modulation and stimulation of
the complement system via macrophages (9). Since the discovery that Letinan, a
polysaccharide from Lentinus edodes (Berk.) Sing, inhibited
mouse sarcoma 180 and displayed low toxicity compared with chemical
antitumor drugs (10), a number of
polysaccharides with immunostimulatory and antitumor activities
from species such as Coriolus versicolor, Agaricus
blazei and Panax ginseng have been reported (11–13).
Tricholoma matsutake is a fungus belonging to
the subgenus Tricholoma. As a traditionally edible fungus in
Asian countries, particularly China, Japan and South Korea,
Tricholoma matsutake has been used for the prevention and
treatment of disease for several thousand years (14–16).
Our group recently isolated a novel polysaccharide from
Tricholoma matsutake named TMP-A, which has a backbone of
1,4-β-glucopyranose that branches at O-6, is composed of an
(1➝3)-α-galactopyranose residue and terminates with an
α-xylopyranose residue (17). TMP-A
also exhibits significant antitumor activities in vivo.
However, the immunomodulatory activity and mechanism of TMP-A
remain unclear. Here, we performed a proliferation assay,
phagocytosis assay and cell cycle analysis of macrophages and
sequenced the transcriptomes of macrophages of a control group and
TMP-A group using Illumina sequencing technology. The goal of the
present study was to identify differentially expressed genes (DEGs)
in macrophages between the control group and TMP-A group to help
determine the molecular mechanisms underlying the immunomodulatory
activity of TMP-A in macrophages.
Materials and methods
Materials
The reagent
2-(2-methoxy-4-nitrophenyl-)3-(4-nitrophenyl)-5-(2,4-disulfonic
acid benzene)-2H-tetrazolium monosodium salt (CCK-8) was purchased
from Dojindo Molecular Technologies, Inc. (Tokyo, Japan);
lipopolysaccharide (LPS), D-Hanks solution, RPMI-1640 medium, fetal
calf serum (FCS) and dimethyl sulfoxide (DMSO) were purchased from
Gibco (Grand Island, NY, USA). Penicillin G and streptomycin were
purchased from Sigma (Shanghai, China). All other chemicals and
solvents were of analytical grade, and TMP-A was prepared in our
laboratory as previously described (17).
Cell lines and reagents
The RAW264.7 cell line was cultured in RPMI-1640
medium containing 10% fetal bovine serum (FBS), 1% penicillin (100
IU/ml) and streptomycin (100 mg/l) in a humidified atmosphere with
5% CO2 at 37°C before use.
RAW264.7 cell proliferation assay
The cytotoxic effects of TMP-A on the RAW264.7 cells
were determined by the CCK-8-based colorimetric method. Briefly,
RAW264.7 cells suspended in RPMI-1640 medium at a density of
1×10⁵ cells/ml were pipetted into a 96-well plate (100
µl/well) and inoculated at 37°C in a humidified 5%
CO2 atmosphere. After incubation for 24 h, 100 µl
of the test sample at different concentrations was separately added
into each well and incubated at 37°C in a humidified 5%
CO2 atmosphere for 48 h. RPMI-1640 medium and 10
µg/ml LPS were used as the negative and positive controls,
respectively. Subsequently, 20 µl of CCK-8 reagent was added
to each well, and the plate was further incubated for another 1–4
h. The absorbance of the colored solution at 490 nm was measured on
a 96-well microplate reader (Bio-Rad Laboratories, Tokyo, Japan).
All of the experiments were performed in triplicate, and the
inhibitory rate was calculated as follows: Cell proliferation
activity (%) = [A2−A0]/[A1−A0] × 100 where A2 is the average
optical density of TMP-A-treated cells, A0 is the average optical
density of the control wells (culture medium without cells), and A1
is the average optical density of the negative control (culture
medium containing cells). Each value is presented as the mean ± SD
(n=4); *P<0.05 and **P<0.01 (vs.
control).
RAW264.7 cell phagocytosis assay
RAW264.7 cells were inoculated in the presence of
varying concentrations of TMP-A as described above. RPMI-1640
medium and LPS were used as the negative and positive controls,
respectively. After 24 h, the supernatants were removed, 100
µl of 0.075% neutral red solution was added to each well,
and the cells were cultured for an additional 1 h. The plate was
then washed three times with phosphate-buffered saline (PBS) and
patted gently with tissues to allow the plates to drain. Finally,
100 µl of cell lysis buffer (0.1 mol/l acetic acid and
ethanol in a 1:1 ratio) was added to each well at 4°C for 2 h. The
absorbance at 540 nm was determined using a microplate ELISA
reader. All of the analyses were conducted in triplicate. Each
value is presented as the mean ± SD (n=4); *P<0.05
and **P<0.01 (vs. control).
RAW264.7 cell cycle analysis by flow
cytometry
The effect of TMP-A on the cell cycle distribution
was assessed by flow cytometry after staining the cells with
propidium iodide (PI). RAW264.7 cells were seeded in 6-well plates
(5×10⁵ cells/well) and allowed to grow for one day
before being exposed to TMP-A (1, 5 or 10 µg/ml) for 72 h.
After incubation, the treated cells were harvested, washed twice
with PBS and fixed in cold 70% ethanol for 4 h or overnight at 4°C.
After an additional wash in cold PBS, the cells were resuspended in
0.5 ml of staining buffer containing 10 µl of RNase and 25
µl of PI, then incubated for 30 min in the dark at 37 °C.
The DNA content of the cells was measured using a flow cytometer
(Becton-Dickinson, Franklin Lakes, NJ, USA), and the population of
cells in each phase was calculated using the ModFit LT software
program. Each experiment was conducted three times.
RNA extraction, library preparation and
sequencing
TRIzol reagent (Invitrogen, Burlington, ON, Canada)
was used to extract the total RNA, and 1% agarose gels were used to
investigate the RNA contamination and degradation. RNA purity was
detected on a NanoPhotometer spectrophotometer (Implen, Inc.,
Westlake Village, CA, USA). After examining the RNA purity and
concentration, the RNA 6000 Nano Assay kit with NanoDrop 2000
(Thermo Scientific NanoDrop 2000c) was used to assess the RNA
integrity. A total of 3 µg of RNA per sample was used for
the RNA sample preparations as input material (18). Following the manufacturer's
recommendations, the transcriptome libraries were generated using
the Illumina TruSeq™ RNA Sample Preparation kit (Illumina, San
Diego, CA, USA). Clustering of the index-coded samples was
completed using the TruSeq PE Cluster kit v3-cBot-HS (Illumina) on
a cBot Cluster Generation System. The libraries were sequenced on
an Illumina HiSeq 2000 platform after clustering, and 100 bp
paired-end reads were generated (18).
Transcriptome data analysis
In-house Perl scripts were used to process the raw
data in FASTQ format to remove low quality reads, which contained
poly-N stretches (partially un-sequenced regions) and adapter
sequences. All of the downstream analyses are based on the
high-quality clean sequences.
Differential expression and
quantification analysis of the transcripts
Prior to performing the differential gene expression
analysis, the read counts were adjusted using an edgeR program
package for each sequenced library through one scaling normalized
factor. The reads per kilobase per million reads (RPKM) method was
used to quantify the transcript expression, and HTSeq v. 0.5.3 was
used to count the number of reads mapped to each transcript. The
RPKM value was calculated based on the mapped transcript fragments,
sequencing depth and transcript length (18). The edgeR Bioconductor was used to
complete the read counts with one scaling normalized factor before
the analysis of differential gene expression, which was completed
using the DEGSeq R package, release 1.12.0. A log2-fold change of
±1 and a P-value of 0.005 were set as the threshold of
statistically significant differential expression. A large
fold-change value (|log2-fold-change| >5) was also used to
identify DEGs.
GO annotation and GO/KEGG enrichment
analyses
The protein functions of all of the genes were
annotated using BLASTX and InterProScan against the NCBI database.
The resulting BLAST and InterPro annotations were then converted
into Gene Ontology (GO) annotations. All of the GO terms were
mapped to the GO slim categories. Fisher's exact test within
Blast2GO [false discovery rate (FDR) <0.05] was used to
determine the statistical significance of the functional GO slim
enrichment. A hyper geometric test and the Benjamini-Hochberg FDR
correction were used to identify significantly enriched Kyoto
Encyclopedia of Genes and Genomes (KEGG) pathways with KOBAS 2.0
(18).
Results
Proliferation of RAW264.7 cells following
TMP-A treatment in vitro
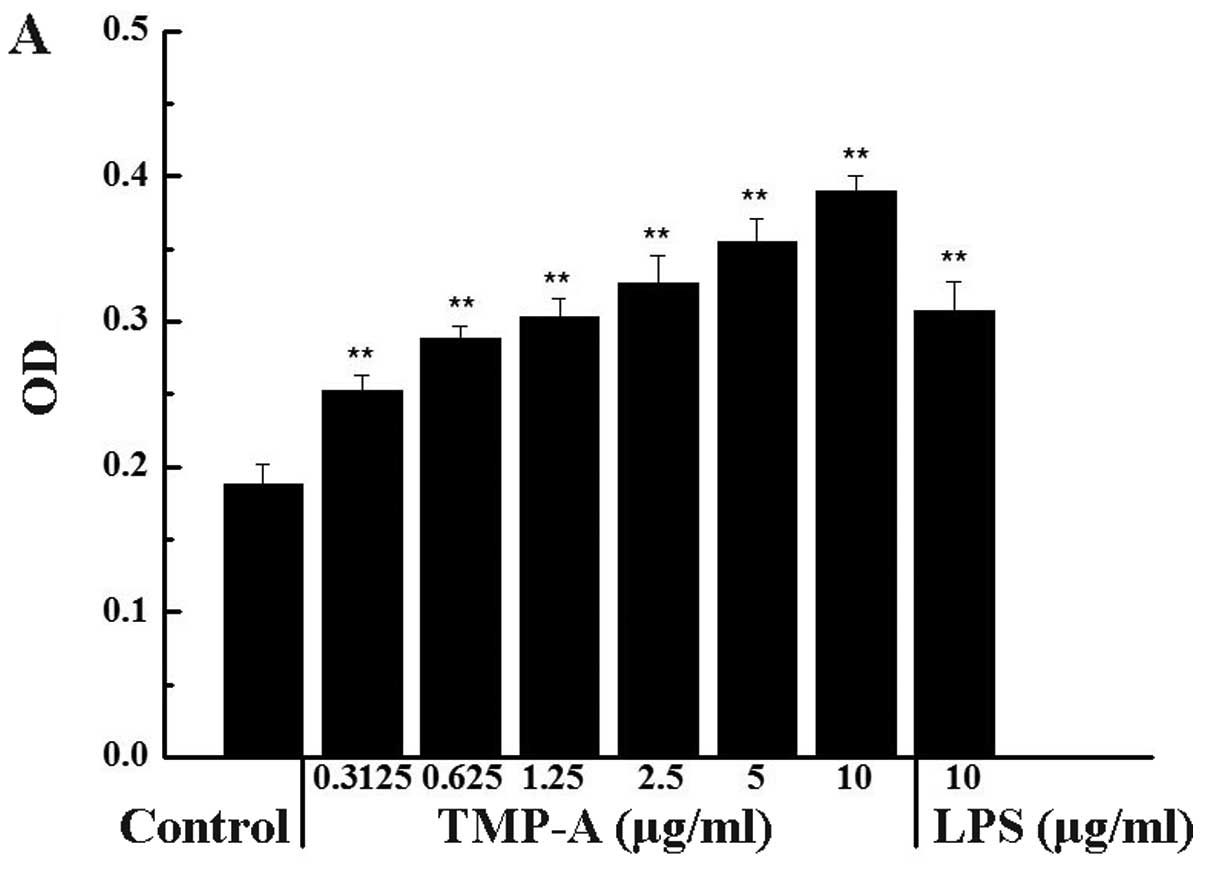
The cytotoxicity or stimulation of TMP-A on RAW264.7
cells is shown in Fig. 1A and B.
The cell proliferation activity was lowest when the macrophages
were exposed to medium alone, whereas the incubation of these cells
with increasing concentrations of TMP-A showed a dose-dependent
increase in cell proliferation. The highest concentration of TMP-A
significantly promoted RAW264.7 cell proliferation compared with
the control group (0.3125 µg/ml, P<0.05; 0.625–10
µg/ml, P<0.01). Furthermore, the cell proliferation
activity at a concentration of 10 µg/ml TMP-A was even
greater than the activity elicited by 10 µg/ml LPS.
Phagocytosis activity of RAW264.7 cells
following TMP-A treatment in vitro
The most striking feature of macrophage activation
is the increase in pinocytic activity. The pinocytic activity of
RAW264.7 cells following TMP-A treatment was examined by neutral
red uptake activity (0.075%). As shown in Fig. 1C, after 24-h incubation with varying
concentrations of TMP-A, the phagocytosis activity of RAW264.7 was
enhanced by TMP-A in the tested dose range in a dose-dependent
manner compared with the negative control. Furthermore, the
pinocytic activity at 5–10 µg/ml TMP-A was comparable to or
even greater than the activity elicited by 10 µg/ml LPS, a
positive control.
Effects of TMP-A on the cell cycle
distribution of RAW264.7 cells
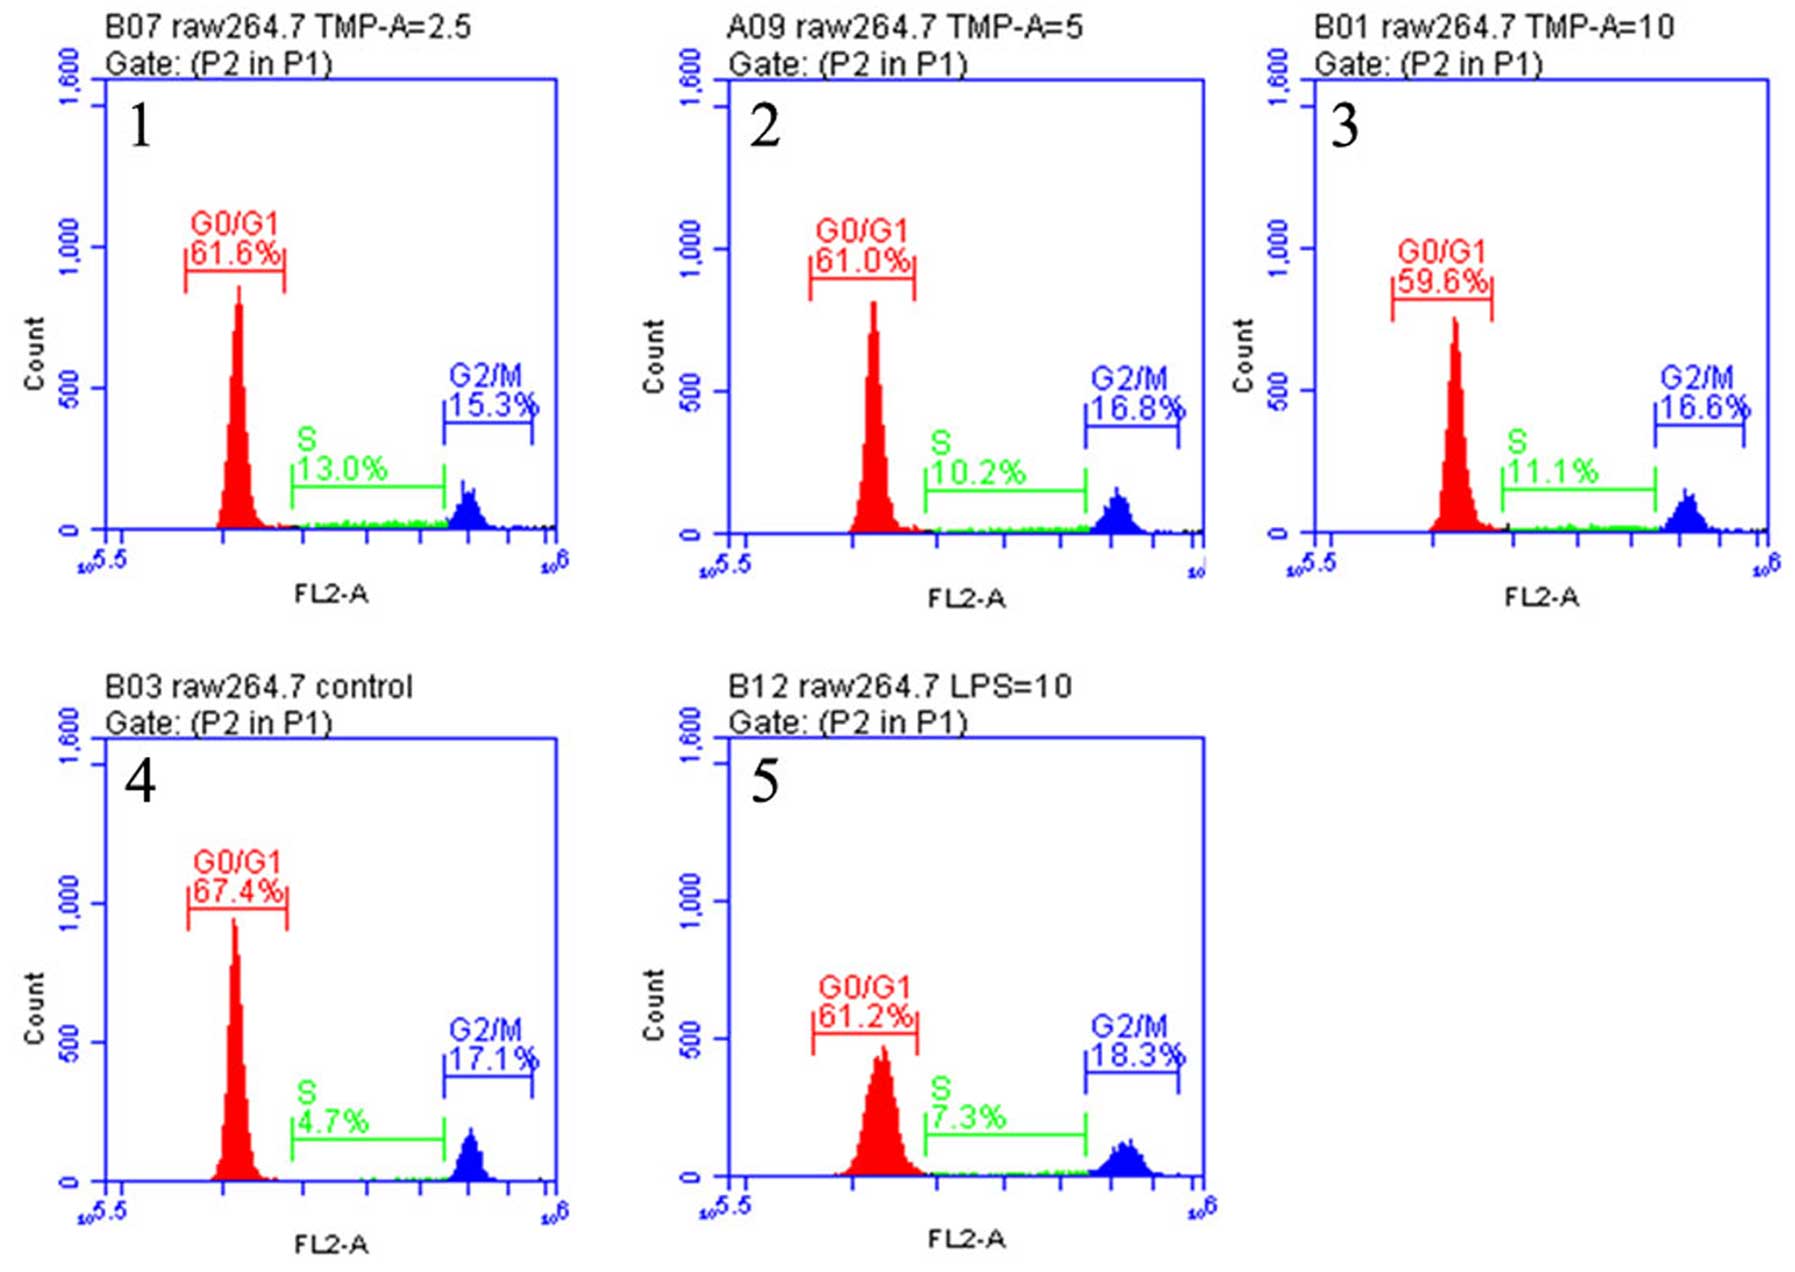
To examine the effects of TMP-A on cell cycle
progression, a cell cycle analysis was performed on RAW264.7 cells
using flow cytometry. Fig. 2 shows
the effects of TMP-A on the cell cycle phase (G0/G1, S and G2/M)
distribution of RAW264.7 cells using flow cytometry with PI
staining. The treatment of RAW264.7 cells with TMP-A at 2.5, 5 and
10 µg/ml for 72 h induced a significant and
concentration-dependent increase in the G2/M phase population from
17.1% of the control group to 15.3, 16.6 and 16.8%, respectively
(P<0.05 or P<0.01), with a concomitant decrease in the
percentage of cells in the G0/G1 phase from 67.4% of the control
group to 61.6, 61.0 and 59.6%, respectively. At the tested
concentrations, TMP-A also induced a significant change in the S
phase population, from 4.7% of the control group to 13.0, 10.2 and
11.1%, respectively. These results suggested that TMP-A could
promote the proliferation of macrophage cells by abolishing cell
cycle arrests in the G0/G1 and G2/M phases and promoting cell cycle
progression in S phase, which might induce cell division.
Transcriptome sequencing and de novo
assembly
To explore differences in the RAW264.7 cell
transcriptomes between the control group and the TMP-A group, two
cell groups were selected for analysis. Two cDNA libraries were
constructed with the respective total RNA from the control group
and TMP-A group. The prepared libraries were sequenced on an
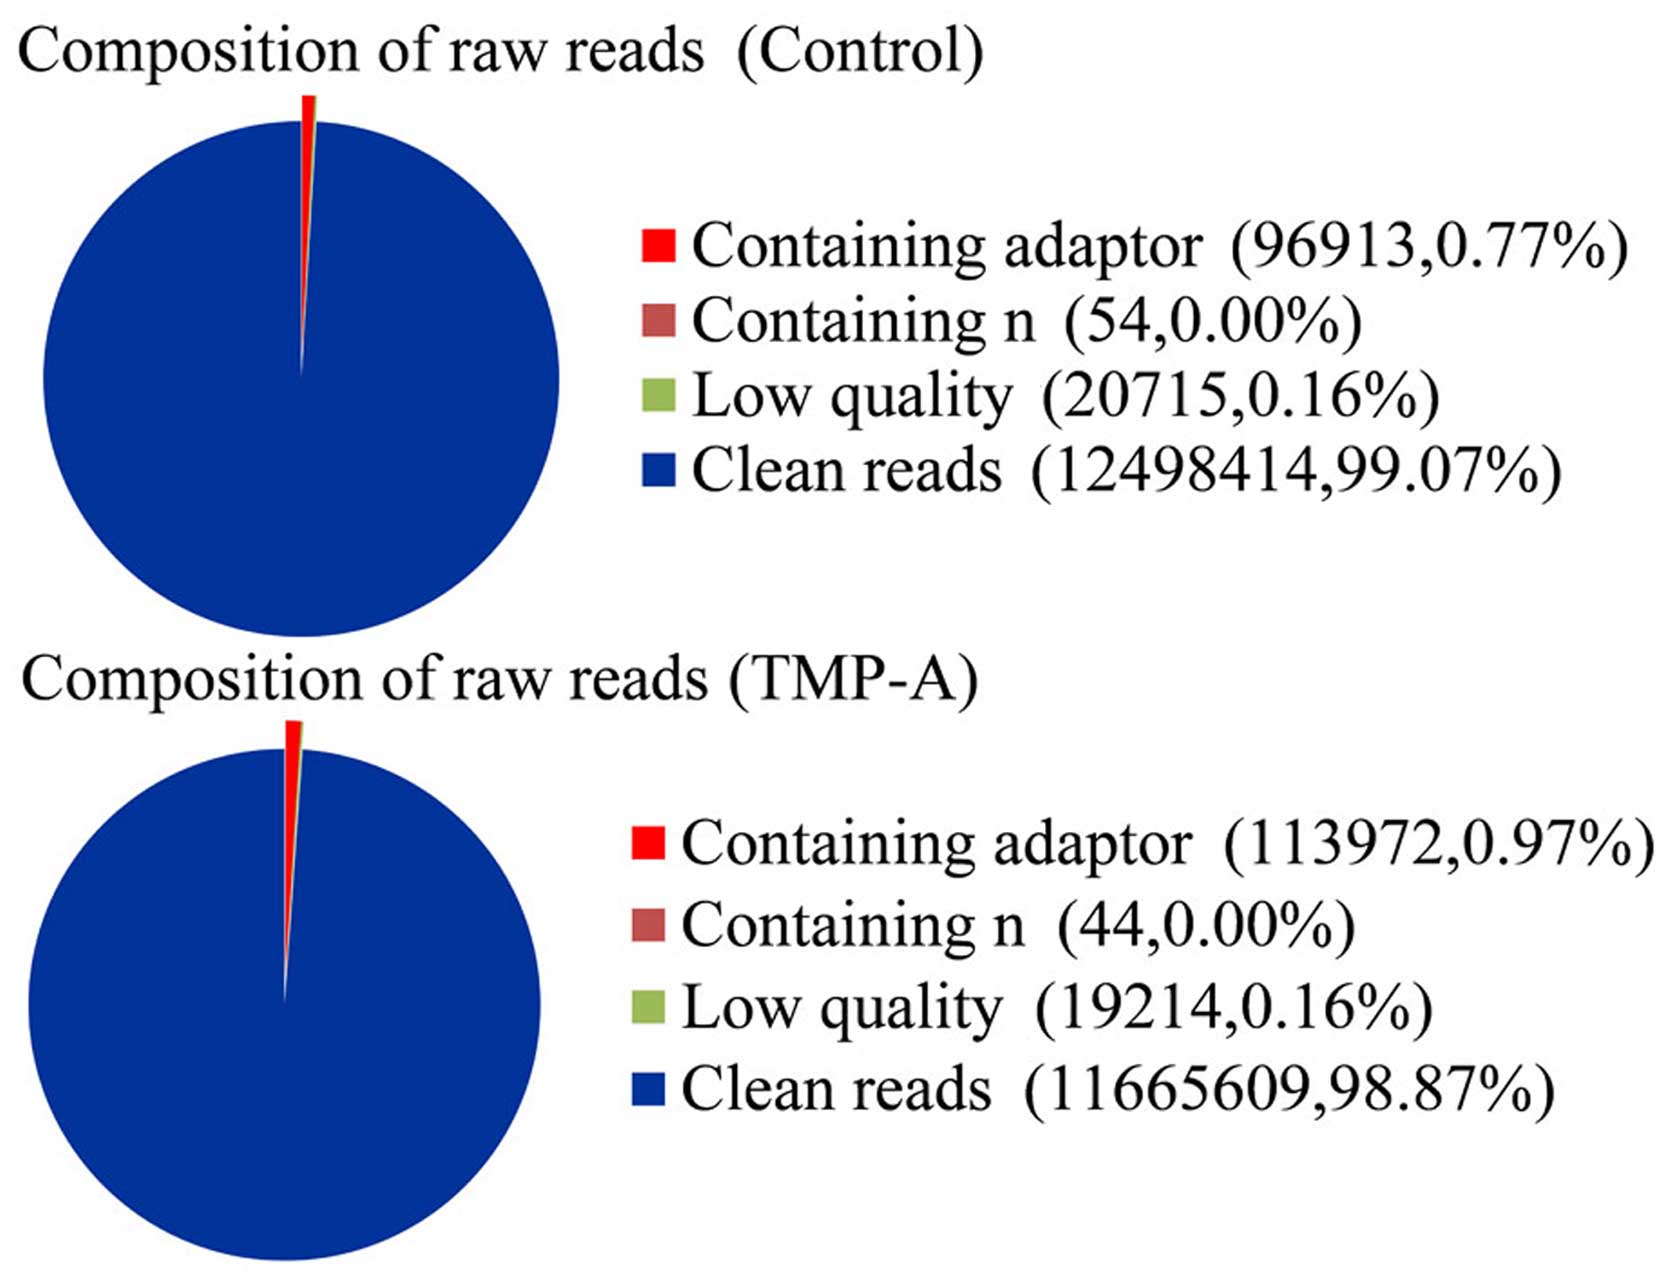
Illumina HiSeq 2000 platform. After quality control, a total of
12,616,096 and 11,798,839 bp paired-end reads were obtained for the
control and TMP-A groups, respectively, which corresponded to a
total size of 12.5 G bp and 11.7 G bp, respectively, after the
low-quality reads and adapter sequences were removed (Table I and Fig. 3). We mapped the clean reads to the
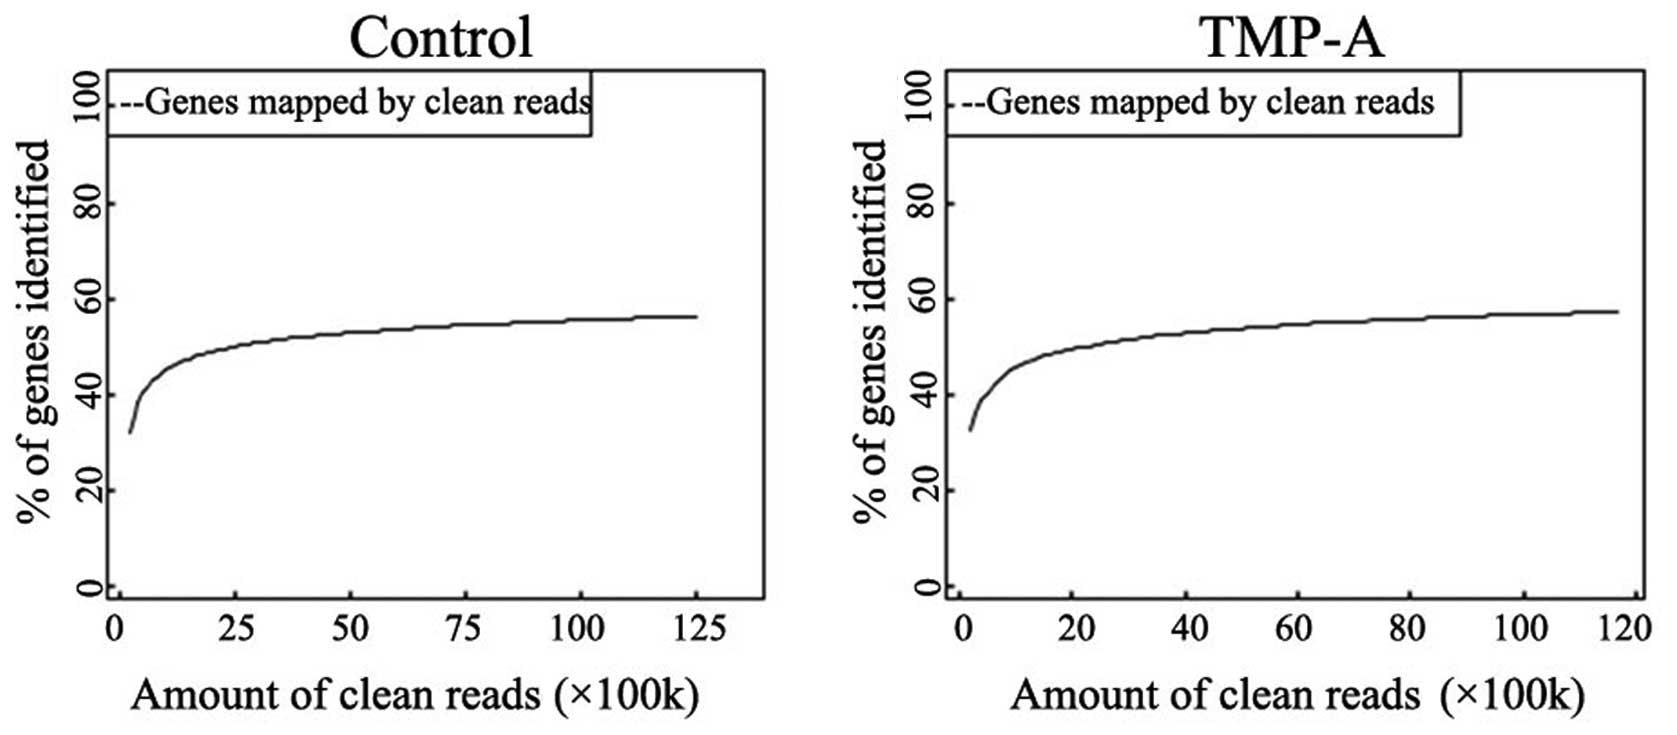
RAW264.7 cell reference genome. The proportion of total reads in
the two RAW264.7 cell transcriptome libraries that mapped to the
genome ranged from 41.04 to 43.29%. A sequencing saturation
analysis showed that the number of genes detected by the library
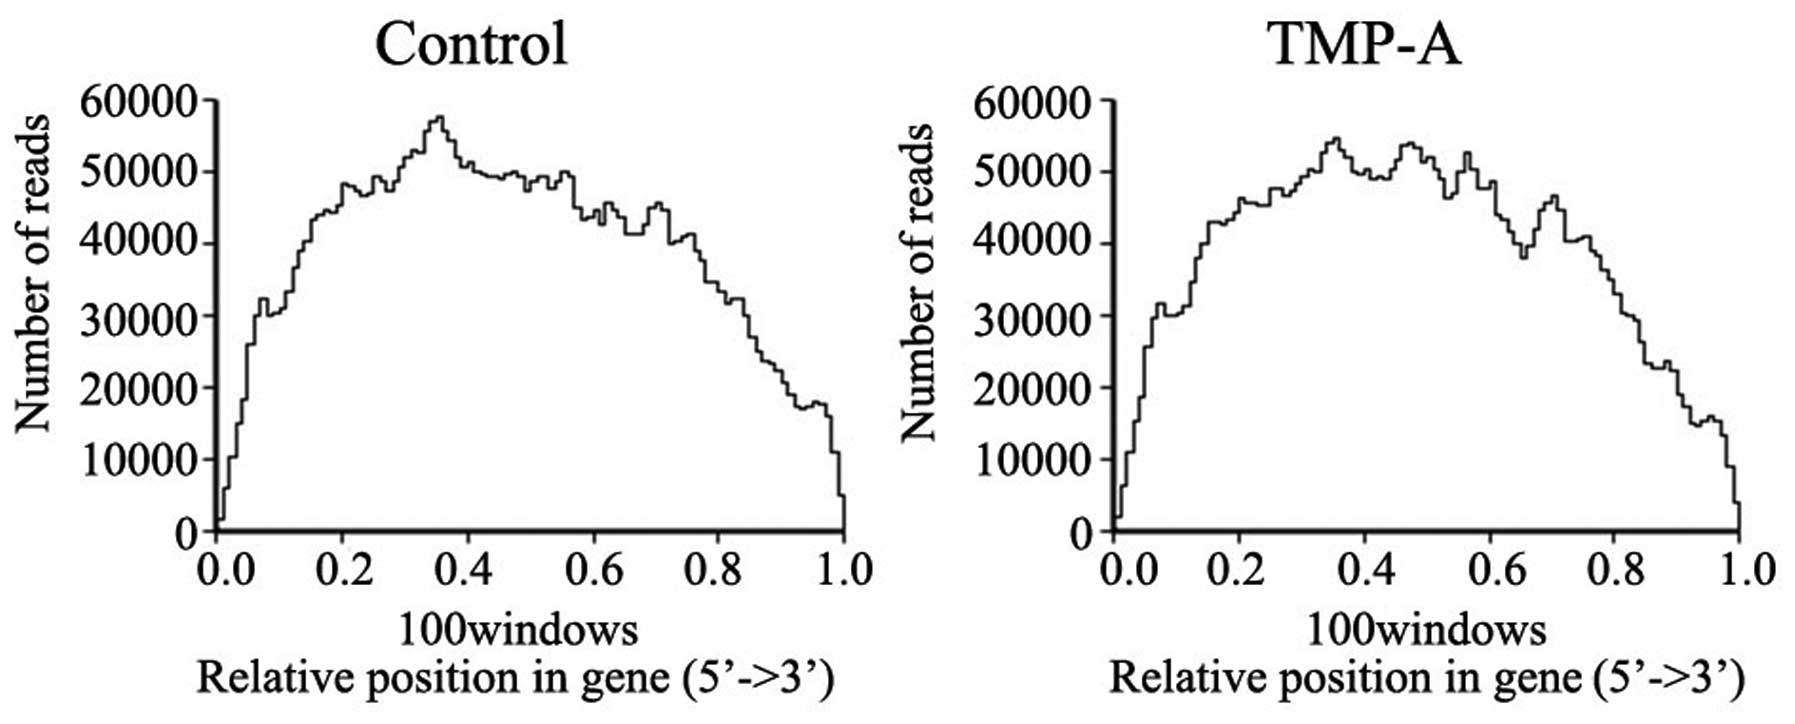
was saturated (Fig. 4). A 5′-3′
sequence preference statistical analysis showed that the sequencing
was mainly focused on the gene body region, and the bias at the two
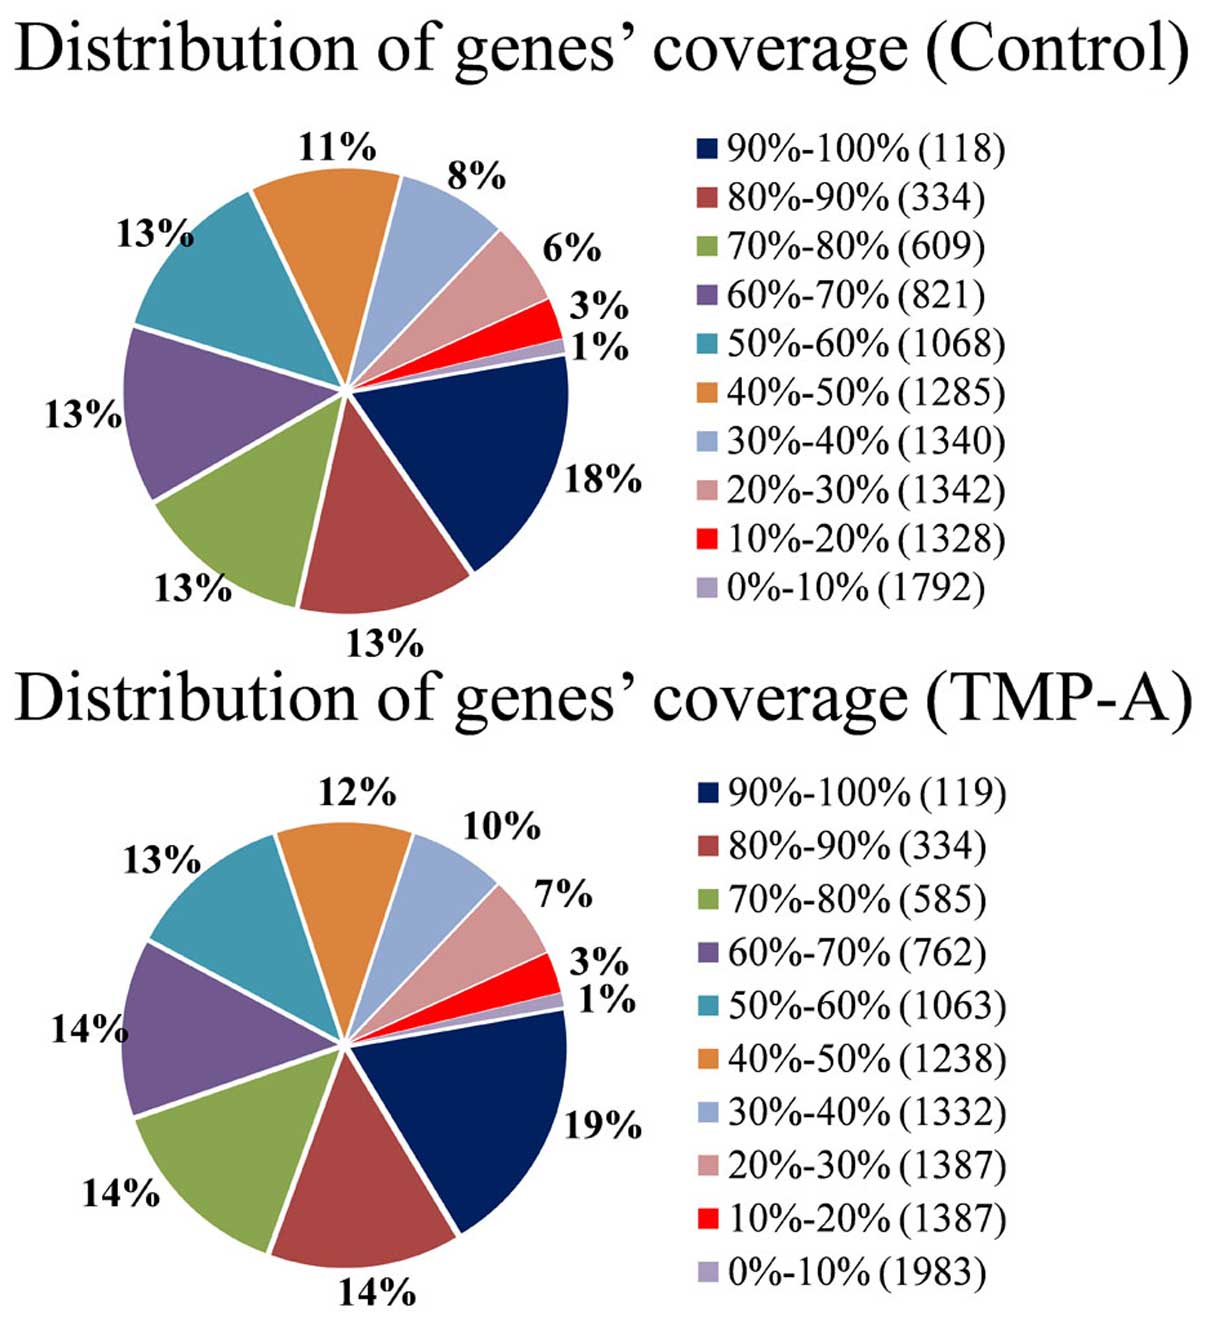
ends was limited (Fig. 5). The
distribution of gene coverage is shown in Fig. 6 and provides a good basis for the
follow-up analysis.
 | Table ISummary of the mapping results
(mapping to reference genome). |
Table I
Summary of the mapping results
(mapping to reference genome).
| Sample ID | Total reads | Total base
pairs | Total mapped
reads | Perfect match | ≤2 bp mismatch | Unique match | Multi-position
match | Total unmapped
reads |
|---|
| Control |
12,498,414
(100.00%) |
612,422,286
(100.00%) | 5,129,004
(41.04%) | 985,094
(7.88%) | 4,143,910
(33.16%) | 3,166,326
(25.33%) | 1,962,678
(15.70%) | 7,369,410
(58.96%) |
| TMP-A |
11,665,609
(100.00%) |
571,614,841
(100.00%) | 5,050,408
(43.29%) | 944,319
(8.09%) | 4,106,089
(35.20%) | 3,045,421
(26.11%) | 2,004,987
(17.19%) | 6,615,201
(56.71%) |
Transcriptome profiles of the two
RAW264.7 cell groups
The abundance of all the genes was calculated and
normalized using uniquely mapped reads by the RPKM method. The
distribution of the expression levels of all the genes was similar
for the two groups. Genes with RPKMs over 60 were considered to be
expressed at a high level, whereas genes with RPKMs in the interval
0-1 were considered to be expressed at low levels or not at all.
The results showed that in the control group, ~81.8% of the total
number of genes (10,038) were expressed (RPKM ≥1) and more than
1,333 genes were highly expressed (RPKM >60), whereas in the
TMP-A group, ~79.8% of the total number of genes (10,191) were
expressed (RPKM ≥1) and >1,372 genes were highly expressed (RPKM
>60).
The results also showed that eight genes (Eef1α1,
Fth1, Rpl23, Rps24, Rps6, Tpt1, Rpl5 and Rplp2) were extremely
highly expressed (RPKM >10,000) in the control group (Table II), whereas seven genes (Fth1,
Eef1α1, Rps24, Rpl23, Rps6, Rplp2 and Tpt1) were extremely highly
expressed (RPKM >10,000) in the TMP-A group (Table III). It is worth noting that the
RPKM of the Fth1 gene was 16,044 in the control group and 78,552 in
the TMP-A group. The Fth1 gene encodes the heavy subunit of
ferritin, which is the major intracellular iron storage protein in
eukaryotes and composed of 24 subunits of light and heavy ferritin
chains. Changes in the ferritin subunit composition may affect iron
absorption and release in different tissues. One of the major
functions of ferritin is iron storage in a non-toxic and soluble
state (19,20). These results are consistent with the
proliferation and phagocytosis activities of RAW264.7 cells
following TMP-A treatment in vitro.
| Table IIQuantification of gene expression in
the control group (RPKM >10,000). |
Table II
Quantification of gene expression in
the control group (RPKM >10,000).
| Gene ID | Uniq_reads
_num | Length | Coverage | RPKM | Symbol | Description | KEGG orthology |
|---|
| 171361 | 175276 | 1737 | 97.64% | 27073.88 | Eef1a1 | Eukaryotic
translation elongation factor 1 α 1 | K03231 |
| 25319 | 49515 | 828 | 99.88% | 16044.80 | Fth1 | Ferritin, heavy
polypeptide 1 | K00522 |
| 81763 | 40233 | 1069 | 92.33% | 10097.94 | Rpl5 | Ribosomal protein
L5 | K02932 |
| 29304 | 39202 | 801 | 82.90% | 13131.18 | Rps6 | Ribosomal protein
S6 | K02991 |
| 116646 | 35323 | 794 | 95.59% | 11936.17 | Tpt1 | Tumor protein,
translationally-controlled 1 | – |
| 29282 | 29570 | 518 | 89.38% | 15316.15 | Rpl23 | Ribosomal protein
L23 | K02894 |
| 81776 | 24758 | 466 | 93.56% | 14254.68248 | Rps24 | Ribosomal protein
S24 | K02974 |
| 1406 | 19179 | 453 | 86.31% | 11359.41 | Rplp2 | Ribosomal protein,
large P2 | K02943 |
| Table IIIQuantification of gene expression in
the TMP-A group (RPKM > 10,000). |
Table III
Quantification of gene expression in
the TMP-A group (RPKM > 10,000).
| Gene ID | Uniq_reads_num | Length | Coverage | RPKM | Symbol | Description | KEGG orthology |
|---|
| 25319 | 237268 | 828 | 99.88% | 78552.08078 | Fth1 | Ferritin, heavy
polypeptide 1 | K00522 |
| 171361 | 143447 | 1737 | 97.58% | 22638.13 | Eef1a1 E | ukaryotic
translation elongation factor 1 α 1 | K03231 |
| 29304 | 34196 | 801 | 81.52% | 11702.85 | Rps6 | Ribosomal protein
S6 | K02991 |
| 116646 | 29917 | 794 | 95.59% | 10328.72 | Tpt1 | Tumor protein,
translationally-controlled 1 | – |
| 29282 | 27912 | 518 | 90.15% | 14771.01 | Rpl23 | Ribosomal protein
L23 | K02894 |
| 81776 | 26041 | 466 | 93.56% | 15318.65 | Rps24 | Ribosomal protein
S24 | K02974 |
| 140662 | 17295 | 453 | 86.31% | 10465.77 | Rplp2 | Ribosomal protein,
large P2 | K02943 |
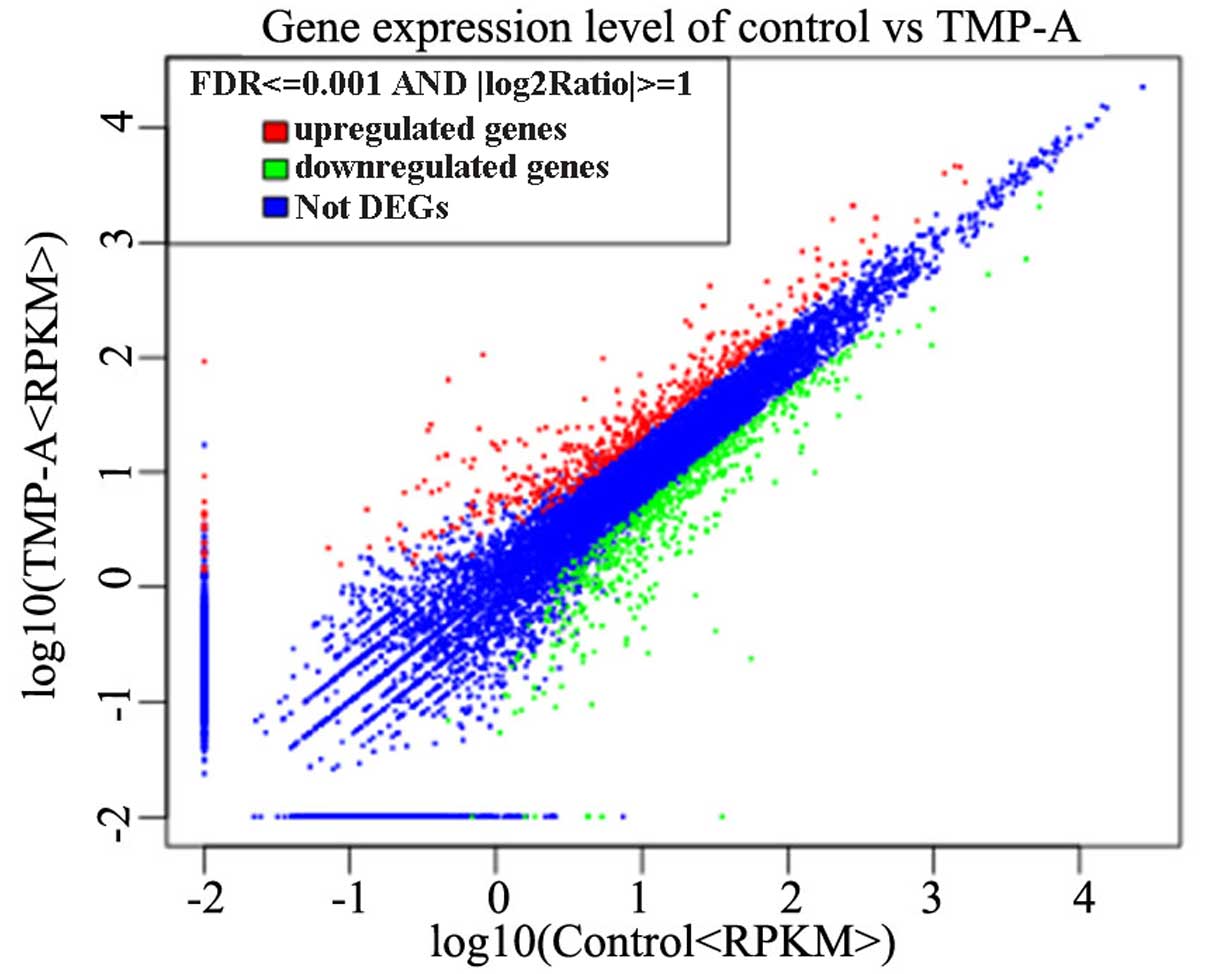
Differentially expressed genes between
the control and TMP-A groups
The reads were adjusted using the edgeR program with
one scaling normalized factor, and the DEGs between the two cell
groups were identified using the DEGSeq R package. Values of FDR
≤0.001 and |log2 ratio| ≥1 were set as the thresholds for
significant differential expression. Our research group performed
hierarchical clustering for all of the DEGs based on the log10
RPKMs of the two cells groups to observe the gene expression
patterns (Fig. 7). A total of 1,043
unigenes were identified as DEGs, and ~486 genes were upregulated,
whereas 557 genes were downregulated (Fig. 7), which might have contributed to
the proliferation and phagocytosis activities of RAW264.7 cells
following TMP-A treatment in vitro. The numbers of DEGs in
the control vs. TMP-A were 316 for transcripts detected with
|log2-fold-change| >2 and 35 for transcripts detected with
|log2-fold-change| >5. Among the DEGs within the
|log2-fold-change| >5 threshold, 24 genes were upregulated,
including Ifi44, Ifit1, Ifit3, Il13rα2 and Il1α, among others,
whereas 11 genes were downregulated, including RT1-Da, RT1-Db2 and
C1qa, among others (Tables IV and
Table V).
| Table IVDifferentially expressed genes:
upregulated (|log2-fold-change| >5). |
Table IV
Differentially expressed genes:
upregulated (|log2-fold-change| >5).
| Gene ID | Gene_length | log2 ratio
(TMP-A/control) | Symbol | Description | KEGG orthology |
|---|
| 170496 | 876 | 13.15758 | Lcn2 | Lipocalin 2 | K01830; K03999 |
| 287561 | 807 | 9.84101 | Ccl7 | Chemokine (C-C
motif) ligand 7 | K05509 |
| 501162 | 645 | 9.109831 | Mreg | Melanoregulin | – |
| 310969 | 2922 | 8.814769 | Ifi44 | Interferon-induced
protein 44 | – |
| 24599 | 3793 | 8.784161 | Nos2 | Nitric oxide
synthase 2, inducible | K13241 |
| 24443 | 2367 | 8.743156 | Hdc | Histidine
decarboxylase | K01590 |
| 305475 | 3952 | 8.676823 | Osbp2 | Oxysterol binding
protein 2 | K08283 |
| 305064 | 4165 | 8.446367 | Ptpn14 | Protein tyrosine
phosphatase, non-receptor type 14 | K01104 |
| 56824 | 2174 | 8.411298 | Ifit1 | Interferon-induced
protein with tetratricopeptide repeats 1 | K14217 |
| 360580 | 1371 | 8.321534 | Dusp14 | Dual specificity
phosphatase 14 | K04459 |
| 113992 | 2351 | 7.935806 | Ugt1a6 | UDP
glucuronosyltransferase 1 family, polypeptide A6 | K00699 |
| 171091 | 1692 | 7.924924 | Zbp1 | Z-DNA binding
protein 1 | K12965 |
| 65054 | 1740 | 7.678115 | Aqp9 | Aquaporin 9 | K09877 |
| 309526 | 2053 | 7.64592 | Ifit3 | Interferon-induced
protein with tetratricopeptide repeats 3 | K14217 |
| 171060 | 1915 | 7.539858 | Il13ra2 | Interleukin 13
receptor, α 2 | K05077 |
| 292912 | 2355 | 7.241475 | Rasip1 | Ras interacting
protein 1 | K05702 |
| 65190 | 3628 | 7.165516 | Rsad2 | Radical S-adenosyl
methionine domain containing 2 | K15045 |
| 360468 | 3154 | 7.11958 | Emp2 | Epithelial membrane
protein 2 | K08341 |
| 81780 | 570 | 7.086246 | Ccl5 | Chemokine (C-C
motif) ligand 5 | K12499 |
| 293624 | 1985 | 7.010151 | Irf7 | Interferon
regulatory factor 7 | K09447 |
| 79253 | 3014 | 6.190835 | Avil | Advillin | K08017 |
| 298698 | 1570 | 6.075358 | Angptl6 | Angiopoietin-like
6 | K10104; K05467 |
| 64387 | 4114 | 5.180711 | Ccdc80 | Coiled-coil domain
containing 80 | – |
| 24493 | 1992 | 5.045914 | Il1a | Interleukin 1
α | K04383 |
| Table VDifferentially expressed genes:
downregulated (|log2-fold-change| >5). |
Table V
Differentially expressed genes:
downregulated (|log2-fold-change| >5).
| Gene ID | Gene_length | log2 ratio
(TMP-A/control) | Symbol | Description | KEGG orthology |
|---|
| 294269 | 1212 | −11.7903 | RT1-Da | RT1 class II, locus
Da | K06752 |
| 362634 | 1060 | −9.05405 | C1qc C | omplement component
1, q subcomponent, C chain | K03988 |
| 554353 | 1299 | −8.76072 | Gpr34 | G protein-coupled
receptor 34 | K08383 |
| 24981 | 1134 | −8.7343 | RT1-Db2 | RT1 class II, locus
Db2 | K06752 |
| 309621 | 1145 | −7.87593 | RT1-Ba | RT1 class II, locus
Ba | K06752 |
| 24499 | 4529 | −7.5208 | Il6r | Interleukin 6
receptor | K05055 |
| 295283 | 2887 | −7.30369 | Ankrd34a | Ankyrin repeat
domain 34A | – |
| 171056 | 1318 | −6.26366 | Cx3cr1 | Chemokine (C-X3-C
motif) receptor 1 | K04192 |
| 291327 | 5091 | −6.09829 | Mrc1 | Mannose receptor, C
type 1 | K06560 |
| 361086 | 2886 | −5.58375 | Scel | Sciellin | K06084 |
| 298566 | 1025 | −5.36135 | C1qa | Complement
component 1, q subcomponent, A chain | K03986 |
IL-1 is involved in the regulation of immune
response, inflammatory response and hematopoietic function.
Interferons (IFNs) are a set of signals released by the host cells
in response to pathogen release proteins, such as those from
bacteria, parasites, viruses or tumor cells. IFNs belong to a
category of proteins called cytokines, which protect and promote
the immune system and help eliminate pathogens (21,22).
IFNs also have a variety of other functions,
including the activation of immune cells, such as macrophages and
the regulation of the immune system. Both of these functions are
important against antiviral infection. By interacting with specific
receptors, IFNs activate signal transducer and activator of
transcription (STAT) complexes. STATs are a family of transcription
factors that regulate the expression of certain immune system
genes. Type I IFNs further activate p38 mitogen-activated protein
kinase to promote gene transcription (23). The antiproliferative and antiviral
effects of type I IFNs are derived from p38 mitogen-activated
protein kinase (MAPK) signaling. The phosphatidylinositol 3-kinase
signaling pathway is also regulated by type I and II IFNs (24,25).
Based on experimental data and the results from our previous study,
we believe that the significant antitumor activities of TMP-A in
vivo may involve the MAPK signaling pathway of macrophages.
GO and KEGG enrichment analyses of the
differentially expressed genes
GO analyses were used to confirm the functional
classifications of the annotated unigenes and classify the
transcripts with known proteins. A total of 39,271 genes were
annotated with GO terms, which were converted to generic GO slim
terms. The GO enrichment analysis was performed using Fisher's
exact test in Blast2GO to analyze the gene functions of the DEGs.
The analysis generated 13,042 assignments to cellular components,
13,094 assignments to biological processes, and 13,135 assignments
to molecular functions. In the category of cellular components
(Table III), 98.40 and 98.40% of
the unigenes were located in cell parts (GO:0044464) and cells
(GO:0005623), respectively. Most of the biological process
categories were related to cellular processes (GO:0009987, 77.70%)
and metabolic processes (GO:0008152, 58.00%). Under the molecular
functions, the majority of the GO terms were grouped into binding
(GO:0005488, 86.60%) and catalytic activity (GO:0008152, 45.20%)
(Table VI). These results
suggested that the immune mechanisms may present additional
differences between the control group and TMP-A group.
| Table VIGene Ontology enrichment analysis of
the DEGs. |
Table VI
Gene Ontology enrichment analysis of
the DEGs.
| Gene Ontology
term | Cluster
frequency | Genome frequency of
use | Corrected
P-value |
|---|
| Cell | | | |
| GO:0044464 | 887 out of 901
genes, 98.4% | 12602 out of 13042
genes, 96.6% | 0.08999 |
| Cell part | | | |
| GO:0005623 | 887 out of 901
genes, 98.4% | 12602 out of 13042
genes, 96.6% | 0.08999 |
| Cellular
process | | | |
| GO:0009987 | 682 out of 878
genes, 77.7% | 8844 out of 13094
genes, 67.5% | 8.64e-09 |
| Metabolic
process | | | |
| GO:0008152 | 509 out of 878
genes, 58.0% | 6505 out of 13094
genes, 49.7% | 0.00035 |
| Binding | | | |
| GO:0005488 | 753 out of 870
genes, 86.6% | 9931 out of 13135
genes, 75.6% | 4.17e-14 |
| Catalytic
activity | | | |
| GO:0008152 | 393 out of 870
genes, 45.2% | 4776 out of 13135
genes, 36.4% | 7.59e-06 |
The pathway analysis was conducted using the KEGG
pathway database to further understand the biological function of
the gene products. The KEGG pathway enrichment analysis was
performed using KOBAS (KEGG Orthology Based Annotation System,
v2.0). A KEGG analysis records the molecular interaction networks
in cells with variants that are specific to particular organisms.
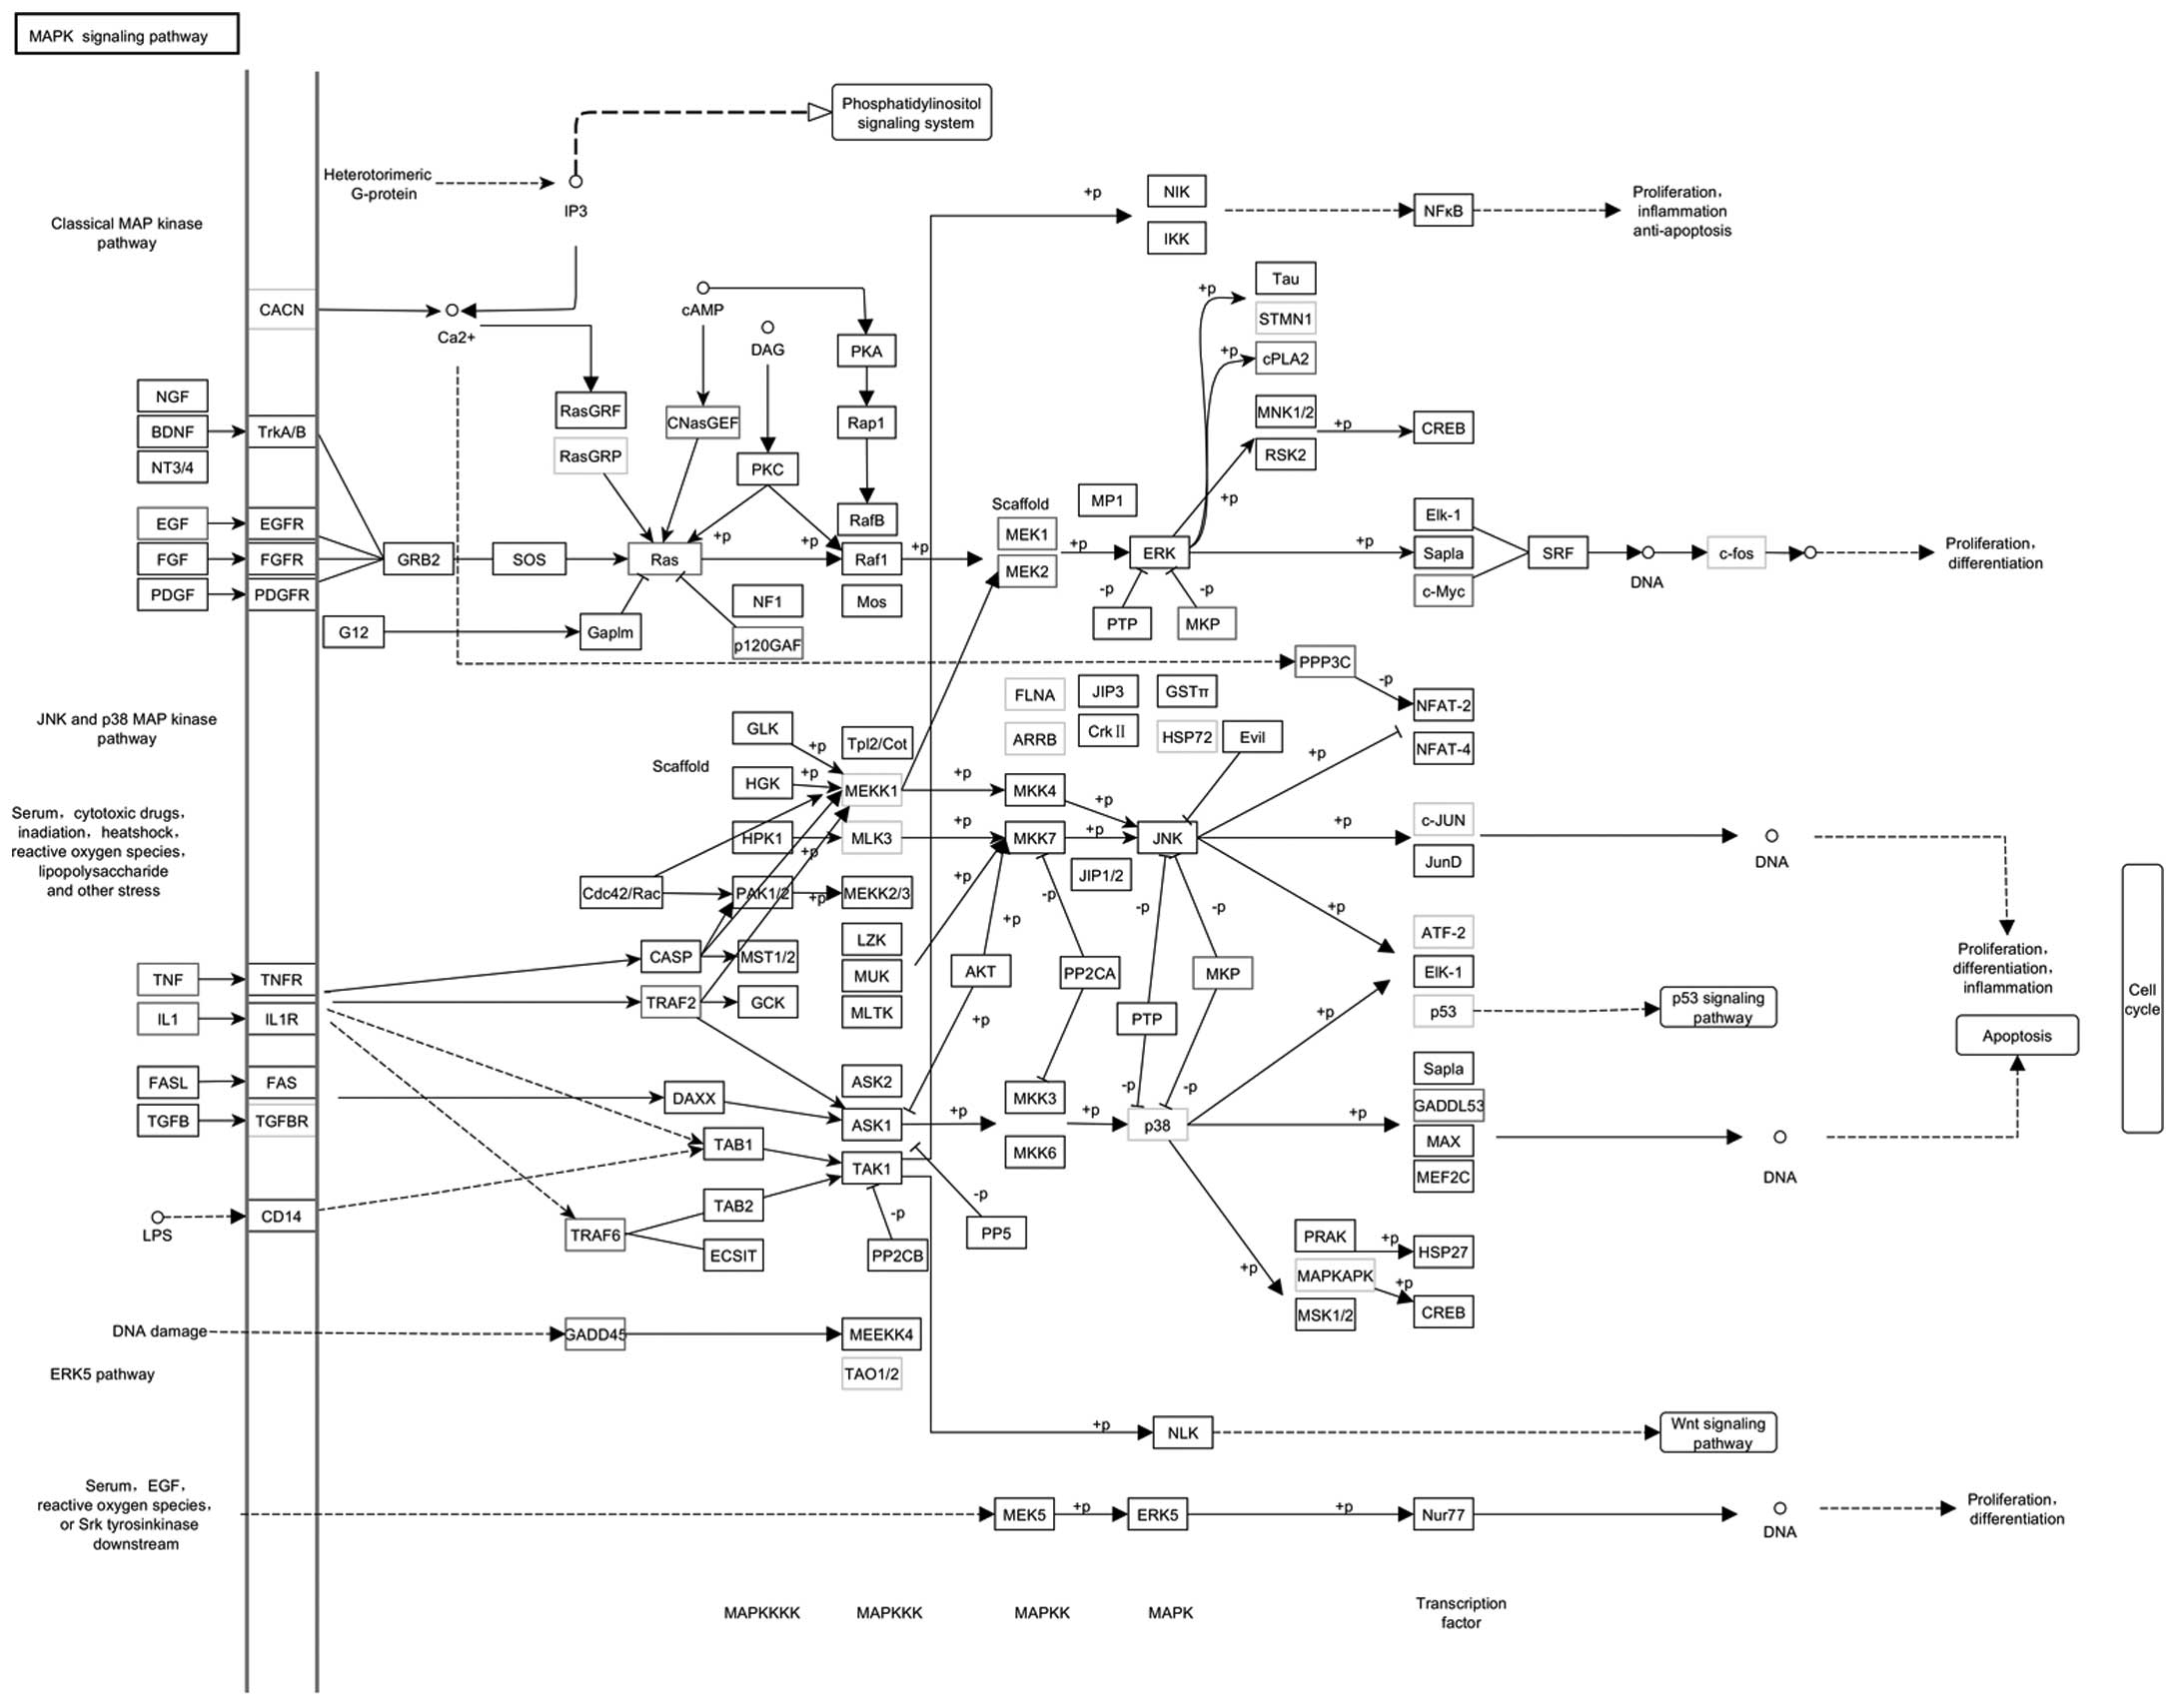
We found that the MAPK signaling pathway (45 DEGs with pathway
annotation: 5.10%) (Fig. 8A) and
the NF-κB signaling pathway (20 DEGs with pathway annotation:
2.27%) (Fig. 8B) are significantly
enriched in the DEGs between the two cell groups (Table VII). This result also supported
our previous hypothesis that the significant antitumor activities
of TMP-A in vivo might involve the MAPK signaling pathway of
macrophages and might also include the NF-κB signaling pathway
because there are intersections between the two signaling
pathways.
| Table VIIKEGG pathway enrichment analysis of
the DEGs. |
Table VII
KEGG pathway enrichment analysis of
the DEGs.
| Pathway | DEGs with pathway
annotation (883) | All genes with
pathway annotation (13697) | P-value | Q-value | Pathway ID |
|---|
| MAPK signaling
pathway | 45 (5.1%) | 357 (2.61%) | 1.150435e-05 | 1.794679e-04 | ko04010 |
| NF-κB signaling
pathway | 20 (2.27%) | 144 (1.05%) | 0.0009255778 | 6.016256e-03 | ko04064 |
| Cell cycle | 34 (3.85%) | 150 (1.1%) | 7.470169e-11 | 5.826732e-09 | ko04110 |
It is worth noting that the cell cycle between the
two cell groups (34 DEGs with pathway annotation: 3.85%) is also
significantly enriched for DEGs. These results indicated that TMP-A
could promote the proliferation of macrophage cells by abolishing
cell cycle arrest in the G0/G1 phase and promoting cell cycle
progression in the G2/M phase, which might induce cell
division.
Discussion
High-throughput and low-cost NGS technologies, such
as RNA-Seq, have become popular and useful not only for de
novo genome assembly and genome diversity studies but also to
investigate gene expression profiles and discover pharmacological
activity mechanisms. In our previous studies, the polysaccharide
TMP-A exhibited significant antitumor activities in vivo.
The inhibitory rate in mice treated with 80 mg/kg TMP-A reached
68.422%, which might be comparable to the effects of mannatide.
However, the immunomodulatory activity and mechanism of TMP-A
remain unclear. Here, we performed a proliferation assay,
phagocytosis assay and cell cycle analysis of macrophages, and the
results showed that TMP-A exhibits strong proliferation and
phagocytosis activities on RAW264.7 cells in vitro and could
also promote the proliferation of macrophage cells by abolishing
cell cycle arrest in the G0/G1 and G2/M phases and promoting cell
cycle progression in S phase, which might induce cell division. To
determine the mechanisms underlying the TMP-A effects on RAW264.7
cells and antitumor and immune activity, we sequenced the
transcriptomes of macrophages of the control group and the TMP-A
group using Illumina sequencing technology.
Our analysis identified 45 DEGs in the MAPK
signaling pathway, 25 of which were upregulated in the TMP-A group
(Fig. 8A), including EGF [K04357:
294559 (2.8)], c-Myc [K04377: 24577 (4.9)], IL-1 [K04383: 24493
(5.0); K04519: 24494 (3.5)] and TNF [K03156: 24835 (1.1)], whereas
20 were downregulated, including c-JUN [K03283: 24468 (−1.0)] and
p38 [K04441: 81649 (−1.6)]. The MAPK signaling cascade is a common
signal transduction module that connects different
receptors/sensors to nuclear and cellular responses. The classical
MAPK signaling cascade consists of three types of phosphorylated
kinases: MAPK, MAPK kinase (MAPKK/MEK), and MAPK kinase kinase
(MAPKKK/MEKK) (25). In the MAPK
signaling pathway, EGF acts by binding to epidermal growth factor
receptors (EGFRs) on the cell surface, which leads to cell
proliferation, differentiation and survival. This process
stimulates ligand dimerization and starts a signal transduction
cascade reaction that results in a series of biochemical changes in
cells as well as increased intracellular calcium levels, glycolysis
and protein synthesis, with these changes eventually causing cell
proliferation and DNA synthesis (26). This process would adequately explain
the mechanism of the TMP-A proliferation activity on
macrophages.
The IL-1 family is produced by macrophages,
fibroblasts, monocytes, and these proteins play a significant role
in the regulation of inflammatory and immune responses to
infections. Thus, the upregulated DEGs in the MAPK signaling
pathway in the TMP-A group might be associated with the high
immunomodulatory activity of TMP-A on RAW264.7 cells in
vitro.
Moreover, of the 20 DEGs in the NF-κB signaling
pathway (Fig. 8B), 17 were
upregulated in the TMP-A group, including IL-1β [K04519: 24494
(3.5)], TNFα [K03156: 24835 (1.1)], TRAF6 [K03175: 114635 (1.0)]
and COX2 [K11987: 29527 (2.2)], whereas only 3 were downregulated,
including LTB [K03157: 361795 (−1.2)]. The NF-κB family plays
important roles in the immune system by regulating the expression
of cytokines, inducible nitric oxide synthase (iNOS),
cyclooxygenase 2 (COX-2) and growth factors. Under normal
circumstances, the activation of NF-κB occurs because of the
release of IκB molecules (27). In
the classical activation pathway, signaling occurs by tumor
necrosis factor receptor (TNFR), interleukin-1 receptor (IL-1R) and
Toll-like receptors (TLRs). TNFα and IL-1β are the classic
signaling molecules that can activate the IκB kinase complex
(28), which binds to other
components and interacts with upstream signaling kinases. A number
of stimuli can be produced by activating the IKK complex through
different mechanisms, such as the phosphorylation of IKKs by
upstream kinases or through the self-activation of IKK-dimers by
mutual phosphorylation (29). IL-1β
is a member of the IL-1 cytokine family produced by macrophages,
and it is an important mediator involved in a variety of cellular
activities, including cell differentiation, cell proliferation and
cell apoptosis (30).
TNF (which is also known as cachectin or TNFα) is a
cytokine with a wide variety of functions and is involved in the
cytolysis of certain tumor cell lines, the induction of cachexia,
and onset of fever by direct action or by stimulating IL-1
secretion. The upregulation of TNF genes in both the MAPK signaling
pathway and the NF-κB signaling pathway indicate that both pathways
can be initiated (31,32). First, in the activation of NF-κB,
TRAF2 recruits the protein kinase IKK, which is activated by
serine-threonine kinase (33). IκBα
is an inhibitory protein that binds to NF-κB and prevents its
translocation, and it is phosphorylated by IKK and degraded to
release NF-κB. NF-κB translocates into the nucleus and mediates the
transcription of proteins involved in cell proliferation and
survival (34). Second, during MAPK
activation, TNF induces strong JNK activation and elicits p38-MAPK
responses, which is important for ERK activation. TRAF2/Rac
activates the upstream kinases of MEKK1 and MLK2/MLK3 induced by
JNK (35), and then JNK
translocates to the nucleus and activates transcription factors
such as c-Jun and ATF2 (36,37).
The JNK pathway is also involved in cell differentiation, cell
proliferation, and cell apoptosis. Thus, the upregulated DEGs in
the TMP-A group might be associated with the strong effects of
TMP-A on the proliferation activity, phagocytosis activity and cell
cycle distribution of RAW264.7 cells in vitro, and these
results can adequately explain the mechanism underlying the
significant antitumor activities of TMP-A in the immune system.
In conclusion, we performed a proliferation assay,
phagocytosis assay and cell cycle analysis of macrophages. Low cell
proliferation activity and phagocytosis activity were observed when
the macrophages were exposed to the medium alone, whereas a
dose-dependent increase in cell proliferation activity and
phagocytosis activity was observed after the cells were incubated
with increasing concentrations of TMP-A. The cell proliferation
activity induced by TMP-A was also time-dependent. The cell cycle
analysis indicated that TMP-A could promote the proliferation of
macrophage cells by abolishing cell cycle arrest in the G0/G1 and
G2/M phases and promoting cell cycle proliferation in S phase,
which might induce cell division. We then sequenced and
characterized the transcriptomes of the macrophages of the control
and TMP-A groups using Illumina sequencing technology, which
enabled us to examine gene expression profiles and differential
expression profiles and select functional genes related to the
molecular mechanism of the immunomodulatory activity of TMP-A in
macrophages. Based on the experimental data and the results from
our previous study, we believe that the significant antitumor
activities of TMP-A in vivo may involve the MAPK and NF-κB
signaling pathways because the two signaling pathways intersect.
Our results provide a foundation for understanding the molecular
mechanisms underlying the antitumor activity and immune activity of
polysaccharides.
Acknowledgments
The present study was supported by the National
Natural Science Foundation of China (31400016 and 31200012), the
Application Foundation Project of Sichuan Province (2013JY0094),
the Science and Technology Support Project of Sichuan Province
(2014SZ0020 and 2014FZ0024), the Cultivate Major Projects of
Sichuan Province (14CZ0016), the Open Foundation of Microbial
Resources and Drug Development of Key Laboratory of Guizhou
Province (GZMRD-2014-002), and the Doctor Startup Foundation
Project of China West Normal University (11B019 and 11B020).
References
|
1
|
Rein DT and Kurbacher CM: The role of
chemotherapy in invasive cancer of the cervix uteri: Current
standards and future prospects. Anticancer Drugs. 12:787–795. 2001.
View Article : Google Scholar : PubMed/NCBI
|
|
2
|
Song G and Du Q: Structure
characterization and antitumor activity of an α β-glucan
polysaccharide from auricularia polytricha. Food Res Int.
45:381–387. 2012. View Article : Google Scholar
|
|
3
|
Schepetkin IA and Quinn MT: Botanical
polysaccharides: Macrophage immunomodulation and therapeutic
potential. Int Immunopharmacol. 6:317–333. 2006. View Article : Google Scholar : PubMed/NCBI
|
|
4
|
Zhao Z, Li J, Wu X, Dai H, Gao X, Liu M
and Tu P: Structures and immunological activities of two pectic
polysaccharides from the fruits of Ziziphus jujuba Mill. cv.
jinsixiaozao Hort. Food Res Int. 39:917–923. 2006. View Article : Google Scholar
|
|
5
|
Lee KY and Jeon YJ: Macrophage activation
by polysaccharide isolated from Astragalus membranaceus. Int
Immunopharmacol. 5:1225–1233. 2005. View Article : Google Scholar : PubMed/NCBI
|
|
6
|
Song JY, Han SK, Son EH, Pyo SN, Yun YS
and Yi SY: Induction of secretory and tumoricidal activities in
peritoneal macrophages by ginsan. Int Immunopharmacol. 2:857–865.
2002. View Article : Google Scholar : PubMed/NCBI
|
|
7
|
Ma H, Liu G, Ding W, Wu Y, Cai L and Zhao
Y: Diabetes-induced alteration of F4/80+ macrophages: A
study in mice with streptozotocin-induced diabetes for a long term.
J Mol Med Berl. 86:391–400. 2008. View Article : Google Scholar
|
|
8
|
Di Carlo E, Forni G, Lollini P, Colombo
MP, Modesti A and Musiani P: The intriguing role of
polymorphonuclear neutrophils in antitumor reactions. Blood.
97:339–345. 2001. View Article : Google Scholar : PubMed/NCBI
|
|
9
|
Cheng A, Wan F, Wang J, Jin Z and Xu X:
Macrophage immunomodulatory activity of polysaccharides isolated
from Glycyrrhiza uralensis Fish. Int Immunopharmacol. 8:43–50.
2008. View Article : Google Scholar
|
|
10
|
Chihara G, Maeda Y, Hamuro J, Sasaki T and
Fukuoka F: Inhibition of mouse sarcoma 180 by polysaccharides from
Lentinus edodes (Berk.) sing. Nature. 222:687–688. 1969. View Article : Google Scholar : PubMed/NCBI
|
|
11
|
Kobayashi H, Yoshida R, Kanada Y, Fukuda
Y, Yagyu T, Inagaki K, Kondo T, Kurita N, Suzuki M, Kanayama N, et
al: Suppressing effects of daily oral supplementation of
beta-glucan extracted from Agaricus blazei Murill on spontaneous
and peritoneal disseminated metastasis in mouse model. J Cancer Res
Clin Oncol. 131:527–538. 2005. View Article : Google Scholar : PubMed/NCBI
|
|
12
|
Nakazato H, Koike A, Saji S and Ogawa N:
Efficacy of immunochemotherapy as adjuvant treatment after curative
resection of gastric cancer. Lancet. 343:1122–1126. 1994.
View Article : Google Scholar : PubMed/NCBI
|
|
13
|
Shin JY, Song JY, Yun YS, Yang HO, Rhee DK
and Pyo S: Immunostimulating effects of acidic polysaccharides
extract of Panax ginseng on macrophage function. Immunopharmacol
Immunotoxicol. 24:469–482. 2002. View Article : Google Scholar : PubMed/NCBI
|
|
14
|
Gong MQ, Su LJ, Chen YW, Feng Z and Cao
JX: A study on development of shiro and productive potentialities
of Tricholoma matsutake. For Res. 15:374–379. 2002.
|
|
15
|
Guerin-Laguette A, Vaario L, Matsushita N,
Shindo K, Suzuki K and Lapeyrie F: Growth stimulation of a
Shiro-like, mycorrhiza forming, mycelium of Tricholoma matsutake on
solid substrates by non-ionic surfactants or vegetable oil. Mycol
Prog. 2:37–44. 2003. View Article : Google Scholar
|
|
16
|
Hur TC, Park H, Kang H and Joo SH: Dynamic
changes of soil physicochemical properties in the fairy-rings of
Tricholoma matsutake. J Korean For Soc. 93:26–34. 2004.
|
|
17
|
Ding X, Feng S, Cao M, Li M, Tang J, Guo
C, Zhang J, Sun Q, Yang Z and Zhao J: Structure characterization of
polysaccharide isolated from the fruiting bodies of Tricholoma
matsutake. Carbohydr Polym. 81:942–947. 2010. View Article : Google Scholar
|
|
18
|
Fang SM, Hu BL, Zhou QZ, Yu QY and Zhang
Z: Comparative analysis of the silk gland transcriptomes between
the domestic and wild silkworms. BMC Genomics. 16:60–72. 2015.
View Article : Google Scholar : PubMed/NCBI
|
|
19
|
Zhang Y, Meng Q, Jiang T, Wang H, Xie L
and Zhang R: A novel ferritin subunit involved in shell formation
from the pearl oyster (Pinctada fucata). Comp Biochem Physiol B
Biochem Mol Biol. 135:43–54. 2003. View Article : Google Scholar : PubMed/NCBI
|
|
20
|
Honarmand Ebrahimi K, Bill E, Hagedoorn PL
and Hagen WR: The catalytic center of ferritin regulates iron
storage via Fe(II)-Fe(III) displacement. Nat Chem Biol. 8:941–948.
2012. View Article : Google Scholar : PubMed/NCBI
|
|
21
|
Arko-Mensah J, Julián E, Singh M and
Fernández C: TLR2 but not TLR4 signalling is critically involved in
the inhibition of IFN-gamma-induced killing of mycobacteria by
murine macrophages. Scand J Immunol. 65:148–157. 2007. View Article : Google Scholar : PubMed/NCBI
|
|
22
|
Zoon KC, Smith ME, Bridgen PJ, Anfinsen
CB, Hunkapiller MW and Hood LE: Amino terminal sequence of the
major component of human lymphoblastoid interferon. Science.
207:527–528. 1980. View Article : Google Scholar : PubMed/NCBI
|
|
23
|
Cooksley WG: The role of interferon
therapy in hepatitis B. MedGenMed. 6:162004.PubMed/NCBI
|
|
24
|
Zarubin T and Han J: Activation and
signaling of the p38 MAP kinase pathway. Cell Res. 15:11–18. 2005.
View Article : Google Scholar : PubMed/NCBI
|
|
25
|
Orton RJ, Sturm OE, Vyshemirsky V, Calder
M, Gilbert DR and Kolch W: Computational modelling of the
receptor-tyrosine-kinase-activated MAPK pathway. Biochem J.
392:249–261. 2005. View Article : Google Scholar : PubMed/NCBI
|
|
26
|
Herbst RS: Review of epidermal growth
factor receptor biology. Int J Radiat Oncol Biol Phys. 59(Suppl):
21–26. 2004. View Article : Google Scholar : PubMed/NCBI
|
|
27
|
Gilmore TD: Introduction to NF-kappaB:
Players, pathways, perspectives. Oncogene. 25:6680–6684. 2006.
View Article : Google Scholar : PubMed/NCBI
|
|
28
|
Gilmore TD: The Rel/NF-kappaB signal
transduction pathway: Introduction. Oncogene. 18:6842–6844. 1999.
View Article : Google Scholar : PubMed/NCBI
|
|
29
|
Brasier AR: The NF-kappaB regulatory
network. Cardiovasc Toxicol. 6:111–130. 2006. View Article : Google Scholar
|
|
30
|
Tian B and Brasier AR: Identification of a
nuclear factor κ B-dependent gene network. Recent Prog Horm Res.
58:95–130. 2003. View Article : Google Scholar
|
|
31
|
Locksley RM, Killeen N and Lenardo MJ: The
TNF and TNF receptor superfamilies: Integrating mammalian biology.
Cell. 104:487–501. 2001. View Article : Google Scholar : PubMed/NCBI
|
|
32
|
Gaur U and Aggarwal BB: Regulation of
proliferation, survival and apoptosis by members of the TNF
superfamily. Biochem Pharmacol. 66:1403–1408. 2003. View Article : Google Scholar : PubMed/NCBI
|
|
33
|
Wajant H, Pfizenmaier K and Scheurich P:
Tumor necrosis factor signaling. Cell Death Differ. 10:45–65. 2003.
View Article : Google Scholar : PubMed/NCBI
|
|
34
|
Bouwmeester T, Bauch A, Ruffner H, Angrand
PO, Bergamini G, Croughton K, Cruciat C, Eberhard D, Gagneur J,
Ghidelli S, et al: A physical and functional map of the human
TNF-alpha/NF-kappa B signal transduction pathway. Nat Cell Biol.
6:97–105. 2004. View
Article : Google Scholar : PubMed/NCBI
|
|
35
|
Chen G and Goeddel DV: TNF-R1 signaling: A
beautiful pathway. Science. 296:1634–1635. 2002. View Article : Google Scholar : PubMed/NCBI
|
|
36
|
Baugh JA and Bucala R: Mechanisms for
modulating TNF alpha in immune and inflammatory disease. Curr Opin
Drug Discov Devel. 4:635–650. 2001.
|
|
37
|
Lejeune FJ, Liénard D, Matter M and Rüegg
C: Efficiency of recombinant human TNF in human cancer therapy.
Cancer Immun. 6:6–16. 2006.PubMed/NCBI
|