Introduction
The nuclear factor of activated T-cell (NFAT) family
is a multigene family of Ca2+/calcineurin-dependent
transcription factors that were initially identified in
T-lymphocytes (1) and is composed
of four classical calcium-responsive members, NFATc1, NFATc2,
NFATc3 and NFATc4, and the new recently cloned member calcium
insensitive NFAT5 (2). Each of
these proteins appears to be expressed as several isoforms by
alternative splicing. NFAT proteins are confined to the cytoplasm
of unstimulated cells in a highly phosphorylated form under basal
conditions. After an increase in intracellular calcium, NFAT
proteins are dephosphorylated by the serine/threonine phosphatase
calcineurin and translocate to the nucleus. Once in the nucleus,
they bind to consensus DNA sequences, activating the transcription
of NFAT-dependent genes (3), and
its expression is associated with other essential transcription
factors, such as AP-1 (4), GATA-4,
EGR, MEF2 and the important oncogene FOXP (5). In addition to the immune system, NFAT
is functionally important in osteoclast differentiation (6), endothelial cell differentiation in
cardiac valve morphogenesis (7) and
in preventing organ transplant rejection (8).
Over the past 20 years, evidence supports a role for
NFAT signaling in cell growth and development, and it is expressed
not only in lymphocytes but also in other histocytes (including
epithelial cells) (9–11). Some researchers have further found
that NFAT is also closely related to tumorigenicity (12). The subtypes of the NFAT family have
unique functions; among them, NFATc1 (nuclear factor of activated
T-cells c1) (also referred to as NFAT2) has been demonstrated to be
associated with tumorigenesis (13–15).
Studies have found that NFATc1 plays an essential role in the
regulation of fibroblast NIH 3T3 cells through the induction of the
tumoral phenotype, which indicates that NFATc1 is a potential
oncogene (16). In addition, as
previously mentioned, NFATc1 proteins are dephosphorylated by
calcineurin, and calcineurin plays an essential role in the
development of malignant lymphomas (17). Recent evidence also has confirmed
that NFATc1 is overexpressed in other malignancies and is a key
factor in their development, such as prostate (18) and pancreatic cancers (19).
NFATc1 is overexpressed in human solid tumors and
hematological malignancies (20)
and is also functionally important in tumor cell autonomic function
and is involved in diverse functions, including tumor cell
differentiation, invasion and escape from the immune system.
Furthermore, it has been shown to play a key role in tumor
angiogenesis (21). Embryogenesis
studies have shown that NFATc1 has a vital role in cardiovascular
development (22), and it modulates
endothelium growth, differentiation and cell cycle progression
(23). Dephosphorylated NFATc1
translocates into the nucleus to regulate transcription. Cell
activation by a variety of factors, including vascular endothelial
growth factor-A (VEGF-A), boosts intracellular calcium, activates
calcineurin and induces NFATc1 transcriptional activity (24,25).
CXCR2, also known as IL-8RB, was initially recognized as an
ELR+ transmembrane chemokine receptor expressed on
neutrophils. It has a high affinity for ELR+ chemokines,
such as IL-8 and Gro-1, and plays a critical role in Gro-1- or
IL-8-mediated tumorigenesis, angiogenesis and aggressiveness
(26). The present study also
studied CXCR2 to observe the role of NFATc1 in EOC invasion and
metastasis.
Although little information is available on NFATc1
expression and function in tumor cells, these observations prompted
us to examine the potential role of the NFATc1 signaling pathway in
EOC. In the present study, we investigated the functional role of
NFATc1 in ovarian cancer cells in terms of expression, cell
apoptosis and proliferation, and aggressiveness, and we studied
COX2 to observe the role of NFATc1 in EOC angiogenesis. We also
analyzed the association of NFATc1 expression in high-grade serous
ovarian carcinomas with clinical pathologic characteristics,
overall disease survival and disease-free survival of patients.
Materials and methods
Cell lines and NFATc1 siRNA
The SKOV3 ovarian cancer cell line was from the
Molecular Medicine and Cancer Center, Chongqing Medical University,
and the cells were maintained in medium containing 10% fetal bovine
serum, 2 mmol/l l-glutamine, penicillin (100 units/ml) and
streptomycin (100 μg/ml). A 375-bp NFATc1 primer
(5′-TCTGGGAGATG GAAGCAAAGACTG-3′;
5′-AGGGCTATCACGTGGTG TGAAGAG-3′) and a 180-bp primer
(5′-GCCCTGACAGCTCCCAAGCCT-3′;
5′-ATGCGTCATGCCGCTTCCCAG-3′) were designed for PCR.
Three DNA oligos (siRNA-880, anti-sense,
5′-UUCCGGCACAGUCAAUGACGGCUCG-3′ and sense,
5′-CGAGCCGUCAUUGACUGUGCCGGAA-3′; siRNA-1169,
antisense, 5′-AGAGAAUUCGGCUUGCACAGGUCCC-3′ and sense
5′-GGGACCUGUGCAAGCCGAAUUCUCU-3′; and siRNA-1307,
antisense 5′-AGACGUAGA AACUGACGUGAACGGG-3′ and sense
5′-CCCGUUCACGUCAGUUUCUACGUCU-3′) were designed as
green fluorescent small interfering RNA (siRNA) against NFATc1 mRNA
to target the open reading frame of NFATc1 cDNA. These DNA oligos
were contained in Lipofectamine™ 2000 and were used to infect SKOV3
cells; the highest transfection efficiency oligo was selected by
RT-PCR to use for interference. The subjects can be divided into
three groups as follows according to the intervention measures: A,
Blank; B, Control and C, siRNA.
Patient tissue specimens
Samples
A total of 156 patient samples were collected from
the Department of Pathology at the First Affiliated Hospital of
Chongqing Medical University, and the sample group was comprised of
the following: 96 EOCs (malignant group), 30 serous (mucinous)
cystadenomas (control group) and 30 benign ovarian endometriotic
cysts (control group). All slides were reviewed twice by two
pathologists to verify the diagnoses.
The use of tissue blocks and the chart review were
approved by the Institutional Review Board of the Chongqing Medical
University. The archived tissue blocks were retrieved from the
Department of Pathology at Chongqing Medical University. The
selection of patient tissues was not based on treatment. Follow-up
information was updated from 2010 to 2014 by reviewing medical
records at the First Affiliated Hospital of Chongqing Medical
University. The randomly selected formalin-fixed paraffin-embedded
tissues included high-grade serous and mucinous ovarian carcinomas
(n=96), and the serous (mucinous) ovarian cystadenoma (n=30) and
ovarian endometriotic cysts (n=30) were matched to the carcinoma
samples. Briefly, ovarian tissue blocks were selected by reviewing
hematoxylin and eosin-stained sections by two pathologists and
constructed by taking core samples from morphologically
representative areas of paraffin-embedded tumor tissues and
assembling them on a recipient paraffin block. For each case, two
replicate samples with 1-mm core diameter were collected, and each
was placed on a separate recipient block. All samples were spaced
0.5 mm apart. Five-micrometer sections were obtained from the
microarray and stained with hematoxylin and eosin to confirm the
presence of tumor and to assess tumor histology. Sample tracking
was based on coordinate positions for each tissue spot in the
block; the spots were transferred onto TMA slides for staining.
Tumor formation in nude mice
To evaluate the ability of cells to form tumors, 4-
to 8-week-old BALB/c athymic female nude mice from the Animal
Experimental Center, Chongqing Medical University were given
bilateral injections of SKOV3 tumor cells, with a total of 18 mice
used. All mouse experiments were performed in accordance with the
institutional guidelines approved by the Institutional Animal Care
and Use Committee. Each subcutaneous injection consisted of
5×10⁶ cells (0.2 ml) for SKOV3. Control mice were
injected with SKOV3 cell lines that expressed NFATc1 siRNA. The
mice were kept in a specific pathogen-free environment and were
checked every 2 days for 30 days. After 30 days, the mice were
sacrificed by exposure to 5% carbon monoxide. The tumor inhibition
rate was calculated with the use of the tumor weight: Tumor
inhibition rate (%) = (control weight - experimental
weight)/control weight × 100%. The tumor volume was calculated with
the use of the following formula: Tumor volume (in mm3)
= (L × W2)/2, where L is the length and W is the
weight). All tumors for each group were excised, fixed in 10%
formalin overnight, and subjected to routine histologic examination
and immunostaining of NFATc1 (antibody cat. no. ab25916, Abcam,
1:200), CK (antibody cat. no. BM0030, BOSTER, 1:500), CD34
(antibody cat. no. SC-9095, Santa Cruz, 1:500) and CXCR2 (antibody
cat. no. bs-1629R, Bioss, 1:800) by investigators who were blinded
to the tumor status. The assay was repeated twice.
Immunohistochemical staining and
analysis
Immunohistochemical staining for NFATc1 (ab25916,
1:200) was performed using avidin-biotin-peroxidase methods.
Briefly, tissue slides were deparaffinized in xylene and rehydrated
in a graded series of ethanol, and the sections were subjected to
antigen retrieval by boiling in 0.01 mol/l sodium citrate buffer
(pH 6.0) in a microwave oven for 10 min. After blocking endogenous
peroxidase activity with 0.3% hydrogen peroxide and blocking
non-specific protein binding with 1.5% normal goat serum, the
sections were incubated overnight with an antibody at 4°C in a
humidified chamber. Then, the sections were incubated with
biotinylated goat anti-mouse IgG for 30 min and detected with the
LSAB system (Dako). Sections were lightly counterstained with
hematoxylin. The primary antibody was replaced with 1X PBS as a
negative control. Differences in proportions between NFATc1
expression and FIGO stage, age at diagnosis, family history,
relapse, level of debulking surgery, clinical response, the
presence of ascites, and chemoresponse were calculated by
χ2 analysis or Pearson's correlation as appropriate.
Entire tissue sections were evaluated by H-score values, which are
objective measurements of staining intensity, and the percentage of
tumor cells that stained positive. Five fields of each slice were
randomly selected with a magnification of ×400, and the numbers of
positive cells were counted per 100 cells per field. Staining
intensity was scored as negative (<5% of positive tumor cells),
1+ (mild intensity), 2+ (moderate intensity), or 3+ (intensity
greater than that of the positive control). The sections were
evaluated by two pathologists using a double-blind method to
determine the immunohistochemistry results. The formula was H-score
= ∑(i + 1) × pi, where i indicates the intensity of
staining, pi was the percentage of cells with positive
staining/the total number of tested cells, and 1 was the correction
factor.
Real-time PCR
RNA isolation and complementary DNA
synthesis
RNA was isolated from SKOV3 cells (treated by siRNA
and control) using RNeasy Mini kits (Qiagen, Santa Clarita, CA,
USA) according to the manufacturer's instructions. The RNA was
eluted with water, stored at −70°C and evaluated by agarose
electrophoresis. For complementary DNA (cDNA) synthesis, ~1
μg of total RNA was transcribed with cDNA transcription
reagents (PE Applied Biosystems, Foster City, CA, USA) using random
hexamers, according to the following conditions: 30°C for 10 min;
50°C for 20 min; 99°C for 5 min; and 5°C for 5 min.
The PCR conditions were 94°C for 2 min (1 cycle) and
94°C for 30 sec and 58°C for 30 sec (30 cycles).
Gene expression was measured in real-time with the
GeneAmp 5700 Sequence detection system (PE Applied Biosystems). The
primers and TaqMan probes (Custom Oligo Synthesis Service, Foster
City, CA, USA) were designed to span intronic junctions to avoid
amplification of genomic DNA and to generate amplicons of fewer
than 150 bp to enhance the efficiency of PCR amplification. The
probes were labeled at the 5′ end with the reporter dye
molecule FAM (6-carboxy-fluorescein; emission λmax = 518 nm) and at
the 3′ end with the quencher dye molecule TAMRA
(6-carboxytetramethyl-rhodamine; emission λmax=582 nm).
On amplification, sequence-specific probes that had annealed to the
template were cleaved by the 5′ nuclease activity of the
Taq polymerase reaction. Real-time monitoring of fluorescent
emission from the cleavage of probes allowed for defining the cycle
threshold during the exponential phase of the amplification. DNA
standards were generated by PCR amplification of the gene product
and quantification by spectrophotometry. The number of copies was
calculated based on the molecular weight of the gene amplicon.
Real-time PCRs of cDNA samples and DNA standards were performed in
a total volume of 25 μl with 1X TaqMan Master Mix (PE
Applied Biosystems) and primers (375 bp). The primer sequences were
5′-TCTGGGAGATGGAAGCAAAGACTG-3′ and
5′-AGGGCTATCACGTGGTGTGAAGAG-3′. Standard curves were
generated for the gene of interest. The solution curve detection
conditions were 95°C for l min and 70°C for l min; then, the
temperature was increased to 92°C by 0.1°C per sec, and the
fluorescence was detected continuously. The expression level of
target gene NFATc1 was X = 2−ΔCT approximately when the
amplification efficiency was close to 1.0. The ΔCT indicates the
difference between the target gene NFATc1 and the housekeeping
gene.
Western blotting
Total protein extracts from the SKOV3 cells and
transplanted tumor tissue were obtained using lysis buffer, and
equal amounts (30 μg per load) were analyzed by
immunoblotting. An antibody against β-actin was obtained from
Sigma-Aldrich (A5441, 1:20,000). Antibodies used were against
NFATc1 (ab25916; 1:1,000), and against CXCR2 (antibody cat. no.
bs-1629R, 1:800). The secondary antibodies were anti-rabbit
immunoglobulin horseradish peroxidase-linked F(ab)2 fragment from
donkey (Amersham Biosciences). Western blot reagents were from an
electrochemiluminescence kit (Amersham Biosciences).
Cell proliferation and apoptosis
To detect the inhibition rate of cell proliferation,
each group of cells in the logarithmic growth phase was plated at
5×10³ cells/well, and each condition was repeated
thrice. The experimental cells were transfected by NFATc1 siRNA.
After incubation for 6 to 24 h, 200 μl of RPMI-1640 was
added per well. The 1640 reagent was removed after 24 h, and after
48 h, RPMI-1640 and 20 μl of MTT was added. The cells were
cultured for 4 h at 37°C; the reagent was then removed, and 150
μl of dimethylsulfoxide was added per well. The samples were
shaken slowly for 10 min, and the absorbance in each well,
including the blanks, was measured at 490 nm using a microtiter
plate reader. The cell growth inhibition rate (%) = (1−
experimental group A490 mean value/control group
A490 mean value) × 100%.
The number of apoptotic cells was detected by flow
cytometry and was analyzed by CellQuest software. To detect
apoptosis, 1×10⁵ cells were stained with Annexin V and
propidium iodide, according to the Annexin V-Fluorescence Apoptosis
Detection Kit I (BD Biosciences) and were subjected to analysis
with a FACStation equipped with CellQuest software. The percentage
of apoptotic cells was calculated in terms of peaks (M2) in the
histogram, representing the early apoptotic population (Annexin
V+/propidium iodide−). The experiment was
performed in duplicate and repeated three times.
Transwell and the erasion trace
Transwell in vitro migration
assays
A total of 70 μl of Matrigel (l mg/ml) was
added to the filter (filter pores, 8 μm) for 60 min to allow
for the restructuring of the basilar membrane. SKOV3 cells
(1×10⁵/ml cells in 200 μl of DMEM) were added to
the upper chamber, and 10% FBS/DMEM (50 μl) was added to the
lower chamber; the samples were cultured with 5% CO2 for
24 h at 37°C. The cells were removed from the surface of the
filter, fixed by methyl alcohol and stained with crystal violet for
15 min, and the cells that migrated through the filter pores and
were on the underside of the filter were counted. The number of
cells that migrated across the filters were counted in 5 fields per
insert, and the values were averaged. For each migration condition,
three identical replicates were performed.
In vitro wound-healing assay
SKOV3 cells were treated with siRNA as described
above. After incubation for 24 h, the cells were removed by
trypsinization, counted and plated at 5×10⁵/ml in 6-well
dishes. The cells were incubated overnight, yielding confluent
monolayers for wounding. Wounds were created using a pipette tip,
and images were captured immediately (time zero) and at 24 and 48 h
after wounding. The cell monolayer that migrated from the wounded
edge during this time period was counted. The number of migrated
cells after siRNA treatment (control and targeted) was compared.
Experiments were performed in triplicate and repeated at least five
times.
Statistical analyses
The number of mice (sample size) required to reach
significance was determined in preliminary pilot studies that used
the following formula: n = 16 × (SD/difference in mean tumor
volume)2 + 1. The results of that pilot study indicated
that six mice would be required to detect differences in tumor size
with 80% power at a P-value of <0.05. Each mouse received two
bilateral flank injections, from which, the mean volume of tumor in
each mouse generated from 5×10⁶ cells (for SKOV3) was
computed to determine the growth curve (the mean tumor volume in
each group = total mean volume from each mouse divided by the
number of mice). Statistical analysis was performed using Fisher's
exact test at different time points for the mean tumor sizes of
each group. Differences in proportions were evaluated by the
Fisher's exact test as appropriate. The correlation between NFATc1
expression in tissue arrays (based on the scores of CXCR2
immunostaining intensity) and patient survival was analyzed by the
Kaplan-Meier method using SPSS 17.0 software (SPSS, Inc., Chicago,
IL, USA). The clinical correlation in terms of NFATc1 expression
and patient survival was evaluated by excluding missing data. The
association between the expression of NFATc1 and clinical
pathological parameters was analyzed with contingency tables and
Pearson W2 test. P<0.05 was considered significant. All
statistical tests were two-sided.
Results
Association of NFATc1 with ovarian
cancer
We first examined NFATc1 expression in the ovarian
cancer tissues by immunohistochemical staining. As shown in
Fig. 1A and Table I, epithelial ovarian cancer samples
expressed high levels of NFATc1 compared with two types of benign
ovarian tumors. Then, using Lipofectamine™ 2000 infection, we
delivered siRNA against NFATc1 into the ovarian cancer cell line
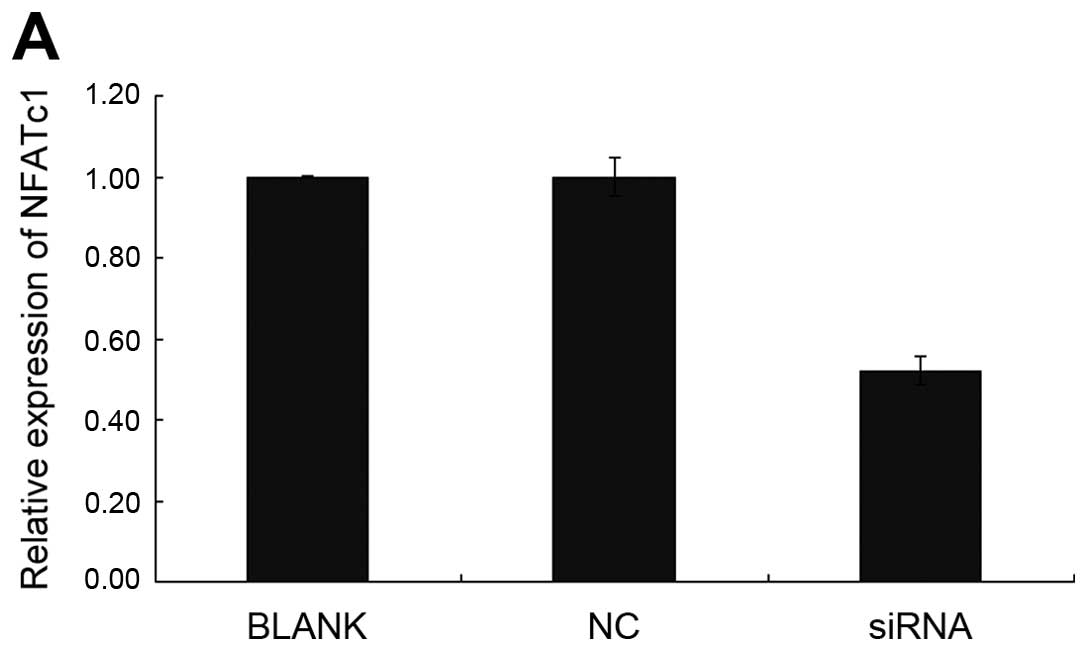
SKOV3. As shown by immunofluorescence and RT-PCR (Fig. 1B and C; Tables II and III), NFATc1 was notably silenced in
cells treated with the specific NFATc1 siRNA compared with the
control group, which led to a marked decrease in the secreted
expression of NFATc1 as detected by western blotting (Fig. 1D). To investigate whether NFATc1
downregulation is associated with in vitro and in
vivo tumor growth in ovarian cancer cells, we investigated cell
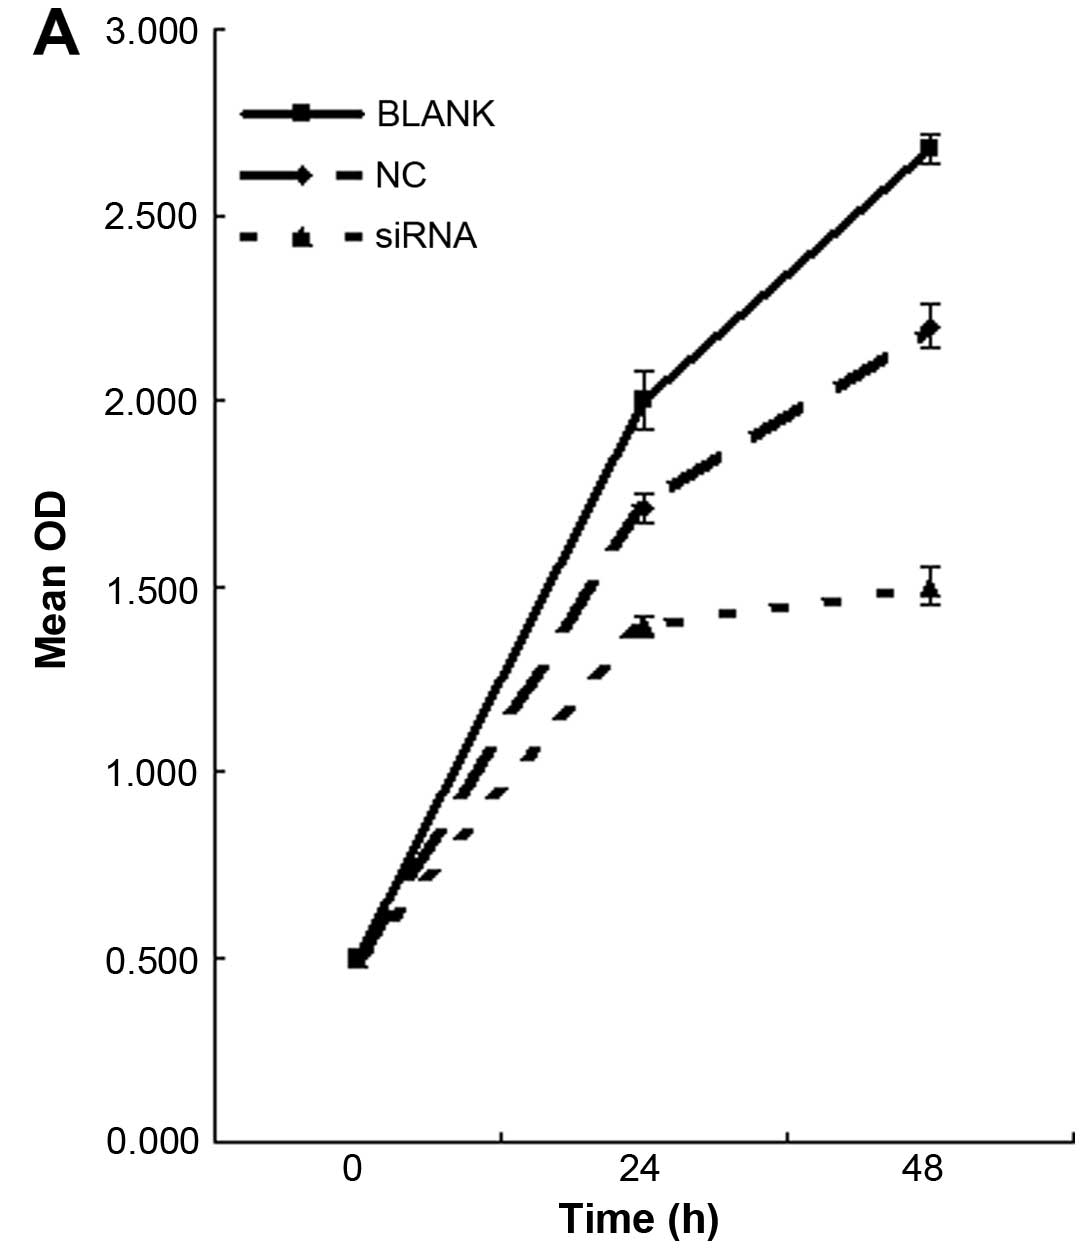
proliferation and mouse xenograft tumor growth after inoculation.
As indicated in Fig. 2 and Table IV, NFATc1 expression (Fig. 2A) and the subcutaneous tumor size in
animals (Fig. 2B and Table V) were both distinctly reduced in
cells treated with NFATc1 siRNA compared with the controls. These
data showed that NFATc1 was upregulated in ovarian cancer cells and
that silencing of NFATc1 diminished tumorigenicity and
aggressiveness of the ovarian cancer cells both in vitro and
in vivo.
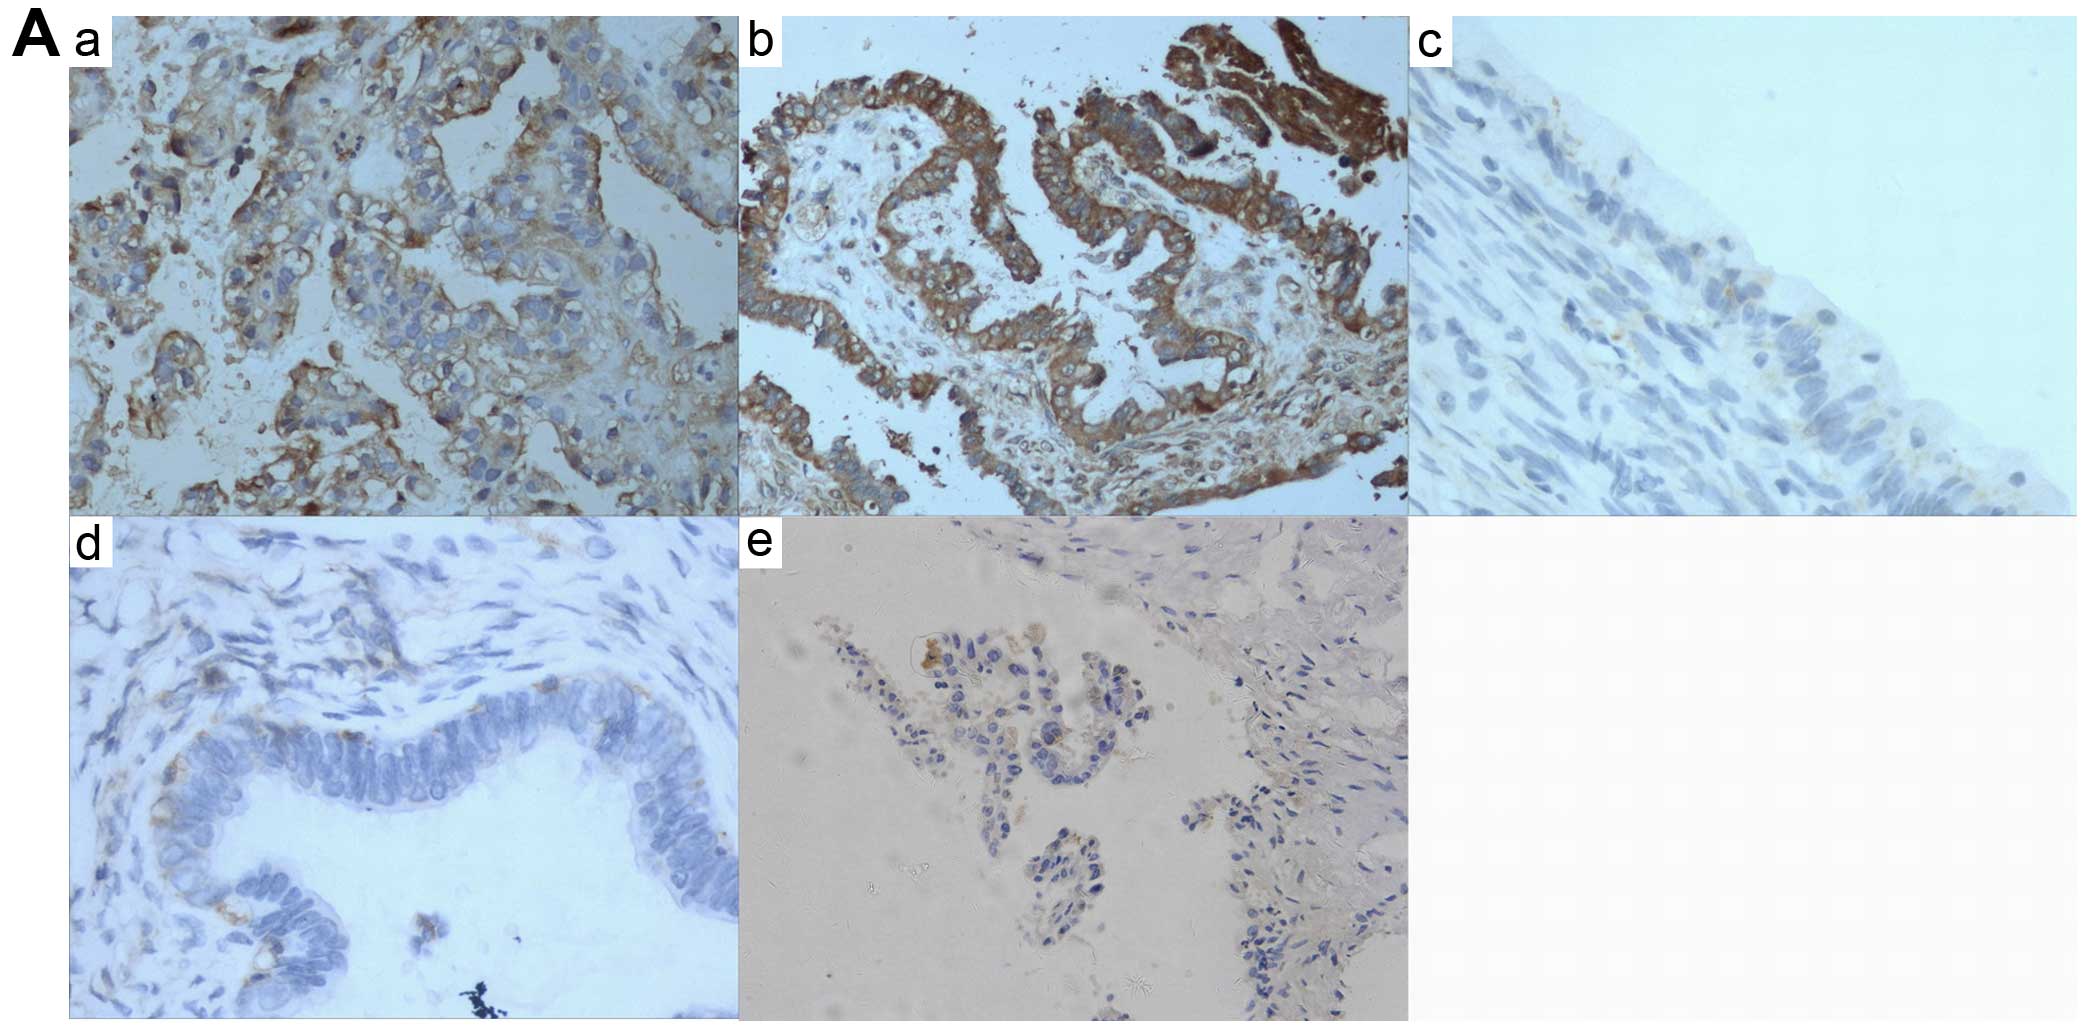 | Figure 1NFATc1 expression was first examined
in ovarian cancer tissues by immunohistochemical staining. (A)
epithelial ovarian cancer samples expressed high levels of NFATc1
compared with two types of benign ovarian tumors (P<0.05) (a and
b, EOCs; c, serous cystadenoma; d, mucinous cystadenoma; e, ovarian
endometriotic cysts) (also Table
I). NFATc1 siRNA was transfected into SKOV3 cells, which were
then subjected to (B) immunofluorescence tests and (C) real-time
reverse transcription polymerase chain reaction (RT-PCR) assays to
determine the transfection-induced inhibition rate (a–c, siRNA1-3).
(D) NFATc1 was notably silenced in cells treated with the specific
NFATc1 siRNA compared with the control group, which led to a marked
decrease in the secreted expression of NFATc1 as detected by
western blotting. Lane a, control; lane b, blank; and lane c,
siRNA). |
 | Table IImmunohistochemical staining and
H-score. |
Table I
Immunohistochemical staining and
H-score.
| Staining rate
(%) | H-score |
|---|
| EOC | 93/96 (96.87) | 269 (0–356) |
| Mucinous (serous)
cystadenoma | 6/30 (20) | 75 (0–180) |
| Ovarian
endometriosis cyst | 5/30 (17) | 85 (0–185) |
| Table IITransfection rate of NFATc1 siRNA in
each group (%). |
Table II
Transfection rate of NFATc1 siRNA in
each group (%).
| Group | 24 h (%) | 48 h (%) |
|---|
| siRNA1 | 54.2 | 59.1 |
| siRNA2 | 72.6 | 85.3 |
| siRNA3 | 50.2 | 51.9 |
| Table IIIStatistical analysis of NFATc1 mRNA
in each transfection group after treatment with siRNA for 48 h. |
Table III
Statistical analysis of NFATc1 mRNA
in each transfection group after treatment with siRNA for 48 h.
| Group | OD | P-value |
|---|
| siRNA1 | 0.532±0.001 | P1 |
| siRNA2 | 0.278±0.001 | P2 |
| siRNA3 | 0.498±0.003 | P3 |
| Table IVStatistical analysis of NFATc1
expression in the transplanted tumors. |
Table IV
Statistical analysis of NFATc1
expression in the transplanted tumors.
| Groups | NFATc1 | P-value |
|---|
| A (Blank) | 0.912±0.001 | P1 |
| B (Control) | 0.885±0.005 | P2 |
| C (siRNA) | 0.362±0.003 | P3 |
| Table VStatistical analysis of the
transplanted tumors in nude mice. |
Table V
Statistical analysis of the
transplanted tumors in nude mice.
| Groups | Weight (g) | Volume
(cm3) | Inhibition rate
(%) | P-value |
|---|
| A (Blank) | 2.03±0.35 | 1.328±145 | 0 | P1 |
| B (Control) | 1.98±0.78 | 1.274±209 | 0 | P2 |
| C (siRNA) | 0.87±0.32 | 0.512±087 | 57.08 | P3 |
Regulation of cell proliferation and cell
apoptosis by NFATc1 siRNA in ovarian cancer cells
We first tested the overall level of cell
proliferation by MTT staining. Knockdown of NFATc1 decreased the
number of proliferating cells by at least 2-fold in the SKOV3 cells
(Fig. 3A; Table VI). To explore the underlying
mechanism by which NFATc1 induces ovarian tumor growth, we first
examined the effect of NFATc1 on cell apoptosis by flow cytometry.
As shown in Fig. 3B and Table VII, knockdown of NFATc1 promoted
cell apoptosis compared with the control cells. These results
strongly suggest that NFATc1 promotes ovarian development at least
in part through regulation of cell proliferation and apoptosis.
| Table VIInhibition rate of cell growth in
each group. |
Table VI
Inhibition rate of cell growth in
each group.
| Group | 24 h | 48 h |
|---|
| A (Blank) | 9.0±0.50 | 11.2±0.10 |
| B (Control) | 9.5±1.60 | 15.0±1.50 |
| C (siRNA) | 47.3±0.78 | 56.0±0.82 |
| Table VIIApoptosis rate in each group. |
Table VII
Apoptosis rate in each group.
| Mean | SD | P-value |
|---|
| NC | 3.7767 | 0.24028 | 0.000 |
| siRNA | 6.9800 | 0.23000 | |
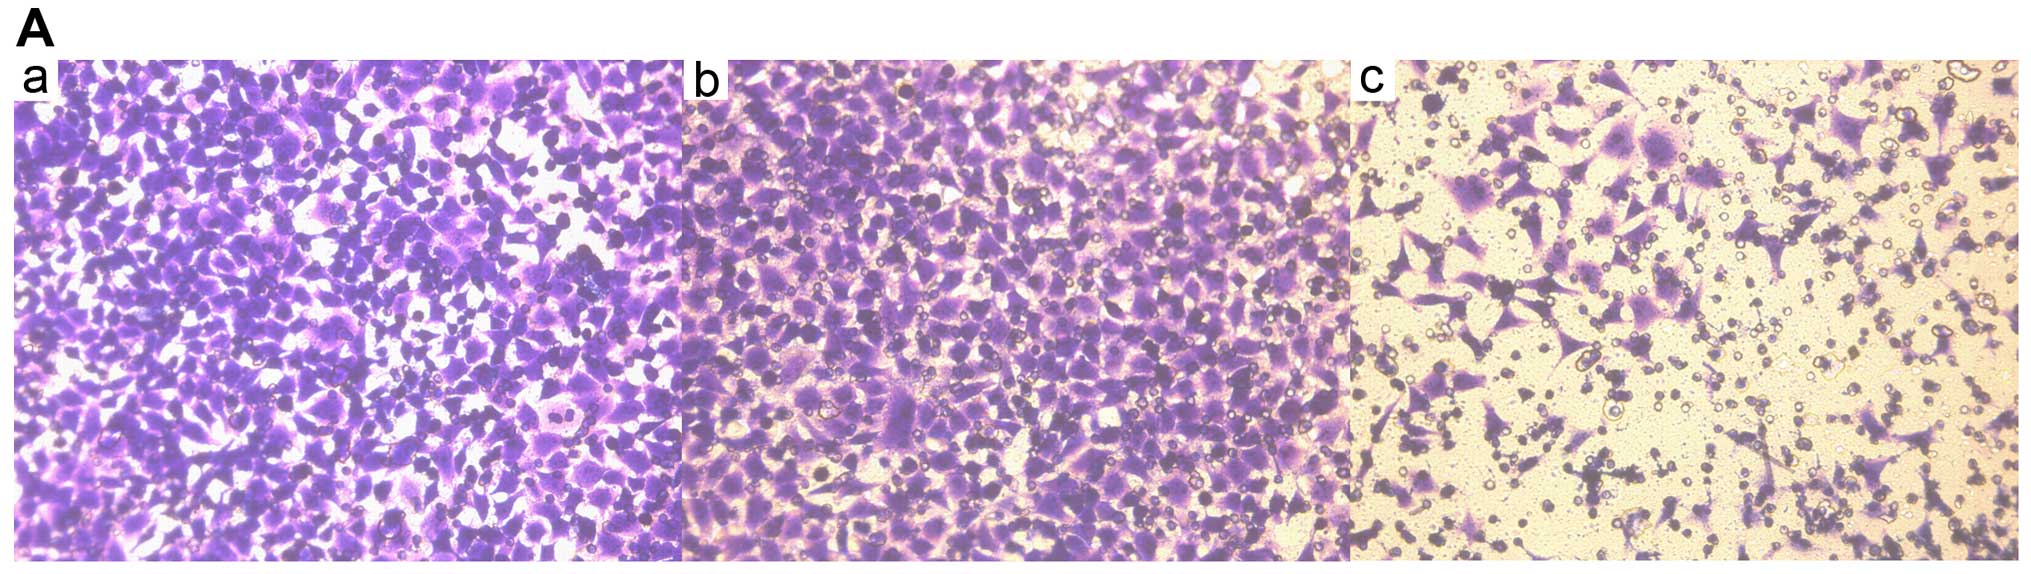
Regulation of cell invasion and migration
by NFATc1 in ovarian cancer cells
The cells that migrated through the filter pores to
the underside of the filter in the experimental group were
significantly increased compared with the cells in the control and
blank groups (P<0.05; Fig. 4A
and Table VIII). In the
wound-healing assays, the distance migrated by the cells after
wounding a cell monolayer on plastic after treatment with NFATc1
siRNA and control was obtained. The results (Fig. 4B, Table
IX) are reported as migration indices, which represent the
distance migrated by the control or NFATc1 siRNA-treated cells to
close the wound, expressed relative to the distance migrated by the
control-treated cells. In the SKOV3 cells, NFATc1 siRNA
significantly decreased migration compared with the non-targeted
controls (P<0.05). This result was consistent with results
obtained for this cell line in the Transwell assay, as described
above.
| Table VIIIStatistical analysis of SKOV3 cell
invasion. |
Table VIII
Statistical analysis of SKOV3 cell
invasion.
| Groups | No. of cells | P-value |
|---|
| A (Blank) | 115±16 | P1 |
| B (Control) | 111±18 | P2 |
| C (siRNA) | 39±7 | P3 |
| Table IXStatistical analysis of SKOV3 cell
migration. |
Table IX
Statistical analysis of SKOV3 cell
migration.
| Groups | 24 h | 48 h |
|---|
| A (Blank) | 42±9 | 101±17 |
| B (Control) | 40±10 | 106±19 |
| C (siRNA) | 15±4 | 38±9 |
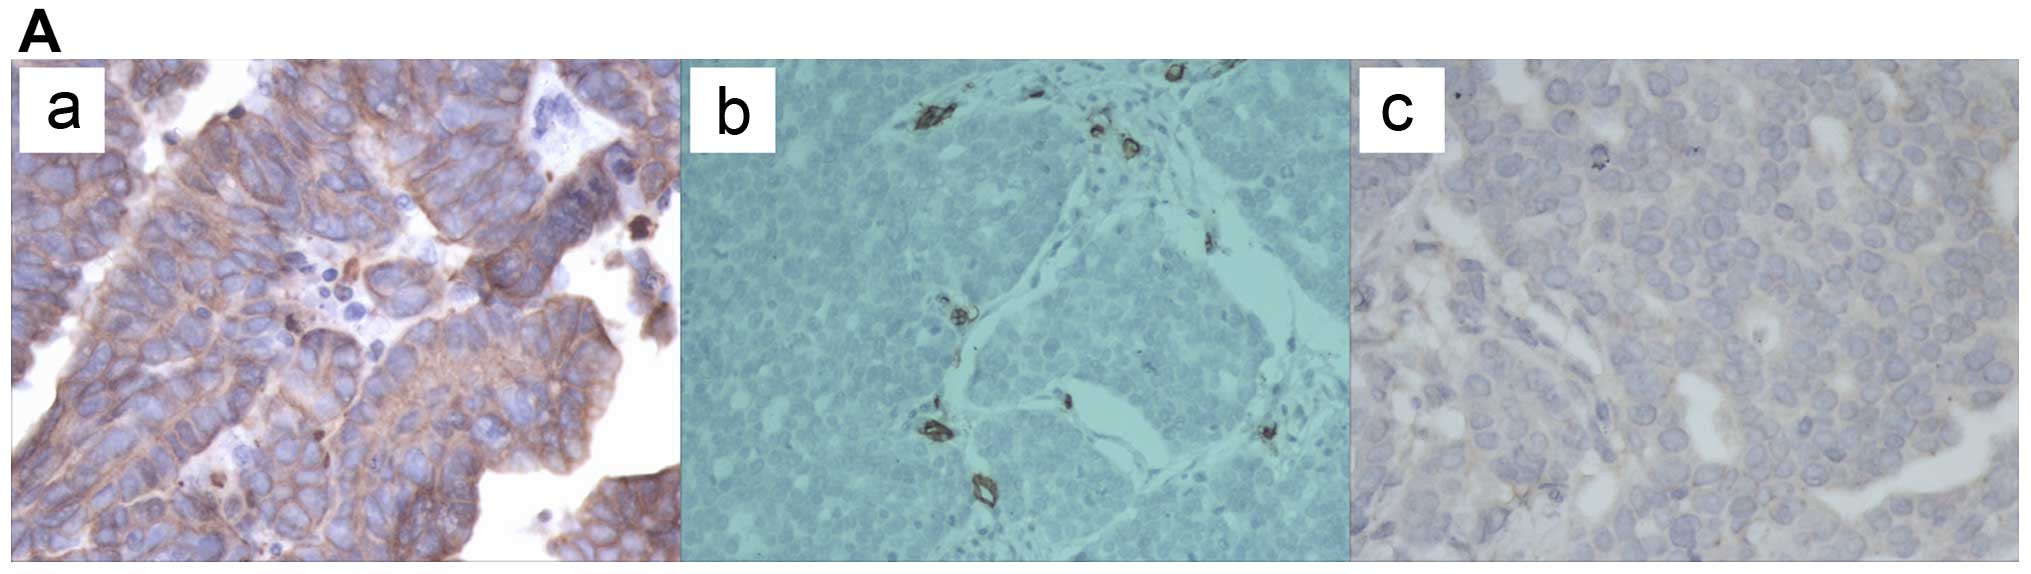
Regulation of ovarian cancer angiogenesis
by NFATc1
It is well known that VEGFA (angiogenic factor A)
promotes tumor angiogenesis. As previously mentioned, research has
shown that VEGFA activates calcineurin and induces NFATc1
transcriptional activity. To confirm whether NFATc1 is associated
with angiogenesis, we first examined the xenograft mouse tumor
tissues generated from animals injected with SKOV3/NFATc1
siRNA-1169. The overall blood vessel density was decreased in
tissues expressing NFATc1 siRNA, as indicated by the reduced number
of tissue microvessels stained with CD34 (Fig. 5A and Table X). In addition, we then detected the
expression of CXCR2 in mouse tumor tissues treated with or without
NFATc1 siRNA. We found that CXCR2 was significantly decreased in
the xenograft tumor tissues treated with NFATc1 siRNA (Fig. 5B and Tables XI and XII). These results suggest that NFATc1
promotes ovarian cancer angiogenesis by activating CXCR2, which may
be mediated through the upstream signaling of VEGFA.
| Table XStatistical analysis of MVD. |
Table X
Statistical analysis of MVD.
| Group | MVD | P-value |
|---|
| A (Blank) | 12.00±1.65 | P1 |
| B (Control) | 11.47±0.32 | P2 |
| C (siRNA) | 5.36±0.34 | P3 |
| Table XIStatistical analysis of NFATc1 and
CXCR2 mRNA. |
Table XI
Statistical analysis of NFATc1 and
CXCR2 mRNA.
| Group | NFATc1 | CXCR2 | P-value |
|---|
| A (Blank) | 0.912±0.001 | 0.925±0.005 | P1 |
| B (Control) | 0.896±0.001 | 0.882±0.003 | P2 |
| C (siRNA) | 0.265±0.003 | 0.338±0.001 | P3 |
| Table XIIStatistical analysis of NFATc1 and
CXCR2 protein in the SKOV3 cells. |
Table XII
Statistical analysis of NFATc1 and
CXCR2 protein in the SKOV3 cells.
| Group | NFATc1 | CXCR2 | P-value |
|---|
| A (Blank) | 0.907±0.001 | 0.926±0.005 | P1 |
| B (Control) | 0.827±0.005 | 0.913±0.003 | P2 |
| C (siRNA) | 0.295±0.003 | 0.382±0.001 | P3 |
Association of NFATc1 with ovarian cancer
patient survival
Immunohistochemical staining of NFATc1 in 93
specimens of high-grade ovarian carcinoma showed that both the cell
membrane and cytoplasm of epithelial cancer tissues were
specifically stained with NFATc1, whereas little NFATc1 expression
was detected in benign ovarian tumors. Representative images are
shown in Fig. 1A. Statistically,
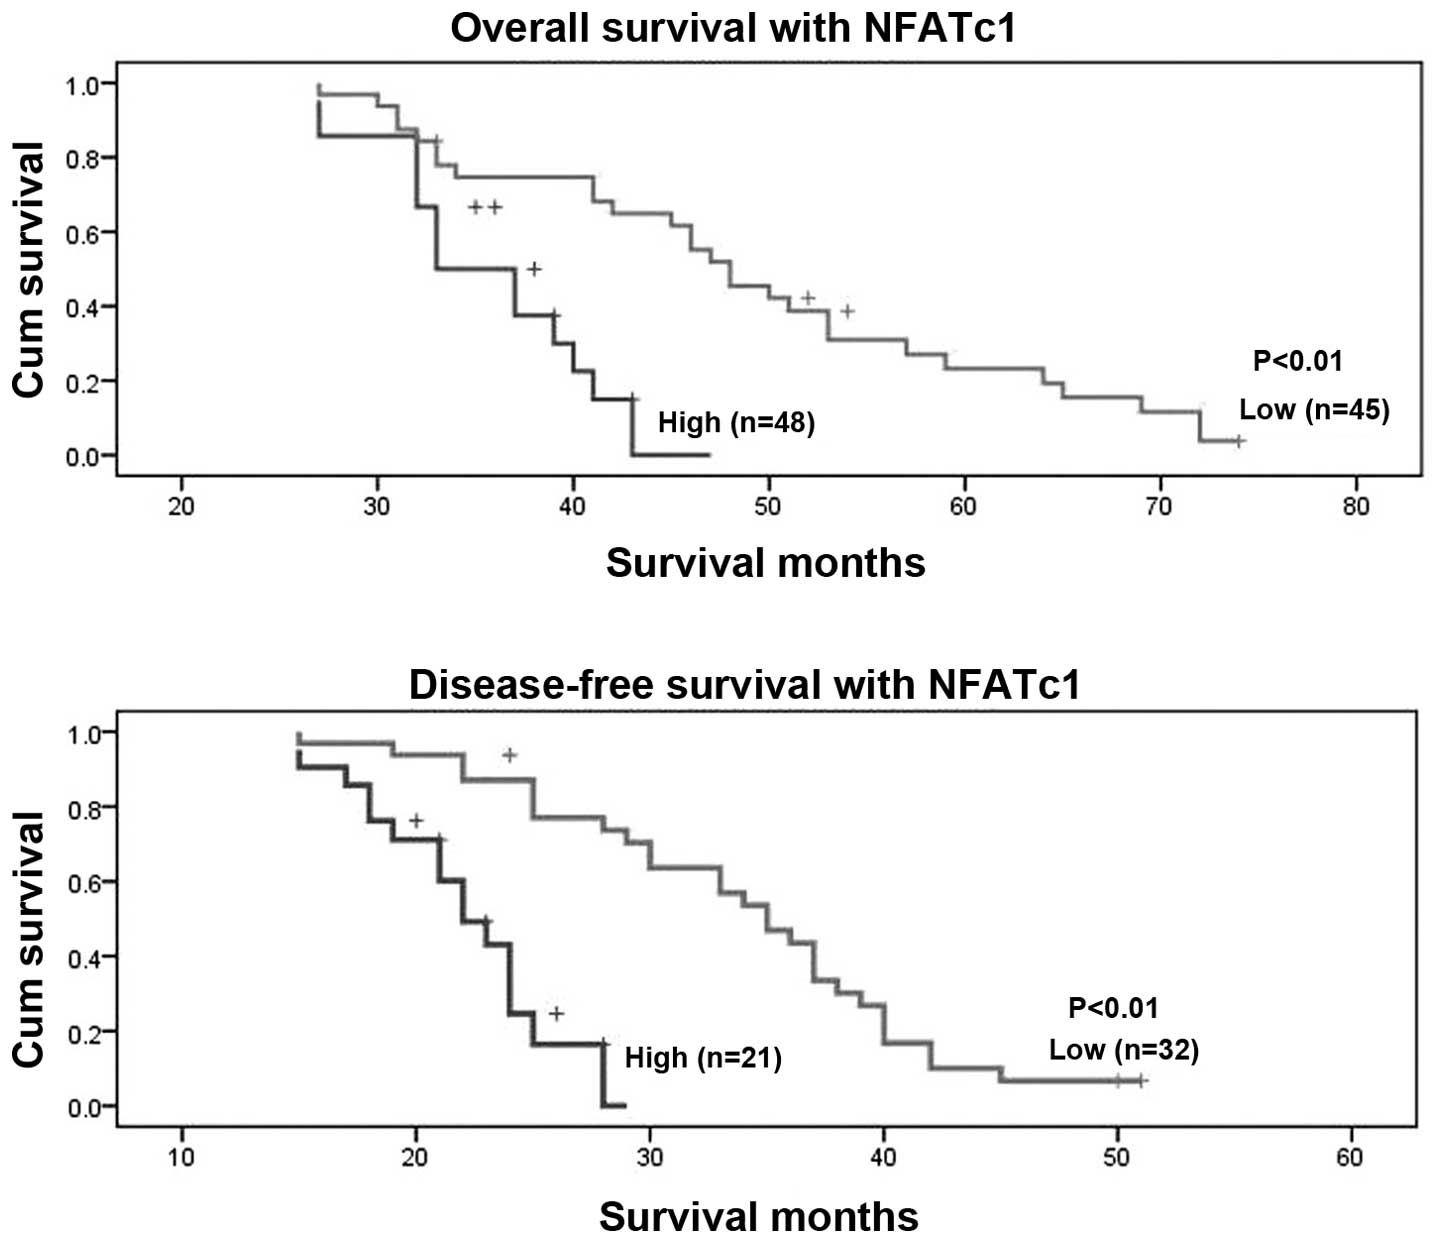
patients with low NFATc1 expression lived longer (mean, 49 months)
than patients with high NFATc1 expression (mean, 36 months;
P<0.01, Fig. 6). In terms of
disease-free survival, patients with high NFATc1 expression also
relapsed earlier in the course of the disease (mean, 22 months)
than did patients with low expression (mean, 35 months; P<0.01;
Fig. 6). Univariate and
multivariate analyses of FIGO stage, age at diagnosis, and NFATc1
expression showed all of these factors to be independent prognostic
factors for overall survival, whereas FIGO stage and age at
diagnosis were independent prognostic factors for disease-free
survival (Table XIII). These
data suggest that NFATc1 overexpression is significantly associated
with EOC prognosis.
| Table XIIIAssociation of NFATc1 expression with
patient characteristics. |
Table XIII
Association of NFATc1 expression with
patient characteristics.
| NFATc1 low | NFATc1 high | Total | P-value |
|---|
| Stage |
| I–II | 6 | 0 | 6 | |
| III–IV | 39 | 48 | 87 | |
| Total | 45 | 48 | 93 | 0.005 |
| Family history |
| Yes | 31 | 14 | 45 | |
| No | 25 | 20 | 45 | |
| Unknown | 2 | 1 | 3 | |
| Total | 58 | 35 | 93 | 0.03 |
| Age at diagnosis
(years) |
| ≥60 | 30 | 21 | 51 | |
| <60 | 28 | 14 | 42 | |
| Total | 58 | 35 | 93 | 0.281 |
| Tumor size
(cm) |
| ≤2 | 9 | 3 | 12 | |
| >2 | 9 | 72 | 81 | |
| Total | 18 | 75 | 93 | 0.041 |
| Relapse |
| Yes | 27 | 15 | 42 | 0.045a |
| Progressive
disease | 19 | 18 | 37 | 0.005b |
| No | 6 | 1 | 7 | 0.05c |
| Unknown | 5 | 2 | 7 | |
| Total | 57 | 36 | 93 | |
| Ascites |
| No | 3 | 2 | 5 | 0.781d |
| Yes | 36 | 27 | 63 | 0.24e |
| Unknown | 18 | 5 | 23 | |
| Minimal | 2 | 0 | 2 | 0.121f |
| Total | 59 | 34 | 93 | |
The association between patient clinical
characteristics and NFATc1 expression is summarized in Table XIII. Low levels of NFATc1
expression were noted in a higher proportion of patients with
early-stage carcinoma compared with patients who had late-stage
disease with high levels of NFATc1 expression (P=0.005). A higher
proportion of patients with a positive family history of cancer had
low NFATc1 expression compared with patients with no family history
of cancer (P=0.03). Patients who did not experience a relapse had
low NFATc1 expression compared with patients whose disease
progressed (P=0.005).
Discussion
EOC is an extremely aggressive disease, with most
patients having metastases or extensive local invasion at the time
of diagnosis (27). Little is known
regarding the potential role of NFATc1 in the process of ovarian
cancer cell growth, motility or dissemination. In the present
study, we provide strong evidence that NFATc1 plays a critical role
in ovarian cancer progression by regulating cell proliferation,
apoptosis, invasion and migration.
As a transcription factor, NFATc1 has been
extensively investigated in terms of lymphocyte activation in the
immune system (28). However,
increasing evidence has shown that NFATc1 is commonly expressed in
mammalian tissues and plays important roles in various malignancies
(29), but the function of the
important nuclear factor in EOC has not been well defined. In the
present study, we first characterized NFATc1 expression in benign
and malignant ovarian cysts. We found that NFATc1 was expressed in
93 of the 96 EOC specimens and in only 6 of the 30 benign ovarian
tumor specimens and 5 of the 30 benign ovarian endometriosis
specimens. In addition, NFATc1 mRNA and protein expression were
significantly increased in EOC (P<0.05). To explore the
potential effect of NFATc1 in EOC, we silenced NFATc1 by green
fluorescent small interfering RNA and infected SKOV3 cells using
Lipofectamine™ 2000. Our data showed that NFATc1 RNA and protein
were significantly decreased by siRNA in the SKOV3 cell line and in
transplanted tumor tissues, leading to cancer cell growth arrest
and an increase in apoptotic cells. Our finding that NFATc1 is
overexpressed in a high proportion of EOC led us to investigate
whether it also could contribute to the motility of ovarian cancer
cells. Depletion of NFATc1 in SKOV3 cells caused a marked reduction
in motility, observed in both Transwell and wound-healing
experiments. In further experiments, we used animal models to
investigate whether NFATc1 is important in ovarian cancer cell
proliferation and dissemination, and we subsequently showed that a
reduction in NFATc1 gene expression inhibited the tumor growth rate
and tumor size and promoted ovarian cancer invasion and migration
through strengthening tumor angiogenesis. It is well known that
VEGFA promotes cancer tissue angiogenesis (30), and research has found that VEGFA
activates calcineurin and induces NFATc1 transcriptional activity.
To confirm whether NFATc1 is associated with angiogenesis, we first
examined transplanted tumor tissues generated from animals injected
with SKOV3/NFATc1 siRNA-1169. The overall blood vessel density was
notably decreased in tissues expressing NFATc1 siRNA. In addition,
we then detected the expression of CXCR2 (a critical angiogenic
factor) downstream of the VEGFA signaling (31) in mouse tumor tissues treated with or
without NFATc1 siRNA. We found that CXCR2 was significantly
decreased in xenograft tumor tissues treated with NFATc1 siRNA.
These results suggest that NFATc1 could promote ovarian cancer
angiogenesis by activating CXCR2, which may be mediated through the
upstream signaling of VEGFA. Finally, we showed that NFATc1
overexpression in ovarian cancer tissue was associated with poor
survival and early relapse in high-grade serous ovarian cancer
patients.
In summary, we provide the first study indicating
that NFATc1 is overexpressed in both ovarian cancer cell lines and
ovarian cancer tissues from patients but not in benign ovarian
tumors, suggesting that NFATc1 may be a potential target for
ovarian cancer treatment. Thus, NFATc1 antagonists that can
effectively inhibit ovarian cancer cell growth may be a potential
strategy for ovarian cancer treatment. Our observations that
depletion of NFATc1 in ovarian cancer cell lines diminishes their
motility suggest the possible involvement of the protein in the
motility and consequently the dissemination of ovarian cancer
cells. Since NFATc1 overexpression is also associated with
angiogenesis in animals and poor survival among ovarian cancer
patients, indicating that this transcription factor may also
contribute to the aggressive nature of this cancer, NFATc1 may be a
novel prognostic marker for ovarian cancer and a potential target
for therapeutic intervention. Further studies into the role of
NFATc1 in ovarian cancer are merited.
Acknowledgments
The present study was supported by the National
Science Foundation of China (no. 81402126).
References
|
1
|
Shaw JP, Utz PJ, Durand DB, Toole JJ,
Emmel EA and Crabtree GR: Identification of a putative regulator of
early T cell activation genes. Science. 241:202–205. 1988.
View Article : Google Scholar : PubMed/NCBI
|
|
2
|
Pan MG, Xiong Y and Chen F: NFAT gene
family in inflammation and cancer. Curr Mol Med. 13:543–554. 2013.
View Article : Google Scholar :
|
|
3
|
Jain J, McCaffrey PG, Valge-Archer VE and
Rao A: Nuclear factor of activated T cells contains Fos and Jun.
Nature. 356:801–804. 1992. View
Article : Google Scholar : PubMed/NCBI
|
|
4
|
Wu Y, Borde M, Heissmeyer V, Feuerer M,
Lapan AD, Stroud JC, Bates DL, Guo L, Han A, Ziegler SF, et al:
FOXP3 controls regulatory T cell function through cooperation with
NFAT. Cell. 126:375–387. 2006. View Article : Google Scholar : PubMed/NCBI
|
|
5
|
Robbs BK, Cruz AL, Werneck MB, Mognol GP
and Viola JP: Dual roles for NFAT transcription factor genes as
oncogenes and tumor suppressors. Mol Cell Biol. 28:7168–7181. 2008.
View Article : Google Scholar : PubMed/NCBI
|
|
6
|
Flockhart RJ, Diffey BL, Farr PM, Lloyd J
and Reynolds NJ: NFAT regulates induction of COX-2 and apoptosis of
keratinocytes in response to ultraviolet radiation exposure. FASEB
J. 22:4218–4227. 2008. View Article : Google Scholar : PubMed/NCBI
|
|
7
|
Chen L, Glover JN, Hogan PG, Rao A and
Harrison SC: Structure of the DNA-binding domains from NFAT, Fos
and Jun bound specifically to DNA. Nature. 392:42–48. 1998.
View Article : Google Scholar : PubMed/NCBI
|
|
8
|
Abdoli R and Najafian N: T helper cells
fate mapping by Co-stimulatory molecules and its functions in
allograft rejection and tolerance. Int J Organ Transplant Med.
5:97–110. 2014.PubMed/NCBI
|
|
9
|
Medyouf H, Alcalde H, Berthier C,
Guillemin MC, dos Santos NR, Janin A, Decaudin D, de Thé H and
Ghysdael J: Targeting calcineurin activation as a therapeutic
strategy for T-cell acute lymphoblastic leukemia. Nat Med.
13:736–741. 2007. View
Article : Google Scholar : PubMed/NCBI
|
|
10
|
Macián F, López-Rodríguez C and Rao A:
Partners in transcription : NFAT and AP-1. Oncogene. 20:2476–2489.
2001. View Article : Google Scholar
|
|
11
|
Stevenson AS, Gomez MF, Hill-Eubanks DC
and Nelson MT: NFAT4 movement in native smooth muscle. A role for
differential Ca2+ signalling. J Biol Chem.
276:15018–15024. 2001. View Article : Google Scholar : PubMed/NCBI
|
|
12
|
Flockhart RJ, Armstrong JL, Reynolds NJ
and Lovat PE: NFAT signalling is a novel target of oncogenic BRAF
in metastatic melanoma. Br J Cancer. 101:1448–1455. 2009.
View Article : Google Scholar : PubMed/NCBI
|
|
13
|
Tripathi P, Wang Y, Coussens M, Manda KR,
Casey AM, Lin C, Poyo E, Pfeifer JD, Basappa N, Bates CM, et al:
Activation of NFAT signaling establishes a tumorigenic
microenvironment through cell autonomous and non-cell autonomous
mechanisms. Oncogene. 33:1840–1849. 2014. View Article : Google Scholar
|
|
14
|
Baumgart S, Chen NM, Siveke JT, König A,
Zhang JS, Singh SK, Wolf E, Bartkuhn M, Esposito I, Heßmann E, et
al: Inflammation-induced NFATc1-STAT3 transcription complex
promotes pancreatic cancer initiation by KrasG12D. Cancer Discov.
4:688–701. 2014. View Article : Google Scholar : PubMed/NCBI
|
|
15
|
Kawahara T, Kashiwagi E, Ide H, Li Y,
Zheng Y, Miyamoto Y, Netto GJ, Ishiguro H and Miyamoto H:
Cyclosporine A and tacrolimus inhibit bladder cancer growth through
down-regulation of NFATc1. Oncotarget. 6:1582–1593. 2015.
View Article : Google Scholar : PubMed/NCBI
|
|
16
|
Pennisi A, Ling W, Li X, Khan S,
Shaughnessy JD Jr, Barlogie B and Yaccoby S: The ephrinB2/EphB4
axis is dysregulated in osteoprogenitors from myeloma patients and
its activation affects myeloma bone disease and tumor growth.
Blood. 114:1803–1812. 2009. View Article : Google Scholar : PubMed/NCBI
|
|
17
|
Schabbauer G, Schweighofer B,
Mechtcheriakova D, Lucerna M, Binder BR and Hofer E: Nuclear factor
of activated T cells and early growth response-1 cooperate to
mediate tissue factor gene induction by vascular endothelial growth
factor in endothelial cells. Thromb Haemost. 97:988–997.
2007.PubMed/NCBI
|
|
18
|
Kavitha CV, Deep G, Gangar SC, Jain AK,
Agarwal C and Agarwal R: Silibinin inhibits prostate cancer cells-
and RANKL-induced osteoclastogenesis by targeting NFATc1, NF-κB and
AP-1 activation in RAW264.7 cells. Mol Carcinog. 53:169–180. 2014.
View Article : Google Scholar
|
|
19
|
Murray OT, Wong CC, Vrankova K and Rigas
B: Phosphosulindac inhibits pancreatic cancer growth: NFATc1 as a
drug resistance candidate. Int J Oncol. 44:521–529. 2014.
|
|
20
|
Yang G, Rosen DG, Liu G, Yang F, Guo X,
Xiao X, Xue F, Mercado-Uribe I, Huang J, Lin SH, et al: CXCR2
promotes ovarian cancer growth through dysregulated cell cycle,
diminished apoptosis, and enhanced angiogenesis. Clin Cancer Res.
16:3875–3886. 2010. View Article : Google Scholar : PubMed/NCBI
|
|
21
|
Matsuo Y, Raimondo M, Woodward TA, Wallace
MB, Gill KR, Tong Z, Burdick MD, Yang Z, Strieter RM, Hoffman RM,
et al: CXC-chemokine/CXCR2 biological axis promotes angiogenesis in
vitro and in vivo in pancreatic cancer. Int J Cancer.
125:1027–1037. 2009. View Article : Google Scholar : PubMed/NCBI
|
|
22
|
Wu B, Wang Y, Lui W, Langworthy M,
Tompkins KL, Hatzopoulos AK, Baldwin HS and Zhou B: Nfatc1
coordinates valve endocardial cell lineage development required for
heart valve formation. Circ Res. 109:183–192. 2011. View Article : Google Scholar : PubMed/NCBI
|
|
23
|
Lee JH, Bhang DH, Beede A, Huang TL,
Stripp BR, Bloch KD, Wagers AJ, Tseng YH, Ryeom S and Kim CF: Lung
stem cell differentiation in mice directed by endothelial cells via
a BMP4-NFATc1-thrombospondin-1 axis. Cell. 156:440–455. 2014.
View Article : Google Scholar : PubMed/NCBI
|
|
24
|
Jang GH, Park IS, Yang JH, Bischoff J and
Lee YM: Differential function of genes regulated by VEGF-NFATc1
signaling pathway in migration of pulmonary valve endothelial
cells. FEBS Lett. 584:141–146. 2010. View Article : Google Scholar :
|
|
25
|
Stankunas K, Ma GK, Kuhnert FJ, Kuo CJ and
Chang CP: VEGF signaling has distinct spatiotemporal roles during
heart valve development. Dev Biol. 347:325–336. 2010. View Article : Google Scholar : PubMed/NCBI
|
|
26
|
Pickens SR, Chamberlain ND, Volin MV,
Gonzalez M, Pope RM, Mandelin AM II, Kolls JK and Shahrara S:
Anti-CXCL5 therapy ameliorates IL-17-induced arthritis by
decreasing joint vascularization. Angiogenesis. 14:443–455. 2011.
View Article : Google Scholar : PubMed/NCBI
|
|
27
|
Bachmann C, Krämer B, Brucker SY, Stäbler
A, Fend F, Wallwiener D, Grischke EM and Rothmund R: Relevance of
pelvic and para-aortic node metastases in early-stage ovarian
cancer. Anticancer Res. 34:6735–6738. 2014.PubMed/NCBI
|
|
28
|
Shin B, Yu J, Park ES, Choi S, Yu J, Hwang
JM, Yun H, Chung YH, Hong KS, Choi JS, et al: Secretion of a
truncated osteopetrosis-associated transmembrane protein 1 (OSTM1)
mutant inhibits osteoclastogenesis through down-regulation of the B
lymphocyte-induced maturation protein 1 (BLIMP1)-nuclear factor of
activated T cells c1 (NFATc1) axis. J Biol Chem. 289:35868–35881.
2014. View Article : Google Scholar : PubMed/NCBI
|
|
29
|
Kawahara T, Kashiwagi E, Ide H, Li Y,
Zheng Y, Ishiguro H and Miyamoto H: The role of NFATc1 in prostate
cancer progression: Cyclosporine A and tacrolimus inhibit cell
proliferation, migration, and invasion. Prostate. 75:573–584. 2015.
View Article : Google Scholar : PubMed/NCBI
|
|
30
|
Guérin F, Wagner M, Liné A, Zappa M,
Fasseu M, Paradis V, Vilgrain V, Van Beers BE, Legagneux J, Moreau
R, et al: Hepatic proliferation and angiogenesis markers are
increased after portal deprivation in rats: A study of molecular,
histological and radiological changes. PLoS One. 10:e01254932015.
View Article : Google Scholar : PubMed/NCBI
|
|
31
|
Adinolfi E, Raffaghello L, Giuliani AL,
Cavazzini L, Capece M, Chiozzi P, Bianchi G, Kroemer G, Pistoia V
and Di Virgilio F: Expression of P2X7 receptor increases in vivo
tumor growth. Cancer Res. 72:2957–2969. 2012. View Article : Google Scholar : PubMed/NCBI
|