Introduction
Ovarian cancer is the most lethal gynecological
malignancy and accounts for 25–30% of all malignant tumors in the
female reproductive tract. An estimated 22,280 new cases of ovarian
cancer and 14,240 related deaths were reported in 2016 in the US
(1). Due to its innocuous symptoms,
most ovarian cancer patients are diagnosed at the late stage.
Despite the development of new antitumor drugs and the improvement
of surgical treatment, the majority of patients with advanced
disease (stages III–IV) eventually relapse and the 5-year survival
rate of late stage patients is only 30% (2). Therefore, early diagnosis of ovarian
cancer is crucial to reduce mortality and improve the prognosis for
eventual survival. Human epididymis protein 4 (HE4), also known as
whey-acidic-protein (WAP) four-disulfide core domain protein 2
(WFDC2), was first found overexpressed in ovarian cancer tissue in
1999 (3). Although it was
originally recognized as a small secreted protein that plays a role
in sperm maturation in males (4),
numerous studies have found that HE4 is a valuable serum biomarker
possessing higher sensitivity and specificity than CA125 in the
confirmative early diagnosis for epithelial ovarian cancer (EOC)
(5,6), and the combined use of HE4 with pelvic
ultrasound achieved the best sensitivity for detecting ovarian
cancers among the different algorithms tested (7). It seems to be an independent
predictive factor for ideal tumor cytoreductive surgery and
maintains its prognostic role even after recurrence (8). Moreover, recent investigations have
shown that serum HE4 could predict chemotherapy response during
first-line chemotherapy (9), and
high HE4 levels are correlated with chemoresistance and decreased
survival rates in EOC patients (10,11).
HE4 shows its potential application as a biomarker for early
detection and discrimination of endometrial (12,13)
and non-small cell lung cancer (14), and pancreatic adenocarcinoma
(15). A high serum HE4 level may
be a useful biomarker for the poor prognosis in non-small cell lung
cancer patients (16,17).
Over the past decade, much attention has been given
to explore the clinical application of HE4 as a biomarker. In
recent years, several studies have reported that HE4 acts as an
oncogene implicated in various cancer behaviors, such as cell
adhesion (18), proliferation,
migration, metastasis (19–21) and chemoresistance (19,22).
The molecular mechanisms may be attributed to the activation of
epidermal growth factor (EGF) (18), vascular endothelial growth factor
(VEGF) (19), HIF1α (19) or the interaction with Annexin A2
(23), and Lewis y glycosylation
(24). Nevertheless, investigation
of the role of HE4 in the malignant biological behaviors of ovarian
cancer is limited.
Therefore, in the present study, we sought to
investigate alteration of the gene expression profile in response
to HE4 in ovarian cancer cells. The results obtained from this
research may lead to a better understanding of the molecular
mechanisms associated with HE4 in ovarian cancer and to facilitate
the early diagnosis and therapeutic treatment of ovarian
cancer.
Materials and methods
Cell culture, construction of expression
vectors and HE4 gene transfection
Human EOC ES-2 cells were purchased from the
American Type Culture Collection (ATCC; Manassas, VA, USA) and
maintained in RPMI-1640 medium with 10% fetal bovine serum (FBS)
and 1% penicillin/streptomycin, at 37°C in a humidified atmosphere
with 5% CO2. An HE4 expression construct was generated
by subcloning PCR-amplified full-length human HE4 cDNA into the
pEGFP-N1 or pCMV6 plasmid. The following primers were used: P1,
5′-TCC GCT CGA GAT GCC TGC TTG TCG CCT AG-3′ and P2, 5′-ATG GGG TAC
CGT GAA ATT GGG AGT GAC ACA GG-3′. Two shRNA expression vectors for
human HE4 were constructed using the vector pSilencer. The mRNA
target sequences chosen for designing HE4-shRNA were: GTC CTG TGT
CAC TCC CAA T for HE4-shRNA1 and GAT GAA ATG CTG CCG CAA T for
HE4-shRNA2. Transfection was carried out using liposomes with a
vector transfection kit according to the instructions. Regarding
the stable cell lines, HE4-overexpressing (HE4-H) (O), HE4-shRNA
low-expressing (HE4-L) (S) and their respective empty-plasmid
transfected cell lines [HE4-H-Mock (OV) and HE4-L-Mock (SV)] were
selected for 14 days with G418 (800 μg/ml) (Invitrogen,
Carlsbad, CA, USA). All cell lines were labeled and are listed in
Table I.
 | Table ICell line sample description and RNA
qualification. |
Table I
Cell line sample description and RNA
qualification.
| Sample ID | Label | OD260/280 | OD260/230 | RIN | Results |
|---|
| HE4-H | O | 2.02 | 2.21 | 9.30 | Pass |
| HE4-H-vector | OV | 2.02 | 2.35 | 8.60 | Pass |
| HE4-L | S | 2.02 | 2.24 | 10.0 | Pass |
| HE4-L-vector | SV | 2.03 | 2.09 | 9.00 | Pass |
Transfection identification by
quantitative real-time PCR and western blotting
Quantitative real-time polymerase
chain reaction (RT-PCR)
Total RNA was extracted with TRIzol reagent and
reverse-transcribed to cDNA using SuperScript III (both from
Invitrogen). Quantitative real-time PCR was performed on Roche
LightCycler 480 (Roche Diagnostics, Mannheim, Germany) sequence
detection system. The primers for HE4 were: 5′-AGT GTC CTG GCC AGA
TGA AAT G-3′ for forward and 5′-CAG GTG GGC TGG AAC CAG AT-3′ for
reverse. GAPDH was used to normalize the quantity of complementary
DNA. PCR reactions of each sample were carried out in triplicate.
The cycle steps were 95°C for 5 min, 40 cycles of 95°C for 15 sec,
60°C for 1 min and 72°C for 20 sec.
Western blotting
Western blotting was performed as previously
described (23). The HE4 antibody
(rabbit polyclonal; 1:40; Abcam, Cambridge, MA, USA) was used and
the negative control contained only HE4 antibody without protein.
The protein bands were visualized by ImageJ 1.31v and normalized
relative to the GAPDH protein expression level.
Total RNA extraction and quantity
control
Two pairs of cells were prepared for gene chip
hybridization analysis: HE4-overexpressing cells vs.
HE4-overexpressing vector cells, and HE4-shRNA cells vs. HE4-shRNA
vector cells. Total RNA was extracted from all cell lines using
RNeasy Mini kit and further purified with RNeasy MinElute Cleanup
columns (both from Qiagen, Valencia, CA, USA). RNA quantity and
purity were assessed using NanoDrop ND-1000. Pass criteria for
absorbance ratios were established as A260/A280 ≥1.8 and A260/A230
≥1. RNA integrity number (RIN) values were ascertained using
Agilent RNA 6000 Nano assay to determine RNA integrity. Pass
criterion for RIN value was established at ≥6. The RNA samples in
each group are labeled in Table I.
The total RNA of each cell line was allocated to 3 chips for
further hybridization and analysis to decrease the experimental
error.
Gene chip hybridization, data
collection and enrichment analysis
Purified RNA samples were submitted to Human Whole
Genome OneArray® (HOA6.1) with Phalanx hybridization
buffer using Phalanx Hybridization System for microarray analysis.
This array contains 30,275 DNA oligonucleotide probes, and each
probe is a 60-mer designed in the sense direction. Among the
probes, 29,187 probes correspond to the annotated genes in RefSeq
v38 and Ensembl v56 database. In addition, 1,088 control probes are
also included. After 16 h of hybridization at 50°C, non-specific
binding targets were washed away by 3 different washing steps (wash
I, 42°C for 5 min; wash II, 42°C for 5 min, 25°C for 5 min; and
wash III, rinse 20 times), and the slides were dried by
centrifugation and scanned by Axon 4000B scanner (Molecular
Devices, Sunnyvale, CA, USA). The intensities of each probe were
obtained by GenePix 4.1 software (Molecular Devices). In the
present study, 12 chips were used to compare the differentially
expressed genes (DEGs). Scatter plots were conducted to show the
repeatability of the expression signal between technical repeats.
Histogram plots were made to show the fold-change distribution of
all probes excluding control and flagged probes. Volcano plots were
performed to visually show a distinguishable gene expression
profile among samples. Venny-diagram was performed to identify the
coordinated DEGs in response to HE4 (http://bioinfogp.cnb.csic.es/tools/venny/).
Fold-changes were calculated by Rosetta Resolver 7.2 with error
model adjusted by Amersham Pairwise Ration Builder for signal
comparison of sample. Standard selection criteria to identify DEGs
were as follows: i) log2 |fold-change| ≥1 and P<0.05;
ii) log2 ratios ̔NA̓ and the differences in intensity
between the two samples ≥1,000.
Validation of gene expression by RT-PCR
and immunohistochemical (IHC) staining
RT-PCR
RT-PCR was performed in triplicate with primer sets
and probes that were specific for 4 selected genes that were found
to be significantly differentially expressed: FOXA2, SERPIND1,
BDKRD1 and IL1A. The methods are shown as above.
IHC
To validate the DEGs at the protein level, IHC
staining in ovarian samples was conducted. In our previous studies,
we established a group of ovarian paraffin-embedded samples
(23) including 50 malignant, 27
borderline, 15 benign and 15 normal ovarian tissues. In view of the
further investigation, SERPIND1 was selected for IHC staining in
these samples and then compared with the expression of HE4. The
working dilution for SERPIND1 (#12741-1-AP; ProteinTech, Chicago,
IL, USA) was 1:400. The staining of hepatic cancer samples was
chosen as the positive control and omission of the primary antibody
was designed as the negative control. The staining procedures were
performed as previously described (23). Regarding the evaluation method, in
brief, the presence of brown-colored granules on the cell membrane
or in the cytoplasm was taken as a positive signal, and was
classified according to color intensity as follows: not colored,
light yellow, brown and tan were recorded as 0, 1, 2 and 3,
respectively. A positive cell staining rate of <5, 5–25, 26–50
and 51–75%, and >75% were recorded as 0, 1, 2, 3 and 4. The
final score was determined by multiplying the positive cell
staining rate and the score values: 0–2 was considered negative
(−), 3–4 was (+), 5–8 was (++), and 9–12 was (+++).− and + were
considered as low expression; ++ and +++ as high expression. Two
observers evaluated the sections to control error. Survival
analysis was performed on these patients. The overall survival (OS)
time was defined from the date of surgery (earliest was in August
2008) to the date of death or the last follow-up (September,
2015).
Enrichment analysis of DEGs
All the DEGs in each pair group were prepared to run
Gene Ontology (GO) and canonical pathways analyses (Biocarta and
KEGG). Gene interaction networks were visualized by Cytoscape
(25). The property of the network
was analyzed with the plug-in network analysis.
Statistical analysis
Statistical analyses were performed using the SPSS
program (version 22 for Mac; SPSS, Inc., Chicago, IL, USA) and
GraphPad Prism 6 (version 6.0 h for Mac; GraphPad Prism Software
Inc., San Diego, CA, USA). Chi-square and one-way ANOVA with LSD or
Bonferroni post hoc test was used for comparison between >2
groups. The correlation coefficient R of SERPIND1 with HE4 was
calculated by Spearman correlation analysis. Quantitative data are
presented as mean ± SD. As to the analysis of quantitative RT-PCR
result, the data are expressed as mean ± SEM. Survival analysis was
analyzed using Kaplan-Meier curves by log-rank test. A P-value of
<0.05 was considered to indicate a statistically significant
result.
Results
Identification of HE4 gene
transfection
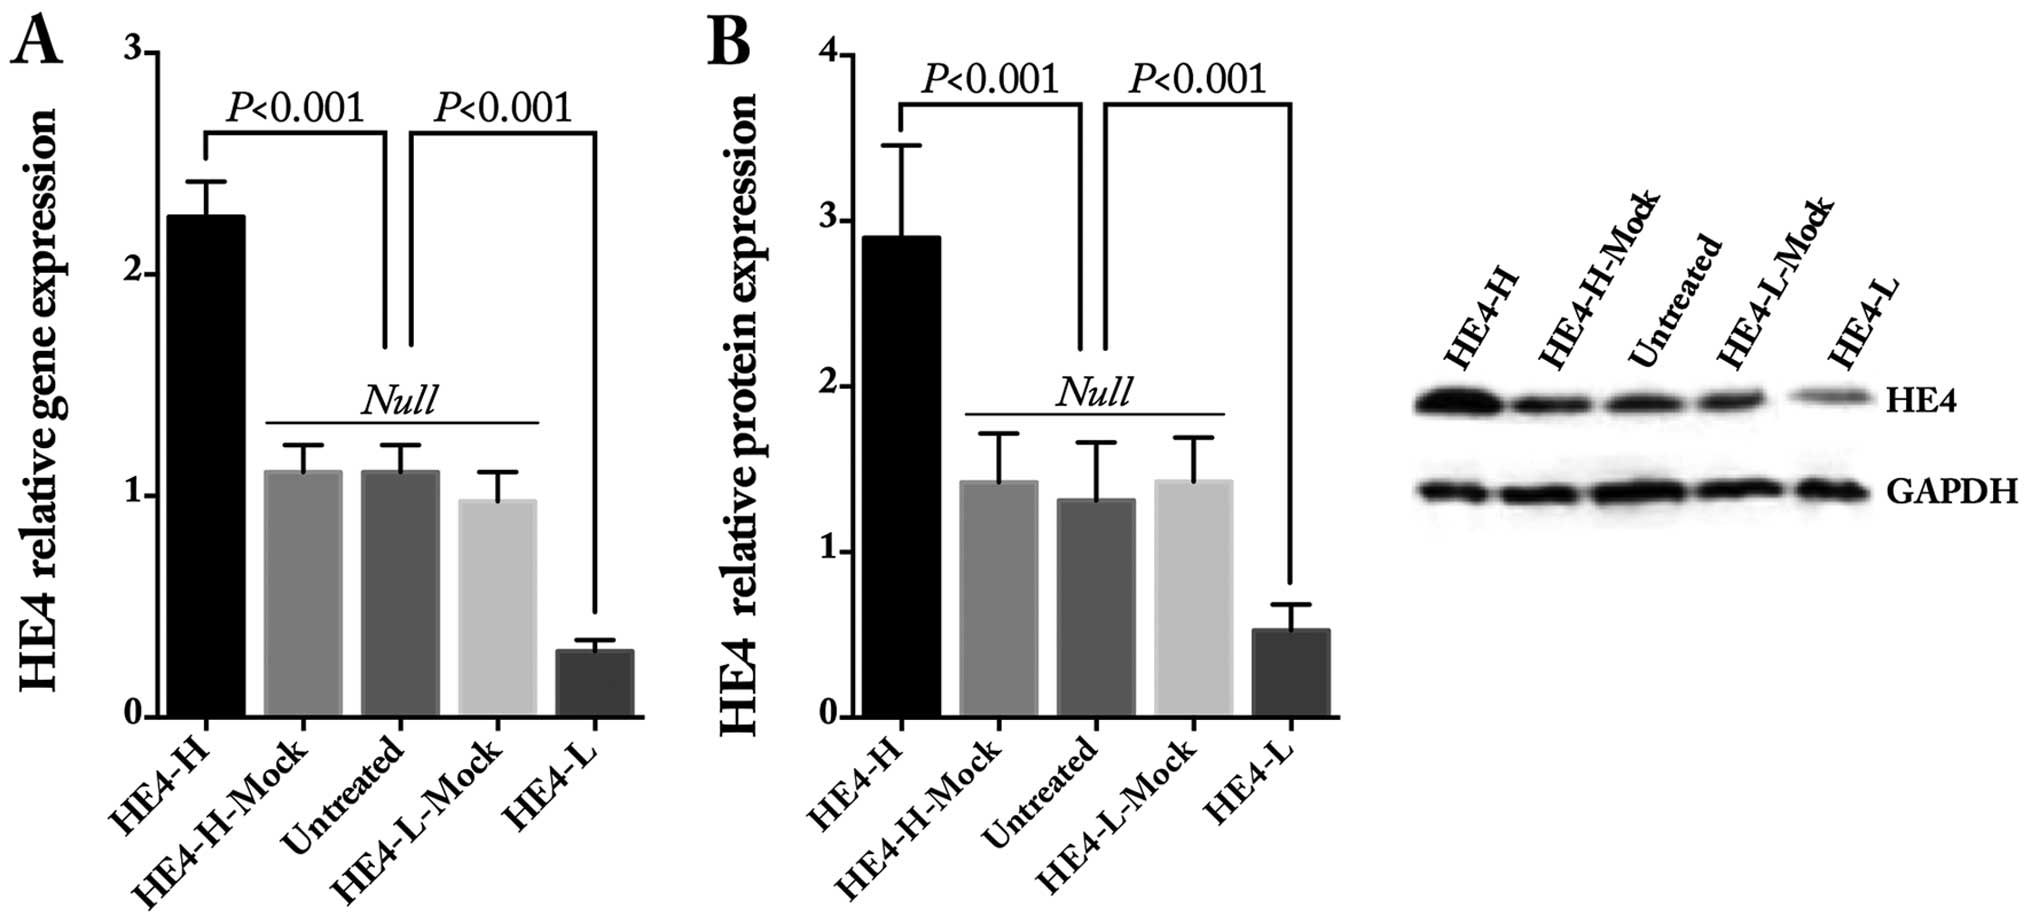
Stable transfected cell lines were established using
the ES-2 cells. The gene and protein expression levels of HE4 were
obviously increased after HE4 transfection and decreased after
shRNA transfection, as detected by quantitative real-time PCR
(Fig. 1A) and western blotting
(Fig. 1B and C), whereas there was
no statistical difference in regards to HE4 in the mock and
untreated cells.
Gene expression analysis and
clustering
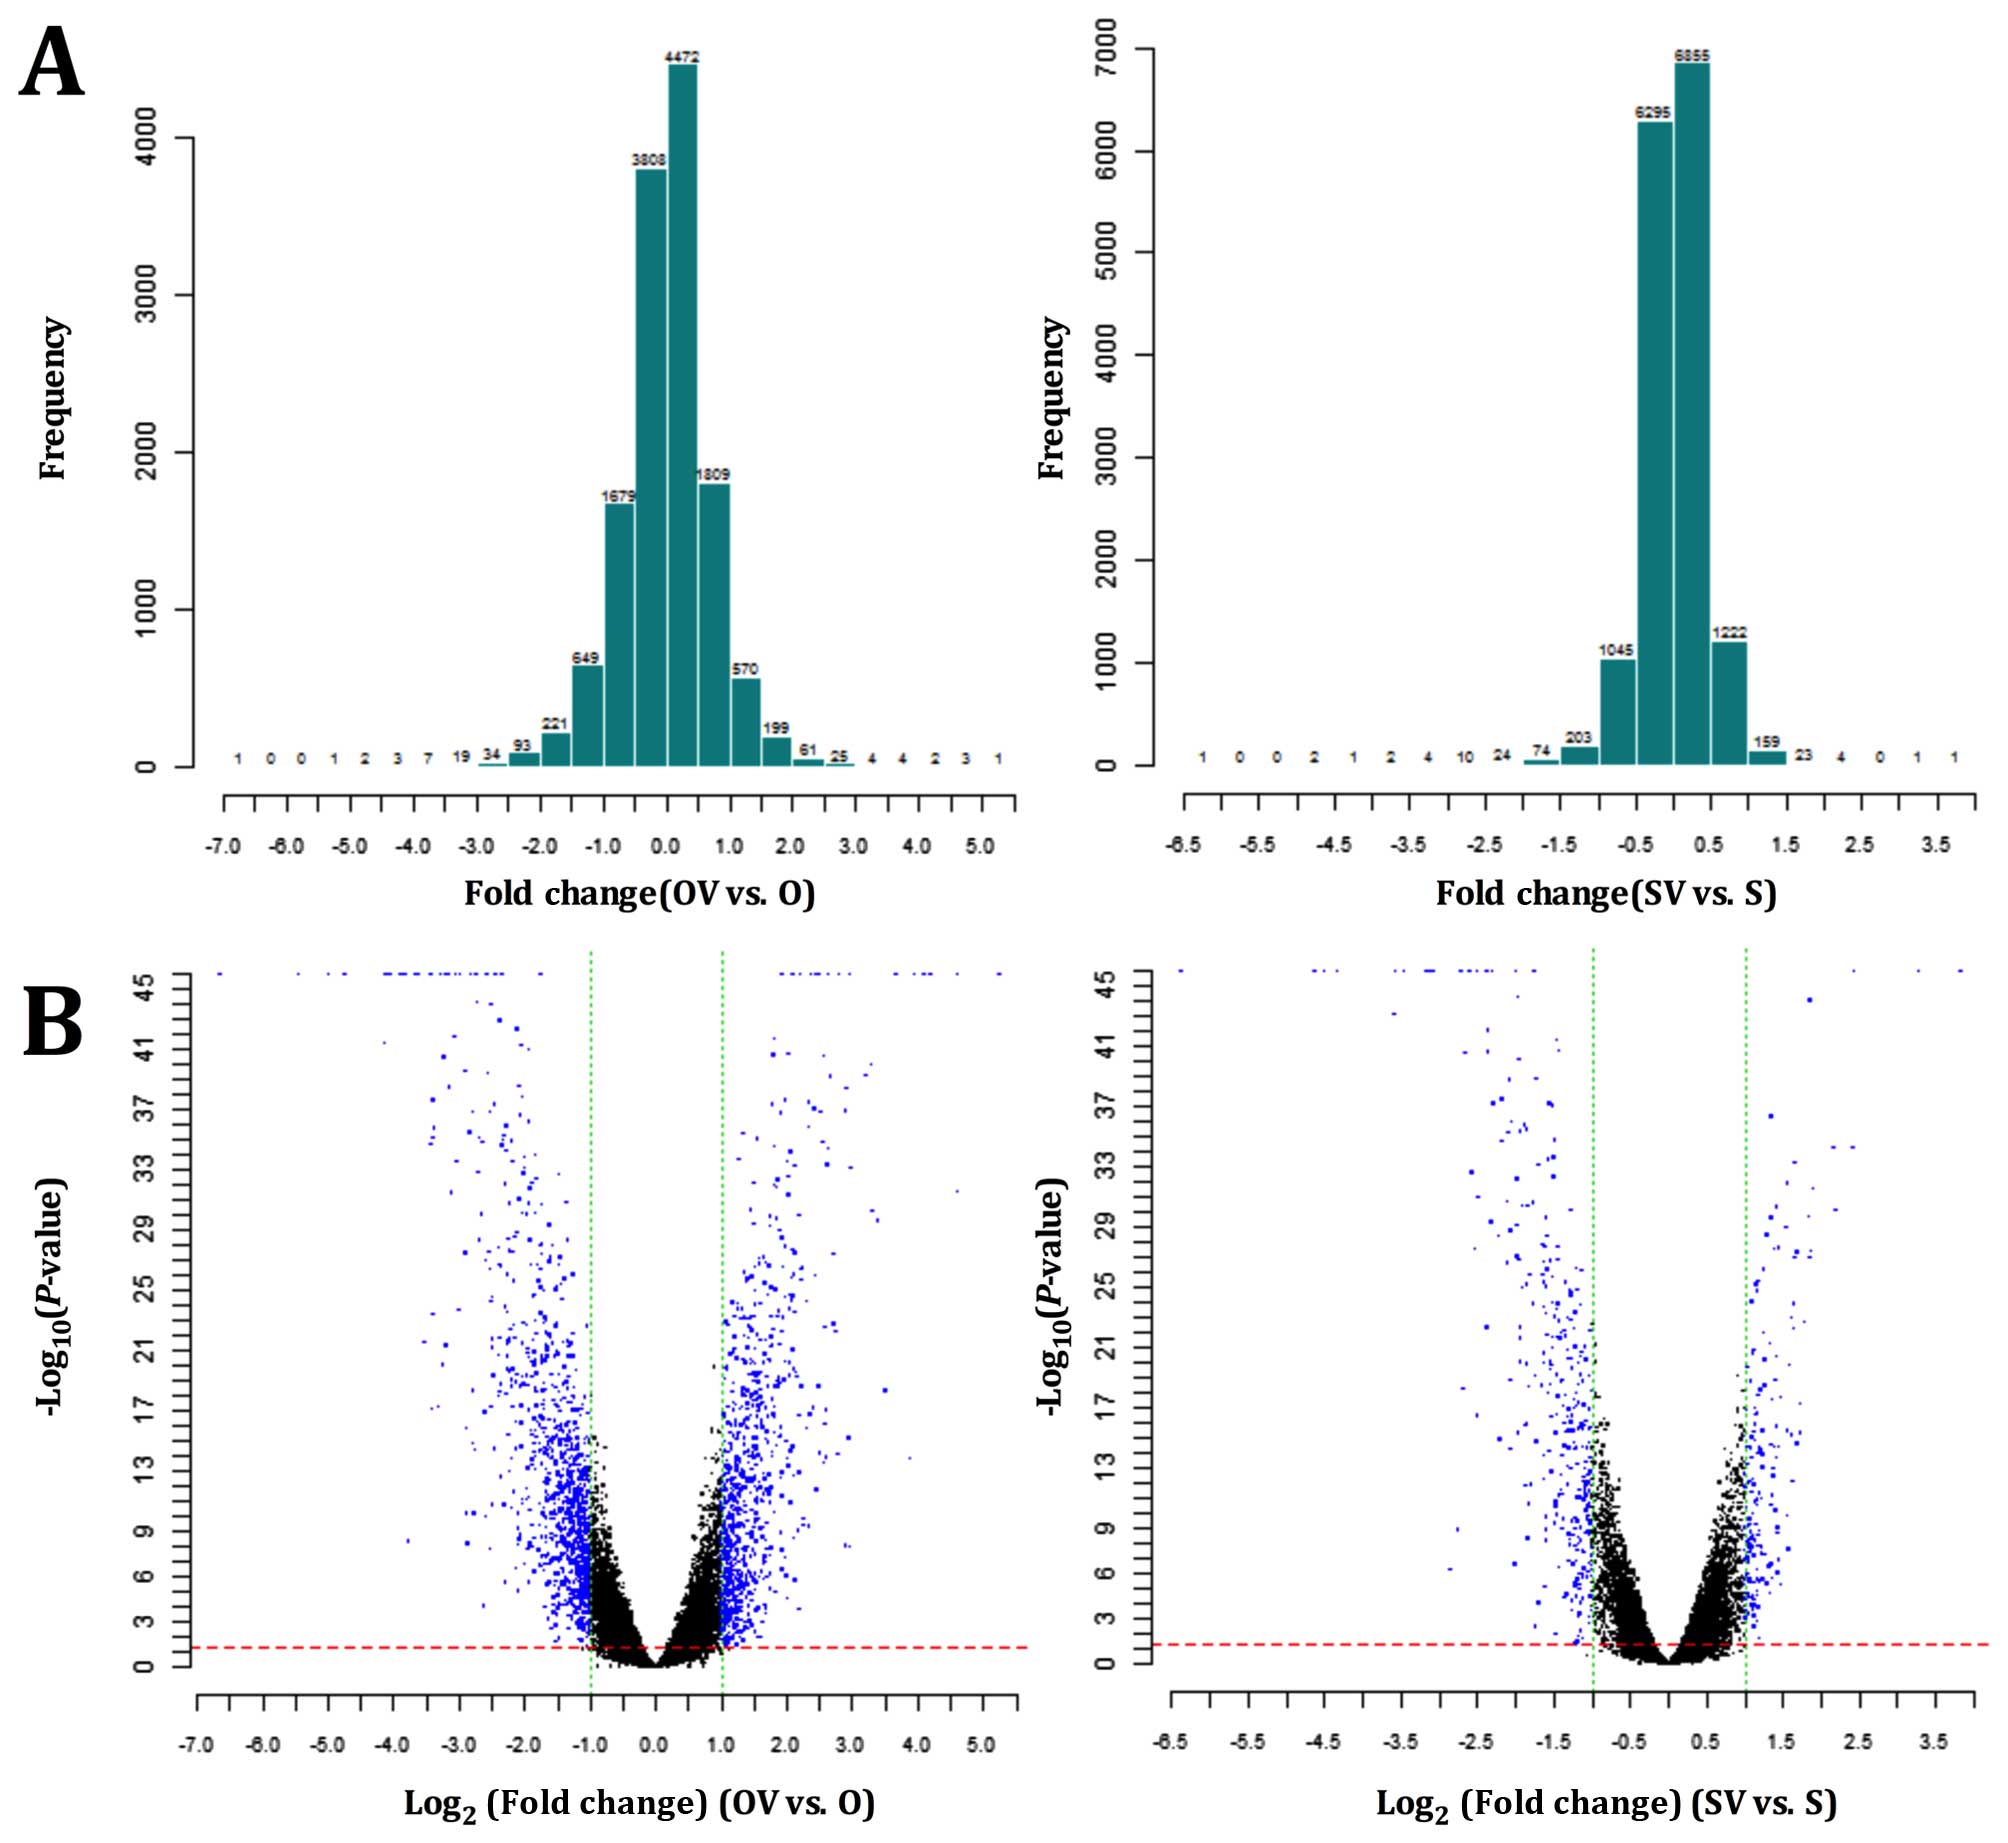
The expression profiles of all the samples passed
the microarray quality control (Table
I). Histogram plots of fold-change distribution of all probes
excluding control and flagged probes were conducted for all signals
collected (Fig. 2A), and the
volcano plots revealed the DEGs for each pair of gene chips
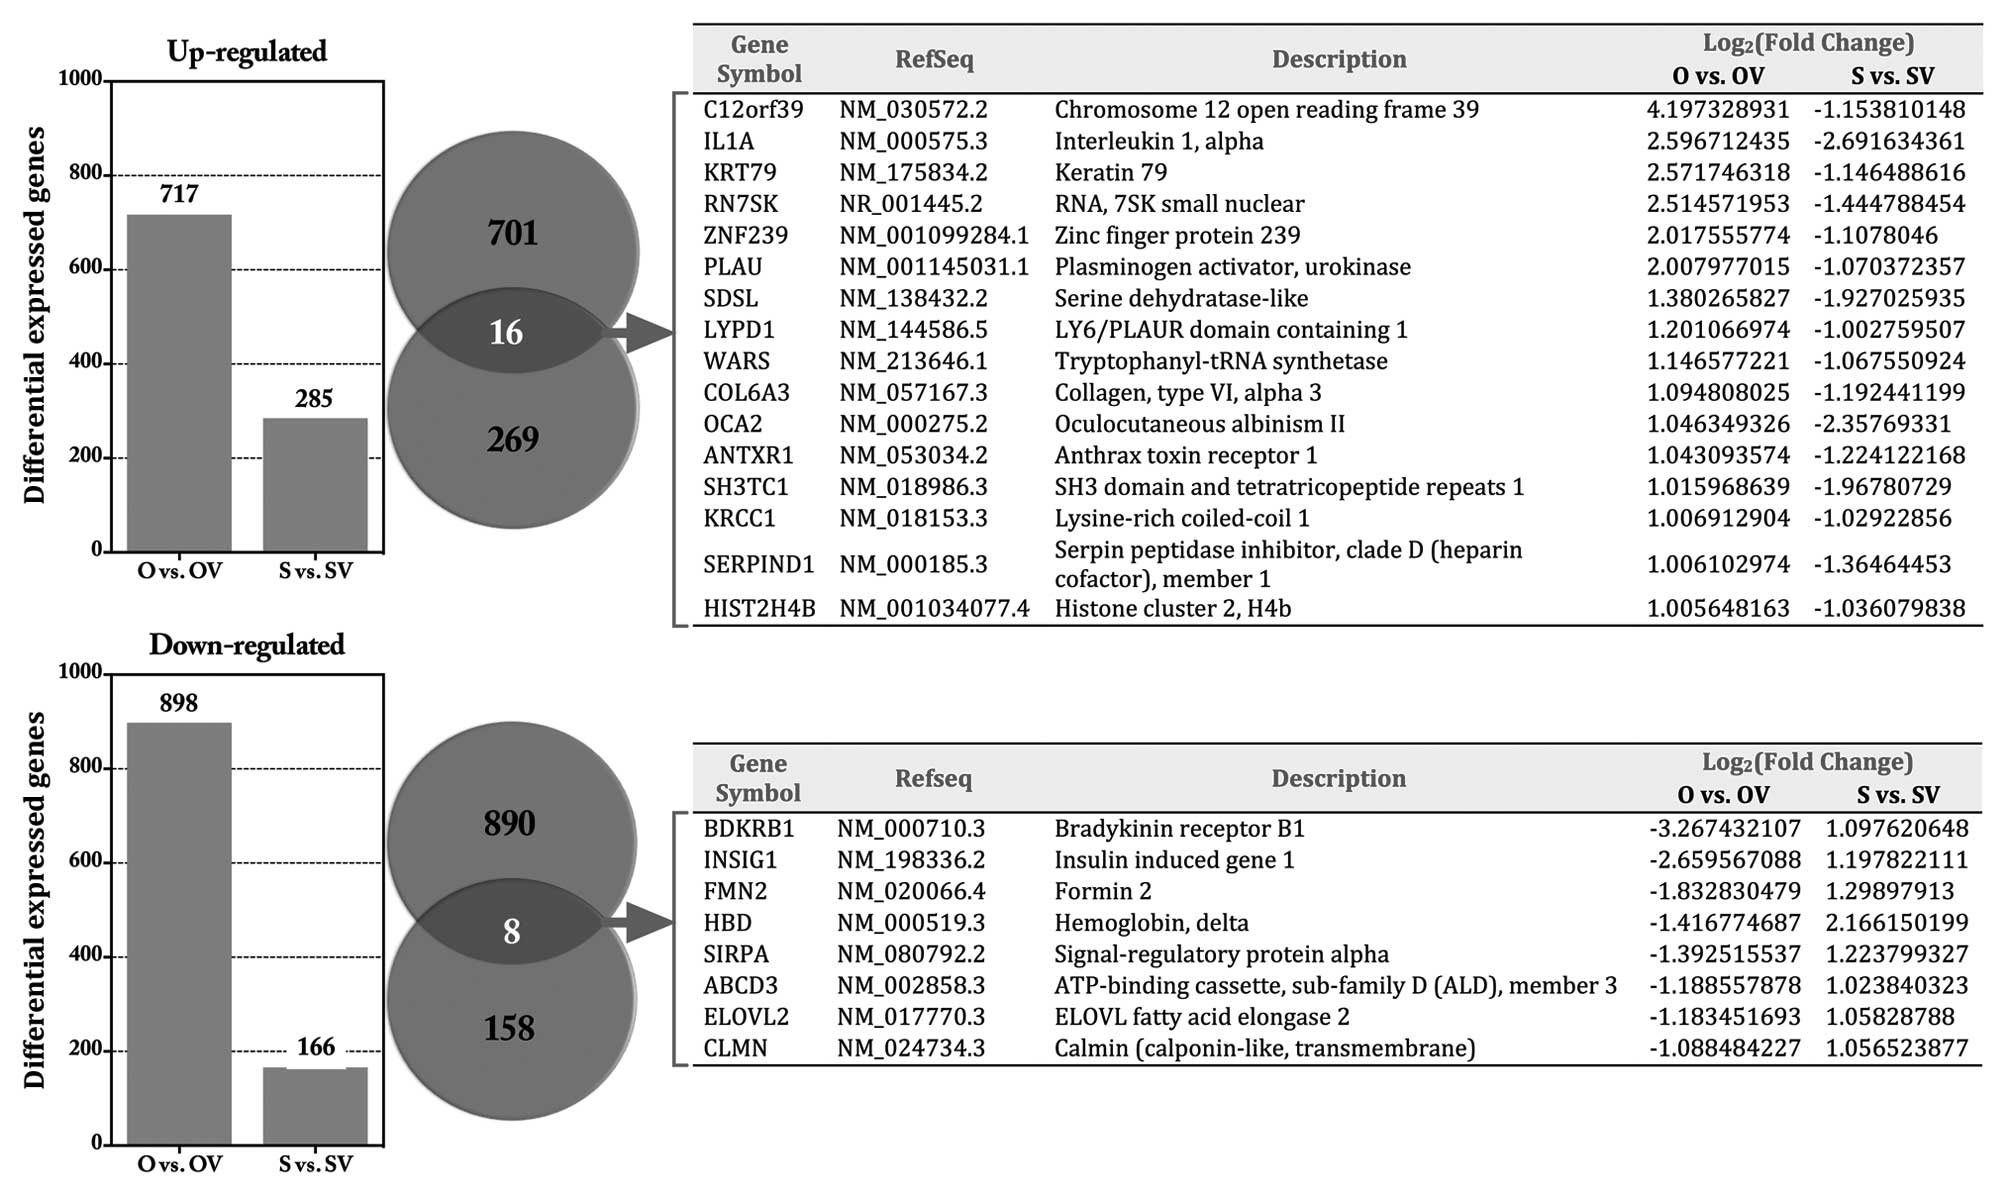
(Fig. 2B). A total of 717 genes
were upregulated and 898 genes were downregulated in O vs. OV, 166
genes were upregulated and 285 were downregulated in S vs. SV. The
top 20 DEGs in each group are shown in Table II. Venn diagrams showed that an
overlap of 16 genes was consistently upregulated and 8 genes
downregulated in response to HE4 (Fig.
3).
| Table IITop 20 differentially expressed genes
in each group. |
Table II
Top 20 differentially expressed genes
in each group.
| Gene symbol | RefSeq | Description | Log2
(fold-change) | P-value |
|---|
| O vs. OV
upregulated |
| EPB41L3 | NM 012307.2 | Erythrocyte
membrane protein band 4.1-like 3 | 5.246232 | 0 |
| FOXA2 | NM 153675.2 | Forkhead box
A2 | 4.619921 | 3.02E-32 |
| GDF15 | NM 004864.2 | Growth
differentiation factor 15 | 4.612066 | 0 |
| TAGLN3 | NM 001008273.1 | Transgelin 3 | 4.603976 | 0 |
| C12orf39 | NM 030572.2 | Chromosome 12 open
reading frame 39 | 4.197329 | 0 |
| MMP3 | NM 002422.3 | Matrix
metallopeptidase 3 | 3.961772 | 0 |
| IL11 | NM 000641.3 | Interleukin 11 | 3.887501 | 1.55E-14 |
| IL24 | NM 001185158.1 | Interleukin 24 | 3.674028 | 0 |
| FAM24B | NM 152644.2 | Family with
sequence similarity 24, member B | 3.390164 | 2.4E-30 |
| PPP1R15A | NM 014330.3 | Protein phosphatase
1, regulatory subunit 15A | 3.31736 | 5.28E-31 |
| EGR1 | NM 001964.2 | Early growth
response 1 | 3.217277 | 5.29E-40 |
| PHLDA1 | NM 007350.3 | Pleckstrin
homology-like domain, family A, member 1 | 2.992293 | 8.23E-34 |
| LIF | NM 001257135.1 | Leukemia inhibitory
factor | 2.973342 | 0 |
| DUSP5 | NM 004419.3 | Dual specificity
phosphatase 5 | 2.954481 | 6.36E-16 |
| SESN2 | NM 031459.4 | Sestrin 2 | 2.920611 | 3.56E-39 |
| BCL2A1 | NM 001114735.1 | BCL2-related
protein A1 | 2.911151 | 8.87039E-09 |
| HECW2 | NM 020760.1 | HECT, C2 and WW
domain containing 2 E3 ubiquitin protein ligase | 2.90343 | 1.25E-37 |
| ALOX5AP | NM 001204406.1 | Arachidonate
5-lipoxygenase-activating protein | 2.801388 | 0 |
| SAT1 | NM 002970.2 | Spermidine/spermine
N1-acetyltransferase 1 | 2.785946 | 7.82E-15 |
| FES | NM 001143785.1 | Feline sarcoma
oncogene | 2.75507 | 5.74E-23 |
| O vs. OV
downregulated |
| NNMT | NM 006169.2 | Nicotinamide
N-methyltransferase | −6.64385619 | 0 |
| MAGED4B | NM 177535.2 | Melanoma antigen
family D, 4B | −5.441719409 | 0 |
| CCL2 | NM 002982.3 | Chemokine (C-C
motif) ligand 2 | −4.986829225 | 0 |
| IGFBP7 | NM 001253835.1 | Insulin-like growth
factor binding protein 7 | −4.130075866 | 3.86E-42 |
| HSPA1A | NM 005345.5 | Heat shock 70 kDa
protein 1A | −4.10938341 | 0 |
| EMR1 | NM 001256255.1 | EGF-like module
containing, mucin-like, hormone receptor-like 1 | −4.046957637 | 0 |
| SKP2 | NM 001243120.1 | S-phase
kinase-associated protein 2, E3 ubiquitin protein ligase | −3.898911693 | 0 |
| PDE5A | NM 001083.3 | Phosphodiesterase
5A, cGMP-specific | −3.855490571 | 0 |
| CD70 | NM 001252.3 | CD70 molecule | −3.819833892 | 0 |
| CFI | NM 000204.3 | Complement factor
I | −3.766459211 | 5.14012E-09 |
| LIMS3 | NM 033514.4 | LIM and senescent
cell antigen-like domains 3 | −3.651045231 | 0 |
| SSX3 | NM 021014.2 | Synovial sarcoma, X
breakpoint 3 | −3.618755791 | 0 |
| IFITM1 | NM 003641.3 | Interferon-induced
transmembrane protein 1 | −3.525679252 | 3.07E-22 |
| KIF20A | NM 005733.2 | Kinesin family
member 20A | −3.419799073 | 0 |
| SSX1 | NM 005635.2 | Synovial sarcoma, X
breakpoint 1 | −3.419729777 | 2.21E-35 |
| HLA-DRB1 | NM 002124.3 | Major
histocompatibility complex, class II, DR β 1 | −3.405215808 | 8.44E-18 |
| BTN3A2 | NM 001197247.1 | Butyrophilin,
subfamily 3, member A2 | −3.397469936 | 2.41E-38 |
| SERPINA5 | NM 000624.5 | Serpin peptidase
inhibitor, clade A, member 5 | −3.39163364 | 7.73E-36 |
| CA12 | NM 206925.1 | Carbonic anhydrase
XII | −3.389182356 | 3.73E-24 |
| TCAM1P | NR 002947.2 | Testicular cell
adhesion molecule 1, pseudogene | −3.373389711 | 1.8E-36 |
| S vs. SV
upregulated |
| NOP56 | NR 027700.2 | NOP56
ribonucleoprotein | 3.826358 | 0 |
| BST1 | NM 004334.2 | Bone marrow stromal
cell antigen 1 | 3.284546 | 0 |
| MMP3 | NM 002422.3 | Matrix
metallopeptidase 3 | 2.436151 | 0 |
| PTPRB | NM 001206972.1 | Protein tyrosine
phosphatase, receptor type, B | 2.425614 | 4.99E-35 |
| PHYHD1 | NM 001100877.1 | Phytanoyl-CoA
dioxygenase domain containing 1 | 2.201466 | 7.67E-31 |
| HBD | NM 000519.3 | Hemoglobin, δ | 2.16615 | 5.78E-35 |
| PTPRR | NM 001207016.1 | Protein tyrosine
phosphatase, receptor type, R | 1.895908 | 2.74E-32 |
| MAVS | NM 001206491.1 | Mitochondrial
antiviral signaling protein | 1.864901 | 8.41E-45 |
| NGF | NM 002506.2 | Nerve growth factor
(β polypeptide) | 1.864624 | 9.83E-28 |
| CDH13 | NM 001220490.1 | Cadherin 13,
H-cadherin (heart) | 1.847737 | 2.15E-30 |
| HSPA12A | NM 025015.2 | Heat shock 70 kDa
protein 12A | 1.790451 | 1.94E-23 |
| CTAG1B | NM 001327.2 | Cancer/testis
antigen 1B | 1.739519 | 5.56E-18 |
| AK5 | NM 174858.2 | Adenylate kinase
5 | 1.691767 | 4.62E-28 |
| OR6F1 | NM 001005286.1 | Olfactory receptor,
family 6, subfamily F, member 1 | 1.68494 | 2.46E-15 |
| CDH13 | NM 001220490.1 | Cadherin 13,
H-cadherin (heart) | 1.657027 | 9.68E-28 |
| PHYHD1 | NM 001100877.1 | Phytanoyl-CoA
dioxygenase domain containing 1 | 1.650218 | 5.27E-23 |
| KRT15 | NM 002275.3 | Keratin 15 | 1.645917 | 1.26E-24 |
| RFX8 | NM 001145664.1 | RFX family member
8, lacking RFX DNA binding domain | 1.633169 | 7.81E-13 |
| SIGLEC15 | NM 213602.2 | Sialic acid binding
Ig-like lectin 15 | 1.620068 | 1.14E-23 |
| QKI | NM 206855.2 | QKI, KH domain
containing, RNA binding | 1.613219543 | 6.66E-16 |
| S vs. SV
Downregulated |
| NNMT | NM 006169.2 | Nicotinamide
N-methyltransferase | −6.370382878 | 0 |
| HLA-DRB1 | NM 002124.3 | Major
histocompatibility complex, class II, DR β 1 | −4.621376308 | 0 |
| MAGEC2 | NM 016249.3 | Melanoma antigen
family C, 2 | −4.325342586 | 0 |
| CSAG1 | NM 001102576.1 |
Chondrosarcoma-associated gene 1 | −3.583955305 | 7.57E-44 |
| SERPINA5 | NM 000624.5 | Serpin peptidase
inhibitor, clade A, member 5 | −3.57076951 | 0 |
| EMR1 | NM 001256255.1 | EGF-like module
containing, mucin-like, hormone receptor-like 1 | −3.456673039 | 0 |
| PSMB9 | NM 002800.4 | Proteasome
(prosome, macropain) subunit, β type, 9 | −3.165976101 | 0 |
| CFI | NM 000204.3 | Complement factor
I | −3.134811326 | 0 |
| PAGE2 | NM 207339.2 | P-antigen family,
member 2 (prostate-associated) | −3.072286145 | 0 |
| CSAG1 | NM 001102576.1 |
Chondrosarcoma-associated gene 1 | −2.848947621 | 5.84154E-07 |
| SSX3 | NM 021014.2 | Synovial sarcoma, X
breakpoint 3 | −2.753083201 | 1.24441E-09 |
| HLA-F | NM 001098478.1 | Major
histocompatibility complex, class I, F | −2.715218223 | 0 |
| BEX1 | NM 018476.3 | Brain expressed,
X-linked 1 | −2.707527614 | 0 |
| IL1A | NM 000575.3 | Interleukin 1,
α | −2.691634361 | 0 |
| PDGFRB | NM 002609.3 | Platelet-derived
growth factor receptor, β polypeptide | −2.673687033 | 6.05E-19 |
| NUPR1 | NM 001042483.1 | Nuclear protein,
transcriptional regulator, 1 | −2.651204064 | 3.01E-41 |
| QPRT | NM 014298.3 | Quinolinate
phosphoribosyltransferase | −2.59989928 | 0 |
| PDE5A | NM 001083.3 | Phosphodiesterase
5A, cGMP-specific | −2.568004867 | 2.56E-33 |
| NDRG2 | NM 201541.1 | NDRG family member
2 | −2.525792745 | 2.63E-28 |
| CD70 | NM 001252.3 | CD70 molecule | −2.489739686 | 0 |
Validation of gene expression results by
RT-PCR
To validate the gene expression profile results, 4
DEGs (FOXA2, SERPIND1, BDKRD1 and IL1A) were selected for RT-PCR
analysis verification (Fig. 4A).
Generally, the trends for upregulation or downregulation of the
DEGs by real-time PCR analysis were consistent with those of the
DEG expression profiling analysis, confirming the reliability of
the microarray results.
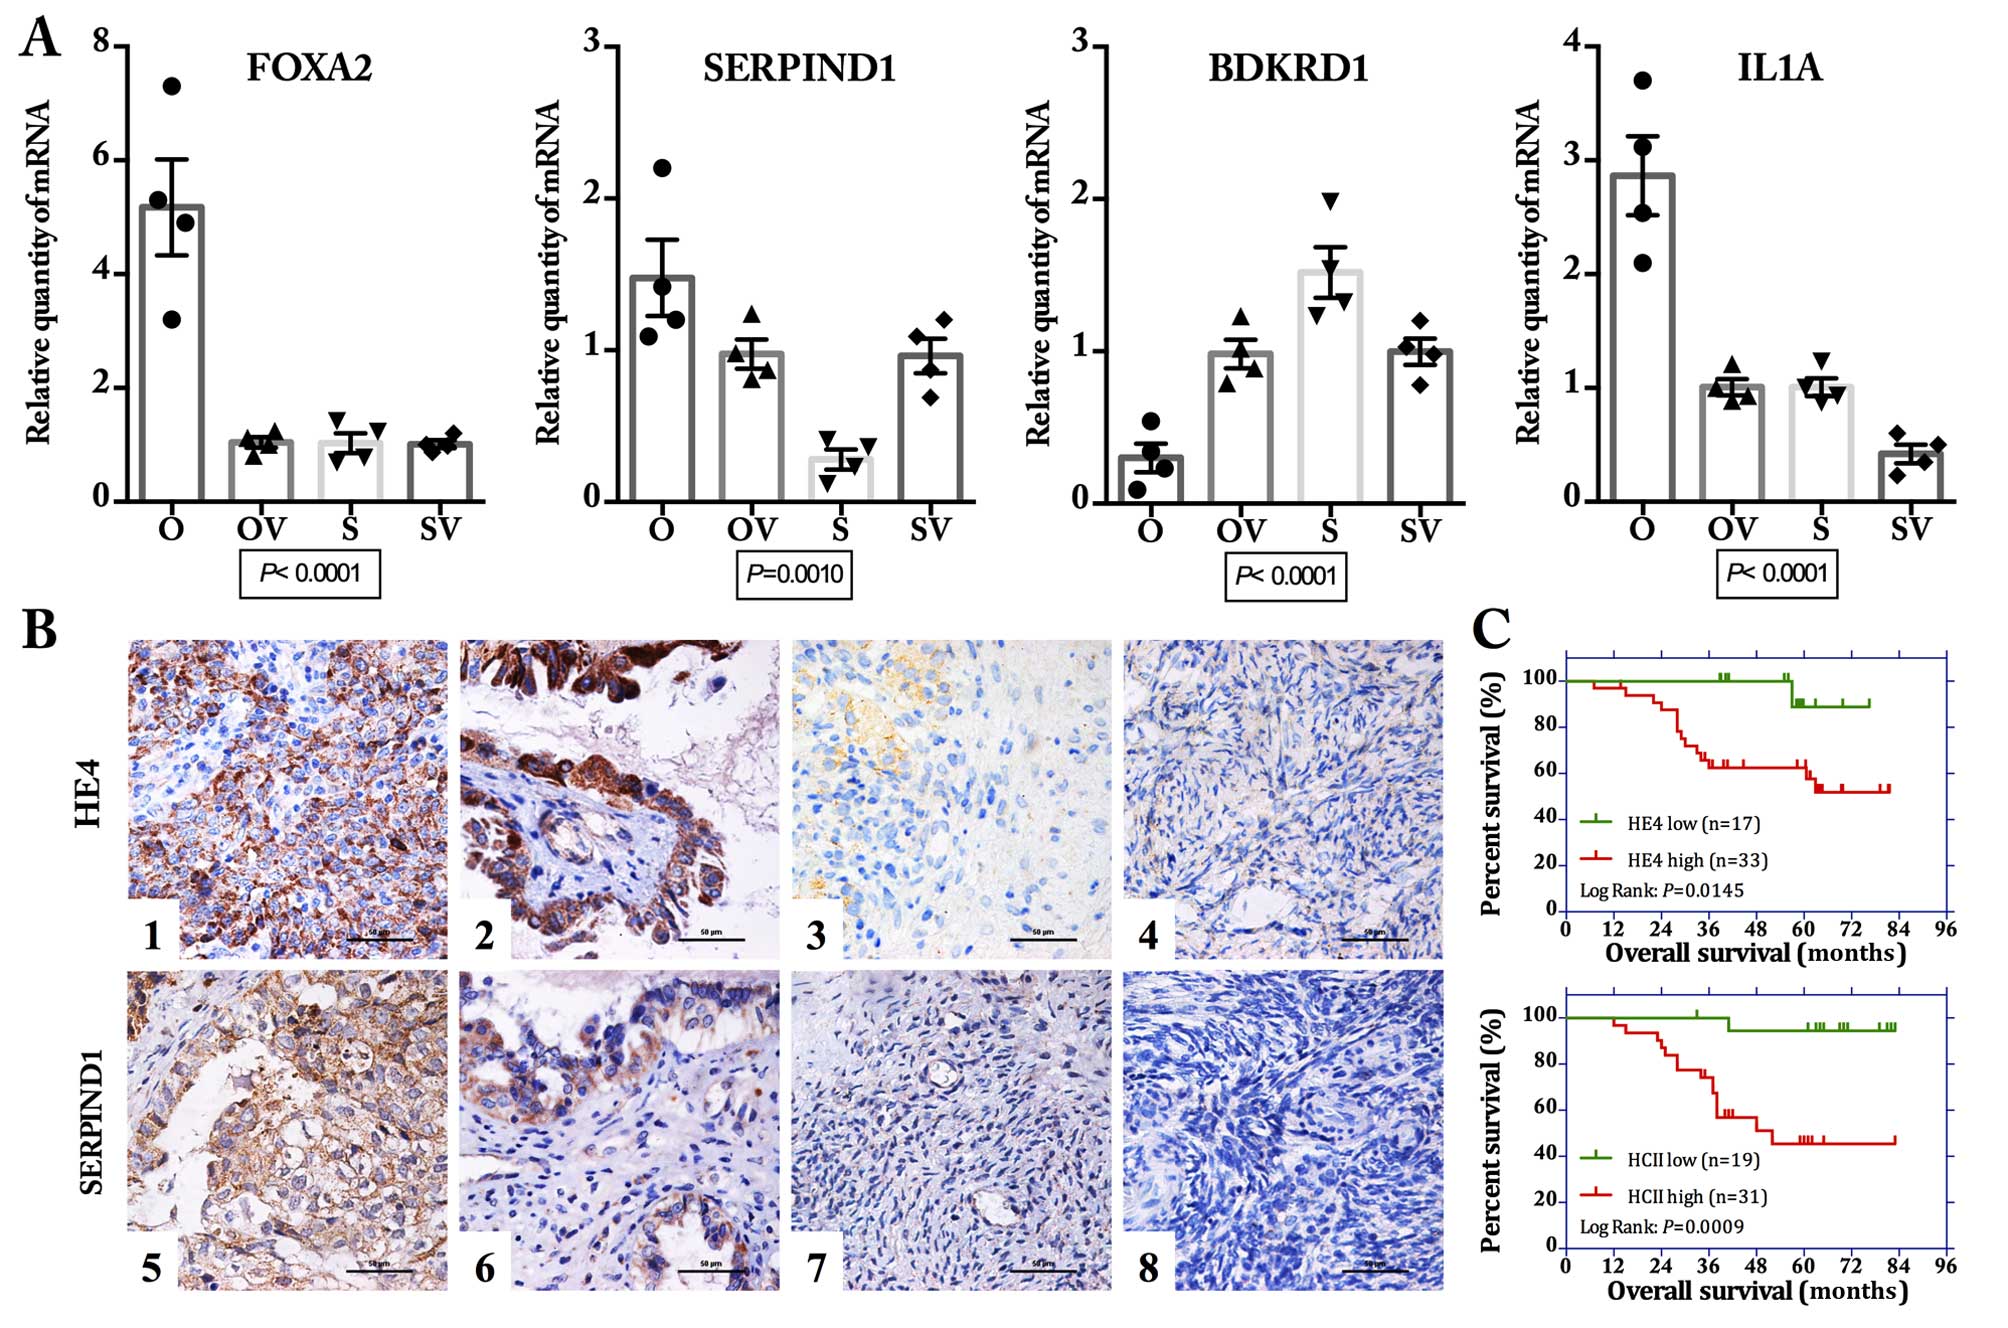 | Figure 4Validation of the differentially
expressed genes. (A) Quantitative real-time PCR revealed that the
mRNA expression levels of 4 selected genes (FOXA2,
SERPIND1, BDKRD1 and IL1A) showed obvious
difference among the 4 ovarian cancer cell lines (O, OV, S and SV)
(all P<0.01, one-way ANOVA). (B) Immunohistochemical (IHC)
staining for SERPIND1 showed a similar expression pattern with that
of HE4 in the ovarian tissue samples. Representative images of IHC
staining: ovarian malignant tumor (1 and 5), borderline tumor (2
and 6), benign tumor (3 and 7), and normal ovarian tissue (4 and 8)
for staining of HE4 (1–4) and SERPIND1 (5–8). Scale
bar, 50 μm. (C) Kaplan-Meier survival analysis showed that
both high expression of HE4 and SERPIND1 were significantly
correlated with poor overall survival for these 50 patients with
ovarian malignant tumors (log-rank: P=0.0145 and 0.009 for HE4 and
SERPIND1, respectively). OV, HE4-H-vector; O, HE4-H; SV,
HE4-L-vector; S, HE4-L cells. |
Validation of protein expression by
IHC
Similar to HE4, the expression of SERPIND1 was
mainly located on the membrane and in the cytoplasm (Fig. 4B). The positive expression rates of
SERPIND1 in malignant, borderline, benign and normal ovarian
tissues were 88, 62.96, 20 and 13.33%, respectively (Table III). Malignant groups displayed
the highest positive expression and was significantly higher than
the rate of the borderline (P=0.010), whereas the positive
expression rate in the borderline groups was markedly higher than
that in the benign groups (P=0.008). In general, the expression
pattern of SERPIND1 was similar to that of HE4 (up to 74.8%). Among
the 50 cases of ovarian cancer samples, a total of 37 cases
simultaneously showed positive expression of both HE4 and SERPIND1
and 4 cases showed both negative expression (Table IV). Spearman correlation analysis
revealed that the expression of SERPIND1 and HE4 was positively
correlated (R=0.402, P=0.003). Survival analysis revealed that high
expression levels of both HE4 and SERPIND1 were significantly
correlated with poor prognosis (Kaplan-Meier analysis, log-rank,
P=0.0145 and P=0.0009 as to OS; Fig.
4C, respectively).
| Table IIIExpression of HE4 and HCII in
different ovarian tissues. |
Table III
Expression of HE4 and HCII in
different ovarian tissues.
| Groups | Cases | HE4
| HCII
|
|---|
| − | + | ++ | +++ | Positive cases | Positive rate
(%) | − | + | ++ | +++ | Positive cases | Positive rate
(%) |
|---|
| Malignant | 50 | 11 | 6 | 16 | 17 | 39 | 78a | 6 | 13 | 12 | 19 | 44 | 88c |
| Borderline | 27 | 12 | 5 | 6 | 4 | 15 |
55.56b | 10 | 6 | 6 | 5 | 17 |
62.96c |
| Benign | 15 | 12 | 3 | 0 | 0 | 3 | 20 | 12 | 1 | 1 | 1 | 3 | 20 |
| Normal | 15 | 15 | 0 | 0 | 0 | 0 | 0 | 13 | 2 | 0 | 0 | 2 | 13.33 |
| Table IVRelevance of HE4 and HCII expression
in ovarian cancer samples. |
Table IV
Relevance of HE4 and HCII expression
in ovarian cancer samples.
| HE4 | HCII
| Total |
|---|
| Negative | Positive |
|---|
| Negative | 4 | 7 | 11 |
| Positive | 2 | 37 | 39 |
| Total | 6 | 44 | 50 |
GO function analysis and canonical
pathway result of DEGs
GO analysis showed that all the DEGs in the
different groups were predominantly involved in molecular function
(MF), biological process (BP) and cellular component (CC), as shown
in Table V. Canonical pathway
analysis demonstrated that a total of 39 pathways were enriched in
O vs. OV, and 50 pathways in S vs. SV. The top 20 pathways are
shown in Table VI, such as MAPK
signaling pathway, pathway in cancer and P53 signaling pathway in O
vs. OV and focal adhesion, pathway in cancer and cell adhesion
molecules (CAMs) in S vs. SV.
| Table VGO enrichment analysis for
differentially expressed genes (DEGs). |
Table V
GO enrichment analysis for
differentially expressed genes (DEGs).
| GO terms | Genes in gene
set | Genes in
overlap | P-value | FDR q-value |
|---|
| Molecular
function |
| (Top 10 in O vs.
OV) |
| Enzyme
binding | 178 | 15 | 1.12E-09 | 2.62E-07 |
| Transcription
factor binding | 307 | 19 | 1.32E-09 | 2.62E-07 |
| DNA binding | 602 | 26 | 2.92E-09 | 3.86E-07 |
| Transcription
repressor activity | 152 | 12 | 1.07E-07 | 1.06E-05 |
| Transcription
cofactor activity | 228 | 14 | 2.16E-07 | 1.71E-05 |
| Receptor
binding | 377 | 17 | 8.97E-07 | 5.92E-05 |
| Receptor
activity | 583 | 20 | 6.62E-06 | 3.62E-04 |
| Transcription
corepressor activity | 94 | 8 | 8.23E-06 | 3.62E-04 |
| Transcription
factor activity | 354 | 15 | 8.24E-06 | 3.62E-04 |
| Transmembrane
receptor activity | 418 | 16 | 1.47E-05 | 5.81E-04 |
| (Top 10 in S vs.
SV) |
| Receptor
activity | 583 | 20 | 6.29E-08 | 2.49E-05 |
| Phosphoric ester
hydrolase activity | 153 | 10 | 4.64E-07 | 9.18E-05 |
| Transmembrane
receptor activity | 418 | 15 | 1.63E-06 | 1.57E-04 |
| Peptidase
activity | 176 | 10 | 1.67E-06 | 1.57E-04 |
| Hydrolase activity
acting on ester bonds | 269 | 12 | 1.98E-06 | 1.57E-04 |
| Endopeptidase
activity | 117 | 8 | 4.71E-06 | 3.02E-04 |
| Enzyme inhibitor
activity | 119 | 8 | 5.35E-06 | 3.02E-04 |
| Protein kinase
binding | 62 | 6 | 1.02E-05 | 5.04E-04 |
| Protein kinase
regulator activity | 39 | 5 | 1.42E-05 | 6.24E-04 |
| Kinase
binding | 70 | 6 | 2.06E-05 | 8.15E-04 |
| Cell cycle GO
0007049 | 315 | 22 | 6.29E-12 | 6.49E-10 |
| Cell proliferation
GO 0008283 | 513 | 27 | 1.85E-11 | 1.53E-09 |
| Protein metabolic
process | 1,231 | 43 | 1.85E-11 | 1.53E-09 |
| Cellular
component |
| (Top 10 in O vs.
OV) |
| Nucleus | 1,430 | 54 | 6.66E-15 | 1.55E-12 |
| Cytoplasm | 2,131 | 62 | 4.27E-12 | 4.97E-10 |
| Extracellular
region | 447 | 23 | 9.06E-10 | 7.04E-08 |
| Membrane | 1,994 | 53 | 1.65E-09 | 9.64E-08 |
| Extracellular
region part | 338 | 19 | 6.40E-09 | 2.84E-07 |
| Membrane part | 1,670 | 46 | 7.31E-09 | 2.84E-07 |
| Extracellular
space | 245 | 16 | 1.25E-08 | 4.15E-07 |
| Intracellular non
membrane bound organelle | 631 | 25 | 3.19E-08 | 8.25E-07 |
| Non membrane bound
organelle | 631 | 25 | 3.19E-08 | 8.25E-07 |
| Nuclear part | 579 | 22 | 4.33E-07 | 9.83E-06 |
| (Top 10 in S vs.
SV) |
| Membrane | 1,994 | 53 | 1.55E-14 | 3.62E-12 |
| Membrane part | 1,670 | 43 | 1.65E-11 | 1.30E-09 |
| Extracellular
region | 447 | 22 | 1.67E-11 | 1.30E-09 |
| Cytoplasm | 2,131 | 49 | 3.02E-11 | 1.76E-09 |
| Intrinsic to
membrane | 1,348 | 36 | 3.14E-10 | 1.46E-08 |
| Plasma
membrane | 1,426 | 37 | 3.87E-10 | 1.50E-08 |
| Integral to
membrane | 1,330 | 35 | 8.24E-10 | 2.74E-08 |
| Extracellular
region part | 338 | 15 | 1.12E-07 | 3.27E-06 |
| Plasma membrane
part | 1,158 | 28 | 2.44E-07 | 6.32E-06 |
| Nucleus | 1,430 | 29 | 4.89E-06 | 1.05E-04 |
| Biological
process |
| (Top 10 in O vs.
OV) |
| Biopolymer
metabolic process | 1,684 | 63 | 0.00E+00 | 0.00E+00 |
| Programmed cell
death | 432 | 31 | 1.11E-16 | 3.05E-14 |
| Apoptosis GO | 431 | 31 | 1.11E-16 | 3.05E-14 |
| Cell
development | 577 | 34 | 1.67E-15 | 3.43E-13 |
| Nucleobase
nucleoside nucleotide and nucleic acid metabolic process | 1,244 | 49 | 7.66E-15 | 1.26E-12 |
| Multicellular
organismal development | 1,049 | 41 | 1.74E-12 | 2.39E-10 |
| Response to
stress | 508 | 28 | 2.62E-12 | 3.08E-10 |
| Cell cycle GO
0007049 | 315 | 22 | 6.29E-12 | 6.49E-10 |
| Cell proliferation
GO 0008283 | 513 | 27 | 1.85E-11 | 1.53E-09 |
| Protein metabolic
process | 1,231 | 43 | 1.85E-11 | 1.53E-09 |
| (Top 10 in S vs.
SV) |
| Signal
transduction | 1,634 | 45 | 5.53E-13 | 4.57E-10 |
| Multicellular
organismal development | 1,049 | 34 | 6.25E-12 | 2.58E-09 |
| Response to
chemical stimulus | 314 | 17 | 8.24E-10 | 1.99E-07 |
| Anatomical
structure development | 1,013 | 30 | 9.64E-10 | 1.99E-07 |
| System
development | 861 | 27 | 2.05E-09 | 2.91E-07 |
| Nucleobase
nucleoside nucleotide and nucleic acid metabolic process | 1,244 | 33 | 2.12E-09 | 2.91E-07 |
| Biopolymer
metabolic process | 1,684 | 39 | 3.07E-09 | 3.62E-07 |
| Negative
regulation of biological process | 677 | 23 | 7.63E-09 | 7.87E-07 |
| Negative
regulation of cellular process | 646 | 22 | 1.56E-08 | 1.43E-06 |
| Immune
response | 235 | 13 | 6.34E-08 | 5.23E-06 |
| Table VICanonical pathway analysis in the
differentially expressed genes (DEGs). |
Table VI
Canonical pathway analysis in the
differentially expressed genes (DEGs).
| Pathways | Genes in gene
set | Genes in
overlap | P-value | FDR q-value | Gene symbols |
|---|
| O vs. OV overlap
pathways |
| KEGG MAPK
signaling pathway | 267 | 21 | 1.99E-12 | 7.46E-10 | TP53,
FGF2, FGF1, FGF5, NFKB2,
GADD45A, HSPA1A, RPS6KA1, IL1A,
IL1R1, HSPA1B, HSPA2, HSPA8,
DUSP1, MAP3K6, DDIT3, JUND,
DUSP4, DUSP5, RELB, STMN1 |
| KEGG steroid
biosynthesis | 17 | 8 | 3.70E-12 | 7.46E-10 | CYP27B1,
DHCR24, DHCR7, EBP, FDFT1, LSS,
SQLE, TM7SF2 |
| KEGG pathways in
cancer | 328 | 21 | 9.60E-11 | 1.29E-08 | TP53,
FGF2, FGF1, FGF5, NFKB2, CDKN1A,
SKP2, CASP9, HIF1A, BMP2, BMP4,
SMO, FZD4, FZD7, RAD51, PTGS2,
LAMC2, RARB, DAPK2, MSH6,
BCR |
| KEGG cell
cycle | 128 | 12 | 1.57E-08 | 1.58E-06 | TP53,
GADD45A, CDKN1A, SKP2, PCNA,
CDC25C, MCM2, MCM3, MCM5,
CDKN2C, SMC1A, SMC3 |
| Biocarta caspase
pathway | 23 | 6 | 1.28E-07 | 8.59E-06 | CASP9,
DFFB, LMNA, LMNB1, CASP2,
CASP6 |
| Biocarta p53
hypoxia pathway | 23 | 6 | 1.28E-07 | 8.59E-06 | TP53,
GADD45A, HSPA1A, CDKN1A, HIF1A,
NFKBIB |
| Biocarta p53
pathway | 16 | 5 | 5.52E-07 | 3.18E-05 | TP53,
GADD45A, CDKN1A, PCNA, TIMP3 |
| KEGG p53 signaling
pathway | 69 | 8 | 7.81E-07 | 3.94E-05 | TP53,
GADD45A, CDKN1A, CASP9, RRM2,
GTSE1, PMAIP1, SESN2 |
| Biocarta G2
pathway | 24 | 5 | 5.00E-06 | 2.24E-04 | TP53,
GADD45A, RPS6KA1, CDKN1A, CDC25C |
| KEGG basal cell
carcinoma | 55 | 6 | 2.75E-05 | 1.11E-03 | TP53,
BMP2, BMP4, SMO, FZD4, FZD7 |
| Biocarta MCM
pathway | 18 | 4 | 3.55E-05 | 1.15E-03 | MCM2,
MCM3, MCM5, CDT1 |
| KEGG cytokine
cytokine receptor interaction | 267 | 12 | 3.70E-05 | 1.15E-03 | IL1A,
IL1R1, BMP2, IL12A, INHBA, IL11,
CCL2, CXCL2, CXCL3, CXCL5, LIF,
IL24 |
| Biocarta HIVNEF
pathway | 58 | 6 | 3.73E-05 | 1.15E-03 | CASP9,
DFFB, LMNA, LMNB1, CASP2,
CASP6 |
| KEGG DNA
replication | 36 | 5 | 3.99E-05 | 1.15E-03 | PCNA,
MCM2, MCM3, MCM5, POLE2 |
| Biocarta ATM
pathway | 20 | 4 | 5.53E-05 | 1.49E-03 | TP53,
GADD45A, CDKN1A, RAD51 |
| KEGG complement
andcoagulation cascades | 69 | 6 | 1.00E-04 | 2.52E-03 | PLAU,
BDKRB1, CFI, PLAUR, SERPINA1,
SERPINA5 |
| Biocarta TNFR1
pathway | 29 | 4 | 2.51E-04 | 5.95E-03 | DFFB,
LMNA, LMNB1, CASP2 |
| Biocarta FAS
pathway | 30 | 4 | 2.87E-04 | 6.29E-03 | DFFB,
LMNA, LMNB1, CASP6 |
| KEGG small cell
lung cancer | 84 | 6 | 2.96E-04 | 6.29E-03 | TP53,
SKP2, CASP9, PTGS2, LAMC2,
RARB |
| KEGG
apoptosis | 88 | 6 | 3.81E-04 | 7.66E-03 | TP53,
IL1A, IL1R1, CASP9, DFFB,
CASP6 |
| S vs. SV overlap
pathways |
| KEGG focal
adhesion | 201 | 15 | 9.86E-11 | 3.97E-08 | PDGFRB,
PIK3CD, PIK3R3, AKT3, LAMA3,
LAMA1, PDGFD, ITGB5, THBS1,
COL1A1, COL5A1, COL6A1, COL6A3,
VASP, FYN |
| KEGG pathways in
cancer | 328 | 15 | 7.61E-08 | 1.02E-05 | PDGFRB,
PIK3CD, PIK3R3, AKT3, LAMA3,
LAMA1, E2F2, FGF2, FGF13, KIT,
KITLG, MMP2, DAPK2, ARNT2,
FZD7 |
| KEGG complement
and coagulation cascades | 69 | 8 | 8.04E-08 | 1.02E-05 | BDKRB1,
PLAU, F3, CD46, CFH, CFI,
SERPINA5, SERPIND1 |
| KEGG melanoma | 71 | 8 | 1.01E-07 | 1.02E-05 | PDGFRB,
PIK3CD, PIK3R3, AKT3, PDGFD,
E2F2, FGF2, FGF13 |
| KEGG cytokine
cytokine receptor interaction | 267 | 13 | 2.77E-07 | 2.23E-05 | PDGFRB,
KIT, KITLG, IL1A, IL7R, IL4R,
IL12A, IFNAR1, CCL5, CCL20,
CXCL5, TNFSF12, TNFSF4 |
| KEGG ECM receptor
interaction | 84 | 8 | 3.78E-07 | 2.54E-05 | LAMA3,
LAMA1, ITGB5, THBS1, COL1A1,
COL5A1, COL6A1, COL6A3 |
| KEGG hematopoietic
cell lineage | 88 | 7 | 6.88E-06 | 3.74E-04 | KIT,
KITLG, IL1A, IL7R, IL4R, MME,
CD9 |
| KEGG prostate
cancer | 89 | 7 | 7.42E-06 | 3.74E-04 | PDGFRB,
PIK3CD, PIK3R3, AKT3, PDGFD,
E2F2, CREB3L1 |
| KEGG regulation of
actin cytoskeleton | 216 | 10 | 1.03E-05 | 4.59E-04 | PDGFRB,
PIK3CD, PIK3R3, PDGFD, ITGB5,
FGF2, FGF13, BDKRB1, ITGB2,
GSN |
| KEGG cell adhesion
CAMs molecules | 134 | 8 | 1.28E-05 | 5.16E-04 | ITGB2,
HLA-C, HLA-DPA1, HLA-F, JAM2,
NCAM1, ALCAM, PVR |
| KEGG type I
diabetes mellitus | 44 | 5 | 2.59E-05 | 9.49E-04 | IL1A,
IL12A, HLA-C, HLA-DPA1, HLA-F |
| KEGG
leukocytetransendothelial migration | 118 | 7 | 4.66E-05 | 1.57E-03 | PIK3CD,
PIK3R3, VASP, MMP2, ITGB2, JAM2,
NCF2 |
| KEGG small cell
lung cancer | 84 | 6 | 5.81E-05 | 1.80E-03 | PIK3CD,
PIK3R3, AKT3, LAMA3, LAMA1,
E2F2 |
| KEGG natural
killer cell-mediated cytotoxicity | 137 | 7 | 1.20E-04 | 3.44E-03 | PIK3CD,
PIK3R3, FYN, IFNAR1, ITGB2,
HLA-C, SH2D1B |
| KEGG prion
diseases | 35 | 4 | 1.69E-04 | 4.07E-03 | FYN,
IL1A, CCL5, NCAM1 |
| KEGG TOLL-like
receptor signaling pathway | 102 | 6 | 1.71E-04 | 4.07E-03 | PIK3CD,
PIK3R3, AKT3, IL12A, IFNAR1,
CCL5 |
| KEGG glioma | 65 | 5 | 1.72E-04 | 4.07E-03 | PDGFRB,
PIK3CD, PIK3R3, AKT3, E2F2 |
| KEGG allograft
rejection | 38 | 4 | 2.33E-04 | 5.23E-03 | IL12A,
HLA-C, HLA-DPA1, HLA-F |
| KEGG JAK-STAT
signaling pathway | 155 | 7 | 2.56E-04 | 5.43E-03 | PIK3CD,
PIK3R3, AKT3, IL7R, IL4R, IL12A,
IFNAR1 |
| KEGG leishmania
infection | 72 | 5 | 2.78E-04 | 5.60E-03 | IL1A,
IL12A, ITGB2, HLA-DPA1, NCF2 |
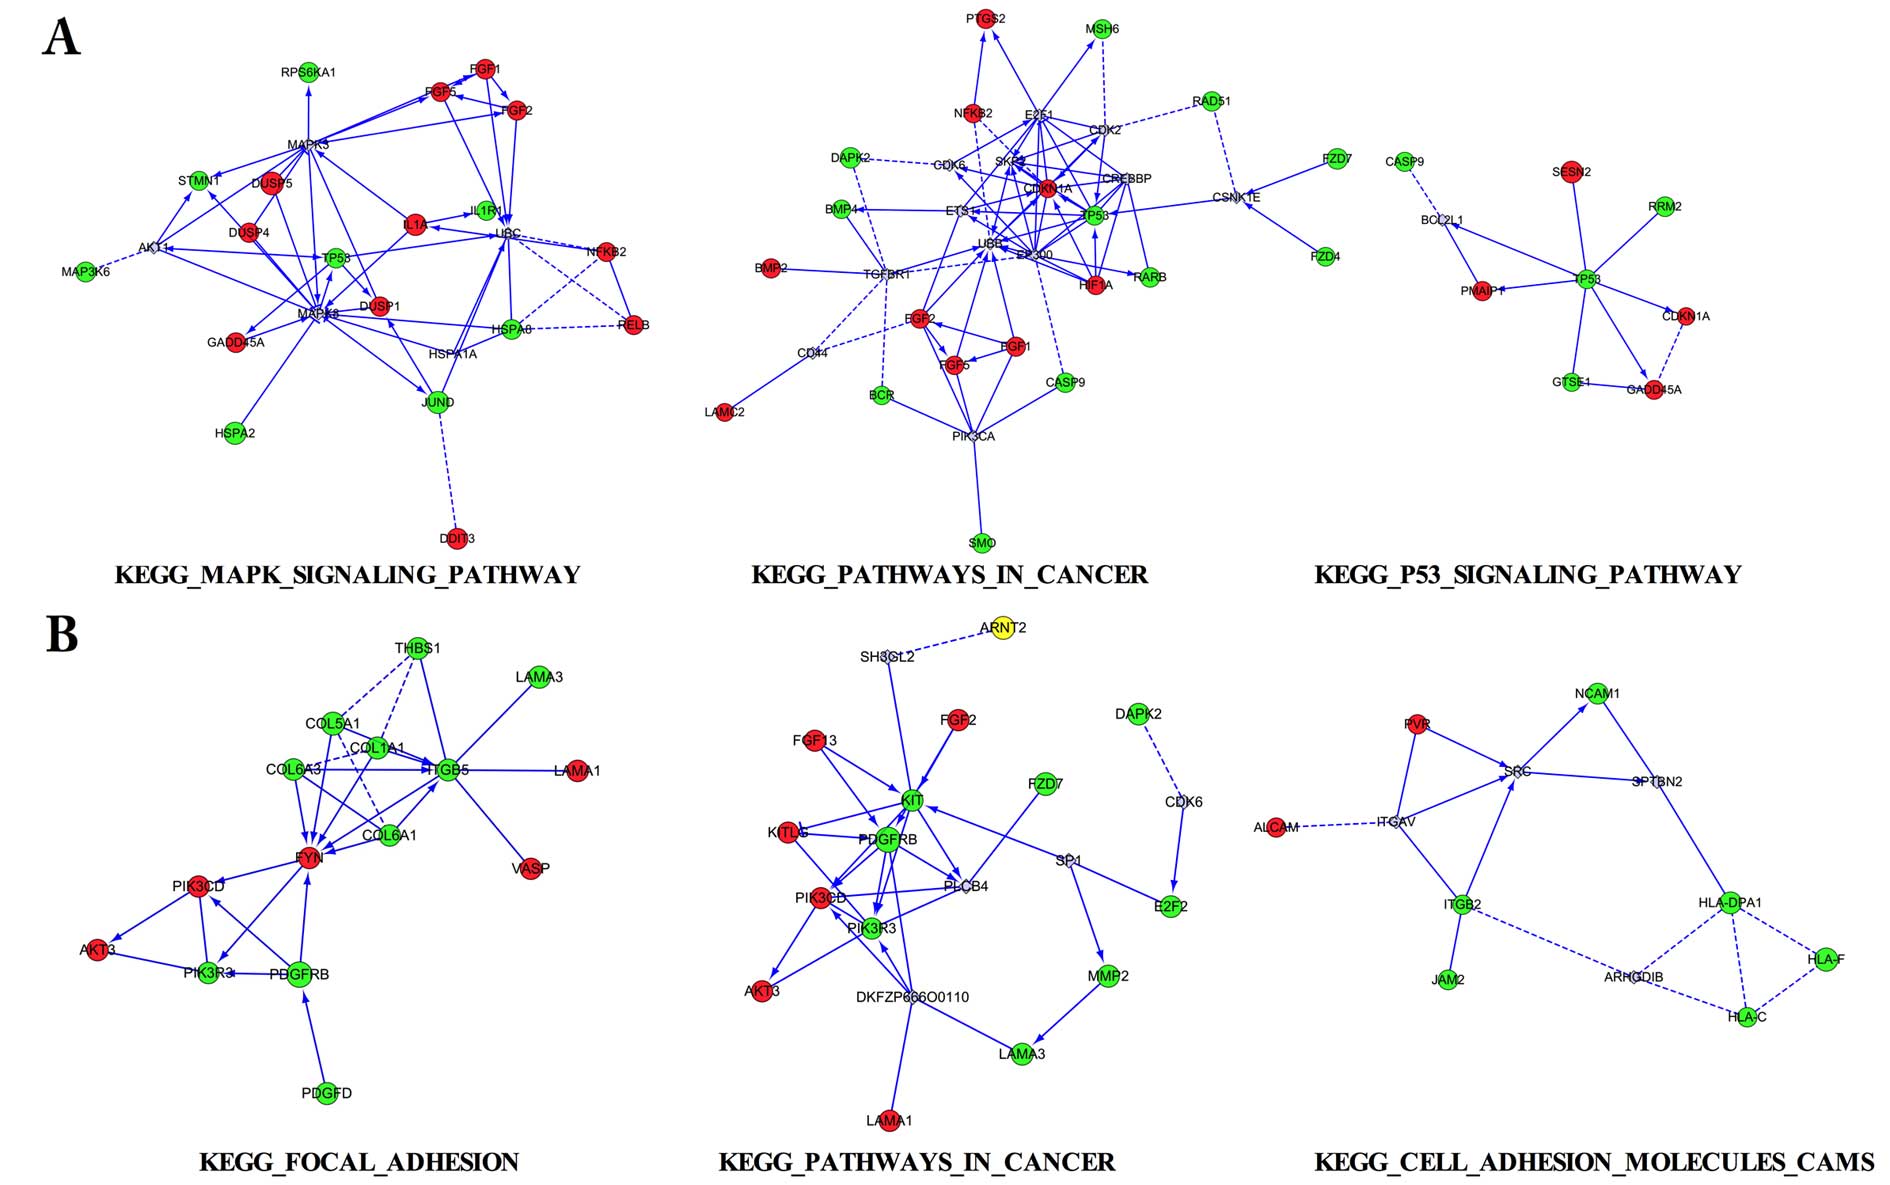
Interaction network for the DEGs
Three aforementioned pathways for the DEGs were
selected to conduct interaction network analysis in 2 pairs,
respectively (Fig. 5). Among the
interaction networks, various interaction genes were predicted,
such as MAPK3 and MAPK8 in MAPK signaling pathway, UBB and EP300 in
pathways in cancer, SRC in cell adhesion molecules (CAMs) pathway,
which appeared to be the connected predicted hub genes.
Discussion
The mortality rate of ovarian cancer patients ranks
first among all gynecological malignant tumors, and up to 75% of
diagnosed patients are already at an advanced stage. The early
detection of ovarian cancer is difficult due to its indefinite
symptoms in the early stage and lack of a specific marker;
meanwhile, a poor understanding of the mechanisms of oncogenesis
also impedes the development of new treatment modalities. In recent
years, HE4 has drawn extensive attention in the study of ovarian
cancer, due to its potential clinical application benefits for
early detection (5), discrimination
(6), better tumor cytoreductive
surgery (8), chemoresistance and
prognosis (9,11). Moreover, it was also reported to be
a reliable marker for early diagnosis of endometrial (12), lung (14) and pancreatic cancer (15). Thus, increasing research on the
clinical application of HE4 stimulated elucidation of the basic
mechanisms of its function. Unfortunately, relevant research is far
from enough. In the present study, by the use of human whole genome
microarray detection, we investigated the gene expression profile
in response to HE4 in epithelial ovarian cancer (EOC) cells. We
identify a total of 717 genes that were upregulated and 898 genes
that were downregulated in HE4-overexpressing cells vs. HE4-Mock
and 166 genes were upregulated and 285 were downregulated in the
HE4-silenced cells vs. HE4-Mock cells. Furthermore, an overlap of
16 genes was consistently upregulated and 8 genes downregulated in
response to HE4. The result was validated at the mRNA and protein
levels. GO and pathway enrichment analysis were applied. Multiple
pathways are involved, including KEGG MAPK signaling pathway, KEGG
steroid biosynthesis, and KEGG pathways in cancer. Finally,
interaction network plots were constructed and interactive genes
were predicted. The known functions of these genes can provide
novel ideas and breakthrough points for further research.
SERPIND1, also known as heparin co-factor II (HCII
or HC2), attracted our attention. HCII belongs to the serpin
superfamily and it is a serum glycoprotein that acts as a thrombin
inhibitor through interactions with heparin and other endogenous
glycosaminoglycans (26). Over the
past 3 decades, HCII has been intermittently studied as a protease
inhibitor. It can inhibit thrombin in atherosclerotic lesions where
thrombin can exert a proatherogenic inflammatory response (27). It has also been proposed to promote
angiogenesis in response to ischaemia (28). However, to date, the biological
effect of HCII on cancer occurrence and development is still
largely unknown, particularly in ovarian cancer. One group reported
that high HCII expression in tumor tissues was associated with
increased cancer recurrence and shorter OS in non-small cell lung
cancer (NSCLC) patients. HCII promoted cell motility, invasion
ability and filopodium dynamics in NSCLC cells partly through the
PI3K pathway (29). Recently, HCII
was found to be upregulated in the serum samples of B-cell acute
lymphoblastic leukemia (B-ALL) patients and it was identified as a
candidate biomarker for early diagnosis of B-ALL (30). In the present study, we found that
the positive expression rates of HCII in malignant, borderline,
benign and normal ovarian tissues were 88, 62.96, 20 and 13.33%,
respectively. The protein expression pattern of HCII was positively
related to that of HE4 (Spearman coefficient ratio, R=0.402,
P=0.003) and high expression of HCII was correlated with poor OS of
ovarian cancer patients. HCII may act as a potential oncogene in
the development of ovarian cancer. It seems to be the first study
on its potential function in the tumorigenesis of ovarian cancer
and sheds light on the possible application as a tumor biomarker or
therapeutic target along with HE4. However, further investigations
are needed to elucidate the underlying mechanism.
In our previous studies, we demonstrated that HE4
enhanced the proliferation, invasion and metastasis of ovarian
cancer (20) partially via the
interaction of Annexin A2 (23),
and fucoglycosylation may increase this effect (24,31). A
similar phenomenon was also noted in others studies (18,19,21),
even in endometrial (32,33) and pancreatic cancer (33). Nevertheless, the underlying
mechanisms of these phenomena warrant more discussion. One group
reported that the expression of HE4 is associated with cell
adhesion, migration and tumor growth via the activation of the
EGFR-MAPK signaling pathway (18)
in ovarian cancer cells. However, another group reported a
controversial finding that HE4 may play a protective role in the
progression of ovarian cancer by inhibiting cell proliferation,
whereas they also speculated that this effect may be regulated by
MAPK and PI3K/Akt signaling pathway. As to the influence of HE4 on
the chemotherapeutic resistance in ovarian cancer, our previous
study noted that the recombinant HE4 protein could repress
carboplatin-induced apoptosis in ovarian cancer cells (22). Another group reported that HE4
overexpression promoted chemoresistance against cisplatin in an
animal model leading to reduced survival rates (19). They further demonstrated that tumor
microenvironment constituents participated in the modulation of
HE4, in which HE4 could interact with EGFR, IGF1R and transcription
factor HIF1α, inducing the nuclear translocation of HE4 to promote
aggressive and chemoresistant disease and denote poor prognosis for
ovarian cancer patients (19).
Recently, a group reported that recombinant HE4 protein increased
the mRNA and protein levels of cell cycle marker PCNA and cell
cycle inhibitor p21 in endometrial and pancreatic cancer cell
lines, indicating that HE4 function may be mediated by the
p21-CDK-Rb pathway (33). In the
present study, we presented the results for the possible pathways
HE4 may enrich, including MAPK, steroid biosynthesis, cell cycle,
p53 hypoxia pathway, focal adhesion, ECM receptor interaction, and
cell adhesion molecules (CAMs). To the best of our knowledge, this
is the first study to provide the most detailed, full-scale and
fundamental data for the DEGs in response to HE4, thus laying the
basis for further investigation on the underlying mechanisms of HE4
in ovarian cancer. More comprehensive and in-depth studies are
needed, to provide more evidence for the development of novel drugs
and therapeutic strategies selectively targeting HE4 in ovarian
cancer.
Collectively, the present study analyzed the gene
expression profile in response to HE4 in EOC cells. The identified
DEGs are valuable to determine the underlying mechanism of HE4 in
cancer, providing new views for the comprehensive study of ovarian
cancer treatment. Prospective investigations using the identified
DEGs are required to further elucidate the mechanisms of the
tumorgenesis and development of ovarian cancer.
Acknowledgments
The present study was supported by the National
Natural Science Foundation of China (grant nos. 81172491, 81101527,
81472437 and 81402129), the Education Department Doctor Project
Fund (grant nos. 20112104110016 and 20112104120019), and the
Outstanding Scientific Fund of Shengjing Hospital (grant no.
201303).
References
|
1
|
Siegel RL, Miller KD and Jemal A: Cancer
statistics, 2016. CA Cancer J Clin. 66:7–30. 2016. View Article : Google Scholar : PubMed/NCBI
|
|
2
|
Pliarchopoulou K and Pectasides D:
Epithelial ovarian cancer: Focus on targeted therapy. Crit Rev
Oncol Hematol. 79:17–23. 2011. View Article : Google Scholar
|
|
3
|
Schummer M, Ng WV, Bumgarner RE, Nelson
PS, Schummer B, Bednarski DW, Hassell L, Baldwin RL, Karlan BY and
Hood L: Comparative hybridization of an array of 21,500 ovarian
cDNAs for the discovery of genes overexpressed in ovarian
carcinomas. Gene. 238:375–385. 1999. View Article : Google Scholar : PubMed/NCBI
|
|
4
|
Cornwall GA, von Horsten HH, Swartz D,
Johnson S, Chau K and Whelly S: Extracellular quality control in
the epididymis. Asian J Androl. 9:500–507. 2007. View Article : Google Scholar : PubMed/NCBI
|
|
5
|
Karlsen MA, Høgdall EV, Christensen IJ,
Borgfeldt C, Kalapotharakos G, Zdrazilova-Dubska L, Chovanec J, Lok
CA, Stiekema A, Mutz-Dehbalaie I, et al: A novel diagnostic index
combining HE4, CA125 and age may improve triage of women with
suspected ovarian cancer - An international multicenter study in
women with an ovarian mass. Gynecol Oncol. 138:640–646. 2015.
View Article : Google Scholar : PubMed/NCBI
|
|
6
|
Romagnolo C, Leon AE, Fabricio AS,
Taborelli M, Polesel J, Del Pup L, Steffan A, Cervo S, Ravaggi A,
Zanotti L, et al: HE4, CA125 and risk of ovarian malignancy
algorithm (ROMA) as diagnostic tools for ovarian cancer in patients
with a pelvic mass: An Italian multicenter study. Gynecol Oncol.
141:303–311. 2016. View Article : Google Scholar : PubMed/NCBI
|
|
7
|
Wilailak S, Chan KK, Chen CA, Nam JH,
Ochiai K, Aw TC, Sabaratnam S, Hebbar S, Sickan J, Schodin BA, et
al: Distinguishing benign from malignant pelvic mass utilizing an
algorithm with HE4, menopausal status, and ultrasound findings. J
Gynecol Oncol. 26:46–53. 2015. View Article : Google Scholar :
|
|
8
|
Chen WT, Gao X, Han XD, Zheng H, Guo L and
Lu RQ: HE4 as a serum biomarker for ROMA prediction and prognosis
of epithelial ovarian cancer. Asian Pac J Cancer Prev. 15:101–105.
2014. View Article : Google Scholar : PubMed/NCBI
|
|
9
|
Angioli R, Capriglione S, Aloisi A, Guzzo
F, Luvero D, Miranda A, Damiani P, Montera R, Terranova C and
Plotti F: Can HE4 predict platinum response during first-line
chemotherapy in ovarian cancer? Tumour Biol. 35:7009–7015. 2014.
View Article : Google Scholar : PubMed/NCBI
|
|
10
|
Vallius T, Hynninen J, Auranen A, Carpén
O, Matomäki J, Oksa S, Virtanen J and Grénman S: Serum HE4 and
CA125 as predictors of response and outcome during neoadjuvant
chemotherapy of advanced high-grade serous ovarian cancer. Tumour
Biol. 35:12389–12395. 2014. View Article : Google Scholar : PubMed/NCBI
|
|
11
|
Zhu LC, Gao J, Hu ZH, Schwab CL, Zhuang
HY, Tan MZ, Yan LM, Liu JJ, Zhang DY and Lin B: Membranous
expressions of Lewis y and CAM-DR-related markers are independent
factors of chemotherapy resistance and poor prognosis in epithelial
ovarian cancer. Am J Cancer Res. 5:830–843. 2015.PubMed/NCBI
|
|
12
|
Kemik P, Saatli B, Yıldırım N, Kemik VD,
Deveci B, Terek MC, Koçtürk S, Koyuncuoğlu M and Saygılı U:
Diagnostic and prognostic values of preoperative serum levels of
YKL-40, HE-4 and DKK-3 in endometrial cancer. Gynecol Oncol.
140:64–69. 2016. View Article : Google Scholar
|
|
13
|
Li X, Gao Y, Tan M, Zhuang H, Gao J, Hu Z,
Wang H, Zhu L, Liu J and Lin B: Expression of HE4 in endometrial
cancer and its clinical significance. Biomed Res Int.
2015:4374682015.PubMed/NCBI
|
|
14
|
Jiang Y, Wang C, Lv B, Ma G and Wang L:
Expression level of serum human epididymis 4 and its prognostic
significance in human non-small cell lung cancer. Int J Clin Exp
Med. 7:5568–5572. 2014.
|
|
15
|
Huang T, Jiang SW, Qin L, Senkowski C,
Lyle C, Terry K, Brower S, Chen H, Glasgow W, Wei Y, et al:
Expression and diagnostic value of HE4 in pancreatic
adenocarcinoma. Int J Mol Sci. 16:2956–2970. 2015. View Article : Google Scholar : PubMed/NCBI
|
|
16
|
Lan WG, Hao YZ, Xu DH, Wang P, Zhou YL and
Ma LB: Serum human epididymis protein 4 is associated with the
treatment response of concurrent chemoradiotherapy and prognosis in
patients with locally advanced non-small cell lung cancer. Clin
Transl Oncol. 18:375–380. 2016. View Article : Google Scholar
|
|
17
|
Lamy PJ, Plassot C and Pujol JL: Serum
HE4: An independent prognostic factor in non-small cell lung
cancer. PLoS One. 10:e01288362015. View Article : Google Scholar : PubMed/NCBI
|
|
18
|
Lu R, Sun X, Xiao R, Zhou L, Gao X and Guo
L: Human epididymis protein 4 (HE4) plays a key role in ovarian
cancer cell adhesion and motility. Biochem Biophys Res Commun.
419:274–280. 2012. View Article : Google Scholar : PubMed/NCBI
|
|
19
|
Moore RG, Hill EK, Horan T, Yano N, Kim K,
MacLaughlan S, Lambert-Messerlian G, Tseng YD, Padbury JF, Miller
MC, et al: HE4 (WFDC2) gene overexpression promotes ovarian tumor
growth. Sci Rep. 4:35742014. View Article : Google Scholar : PubMed/NCBI
|
|
20
|
Zhu L, Zhuang H, Wang H, Tan M, Schwab CL,
Deng L, Gao J, Hao Y, Li X, Gao S, et al: Overexpression of HE4
(human epididymis protein 4) enhances proliferation, invasion and
metastasis of ovarian cancer. Oncotarget. 7:729–744. 2016.
|
|
21
|
Chen Y, Mu X, Wang S, Zhao L, Wu Y, Li J
and Li M: WAP four-disulfide core domain protein 2 mediates the
proliferation of human ovarian cancer cells through the regulation
of growth-and apoptosis-associated genes. Oncol Rep. 29:288–296.
2013.
|
|
22
|
Wang H, Zhu L, Gao J, Hu Z and Lin B:
Promotive role of recombinant HE4 protein in proliferation and
carboplatin resistance in ovarian cancer cells. Oncol Rep.
33:403–412. 2015.
|
|
23
|
Zhuang H, Tan M, Liu J, Hu Z, Liu D, Gao
J, Zhu L and Lin B: Human epididymis protein 4 in association with
Annexin II promotes invasion and metastasis of ovarian cancer
cells. Mol Cancer. 13:2432014. View Article : Google Scholar : PubMed/NCBI
|
|
24
|
Zhuang H, Hu Z, Tan M, Zhu L, Liu J, Liu
D, Yan L and Lin B: Overexpression of Lewis y antigen promotes
human epididymis protein 4-mediated invasion and metastasis of
ovarian cancer cells. Biochimie. 105:91–98. 2014. View Article : Google Scholar : PubMed/NCBI
|
|
25
|
Diaz-Montana JJ and Diaz-Diaz N:
Development and use of the Cytoscape app GFD-Net for measuring
semantic dissimilarity of gene networks. F1000Res.
3:1422014.PubMed/NCBI
|
|
26
|
Tollefsen DM: Heparin cofactor II
modulates the response to vascular injury. Arterioscler Thromb Vasc
Biol. 27:454–460. 2007. View Article : Google Scholar
|
|
27
|
Rau JC, Deans C, Hoffman MR, Thomas DB,
Malcom GT, Zieske AW, Strong JP, Koch GG and Church FC: Heparin
cofactor II in atherosclerotic lesions from the Pathobiological
Determinants of Atherosclerosis in Youth (PDAY) study. Exp Mol
Pathol. 87:178–183. 2009. View Article : Google Scholar : PubMed/NCBI
|
|
28
|
Ikeda Y, Aihara K, Yoshida S, Iwase T,
Tajima S, Izawa-Ishizawa Y, Kihira Y, Ishizawa K, Tomita S,
Tsuchiya K, et al: Heparin cofactor II, a serine protease
inhibitor, promotes angiogenesis via activation of the
AMP-activated protein kinase-endothelial nitric-oxide synthase
signaling pathway. J Biol Chem. 287:34256–34263. 2012. View Article : Google Scholar : PubMed/NCBI
|
|
29
|
Liao WY, Ho CC, Hou HH, Hsu TH, Tsai MF,
Chen KY, Chen HY, Lee YC, Yu CJ, Lee CH, et al: Heparin co-factor
II enhances cell motility and promotes metastasis in non-small cell
lung cancer. J Pathol. 235:50–64. 2015. View Article : Google Scholar
|
|
30
|
Cavalcante MS, Torres-Romero JC, Lobo MD,
Moreno FB, Bezerra LP, Lima DS, Matos JC, Moreira RA and
Monteiro-Moreira AC: A panel of glycoproteins as candidate
biomarkers for early diagnosis and treatment evaluation of B-cell
acute lymphoblastic leukemia. Biomark Res. 4:12016. View Article : Google Scholar :
|
|
31
|
Zhuang H, Gao J, Hu Z, Liu J, Liu D and
Lin B: Co-expression of Lewis y antigen with human epididymis
protein 4 in ovarian epithelial carcinoma. PLoS One. 8:e689942013.
View Article : Google Scholar : PubMed/NCBI
|
|
32
|
Li J, Chen H, Mariani A, Chen D, Klatt E,
Podratz K, Drapkin R, Broaddus R, Dowdy S and Jiang SW: HE4 (WFDC2)
promotes tumor growth in endometrial cancer cell lines. Int J Mol
Sci. 14:6026–6043. 2013. View Article : Google Scholar : PubMed/NCBI
|
|
33
|
Lu Q, Chen H, Senkowski C, Wang J, Wang X,
Brower S, Glasgow W, Byck D, Jiang SW and Li J: Recombinant HE4
protein promotes proliferation of pancreatic and endometrial cancer
cell lines. Oncol Rep. 35:163–170. 2016.
|