Introduction
Thyroid lesions are the commonest endocrine
pathologies in the human population. Palpation of thyroid gland
enables the detection of nodules in 5–7% of the examined patients,
ultrasound screening in 20–50% (1).
Of those, only approximately 5% are malignant and require surgical
intervention. Benign nodules do not become cancerous (2), and it is, therefore, important to
establish the nodule type at an early stage in order to select the
appropriate treatment. The basic method to discriminate malignant
from benign nodules is fine needle aspiration cytology (FNAC). This
method requires highly experienced and skilled staff, which makes
it prone to errors due to the human factor (3). The greatest difficulty is associated
with follicular thyroid cancer (FTC) that cannot cytologically be
differentiated from follicular adenoma (FA). Therefore, a serious
need exists to enhance the accuracy of preoperative thyroid lesion
typing. For this purpose, molecular markers (oncogenic somatic
mutations, the level of oncogene expression and the methylation
status of regulatory regions of certain genes) may be used
(4). Recent studies have shown that
some microRNAs (miRNAs) can serve as such markers, because their
levels are significantly changed in a wide variety of tumors,
including thyroid tumors (5–8).
miRNAs are more stable than mRNAs and are characterized by better
stability in routine procedures for FNAC preparations and storage
of samples. Therefore, the miRNA content can be measured directly
in material from dried FNAC smears, thus, avoiding additional
manipulations and supplementing routine cytology study with the
results of miRNA expression analysis.
Currently, quantitative reverse-transcription
real-time PCR (RT-qPCR) is one of the most frequently used methods
for the quantitative assessment of the level of gene expression,
because of its sensitivity and relatively low cost of reagents and
instrumentation as compared to alternative approaches (RNA-Seq,
Microarrays and NanoString). The reliable registration of the
changes in miRNA levels by means of RT-qPCR requires correct
normalization of the 'raw' data. The purpose of normalization is to
minimize the variation in the results due to technical reasons. The
main sources of the variation are the amount, degradation rate and
the purity of the RNA preparation. There are different approaches
to addressing the problem of normalization, but none of those is
conventional for miRNA quantitation (9). The common element of all employed
normalization strategies is to use the reference genes, i.e. genes
whose expression does not differ or minimally varies in the
compared types of tissues or cells (10). The simplest approach to estimate the
expression stability of reference genes is seeking the minimum
variability in the quantification cycles of PCR (Cq) (11) between the samples. Such an approach,
however, is only effective when concentration of cDNA derived from
different samples is equal or at least close. Equalization of cDNA
concentration in the sample by adding the equal starting amounts of
total RNA does not solve this problem. Total RNA is mostly
represented by ribosomal RNA, which ratio to mRNA and especially to
miRNA can vary significantly in different samples (10,12).
In 2002 Vandesompele et al (13) described the algorithm (called
geNorm) for finding stably expressed reference genes. This method
makes it possible to rank candidate reference genes by their
expression stability, based on the calculation of an average
pairwise variation between all studied genes and to determine the
optimum set of reference genes required for normalization.
One of the primary tasks of any investigation
involving gene expression is the selection of the appropriate
reference gene(s). Currently in most cases there are no universally
recognized reference genes or their combinations for miRNA
expression analysis in the specific tissue type. For miRNA
expression profiling it is desirable that reference genes also
coded miRNAs because in technical terms (extraction efficiency,
RT-PCR and storage stability) they are similar to miRNAs of
interest and all experimental procedures affect them in a similar
way. A single gene may be used for normalization (14), but it has been demonstrated that
such strategy may lead to serious errors while the use of multiple
reference genes significantly enhances the measurement accuracy
(9,13). Vandesompele et al (13) proposes to use at least three
reference genes for proper normalization. In some cases, small
nuclear (RNU6, RNU44 and RNU48) or nucleolar (snoRNA202 and
snoRNA234) RNAs are used as a universal normalizer instead of
miRNAs. This approach may bring about systemic errors, for example,
there is recent evidence suggesting that the levels of expression
of small nuclear RNAs may also change significantly during
carcinogenesis (15,16).
Since to the best of our knowledge, there are still
no universally accepted reference miRNAs, which could be used as
normalizers for miRNA quantification in FNAC preparations, the
present study was aimed at the selection and validation of such
normalizers.
Materials and methods
All biological material was obtained in compliance
with the legislation of the Russian Federation, and written
informed consent was provided by all the patients, all the data was
depersonalized. This study was approved by the ethics committee of
the Institute of Molecular Biology and Biophysics, Siberian Branch
of the Russian Academy of Medical Sciences. We used 435 cytological
specimens obtained by a standard fine-needle aspiration biopsy in
the Center of New Medical Technologies (Novosibirsk). The aspirated
samples were smeared on a glass slide and processed in a standard
way, i.e., the smear was air-dried, the material was pre-fixed by
95% ethanol for 10 min and stained by hematoxylin and eosin. The
smears were classified according to Bethesda system (17): non-diagnostic (ND) (n=34), benign
(n=226), atypia of undetermined significance (n=9), suspicious for
follicular neoplasm (n=61), suspicious for malignancy (n=19),
medullary thyroid carcinoma (MTC) (n=32), papillary thyroid
carcinoma (PTC) (n=54). We also used samples of thyroid tumor
tissue, surgically removed in 152 patients and representing
different histotypes of neoplasms: 32 benign neoplasms, 33 FAs and
87 PTCs. Sample collection and histology analysis were controlled
by a qualified oncologist (Novosibirsk Municipal Clinical Hospital
#1, Oncology Department VI).
Isolation of the total nucleic acids and detection
of miRNAs and RNU6 by RT-qPCR was performed as previously described
(18).
Evaluation of human DNA content was performed by
qPCR as previously described (18),
using oligos for the conserved region of chromosome 15. The
sequences of all new oligos missing in our previous study (18) are listed in Table I.
 | Table ISequences of oligonucleotides used in
the study. |
Table I
Sequences of oligonucleotides used in
the study.
| Target | Type | Sequence
(5′-3′) |
|---|
| miR-183 | RT primer |
CCTGAGTCTGAGGCTCACTGAGACCTTTCGCACCCTCGACTCAGGCAGTGAATTC |
| R PCR primer |
CTGAGGCTCACTGAGACCT |
| PCR probe |
(R6G)-TTCGCACCC(T-BHQ1)CGACTCAGGCAGTGAATTC-p |
| F PCR primer |
CGGACTATGGCACTGGTA |
| miR-551b | RT primer |
GAGGAGAGGCCTTGTAGCACGACCTTATCCTCACCTCCTCTCCTCCTGAAACC |
| R PCR primer |
GCCTTGTAGCACGACCTTA |
| PCR probe |
(R6G)-TC(C-LNA)TCACC(T-BHQ1)CCTCTCCTCCTGAAACC-p |
| F PCR primer |
CACACTCAGCGACCCATACTT |
| miR-361 | RT primer |
GTCGTGTCTGAGGCTCACTGAGGACTTCGCAGCGCTGACACGACGTACCCCT |
| R PCR primer |
CTGAGGCTCACTGAGACCT |
| PCR probe |
(R6G)-TTCGCAGCGC(T-BHQ1)GACACGACGTACCC-p |
| F PCR primer |
CAGCCGTTATCAGAATC(T-LNA)CC |
| miR-151a | RT primer |
CGTGATGCTGAGGCTCACTGAGACCTTTCGCACCCTCGCATCACGC(C-LNA)T(C-LNA)AAGG |
| R PCR primer |
CTGAGGCTCACTGAGACCT |
| PCR probe |
(R6G)-TTCGCACCC(T-BHQ1)CGCATCACGCCTCAAGG-p |
| F PCR primer |
ACAGGACCTAGACTGAAGCT |
| miR-197 | RT primer |
GTCGTGGGTGAAGCAGACAGACACAATTACGCACCTGCCACGACGCTGGGTG |
| R PCR primer |
GTGAAGCAGACAGACACAA |
| PCR probe |
(R6G)-TTACGCACC(T-BHQ1)GCCACGACGCTGGGTG-p |
| F PCR primer |
CCACGTTCACCACCTTCTC |
| miR-99a | RT primer |
CGTGATGCTGAGGCTCACTGAGACCTTTCGCACCCTCGCATCACGCACAAGATC |
| R PCR primer |
CTGAGGCTCACTGAGACCT |
| PCR probe |
(R6G)-TTCGCACCC(T-BHQ1)CGCATCACGCACAAGATC-p |
| F PCR primer |
TAGGACACCCGTAGATCCG |
| miR-214 | RT primer |
GTACGTGCGCTCTGCTGACACCACTCTATCCTACCCTCGCACGTACACTGCCT |
| R PCR primer |
GCTCTGCTGACACCACTCTA |
| PCR probe |
(R6G)-TCCTACCC(T-BHQ1)CGCACGTACACTGCCTG-p |
| F PCR primer |
ATACACAGCAGGCACAGA |
| Hs-Ch15 | F PCR primer |
GGAGAGCCTAGGAGAATGTAT |
| R PCR primer |
AATCACTCTTCTGGAGGCA |
| PCR probe |
(R6G)-TGGTTTCAGA(T-BHQ1)CTTCATGTTGGGTCTCCACGT-p |
The expression of 800 miRNAs was evaluated using the
nCounter Human v2 miRNA Expression Assay kit (NanoString
Technologies, Seattle, WA, USA) in accordance with the producer's
instructions. For the analysis, 100 ng of total RNA, isolated from
surgical material and measured by Qubit (Invitrogen, Waltham, MA,
USA), was hybridized for 20 h at 65°C. After hybridization, the
samples were placed in an automatic nCounter Prep Station for
purification and binding of reporter probes. Then every sample was
scanned in 550 fields of view in nCounter Digital Analyzer. The
data were analyzed using nSolver v2 software (NanoString
Technologies). The results were normalized to 100 most abundant
miRNAs.
The geometric mean of the quantification cycles of
four miRNAs (NF4) was calculated by the formula (1):
The most stable reference genes were selected using
geNorm algorithm: let there be data on the expression n of
various miRNAs in m samples, for each pair of miRNAs the
vector Ajk was calculated, the components of
which are
computed as logarithm to the base two of the ratio between the
level of miRNA expression in a single sample ():
The pairwise variation Vjk of
miRNA defined as standard derivation of Ajk
elements (formula 3):
The expression stability of miRNA j
(Mj) is the arithmetic mean of all pairwise
variations Vjk (formula 4):
Classification of thyroid cytological preparations
by the levels of miRNA expression was performed using the program
TANAGRA (19). The following five
methods were selected: i) Linear discriminant analysis (20); ii) Naive Bayes classifier (21); iii) Multilayer perceptron (Rumelhart
multilayer perceptron) (22); iv)
C-SVC, support vector machine from the library libSVM (23); and v) C4.5 decision tree algorithm
(24).
In order to assess the quality of prediction for a
group of samples based on different methods cross-validation with 5
partitions was used.
Results
Selection of reference miRNAs and
evaluation of expression stability of all miRNAs and RNU6
To the best of our knowledge, no validated reference
genes have been identified for miRNA expression analysis in thyroid
tissues. U6 small RNA (RNU6) is frequently used for this purpose
(14), however, it represents a
different class of molecules, i.e., its length is different from
that of mature miRNA, is transcribed by different RNA polymerase
and circulates in complexes with different proteins. Thus, it
appears more appropriate to use reference miRNAs. Therefore, our
first task was to select several candidate reference miRNAs. For
this purpose, we used NanoString technique (25) to simultaneously evaluate the
expression of 800 miRNAs in 10 paired samples of thyroid surgical
material (from the nodule and adjacent non-tumor tissue from the
same patient): PTC-1 sample, follicular variant of PTC-1; FTC-1,
FA-1, benign nodule -1.
For 249 miRNAs valuable expression (notably higher
than in the negative controls) was shown in majority of the
samples, with the range of measured concentrations of 3.8 lg. The
contribution of various factors to the overall measurement error
using NanoString decreased in the series: the heterogeneity of the
tissue preparation; procedure for RNA isolation; analytical
variation in the assay (data not shown). We selected 93 miRNAs
whose expression did not vary significantly between different types
of tumors and between the tumor/adjacent non-tumor tissue and which
have been identified in all samples in the amount of ≥50 copies per
reaction, since at a lower concentration the method variation was
significantly higher (data not shown). From this list, five miRNAs
with lowest coefficient of variation were selected: hsa-miR-361-5p,
-151a-3p, -197-3p, -99a-5p and -214-3p (further they are designated
as miR-151a, 197, -99a, -214 and -361). Such miRNAs we will refer
to as 'reference miRNAs', those used for normalization (their
levels are not expected to vary significantly between different
lesion types).
To estimate the relative stability, the expression
of 5 candidate reference miRNAs was measured by RT-qPCR in 435 FNAC
samples. In parallel, the expression of 8 miRNAs selected as
classifiers (as well as RNU6) was measured in the same samples by
the same method. By 'classifying miRNAs' we mean those used for
classification of FNAC samples. These miRNAs were selected based on
literature data (26–29). The list of classifiers, further used
for building classification algorithms, included hsa-miR-146b-5p,
-183-5p, -187-3p, -199b-5p, -205-5p, -221-3p, -375 and -551b-3p;
hereinafter referred to as miR-146b, -183, -187, -199b, -205, -221,
-375 and -551b. RNU6 was selected as commonly used for
normalization in miRNA expression studies. The content of miR-361
in our samples was low (characteristic Cq values of 36-38), which
resulted in unacceptably high analytical variation of measurements
(data not shown). Therefore, this miRNA was excluded from the
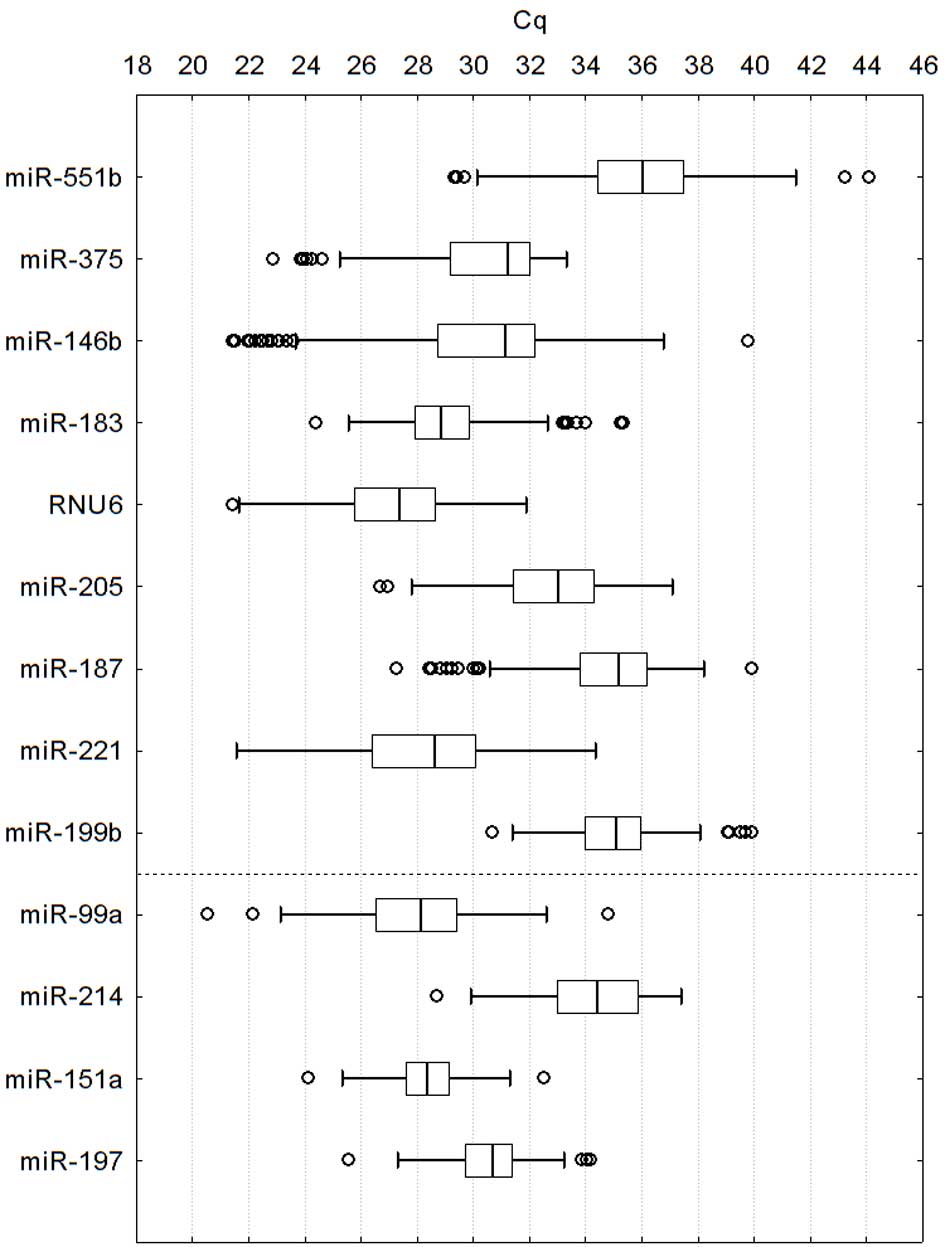
further analysis. The median Cq, reflecting the content of all
other markers in the analyzed sample and the variation of their
values is presented in Fig. 1.
Table II shows median of raw Cq
values and the results of the pairwise comparison for groups of
samples with different cytological classification.
| Table IIP-values for pairwise compared
subgroups of samples selected for the validation of the
normalization factor (PTC, MTC and benign) and non-diagnostic
smears. |
Table II
P-values for pairwise compared
subgroups of samples selected for the validation of the
normalization factor (PTC, MTC and benign) and non-diagnostic
smears.
| P-values
(Mann-Whitney U test)
|
|---|
| RNU6 | miR-197 | miR-99a | miR-151a | miR-214 |
|---|
| ND/Benign | 0.850806 | 0.344236 | 0.110171 | 0.394331 | 0.911211 |
| Benign/MTC | 0.000000c | 0.513717 | 0.014811a | 0.048389a | 0.366020 |
| Benign/PTC | 0.000000c | 0.003504b | 0.000000c | 0.115550 | 0.000000c |
| MTC/PTC | 0.313498 | 0.162672 | 0.964270 | 0.047874a | 0.000311c |
| Median Cq
(Interquartile range)
|
|---|
| RNU6 | miR-197 | miR-99a | miR-151a | miR-214 |
|---|
| ND | 27.8 (2.7) | 31.2 (1.4) | 30.2 (3.2) | 28.8 (1.7) | 35.9 (1.9) |
| Benign | 28.3 (2.2) | 31.1 (1.8) | 29.2 (2.5) | 28.5 (1.7) | 35.8 (3.0) |
| MTC | 24.6 (3.8) | 31.1 (5.2) | 26.1 (6.1) | 29.9 (6.4) | 36.4 (4.1) |
| PTC | 25.4 (3.4) | 30.5 (2.1) | 26.4 (3.5) | 28.5 (2.7) | 33.5 (3.5) |
It is clear from Fig.
1 and Table II that the
content of all analyzed RNA, including reference ones,
significantly varies in FNACs. This variation only partially can be
referred to the different total amount of RNA in samples and method
errors; a significant contribution thereto is made by biological
differences between the samples, especially differences in the
content of miRNAs between different subgroups.
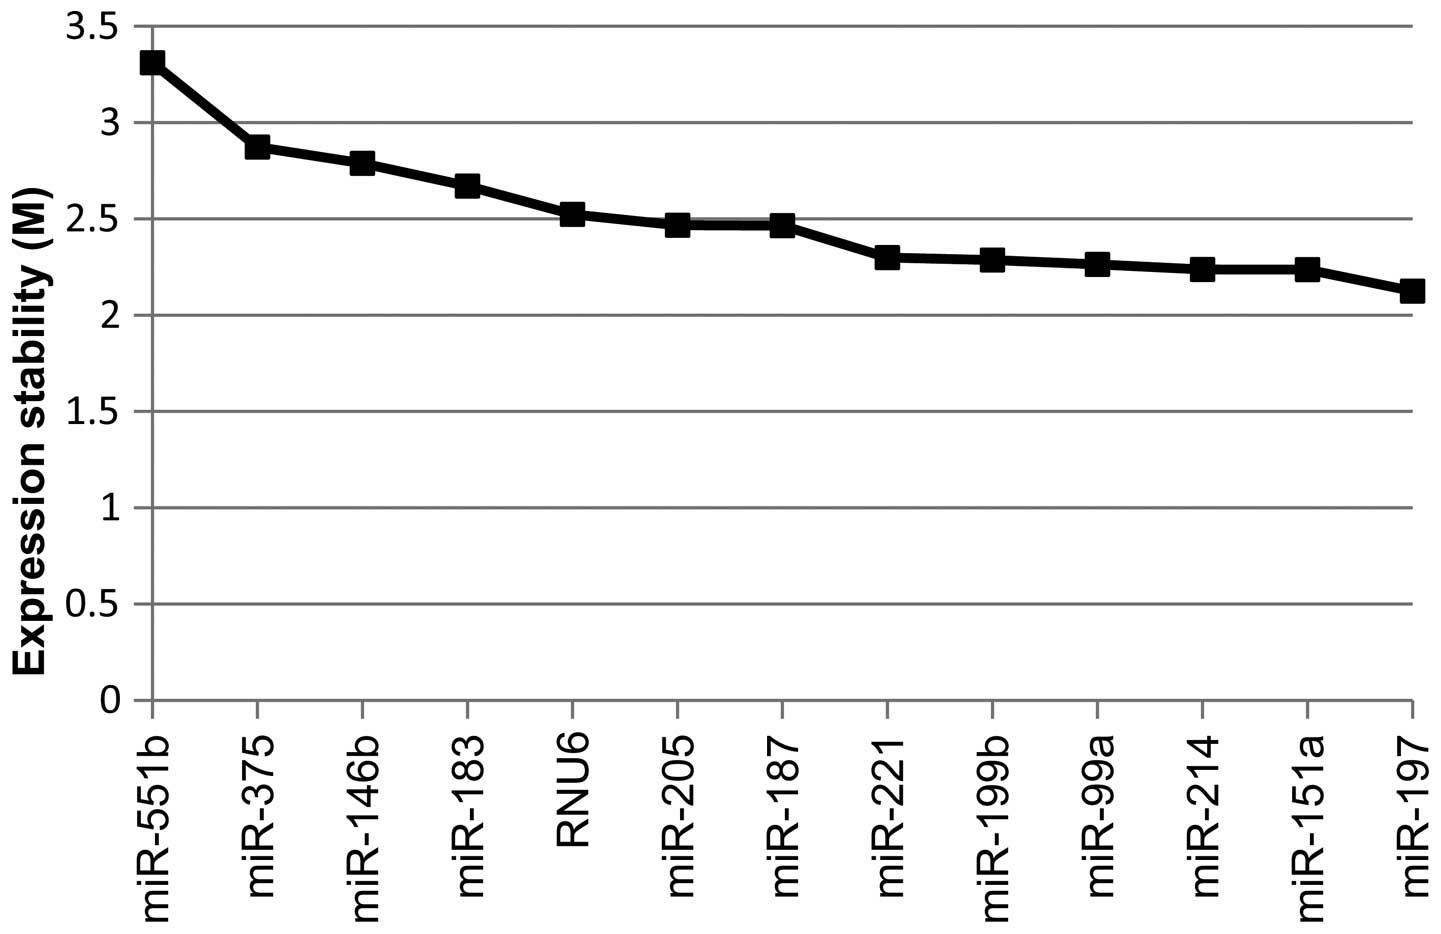
For assessing the expression stability, we used the
geNorm algorithm, which ranks the analyzed genes by the value of
the relative expression stability denoted by M. Higher M-values are
indicative of less stable expression because M is an averaged
pairwise variation value of a particular gene with all other genes
(formula 4).
As expected, the expression stability of reference
miRNAs appeared higher than of classifier miRNAs. At the same time,
expression stability of RNU6 was found to be quite low; actually,
it was higher for half of the miRNA classifiers (Fig. 2).
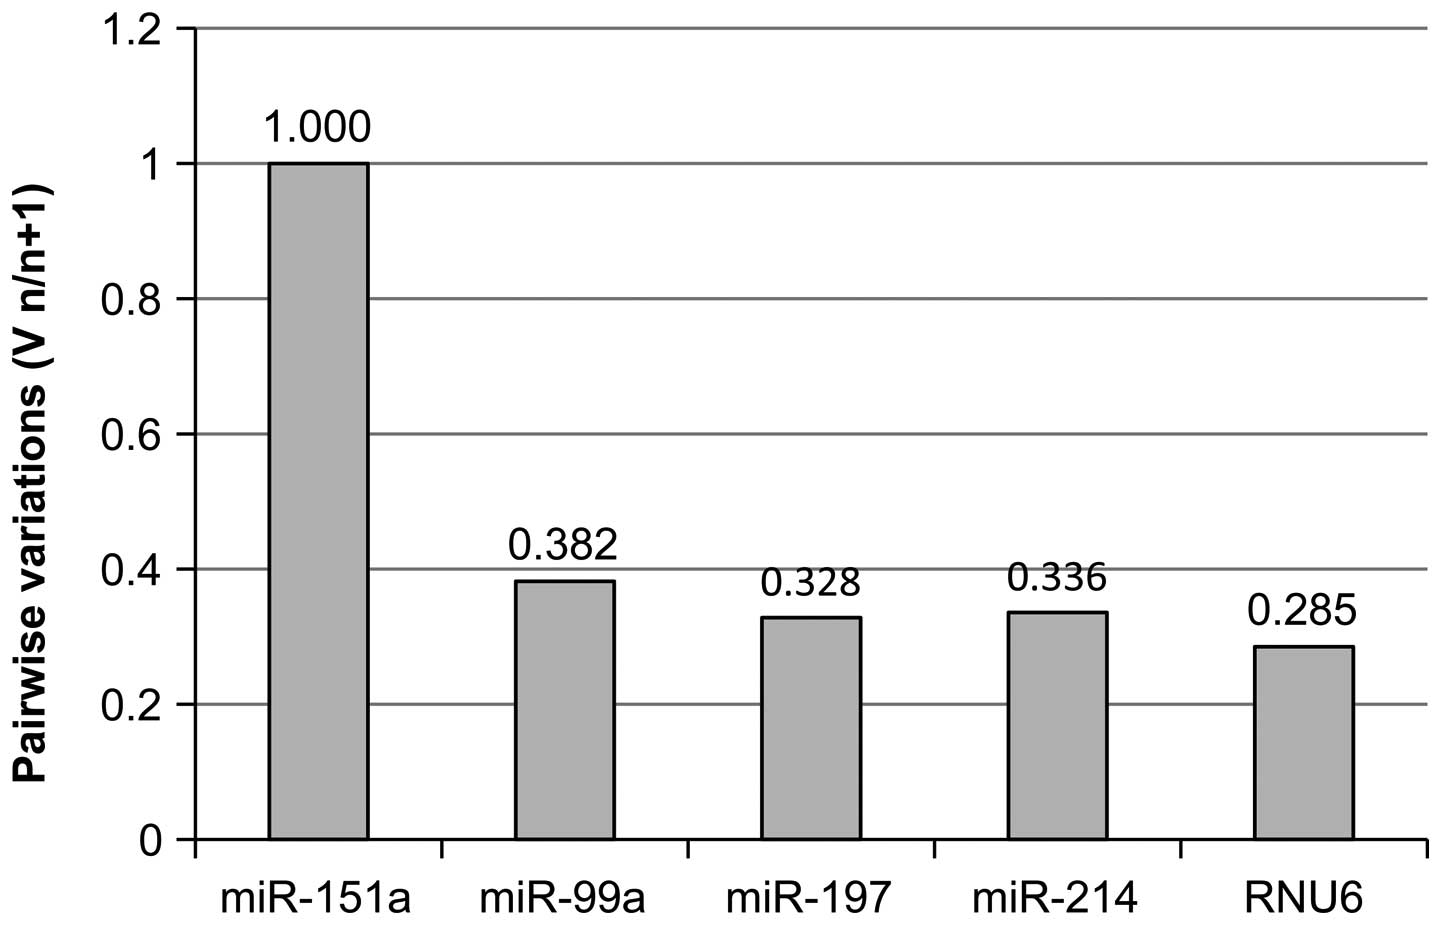
Selection of normalization factor
If the reference genes were considered separately,
the lowest expression stability was observed for RNU6 and the
highest - for miR-197; miR-99a, -151a and -214 had similar
M-values. The optimal number of reference genes can be determined
based on the V-value (pairwise variations Vn/n+1
between normalization factors) (formula 3): if the addition of extra
reference genes into normalization factor (NF) leads to only a
slight decrease in the V-value, their use will not contribute
significantly to reducing normalization errors (30).
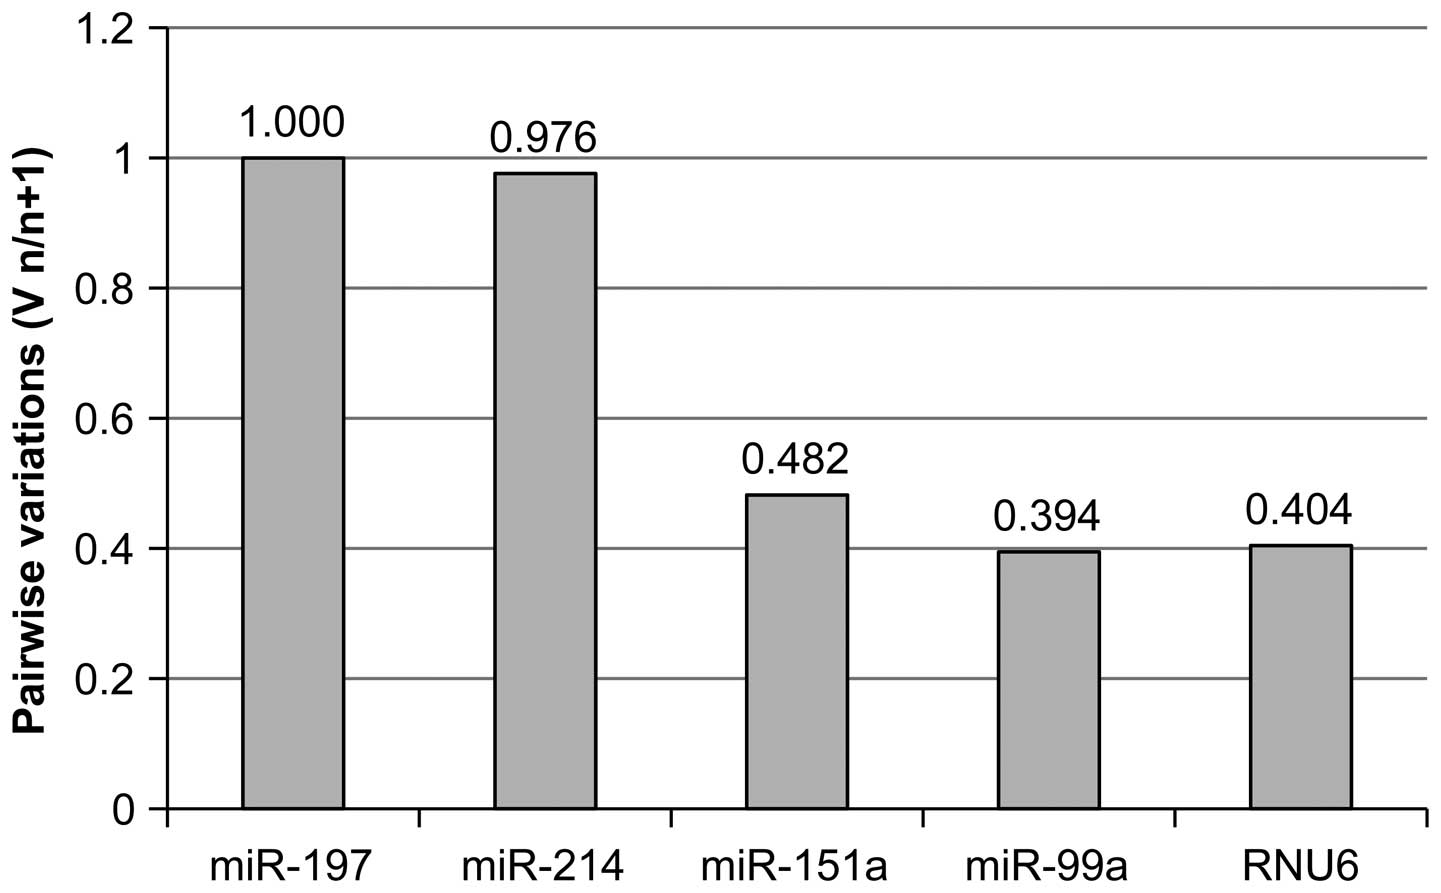
The choice of the optimum number of reference miRNAs
for the normalization is illustrated by the histogram showing the
changes in the variation when an additional miRNA is included into
the NF (Fig. 3). That is, for
instance, the column 'miR-214' on the histogram presents the ratio
of the data variation under the normalization to miR-197 and to the
geometric mean of miR-197+miR-214. It was proposed to use geometric
rather than arithmetic mean by Vandesompele et al (13), because it is less affected by a wide
scatter of values.
If the addition of a reference gene reduces the
variation ratio in the normalization factor, it is reasonable to
include this gene into NF. It is recommended that the number of
genes in NF should be at least three (13). In our case, for normalization we
selected miR-197, -151a, -214 and -99a. Addition of RNU6 to the NF
no longer reduced data variation but, on the contrary, increased it
(Fig. 3).
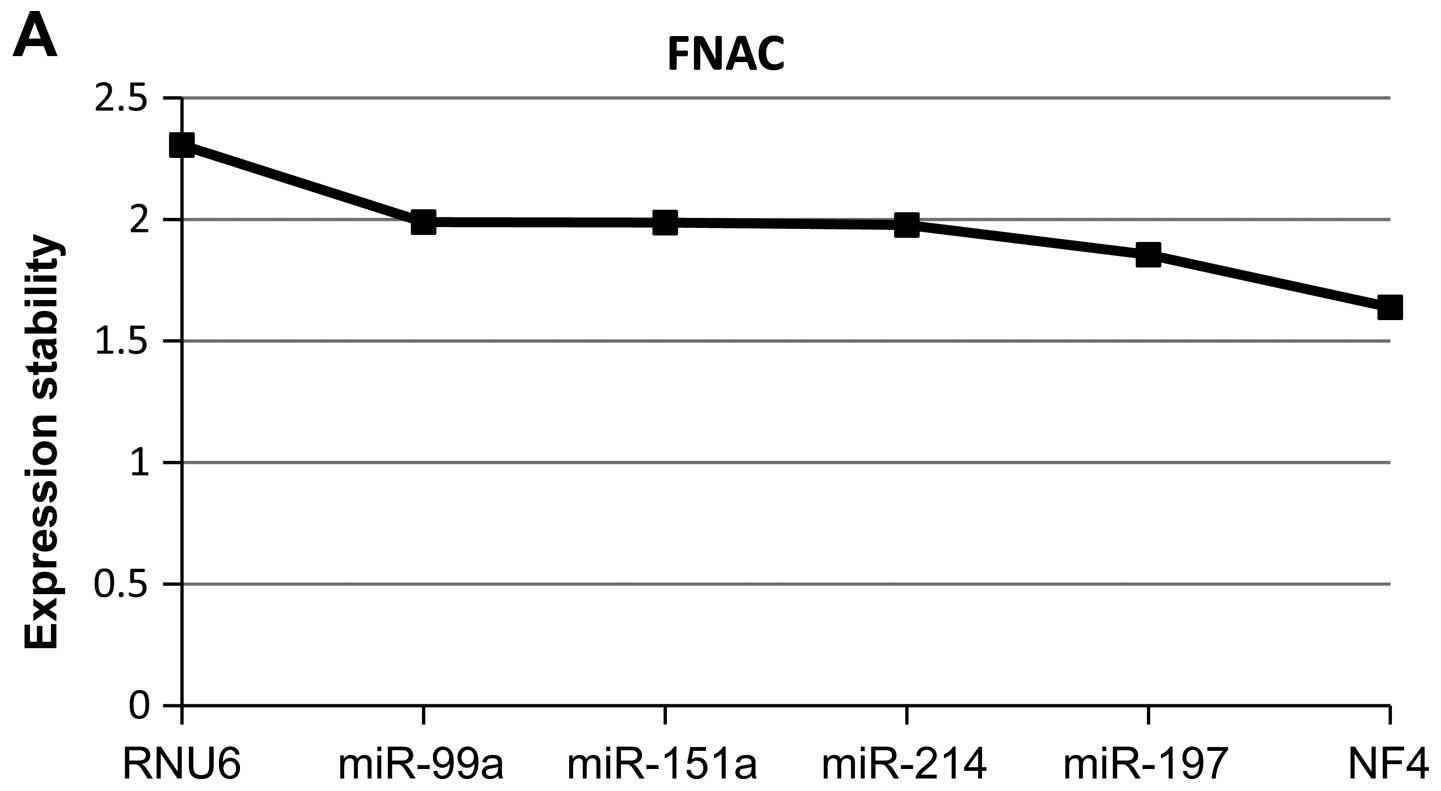
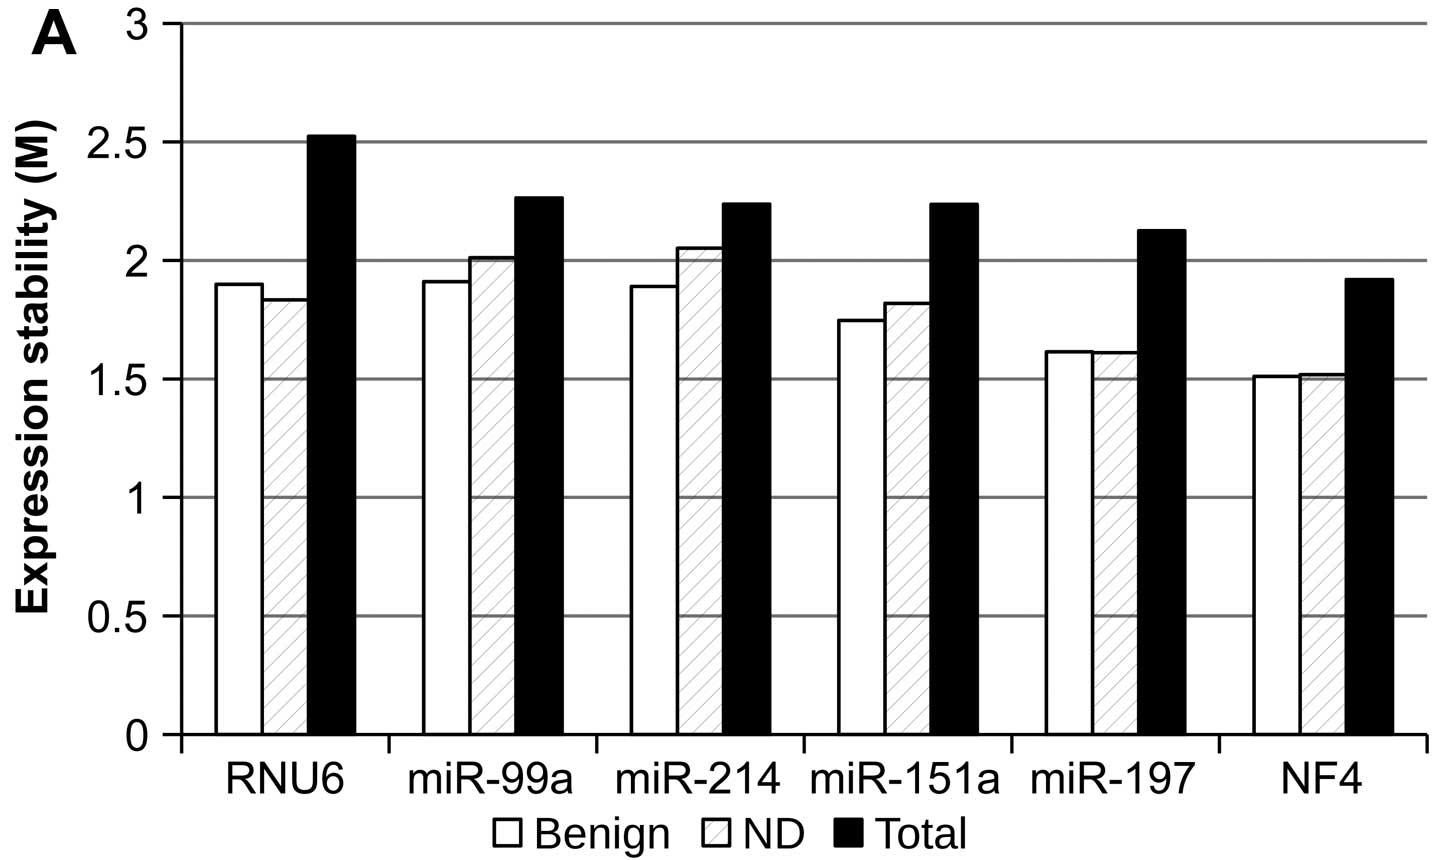
Therefore, the normalization factor (NF4) selected
by us is a geometric mean of expression data of four miRNAs:
miR-197, -214, -151a and -99a. Its expression stability was higher
than that of every single reference miRNA (Fig. 4A).
One of the specific features of dried FNAC samples
is high variability in quantity and degree of degradation of
nucleic acids in the preparations. Thus, the Cq values for human
DNA in our sampling could differ by 14 (which corresponds to the
difference of ~4 orders of magnitude in the concentration) with
interquartile range of one order of magnitude and the coefficient
of variation (Cv) of 6.7. We assessed the expression stability of
reference miRNAs, RNU6 and NF4 for the surgical material obtained
from patients with different types of thyroid neoplasms. For these
samples, variation in the content of nucleic acids was
significantly lower (the difference between the maximum and minimum
concentrations of human DNA was 2 orders of magnitude,
interquartile range was 4 times and Cv=4.8). As expected, the
M-values for reference miRNAs in the surgical material were lower
than for FNACs (Fig. 4B), and, in
contrast to those and with the exception of RNU6, met the criteria
of stability, according to the recommendations of the developers of
geNorm algorithm. It can be seen that both in FNACs and surgical
material, the minimum stability is observed for RNU6 and the
maximum stability is attained for NF4, however, the relative
stability of these normalizers varies in samples corresponding to
different material.
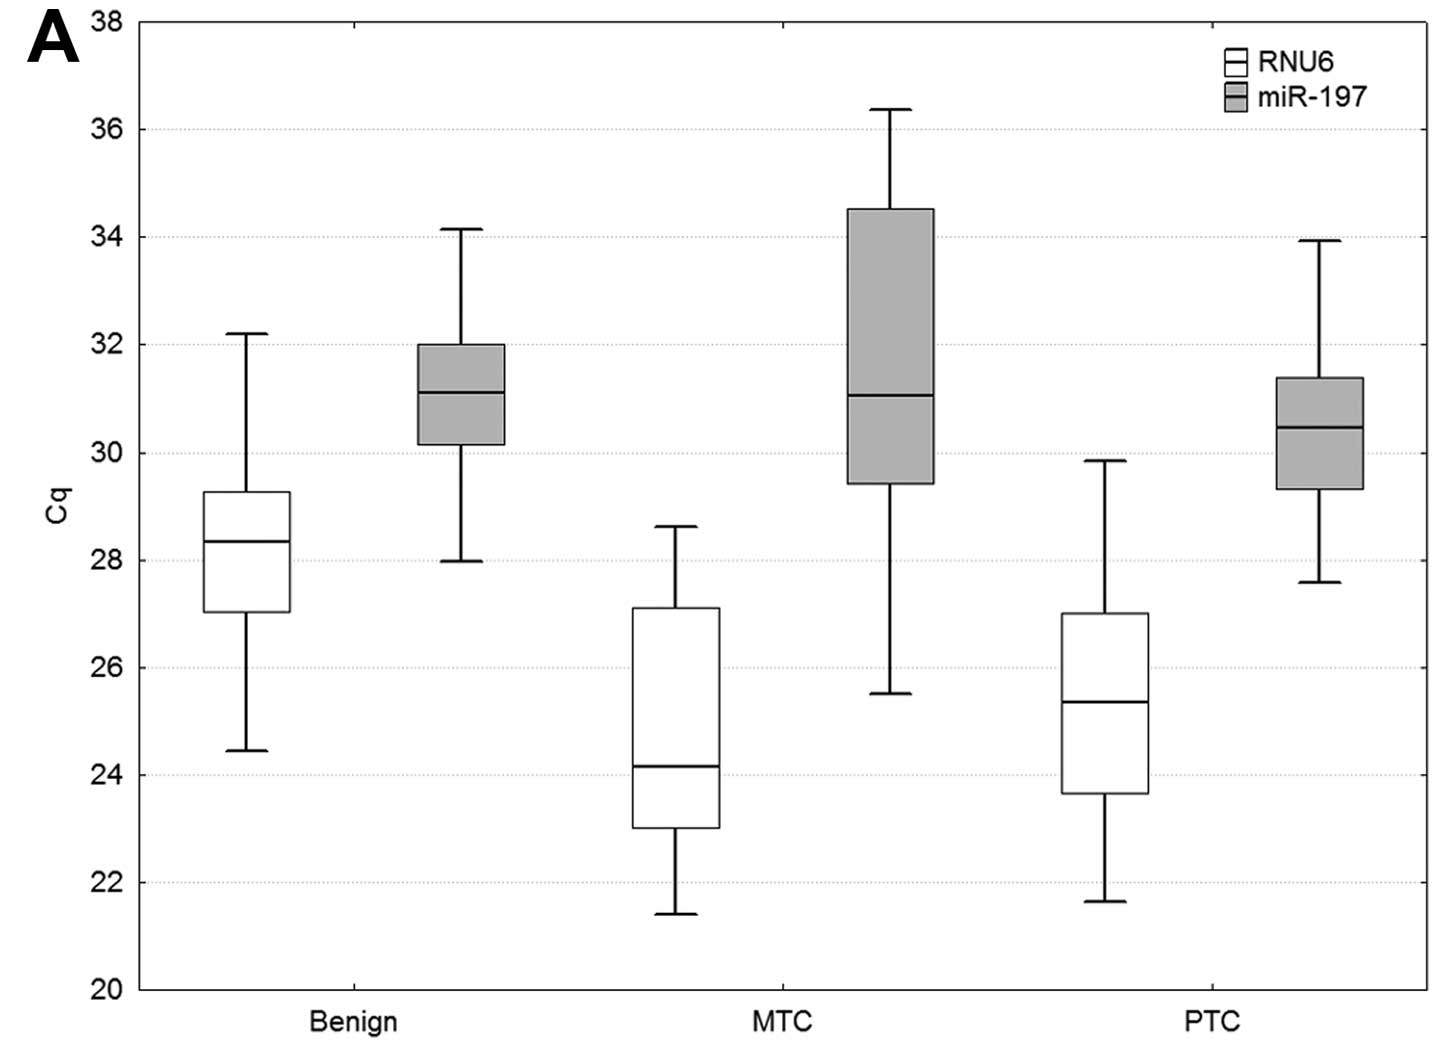
Histogram in the Fig.
5 illustrates the change in the variation observed when the
same four miRNAs and RNU6 are used for normalization in the
analysis of surgical material. Obviously, the variation is
noticeably lower for this material as compared with FNACs; the
relative contributions made to it by different normalizers vary,
and the inclusion of RNU6 in the normalization somewhat enhances
the stability, if only slightly. The differences between the two
types of materials with regard to RNU6 can be attributed at least
to two reasons. First, the relative stability of RNU6 and miRNAs in
cytological smears could differ. Secondly, our sampling of FNACs,
in contrast to the surgical material, was enriched by medullary
cancers which are relatively rare. Fig.
6 presents the differences in the content of RNU6 in three
groups of FNACs representing different neoplasm types. It can be
seen that MTC samples differ significantly in the content of RNU6
(P=2×10⁻¹¹).
Validation of the NF4
In order to validate the NF4, we selected 3 groups
of FNACs, i.e., benign neoplasms, medullary thyroid carcinomas and
papillary thyroid carcinomas. Such groups were selected because
they include uniform data (benign or malignant tumors), other
groups: atypia of undetermined significance, follicular neoplasm,
suspicious for a follicular neoplasm and suspicious for malignancy,
can include both benign and malignant tumors. We normalized data on
the expression of classifying miRNA to the NF4 (geometric mean of
miR-197, -151a, -214 and -99a), reference miRNA characterized by
the greatest expression stability (miR-197) and by the lowest
expression stability (miR-99a).
In order to classify the samples by miRNA profiling
we used methods belonging to different classes: Methods based on
statistical procedures, i.e., Bayes classification algorithm and
linear discriminant analysis and cybernetic methods: support vector
machine and neural networks with backpropagation of error
(multilayer perceptron); and the decision-tree algorithm (C4.5),
belonging to the class of logical methods. The prediction quality
assessment was based on the cross-validation with 5 partitions. The
classification was performed twice: in the first case the samples
were subdivided into PTC, MTC and benign neoplasms, in the second
case they were subdivided into malignant and benign. The comparison
of the classification results was based on the percentage of
errors, including the average error during cross-validation. The
error was understood as a discrepancy between the cytology and
miRNA classification diagnoses. The results are presented in
Table III.
| Table IIIComparison of error levels of
different classification methods. |
Table III
Comparison of error levels of
different classification methods.
| Papillary
carcinoma/Medullary carcinoma/Benign
|
|---|
Normalization to
NF4
| Normalization to
miR-197
| Normalization to
miR-99a
|
|---|
| Error (%) | Cross-validation
error (%) | Accuracy (%) | Error (%) | Cross-validation
error (%) | Accuracy (%) | Error (%) | Cross-validation
error (%) | Accuracy (%) |
|---|
| C4.5 | 0.68 | 6.14 | 93.86 | 4.07 | 9.10 | 90.90 | 2.71 | 8.34 | 91.66 |
| Support vector
machine | 7.46 | 9.59 | 90.41 | 14.92 | 16.07 | 83.93 | 19.66 | 20.21 | 79.79 |
| Multilayer
perceptron | 3.05 | 4.28 | 95.72 | 3.73 | 8.90 | 91.10 | 6.78 | 11.24 | 88.76 |
| Bayes
classifier | 6.10 | 7.52 | 92.48 | 13.22 | 13.72 | 86.28 | 17.63 | 18.83 | 81.17 |
| Linear discriminant
analysis | 5.42 | 6.90 | 93.10 | 11.19 | 12.14 | 87.86 | 16.95 | 18.55 | 81.45 |
| Malignant
neoplasms/Benign
|
|---|
Normalization to
NF4
| Normalization to
miR-197
| Normalization to
miR-99a
|
|---|
| Error (%) | Cross-validation
error (%) | Accuracy (%) | Error (%) | Cross-validation
error (%) | Accuracy (%) | Error (%) | Cross-validation
error (%) | Accuracy (%) |
|---|
| C4.5 | 0.68 | 7.31 | 92.69 | 2.37 | 8.41 | 91.59 | 3.05 | 8.62 | 91.38 |
| Support vector
machine | 8.81 | 10.34 | 89.66 | 14.92 | 15.10 | 84.90 | 20.00 | 20.34 | 79.66 |
| Multilayer
perceptron | 2.71 | 5.03 | 94.97 | 4.41 | 5.17 | 94.83 | 10.17 | 12.07 | 87.93 |
| Bayes
classifier | 7.80 | 8.55 | 91.45 | 12.54 | 13.03 | 86.97 | 16.95 | 18.00 | 82.00 |
| Linear discriminant
analysis | 4.75 | 6.14 | 93.86 | 9.83 | 11.79 | 88.21 | 14.58 | 16.07 | 83.93 |
As expected, for all methods the lowest error was
observed for data normalized to the NF4, in some cases, the
observed decrease in the percentage of errors was 2-fold or
greater. Making use of data normalized to miR-99a resulted in the
greatest error. Data normalized to miR-197 yielded intermediate
value of error. There was only one deviation from this pattern, in
case of classification PTC/MTC/Benign by decision-tree method the
percentage of errors under normalization to miR-99a proved to be
lower than under the normalization to miR-197 (Table III).
Discussion
The miRNA expression in tumors is always different
from that in healthy tissue and at different stages of tumor
development. Since miRNAs are highly stable in biological tissues
and body fluids, this makes them promising diagnostic markers.
However, the use of miRNAs as a reliable biomarker in oncology
diagnostics is impossible without the proper normalization of
quantitative data on their expression. The main purpose of the
normalization is to reduce the technical variation of experimental
data, which permits to perform a more accurate assessment of the
biological variation. At present, there are a number of various
studies devoted to the determination of profiles of miRNA
expression for different thyroid pathologies. However, the numerous
obtained data are not always confirmed in other studies and
sometimes are even contradictory (31). This is usually attributed to the
difference in platforms used for the quantification of miRNA
expression, in different methods of miRNA isolation and
peculiarities of the analyzed batches of samples. Nevertheless, use
of improper reference genes can be one of the major reasons for the
differences in the results obtained in studies of miRNA expression
(14). Even slight changes in the
content of miRNAs may be biologically significant but these changes
may be estimated incorrectly or even remain hidden in the case of
unsuccessful choice of normalization strategy (14,32,33).
Since there are no universal miRNA normalizers for various types of
tissues and cells, every research requires the selection of
suitable reference genes just for the specific tissue and type of
material.
In the present study, we describe the choice of
reference genes making it possible to compare the levels of miRNA
expression in cytological thyroid smears dried on glass by RT-qPCR
based methods. At the first stage the candidates were selected by
chip technology from a small batch of samples; then the expression
stability of the candidate genes was assessed on an larger batch of
clinical samples using PCR; and at the third stage the selected
variants were validated by including them in diagnostic algorithm
and evaluating the contribution of the normalizer to the general
error of the analysis. As a result, we chose four miRNA candidates
and for comparison we used RNU6 as the commonly used normalizer.
The evaluation of the expression stability showed that for the
reference miRNAs it was higher than for the classifying ones and
higher than for RNU6. As for the latter, its expression stability
was at the same level as the most pronounced miRNA classifiers
(miR-146b and -375). Moreover, the validation of normalizers
revealed that the C4.5 algorithm, regardless on which reference
miRNA quantification data were normalized to, included RNU6 in the
decision tree, i.e., assigns RNU6 to classifiers. The above
suggests that RNU6 cannot be used as a normalizer in studying miRNA
expression in thyroid tumors. Apparently, during the development of
malignant tumors RNU6 expression changes in a characteristic way,
so it can serve as a marker of the process, which has been shown
for some other types of cancer (15,34).
Using several reference genes instead of one has
really made it possible to improve the quality of the data
normalization. In order to compare the quality of normalization to
different reference genes, we classified the obtained data using
different algorithms and compared them with cytological
classification. The algorithms employed by us, with the exception
of the decision-tree method (C4.5) use the entire set of the data,
therefore, data with the least general technical variability will
give the best results. On constructing the decision tree, C4.5
algorithm selects data only from the miRNAs yielding the best
classification and is, therefore, less dependent on the general
variability. Our verification showed that making use of the complex
normalizer consisting of four miRNAs for the data normalization
results in the decrease percentage of both direct and
cross-validation errors and this is observed regardless of the
employed algorithm. With normalization to a single miRNA, making
use of miRNA with the most stable expression give lower percentage
of errors for all classification algorithms except C4.5. For the
latter, this rule does not strictly apply, which suggests that in
the selection of the normalizer we should take into account not
only its stability, but also the methods of the further data
analysis to be used.
It should be emphasized that in this study, we did
not equalize the analyzed preparations with regard to nucleic acids
concentration and did not control their degradation or purity. For
the isolation of nucleic acids a standard low-cost method was used,
which did not involve the purification of small RNA fraction. We
used such an approach in order to simulate the real work carried
out in low resource laboratories, without disproportionate labor
costs associated with evaluation and equalization of nucleic acids
concentration in each sample before miRNA quantification. Moreover,
different slides in the studied sample were stored in archive for
different time (1–5 years). The aim of the present study was not to
obtain the minimum M-values, but rather to choose the set of
normalizers suitable for the analysis of this particular clinical
material, i.e. cytological preparations dried on glass slides. The
comparison of results obtained from the cytological smears and the
surgical material clearly indicates that the M-value depends on the
variation in the content of the nucleic acids in the sample. As our
experience shows, we should not expect too much from the material
quality of dried FNAC samples. This type of material is
characterized by a significant level of DNA degradation and, even
more so, of RNA (especially when they are stored in archives), as
well as great variability in the amount of sampled material and
unwanted impurities therein (e.g., blood). Moreover, in our
experience, these parameters can vary depending on the particular
medical institution and skills of the laboratory staff in the
setting where sampling is performed.
Another peculiarity of the sample we used to
validate the normalizer was the fact that the sample was enriched
with malignant neoplasms. We believe this approach enables more
correct evaluation of the compared normalizers and makes it
possible to choose the optimum variants on more rational grounds.
In analyzing the sampling corresponding to the real flow of FNAC
samples, it will likely consist mostly of benign smears. Then the
stability of all analyzed short RNAs would be higher and the
biological variation, characteristic of miRNA classifiers and
enabling their use for thyroid neoplasms typing, would be less
noticeable. When the M-values are only determined for preparations
classified as benign neoplasms (n=226) these values prove lower
than for the entire sampling both for normalizers and for
classifiers. The M-values close to benign samples have been
obtained for the subgroup corresponding to non-diagnostic material
and not used for the validation of normalizers (n=34) (Fig. 7). The latter is probably due to the
fact that the sampling of non-diagnostic material contains higher
proportion of preparations from benign neoplasms, corresponding to
their statistical occurrence in patients with suspected thyroid
cancer.
It should be noted that the expression of all
selected reference miRNAs may in fact be different for the compared
groups of smears corresponding to different types of lesions. It is
clear from the data presented in Table
II that none of the selected reference markers has proved
itself as universal in comparing different types of neoplasms. None
of the suggested normalizers was able to distinguish non-diagnostic
material from benign smears, which confirms our assumption that the
sample of non-diagnostic smears primarily corresponds to benign
neoplasms due to their high statistical representation. At the same
time, miR-99a actually appears a 'weak' classifier distinguishing
benign neoplasms from both types of cancer, miR-214 distinguishes
the batch of PTCs from the other two groups, and miR-151a sorts out
MTCs. It can be seen from the presented median Cq values that these
differences cannot be attributed only to artifacts associated with
varying degrees of nucleic acids degradation in the compared
groups. Moreover, on average, samples of malignant neoplasms were
longer stored in archives, especially samples of the rare medullary
thyroid carcinomas, and it could be expected that the Cq values for
those would be higher. Nevertheless, our data do not support this
assumption.
According to the available data obtained by
different methods, deregulation is demonstrated for all selected
miRNA normalizers for some particular types of cancer. For example,
upregulation is demonstrated for hsa-miR-197 in follicular thyroid
carcinoma (35) and lung cancer
(36), for hsa-miR-214
downregulation is shown for the cases of ovarian cancer (37) but it is upregulated in pancreatic
carcinoma (38). All these miRNAs
are controlled by key transcription factors and changes in their
expression may be involved in the mechanism of malignant
transformation.
We are not able to rule out the assumption that at
least in the case of thyroid neoplasms none of miRNA genes is a
housekeeping gene in the classical sense, that is, a gene, the
expression of which is uniform in a heterogeneous sample comprising
different types of neoplasms. Or, perhaps, such 'miRNA
housekeepers' should be sought among low-expressed miRNA genes
which had been discarded by us because of their low expression and,
consequently, high variation in measurements using PCR. At the same
time, the use of the complex normalizer can compensate for
distortion in quantitative evaluation introduced by individual
miRNAs in its composition, which are expressed differently in
different groups of samples. In our case, the fact that the complex
normalizer gives a lower error rate than any of the individual
reference genes in its composition, indirectly confirms this
assumption.
Thus, we have proposed the normalization factor
(geometric mean values of the content of miR-151a-3p, -197-3p,
-99a-5p and -214-3p), which can be used in the analysis of changes
in the content of miRNA in dried cytological smears from thyroid
lesions. In our hands, the use of this normalizer, despite the
substantial variation in the content of the nucleic acids and the
biological variation of the levels of reference miRNAs, made it
possible to discriminate different types of thyroid lesions in
cytological preparations with a fairly high total accuracy, using a
simple classifier including a limited number of miRNAs.
Acknowledgments
The present study was supported by the Fundamental
Scientific Research on the project 0310-2015-0003, 0310-2015-0007
(NNK and SET) and 0324-2015-0003 (PSD).
Abbreviations:
|
FNAC
|
fine-needle aspiration cytology
|
|
Cq
|
quantification cycle
|
|
RT-qPCR
|
quantitative reverse-transcription
real-time PCR
|
|
FA
|
follicular adenoma
|
|
PTC
|
papillary thyroid carcinoma
|
|
MTC
|
medullary thyroid carcinoma
|
|
ND
|
non-diagnostic material
|
|
NF
|
normalization factor
|
References
|
1
|
Guth S, Theune U, Aberle J, Galach A and
Bamberger CM: Very high prevalence of thyroid nodules detected by
high frequency (13 MHz) ultrasound examination. Eur J Clin Invest.
39:699–706. 2009. View Article : Google Scholar : PubMed/NCBI
|
|
2
|
Orlandi A, Puscar A, Capriata E and
Fideleff H: Repeated fine-needle aspiration of the thyroid in
benign nodular thyroid disease: Critical evaluation of long-term
follow-up. Thyroid. 15:274–278. 2005. View Article : Google Scholar : PubMed/NCBI
|
|
3
|
Stevens C, Lee JK, Sadatsafavi M and Blair
GK: Pediatric thyroid fine-needle aspiration cytology: A
meta-analysis. J Pediatr Surg. 44:2184–2191. 2009. View Article : Google Scholar : PubMed/NCBI
|
|
4
|
Witt RL, Ferris RL, Pribitkin EA, Sherman
SI, Steward DL and Nikiforov YE: Diagnosis and management of
differentiated thyroid cancer using molecular biology.
Laryngoscope. 123:1059–1064. 2013. View Article : Google Scholar : PubMed/NCBI
|
|
5
|
Pallante P, Visone R, Ferracin M, Ferraro
A, Berlingieri MT, Troncone G, Chiappetta G, Liu CG, Santoro M,
Negrini M, et al: MicroRNA deregulation in human thyroid papillary
carcinomas. Endocr Relat Cancer. 13:497–508. 2006. View Article : Google Scholar : PubMed/NCBI
|
|
6
|
Kitano M, Rahbari R, Patterson EE,
Steinberg SM, Prasad NB, Wang Y, Zeiger MA and Kebebew E:
Evaluation of candidate diagnostic microRNAs in thyroid fine-needle
aspiration biopsy samples. Thyroid. 22:285–291. 2012. View Article : Google Scholar : PubMed/NCBI
|
|
7
|
Swierniak M, Wojcicka A, Czetwertynska M,
Stachlewska E, Maciag M, Wiechno W, Gornicka B, Bogdanska M,
Koperski L, de la Chapelle A, et al: In-depth characterization of
the microRNA transcriptome in normal thyroid and papillary thyroid
carcinoma. J Clin Endocrinol Metab. 98:E1401–E1409. 2013.
View Article : Google Scholar : PubMed/NCBI
|
|
8
|
Cancer Genome Atlas Research Network:
Integrated genomic characterization of papillary thyroid carcinoma.
Cell. 159:676–690. 2014. View Article : Google Scholar : PubMed/NCBI
|
|
9
|
Meyer SU, Pfaffl MW and Ulbrich SE:
Normalization strategies for microRNA profiling experiments: A
'normal' way to a hidden layer of complexity? Biotechnol Lett.
32:1777–1788. 2010. View Article : Google Scholar : PubMed/NCBI
|
|
10
|
Huggett J, Dheda K, Bustin S and Zumla A:
Real-time RT-PCR normalisation; strategies and considerations.
Genes Immun. 6:279–284. 2005. View Article : Google Scholar : PubMed/NCBI
|
|
11
|
Bustin SA, Benes V, Garson JA, Hellemans
J, Huggett J, Kubista M, Mueller R, Nolan T, Pfaffl MW, Shipley GL,
et al: The MIQE guidelines: Minimum information for publication of
quantitative real-time PCR experiments. Clin Chem. 55:611–622.
2009. View Article : Google Scholar : PubMed/NCBI
|
|
12
|
Spanakis E: Problems related to the
interpretation of autoradiographic data on gene expression using
common constitutive transcripts as controls. Nucleic Acids Res.
21:3809–3819. 1993. View Article : Google Scholar : PubMed/NCBI
|
|
13
|
Vandesompele J, De Preter K, Pattyn F,
Poppe B, Van Roy N, De Paepe A and Speleman F: Accurate
normalization of real-time quantitative RT-PCR data by geometric
averaging of multiple internal control genes. Genome Biol.
3:H00342002. View Article : Google Scholar
|
|
14
|
Dijkstra JR, van Kempen LC, Nagtegaal ID
and Bustin SA: Critical appraisal of quantitative PCR results in
colorectal cancer research: Can we rely on published qPCR results?
Mol Oncol. 8:813–818. 2014. View Article : Google Scholar : PubMed/NCBI
|
|
15
|
Gee HE, Buffa FM, Camps C, Ramachandran A,
Leek R, Taylor M, Patil M, Sheldon H, Betts G, Homer J, et al: The
small-nucleolar RNAs commonly used for microRNA normalisation
correlate with tumour pathology and prognosis. Br J Cancer.
104:1168–1177. 2011. View Article : Google Scholar : PubMed/NCBI
|
|
16
|
Appaiah HN, Goswami CP, Mina LA, Badve S,
Sledge GW Jr, Liu Y and Nakshatri H: Persistent upregulation of
U6:SNORD44 small RNA ratio in the serum of breast cancer patients.
Breast Cancer Res. 13:R862011. View
Article : Google Scholar : PubMed/NCBI
|
|
17
|
Cibas ES and Ali SZ: NCI Thyroid FNA State
of the Science Conference: The Bethesda System For Reporting
Thyroid Cytopathology. Am J Clin Pathol. 132:658–665. 2009.
View Article : Google Scholar : PubMed/NCBI
|
|
18
|
Titov SE, Ivanov MK, Karpinskaya EV,
Tsivlikova EV, Shevchenko SP, Veryaskina YA, Akhmerova LG, Poloz
TL, Klimova OA, Gulyaeva LF, et al: miRNA profiling, detection of
BRAF V600E mutation and RET-PTC1 translocation in patients from
Novosibirsk oblast (Russia) with different types of thyroid tumors.
BMC Cancer. 16:2012016. View Article : Google Scholar : PubMed/NCBI
|
|
19
|
Ricco R: TANAGRA: a free software for
research and academic purposes. Proceedings of EGC'2005, RNTI-E-3;
2. pp. 697–702. 2005, in French.
|
|
20
|
Rao RC: The utilization of multiple
measurements in problems of biological classification. J R Stat Soc
B. 10:159–203. 1948.
|
|
21
|
Hand DJ and Yu Y: Idiots Bayes - not so
stupid after all? Int Stat Rev. 69:385–389. 2001.
|
|
22
|
Rumelhart DE and McClelland JL; the PDP
research group: Parallel distributed processing: Explorations in
the micro-structure of cognition I. MIT Press; Cambridge, MA:
1986
|
|
23
|
Chang CC and Lin CJ: LIBSVM: a library for
support vector machines. ACM Trans Intell Syst Technol. 2(3,
article 27): 1–39. 2011. View Article : Google Scholar
|
|
24
|
Quinlan JR: C4.5: programs for machine
learning. Morgan Kaufmann Publishers Inc; San Francisco, CA:
1993
|
|
25
|
Kulkarni MM: Digital multiplexed gene
expression analysis using the NanoString nCounter system. Curr
Protoc Mol Biol. 94:25B.10.1–25B.10.17. 2011.
|
|
26
|
Nikiforova MN, Tseng GC, Steward D, Diorio
D and Nikiforov YE: MicroRNA expression profiling of thyroid
tumors: Biological significance and diagnostic utility. J Clin
Endocrinol Metab. 93:1600–1608. 2008. View Article : Google Scholar : PubMed/NCBI
|
|
27
|
Abraham D, Jackson N, Gundara JS, Zhao J,
Gill AJ, Delbridge L, Robinson BG and Sidhu SB: MicroRNA profiling
of sporadic and hereditary medullary thyroid cancer identifies
predictors of nodal metastasis, prognosis, and potential
therapeutic targets. Clin Cancer Res. 17:4772–4781. 2011.
View Article : Google Scholar : PubMed/NCBI
|
|
28
|
Rossing M, Borup R, Henao R, Winther O,
Vikesaa J, Niazi O, Godballe C, Krogdahl A, Glud M, Hjort-Sørensen
C, et al: Down-regulation of microRNAs controlling tumourigenic
factors in follicular thyroid carcinoma. J Mol Endocrinol.
48:11–23. 2012. View Article : Google Scholar
|
|
29
|
Dettmer M, Perren A, Moch H, Komminoth P,
Nikiforov YE and Nikiforova MN: Comprehensive MicroRNA expression
profiling identifies novel markers in follicular variant of
papillary thyroid carcinoma. Thyroid. 23:1383–1389. 2013.
View Article : Google Scholar : PubMed/NCBI
|
|
30
|
Hellemans J and Vandesompele J: Selection
of reliable reference genes for RT-qPCR analysis. Quantitative
Real-Time PCR: Methods and Protocols, Methods in Molecular Biology.
1160. Biassoni R and Raso A: Springer Science Business Media; New
York: pp. 19–26. 2014, View Article : Google Scholar
|
|
31
|
Pallante P, Battista S, Pierantoni GM and
Fusco A: Deregulation of microRNA expression in thyroid neoplasias.
Nat Rev Endocrinol. 10:88–101. 2014. View Article : Google Scholar
|
|
32
|
Bargaje R, Hariharan M, Scaria V and
Pillai B: Consensus miRNA expression profiles derived from
interplatform normalization of microarray data. RNA. 16:16–25.
2010. View Article : Google Scholar :
|
|
33
|
Shen Y, Li Y, Ye F, Wang F, Wan X, Lu W
and Xie X: Identification of miR-23a as a novel microRNA normalizer
for relative quantification in human uterine cervical tissues. Exp
Mol Med. 43:358–366. 2011. View Article : Google Scholar : PubMed/NCBI
|
|
34
|
Thorenoor N and Slaby O: Small nucleolar
RNAs functioning and potential roles in cancer. Tumour Biol.
36:41–53. 2015. View Article : Google Scholar
|
|
35
|
Weber F, Teresi RE, Broelsch CE, Frilling
A and Eng C: A limited set of human MicroRNA is deregulated in
follicular thyroid carcinoma. J Clin Endocrinol Metab.
91:3584–3591. 2006. View Article : Google Scholar : PubMed/NCBI
|
|
36
|
Du L, Schageman JJ, Subauste MC, Saber B,
Hammond SM, Prudkin L, Wistuba II, Ji L, Roth JA, Minna JD, et al:
miR-93, miR-98, and miR-197 regulate expression of tumor suppressor
gene FUS1. Mol Cancer Res. 7:1234–1243. 2009. View Article : Google Scholar : PubMed/NCBI
|
|
37
|
Yang H, Kong W, He L, Zhao JJ, O'Donnell
JD, Wang J, Wenham RM, Coppola D, Kruk PA, Nicosia SV, et al:
MicroRNA expression profiling in human ovarian cancer: miR-214
induces cell survival and cisplatin resistance by targeting PTEN.
Cancer Res. 68:425–433. 2008. View Article : Google Scholar : PubMed/NCBI
|
|
38
|
Zhang XJ, Ye H, Zeng CW, He B, Zhang H and
Chen YQ: Dysregulation of miR-15a and miR-214 in human pancreatic
cancer. J Hematol Oncol. 3:462010. View Article : Google Scholar : PubMed/NCBI
|