Introduction
Tumor conquest remains a difficult problem for the
medical community. Malignant tumors severely threaten human health
and life. The key to tumor treatment is finding a specific target
and effectively inhibiting the source of the tumor. Finding cancer
stem cells makes targeted tumor tissue killing, tumor cure and
tumor recurrence and metastasis prevention possible. Through
profound research on the biological characteristics of cancer stem
cells (CSCs) and their mechanisms, a specific CSC-targeted
treatment represents a new method to cure cancer. The research on
CSCs is prospective but difficult. The proportion of CSCs in tumor
tissue is small, and most of them are in a stationary phase and are
only active in a specific tumor micro-environment in which they
directionally differentiate into a certain type of cancer cell.
Chemotherapy drugs only work on active cells that are in the
multiplication and division phases, which allows the CSCs in a
stationary phase to evade the effects of the drugs. In time, the
latent CSCs will multiply and differentiate into ordinary cancer
cells, which becomes the clinical origin of cancer recurrence and
metastasis after chemotherapy (1).
Therefore, a systematic understanding of the biological behavior,
gene phenotype, signal transduction pathways, and control
mechanisms for the multiplication and division of CSCs will help
improve the clinical rate of curing cancer.
For decades, scientists have tried to use different
methods to separate stem cells and have widely shown that CSCs
exist in different types of cancer tissues (2–4).
However, because some cancer tissues lack specific stem cell
surface markers, the separation and isolation of stem cells is
difficult and becomes a barrier for functional studies. The
development of side population cell research provides a new
direction for CSC research (5). It
has been found that side population cells exist not only in the
bone marrow hematopoietic system but also widely in other normal
tissues such as the nervous system, liver, spleen and even tumor
tissues (6,7). Like stem cells, side population cells
have not only a potential for self-renewal and multilineage
differentiation but also special phenotypic markers and biological
characteristics. The rapid Hoechst dye rejection feature of these
cells provides a more convenient method for stem cell research and
can be used as a separation method for CSCs that lack known surface
markers. Therefore, a side population cell separation method would
lay a solid foundation for more comprehensive research on CSCs.
In recent years, there has been a breakthrough in
microRNA (miRNA) research and a large number of miRNA molecules
have been identified. It has been shown that miRNAs play key
regulatory roles in the maintenance of cell surface phenotypes and
in the process of differentiation: i) miRNAs are evolutionarily
highly conserved molecules with clear cell and tissue specificity.
Approximately 1/3 of human genes can be regulated by miRNAs.
Therefore, miRNAs have a large impact on the balance of
intracellular signaling networks and in coordinating multi-gene
regulation (8–10). ii) miRNAs exhibit clear differences
in different cell types or even in different differentiation phases
of the same cell type and regulate cell differentiation. It has
been shown that miR-155 is involved in regulating T cell
differentiation (11). miR-221 and
miR-222 are involved in regulating red blood cell differentiation
(12). miR-124 is involved in
regulating the differentiation of the central nervous system
(13). miRNA-128 is enriched in
brain and may have biological functions and therapeutic potential
(14). miR-191 has been recently
reported to be abnormally expressed in several cancers and various
other diseases such as type-2 diabetes, Crohn's, pulmonary
hypertension and Alzheimer's (15).
iii) miRNAs are key molecules in the maintenance of cell
proliferation, phenotype and differentiation processes, and also
regulate tumorigenesis and metastasis of cancer cells or cancer
stem cells. The miR-92a family and miR-210 have a close
relationship with malignant tumors both in their development and
metastasis (16,17). miR-101 targets EZH2, MCL-1 and FOS
to suppress proliferation, invasion and the stem cell-like
phenotype of aggressive endometrial cancer cells (18). miR-146a enhances helicobacter
pylori-induced cell apoptosis in human gastric cancer
epithelial cells (19), and miR-338
and miR-30b inhibit the growth, invasion and metastasis of gastric
cancer (20,21). Overexpression of miR-203 in
esophageal cancer cells markedly increases cell apoptosis and
inhibits cell proliferation, migration and invasion as well as
tumor growth (22). Knockdown of
miR-214 promotes apoptosis and inhibits cell proliferation in
nasopharyngeal carcinoma (23).
miR-130b and miR-27a suppress the migration and invasion of
colorectal cancer cells (24,25).
miR-545 and miR-203 suppress cell proliferation and promote
apoptosis in lung cancer cells by targeting cyclin D1 and CDK4 or
by targeting SRC in lung cancer cells (26,27).
The lack of Dicer1 (the key enzyme in miRNA production) can lead to
a decrease in mouse embryonic stem cells and the death of mouse
embryos (28). miRNA molecules can
promote the conversion from the G1 phase to the S phase in stem
cells, thereby promoting their proliferation (29). In neural glioma stem cells,
overexpression of miR-124 and miR-137 can lead to the loss of
self-renewal and tumorigenicity (30), and the anti-apoptotic miRNAs
miR-582-5p and miR-363 promote human glioblastoma stem cell
survival via direct inhibition of caspase-3 and caspase-9 (31). In melanoma, miR-143 targets
syndecan-1 to repress cell growth (32). As miRNA molecules play an important
role in regulating stem cell differentiation, the identification of
which miRNA molecules play the decisive roles in different cell
types has become an impending problem of immediate concern.
The incidence of prostate cancer has remained high
worldwide, becoming a serious threat to human health, and is the
second most common cancer-related cause of death in males (33). In the United States, the incidence
of prostate cancer is the highest among male malignancies, and its
mortality rate is second only to lung cancer. Approximately 230,000
people are diagnosed with prostate cancer every year and 30,000 die
from it. The introduction of the prostate cancer stem cell theory
has provided a new thinking regarding prostate cancer treatment.
Early experiments in the literature have reported that specific
stem cell surface markers have not been found for common prostate
cancer cell lines such as LNCaP and TSU, which makes it difficult
to isolate prostate cancer stem cells. Therefore, the research on
prostate cancer stem cells is lagging in comparison to other
cancers. The objective of the present study was to identify
prostate cancer stem cells and determine the effects of modulating
specific miRNAs on prostate CSC proliferation and apoptosis. We
have used a side population cell separation method to separate SP
cells and the stem-like properties of SP cells have been identified
by in vivo and in vitro experiments, and a related
study was published (34). This
established a prostate cancer stem cell separation and
identification technology platform, and further applied biochip and
real-time quantitative PCR technology to separate prostate cancer
stem cell-specific miRNAs. By interfering with the expression of
miRNAs in CSCs, we can study the changes in the biological
functions of prostate cancer stems cells. These results may promote
the research and development of miRNA-targeted drugs and create a
new approach for the clinical treatment of prostate cancer.
Materials and methods
Cell culture
The human prostate cancer cell lines DU145, PC-3 and
LNCaP were purchased from the American Type Culture Collection
(ATCC; Manassas, VA, USA) and the TSU cell line was provided by the
Cancer Institute, Chinese Academy of Medical Sciences (Beijing,
China). All cell lines were conserved in our own laboratory. Cells
were cultured in media (TSU, DU145 and PC-3 used DMEM-F12; LNCaP
used RPMI-1640) (Gibco, Carlsbad, CA, USA) supplemented with 10%
fetal bovine serum (FBS; Gibco), 100 units/ml penicillin, and 0.1
mg/ml streptomycin at 37°C in a humidified 5% CO2
incubator. Cells were cultured for two or three passages and then
used for an experiment in the exponential phase of growth.
Flow cytometry
The generally accepted method for sorting side
population cells was utilized to identify and isolate SP fractions.
TSU, DU145, PC-3 and LNCaP cells were dissociated from culture
flasks with trypsin-EDTA (Beijing Neuronbc Laboratories, Co., Ltd.,
Beijing, China) and pelleted by centrifugation. The cells were
resuspended at 1×10⁶ cells/ml in pre-warmed culture
media (TSU, DU145 and PC-3 used DMEM-F12; LNCaP used RPMI-1640)
(Gibco) with 2% bovine serum albumin (BSA; Gibco) and 10 mmol/l
N-(2-hydroxyethyl)piperazine-N′-(2-ethanesulfonic acid) (HEPES).
Hoechst 33342 dye (Sigma-Aldrich, St. Louis, MO, USA) was added to
a final concentration of 5 µg/ml in the presence or absence
of 50 µM verapamil (Sigma-Aldrich), and cells were then
incubated at 37°C for 90 min. After incubation, the cells were
washed with ice-cold 1X PBS, pH 7.4 three times. Prior to analysis
or sorting, propidium iodide (2 µg/ml; Sigma-Aldrich) was
added immediately to discriminate dead cells and the cells were
filtered through 80 µm mesh (Becton-Dickinson Co., Franklin
Lakes, NJ, USA) to obtain a single cell suspension. Samples were
then analyzed using a BD LSR II 4-laser flow cytometer (BD
Biosciences, San Jose, CA, USA). The Hoechst 33342 dye was excited
at 355 nm and its fluorescence was dual-wavelength analyzed with
the emission for Hoechst blue at 445 nm and Hoechst red at 650
nm.
miRNA microarray assay
The different expression levels of miRNAs between
the SP cells and non-SP cells isolated from the TSU cell line were
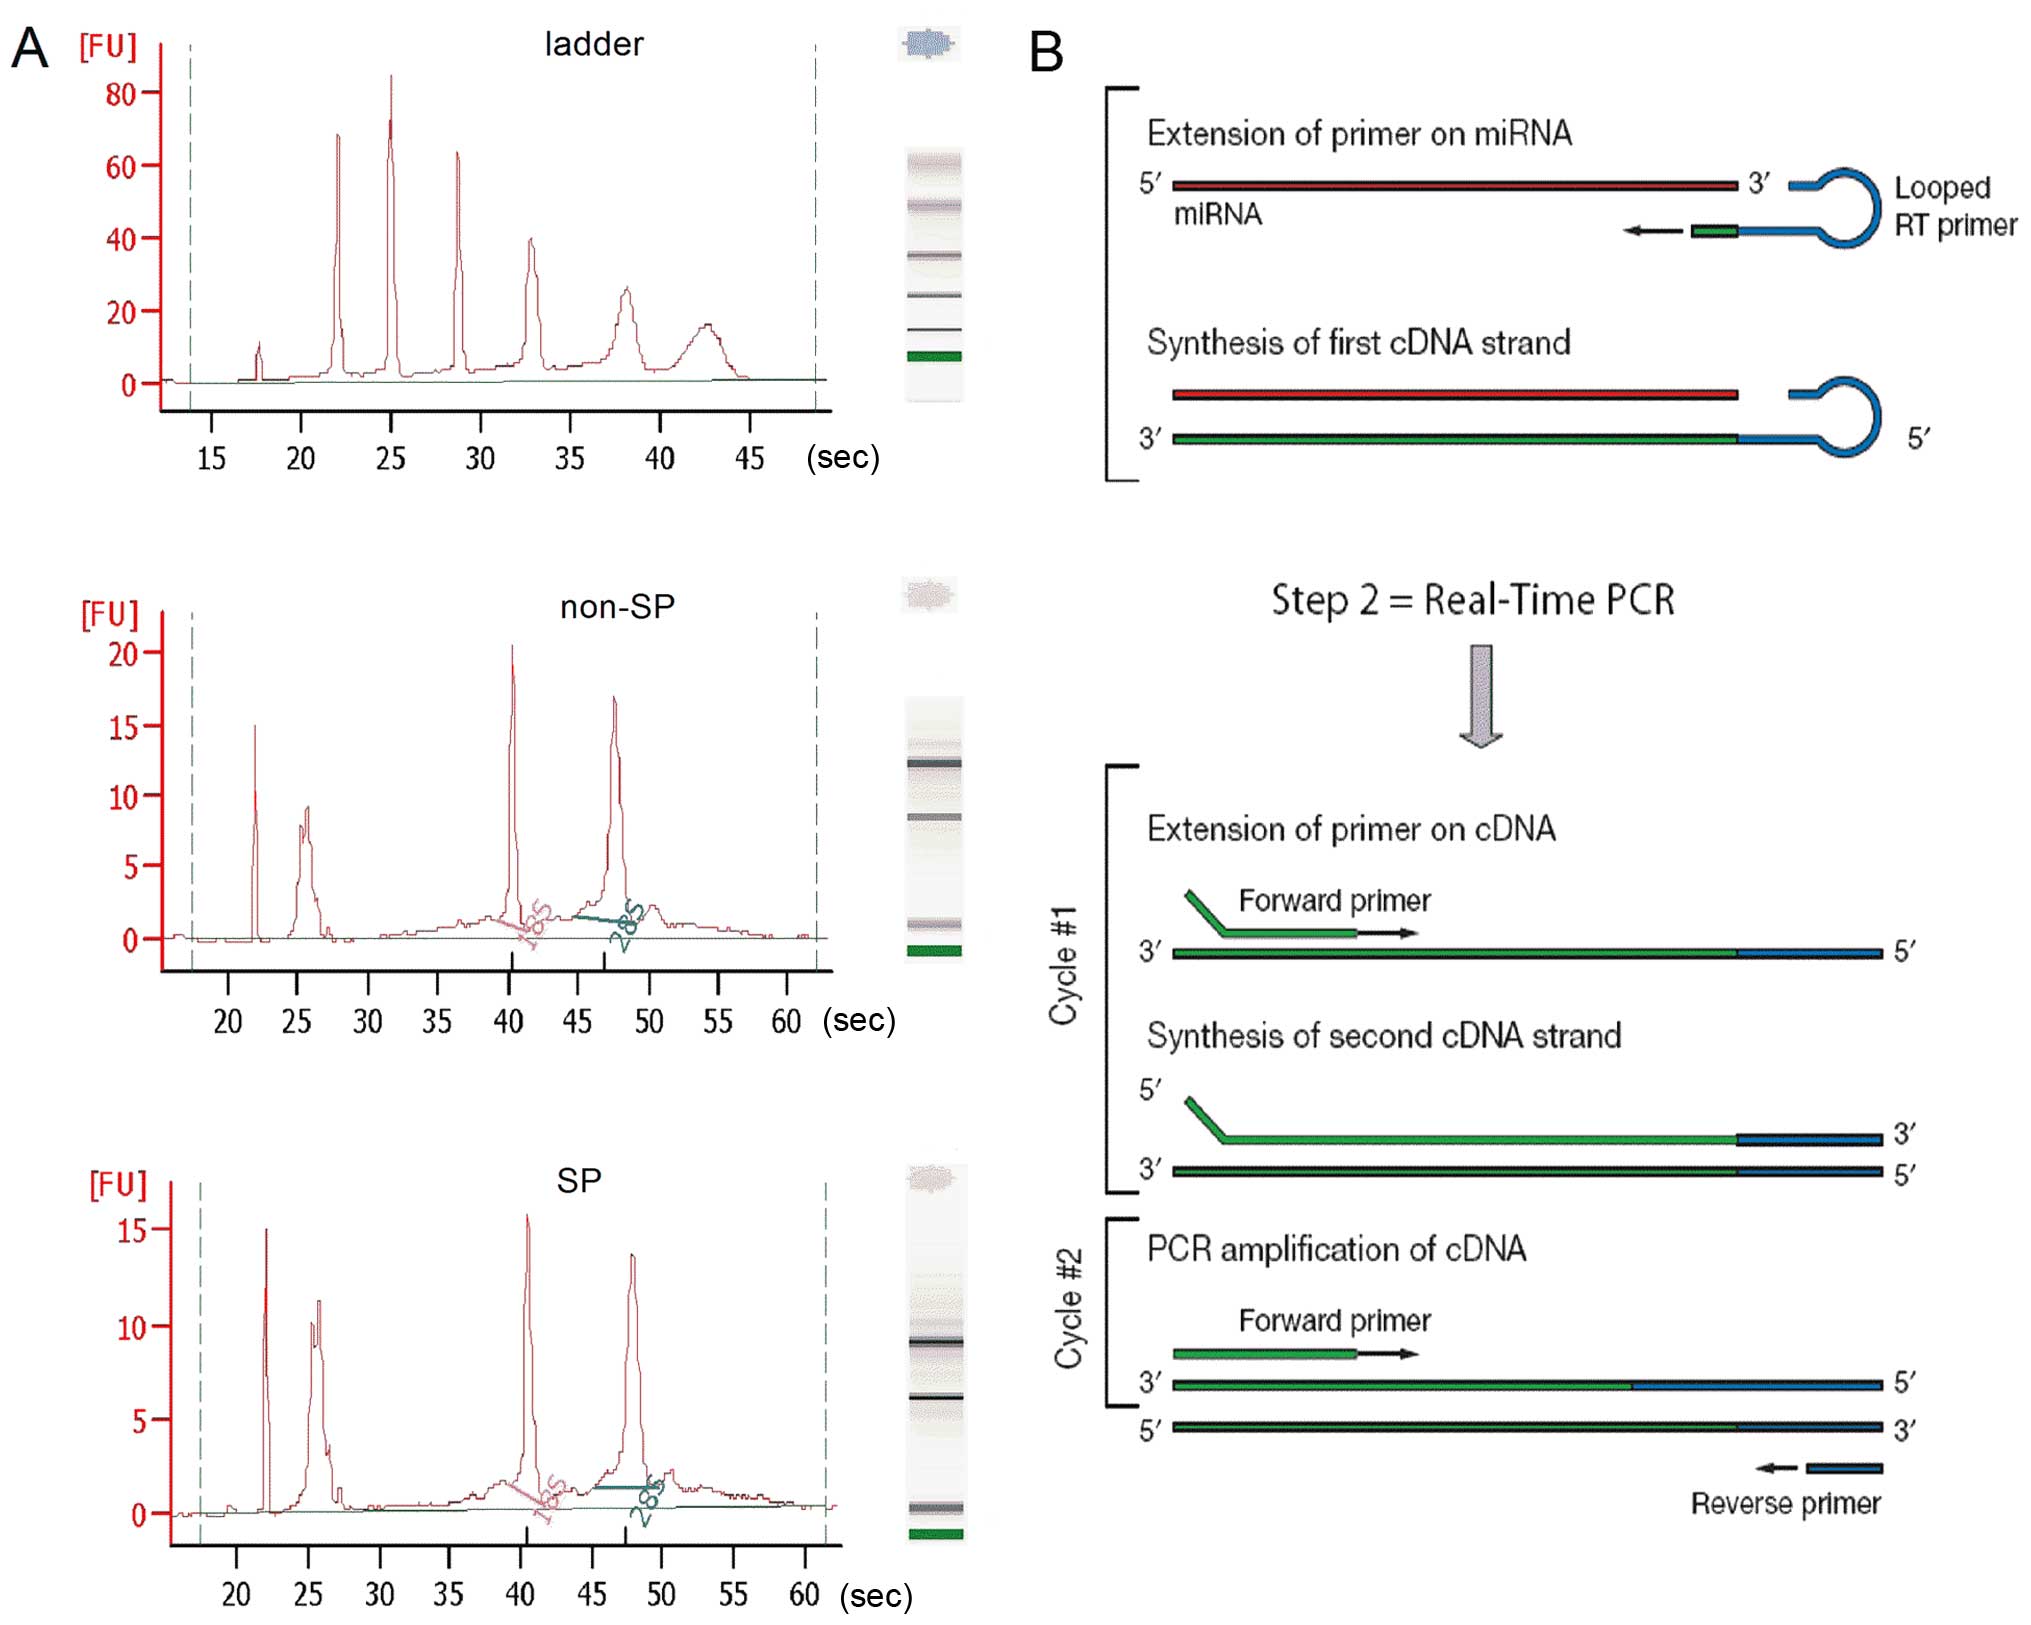
detected using a miRNA microarray. The results of the sample
quality control analysis are shown in Fig. 1A; the RNA concentration of the SP
group was 259 pg/µl, with an rRNA ratio [28s:18s] of 1.2;
the RNA concentration of the non-SP group was 256 pg/µl,
with an rRNA ratio [28s:18s] of 1.4 (Table I). All of these measurements met the
standard quality conditions for the microarray analysis. The
microarray assay was performed using a service provider (LC
Sciences, Houston, TX, USA). A total of 1208 types of miRNAs were
detected. The assay started from 2 to 5 µg of a total RNA
sample that was size fractionated using a YM-100 Microcon
centrifugal filter (from Millipore) and the small RNAs (<300 nt)
isolated were 3′-extended with a poly(A) tail using poly(A)
polymerase. An oligonucleotide tag was then ligated to the poly(A)
tail for later fluorescent dye staining; two different tags were
used for the two RNA samples in dual-sample experiments.
Hybridization was performed overnight on a µParaflo™
microfluidic chip using a micro-circulation pump (Atactic
Technologies, Inc., Houston, TX, USA). On the microfluidic chip,
each detection probe consisted of a chemically modified nucleotide
coding segment complementary to the target miRNAs (from miRBase,
http://miRNA.sanger.ac.uk/sequences/)
or other RNA (control or customer defined sequences) and a spacer
segment of polyethylene glycol to extend the coding segment away
from the substrate. The detection probes were made by in
situ synthesis using PGR (photogenerated reagent) chemistry.
The hybridization melting temperatures were balanced by chemical
modifications of the detection probes. The hybridization used 100
µl 6X SSPE buffer (0.90 M NaCl, 60 mM
Na2HPO4, 6 mM EDTA, ph 6.8) containing 25%
formamide at 34°C. After hybridization, signal detection was based
on fluorescent labeling using tag-specific Cy3 and Cy5 dyes.
Hybridization images were collected using a laser scanner (GenePix
4000B; Molecular Devices, Sunnyvale, CA, USA) and digitized using
Array-Pro image analysis software (Media Cybernetics, Rockville,
MD, USA). Data were analyzed by first subtracting the background
and then normalizing the signals using a LOWESS filter (Locally
weighted regression). For two-color experiments, the ratio of the
two sets of detected signals (log2 transformed,
balanced) and the P-values of the t-test were calculated;
differentially detected signals were those with P<0.01.
 | Table IThe RNA area, RNA concentration, and
rRNA ratio [28s/18s] of the SP and non-SP groups isolated from
TSU. |
Table I
The RNA area, RNA concentration, and
rRNA ratio [28s/18s] of the SP and non-SP groups isolated from
TSU.
| Ladder | Non-SP | SP |
|---|
| RNA area | 599.6 | 153.6 | 155.2 |
| RNA concentration
(pg/µl) | 1000 | 256 | 259 |
| rRNA ratio
[28s/18s] | | 1.4 | 1.2 |
RNA extraction and real-time PCR
qRT-PCR was performed to determine the different
expression levels of miRNAs between the SP and non-SP of TSU cells.
Total RNA was extracted from the corresponding cells using TRIzol
reagent (Invitrogen Life Technologies, Waltham, MA, USA). In the
reverse transcription (13) step,
complementary DNA (cDNA) was reverse transcribed from the total RNA
samples using specific miRNA primers and a TaqMan Reverse
Transcription kit (Applied Biosystems, Carlsbad, CA, USA). In the
real-time PCR step, PCR products were amplified from the cDNA
samples using the TaqMan miRNA Assay together with the TaqMan
Universal PCR Master Mix (Applied Biosystems) (Fig. 1B). An ABI PRISM 7000 Sequence
detection system (Applied Biosystems) was the main experimental
instrument. Using the comparative CT method, we used TaqMan
endogenous controls to normalize the expression levels of target
genes by correcting for differences in the amount of cDNA loaded
into the PCR reactions. Each sample was run in triplicate.
Oligonucleotide construction
The hsa-miR-149-3p-inhibition oligonucleotide was
chemosynthesized (Shanghai GenePhama Co., Ltd., Shanghai, China).
The sequence of the oligonucleotides used in the present study was
for the target sequence documented in the miRNA Registry database:
5′-GCACAGCCCCCGTCCCTCCCT-3′; synthesized hsa-miR-149-3p-inhibition:
5′-AATTCAAAAAAGGGAGGGACGGGGGCTGTGC-3′ and
5′-CCGGGCACAGCCCCCGTCCCTCCCTTTTTTG-3′.
The results of the vector construction
and lentiviral infection
To study the impact of the miRNA-149 downregulation
on the functional alteration of TSU-derived SP cells, we designed
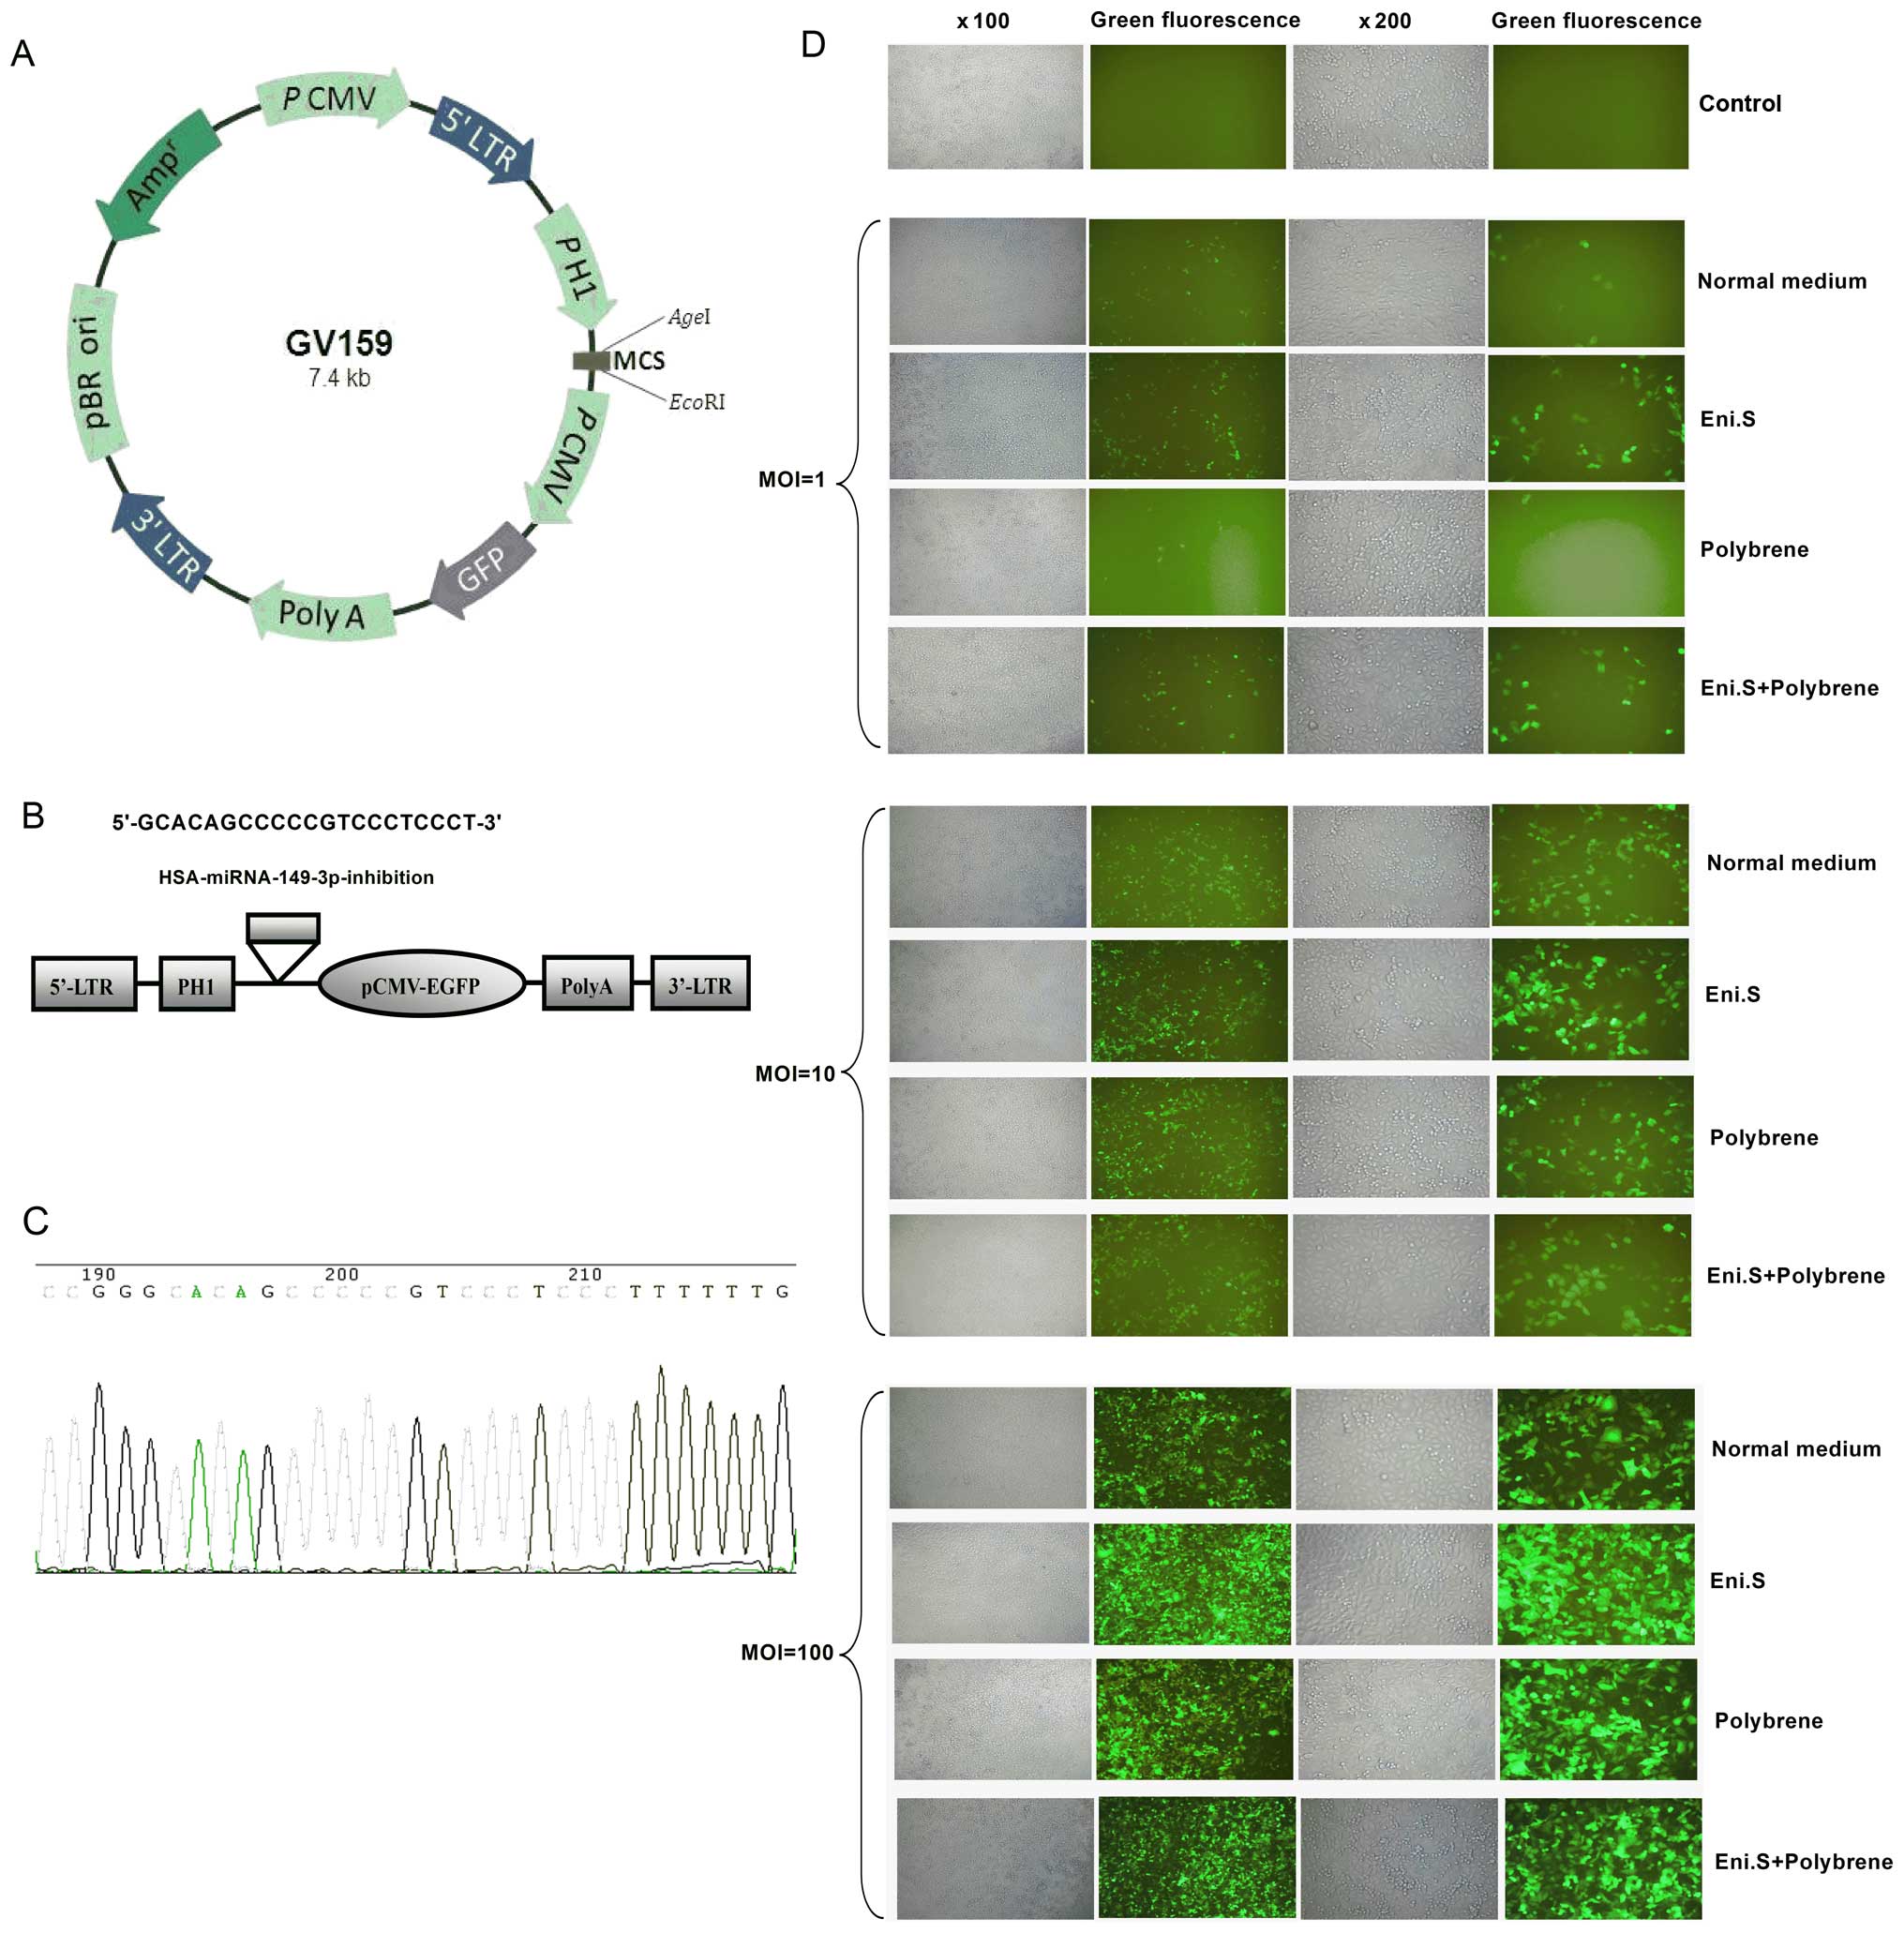
and constructed a miRNA-149-inhibition lentiviral vector. Fig. 2A shows the plasmid vector containing
green fluorescent protein (GFP). Fig.
2B demonstrates the synthesis of the desired gene fragment for
miRNA-149-inhibition. Synthetic oligonucleotides were as follows:
hsa-miR-149: 5′-UCUGGCU CCGUGUCUUCACUCCC-3′;
hsa-miR-149-3p-inhibition-a: 5′-AATTCAAAAAAGGGAGGGACGGGGGCTGTGC-3′;
hsa-miR-149-3p-inhibition-b: 5′-CCGGGCACAGCC
CCCGTCCCTCCCTTTTTTG-3′.
The desired plasmid was constructed via restriction
enzyme digestion, ligation and transformation. Fig. 2C depicts the sequencing results of
the constructed plasmid.
The sequencing primer:
5′-GGAAAGAATAGTAGACATAATAGC-3′. The constructed plasmid sequence:
5′-CAAAACAAATTACAAAAATTCAAAATTTTCGGGTTTATTACAGGGACAGCAGAGATCCAGTTTGGTTAGTACCGGGCCCGCTCTAGACTCGAGATATTTGCATGTCGCTATGGTTCTGGGAAATCACCATAAACGTGAAATGTCTTTGGATTTGGGAATCTTATAAGTTCTGTATGAGACCACTCACCGGGCACAGCCCCCGTCCCTCCCTTTTTTGAATTCGGATCCATTAGGCGGCCGCGTGGATAACCGTATTACCGCCATGCATTAGTTATTAATAGTAATCAATTACGGGGTATTAGTTCATGCCCATATATGGAGTTCCGCGTTACATAACTTACGGTAAATGGCCCGCCTGGCTGACCGCCCAACGACCCCCGCCCATTGACGTCAATAATGACGTATGTTCCCATAGTAACGCCAATAGGGACTTTCCATTGACGTCAATGGGTGGAGTATTTACGGTAAACTGCCCACTTGGCAGTACATCAAGTGTATCATATGCCAAGTACGCCCCCTATTGACGTCAATGACGGTAAATGGCCCGCCTGGCATTATGCCCAGTACATGACCTTATGGGACTTTCCTACTTGGCAGTACATCTACGTATTAGTCATCGCTATTACCATGGTGATGCGGTTTTGGCAGTACATCAATGGGCGTGGATAGCGGTTTGACTCACGGGGATTTCCAAGTCTCCACCCCATTGACGTCAATGGGAGTTTGTTTTGGCACCAAAATCAACGGGACTTTCCAAAATGTCGTAACAACTCCGCCCCATTGACGCAAATGGGCGGTAGGCGTGTACGGTGGGAGGTCTATATAAGCAGAGCTGGTTTAGTGAACCGTCAGATCCGCTAGCGCTACCGGACGCCACCATGGTGAGCAAGGGCGAGGAGCTGTTCACCGGGGTGGTGCCCATCCTGTCGAGCTGGACGGCGACGTAAACGCCACAAGTTCAGCGTGTCCGGCGAGGGCGAGGGCGATGCCACCTACGGCAAGCTGACCCTGAAGG-3′.
The constructed plasmid containing the gene fragment
miRNA-149-inhibition was packaged into and produced as a
lentivirus, which was used to infect cells. The viral titer was
2.5E +9. Fig. 2D shows the 4
different conditions for the miRNA-149-inhibition lentiviral
infection of TSU-derived SP cells. The optimal infection condition,
with an infection efficiency of up to 80%, was Eni.S; MOI
20–50.
Vector constructs and lentivirus
production
The chemosynthesized hsa-miR-149-3p-inhibition
oligonucleotide and the vector GV159 (Shanghai Genechem, Co., Ltd.,
Shanghai, China) were digested with the restriction enzymes
AgeI and EcoRI, respectively, and then connected with
ligase. After transforming into DH5α, the
pGCsil-GFP-hsa-miR-149-3p-inhibition clone was verified by
sequencing. The sequencing primer was constructed as follows:
5′-GGAAAGAATAGTAGACATAATAGC-3′. The newly constructed clone
pGCsil-GFP-hsa-miR-149-3p-inhibition and the negative control
pGCsil-GFP-NC were amplified. Virus packaging was performed in HEK
293T cells after the co-transfection of 20 mg
pGCsil-GFP-hsa-miR-149-3p-inhibition vector or pGCsil-GFP-NC vector
with 15 mg of the packaging plasmid pHelper 1.0 vector and 10 mg of
the envelope plasmid pHelper 2.0 vector using Lipofectamine 2000
(Invitrogen). Viruses were harvested 48 h after transfection, named
pGCsil-GFP-hsa-miR-149-3p-inhibition-LV and pGCsil-GFP-NC-LV,
respectively, and the viral titers were determined.
Cell infection
SP cells isolated from the TSU cell line were
cultured to 30–50% confluency for the stable infection of cells
after being seeded into 96-well plates and were infected in 4
different infection conditions: normal complete media; normal
complete media with 5 µg/ml polybrene; ENi.S media (Shanghai
GeneChem); and ENi.S media with 5 µg/ml polybrene. In each
infection condition, three different gradient MOI were operated,
including MOI=1; MOI=10 and MOI=100. After 72-h infection, the
cells were harvested for further experimentation.
Cell proliferation assays
To compare a change in cell proliferation potential
when the expression level of miRNA-149 was downregulated in
TSU-derived SP cells, the MTT method was utilized to detect the
ability of cell proliferation. Three different groups were designed
to fulfill this experiment, including the SP cells derived from TSU
that were infected with pGCsil-GFP-hsa-miR-149-3p-inhibition-LV
(miRNA down group), the SP cells derived from TSU that were
infected with pGCsil-GFP-NC-LV (negative control), and uninfected
SP cells derived from TSU (control). Each group of cells was
cultured in the logarithmic growth phase, counted and diluted to
20,000 cells/ml using complete media. One hundred microliters of
cells (2,000 total cells) were added to each well (96-well culture
plates) and incubated overnight. Each group was split into three
duplicate wells. After 24 h of culture, 10 µl of 5 mg/ml MTT
was added to each well. The cells were incubated for 4 h at 37°C;
then, the media was carefully removed and replaced with 100
µl DMSO to terminate the reaction. All of the experimental
steps were performed aseptically. Cells were agitated on an orbital
shaker for 10 min and the absorbance was read at 490 nm with the
microplate reader (BioTek Elx800; BioTek Instruments, Inc.,
Winooski, VT, USA). The same method was used for additional 96-well
culture plates to detect the absorbance at 490 nm after 48, 72, 96
and 120 h.
Colony formation assays
To detect the impact of miRNA-149 downregulation on
the colony formation potential of TSU-derived SP cells, colony
formation assays were utilized. The miRNA down group consisted of
the SP cells derived from TSU that were infected with
pGCsil-GFP-hsa-miR-149-3p-inhibition-LV; the negative control group
was the SP cells derived from TSU that were infected with
pGCsil-GFP-NC-LV; and the control group was the SP cells derived
from TSU. Each group of cells was cultured in the logarithmic
growth phase, digested and counted. A total of 800 cells were added
into each well (6-well culture plates) and incubated. Each group
contained three duplicate wells. The media was changed and the
cells were observed every 3 days. When the number of cells in most
colonies was >50 (~14 days), the cell clones were photographed
using a fluorescence microscope (Olympus MicroPublishe 3.3 RTV;
Olympus, Tokyo, Japan) and then the culture was terminated. The
cells were washed once with PBS, then 1 ml of paraformaldehyde was
added to each well and fixed for 45 min and washed once with PBS. A
500 µl aliquot of Giemsa dye (ECM550; Chemicon
International, Inc., Temecula, CA, USA) was added to each well and
stained for 20 min. The cells were washed several times with
ddH2O until the background was clear and dried. The
entire 6-well culture plates were photographed with a digital
camera and images of the monoclonals were acquired using a
microscope.
Cell apoptosis assays
Cells from the three groups were cultured in the
same conditions, and the same number of cells was collected from
the three groups and performed in triplicate. The entire
experimental process was carried out in accordance with the
instructions for the Apoptosis Detection kit (eBioscience 88-8007;
eBioscience, Inc., San Diego, CA, USA). All the groups were
analyzed using flow cytometry (FACSCalibur; BD Biosciences) within
4 h.
Cell cycle assays
Cells from the three groups were cultured to 80%
confluency. Then, 2×10⁶ cells from each group (in
triplicate) were collected and pelleted by spinning at 1,000 rpm,
at 4°C for 5 min. The cell pellets were resuspended in 1 ml of cold
PBS and fixed by adding 4 ml of −20°C absolute ethanol. The cells
were stored at −20°C in this fixation buffer until further
analysis. The fixed cells were centrifuged (as above) and
resuspended in 1 ml of PBS. A 100 µl aliquot of 200
µg/ml DNase-free, RNaseA was added, and the suspension was
incubated at 37°C for 30 min. Then, 100 µl of 1 mg/ml
propidium iodide (light sensitive) was added and incubated at room
temperature for 10 min. The samples were transferred to 12×75
Falcon tubes and read on a BD FACSCalibur (BD Biosciences).
In vivo tumor formation model
To determine whether there are differences in the
tumorigenic potential and tumor growth when miRNA-149 was
downregulated in TSU-derived SP cells, male nude mice (nu/nu
genotype) 5 weeks of age were purchased from Vital River Laboratory
Animal Technology Co., Ltd., Beijing, China. All animals were
housed in an air-conditioned room under specific pathogen-free
(SPF) conditions at 22±2°C and 55±5% humidity with a 12-h
light/dark cycle. Food and tap water were available at all times.
All operations were carried out under the approval of the Capital
Medical University Animal Experiments and Experimental Animals
Management Committee, China. Experimental procedures conformed to
animal welfare and minimized pain and suffering and the use of
fewer animals. Twelve mice were divided into 3 groups. Each group
of cells was suspended in serum-free DMEM-F12 media. Then
3×10⁵ cells in a volume of 100 µl were injected
subcutaneously into the flanks of immune-compromised nude mice for
each of the three cell groups to evaluate their tumorigenic
activity and tumor growth. The mice were monitored daily for the
appearance of subcutaneous tumors from the second day after the
injection. For all mice, the tumor size was measured every 5 days
from the 2nd day after the injection. After 37 days, the mice were
sacrificed by cervical dislocation under chloral hydrate
anesthesia, the tumor tissues were collected and the tumor volume
was calculated using the following formula: 0.52 × length ×
width2. Immunohistochemistry images for H&E
staining, Ki-67 staining and Bax staining in the three groups.
Immunohistochemistry
The tumors were harvested at 37 days, and fixed in
10% formaldehyde solution, then embedded in paraffin. Sections (5
mm thick) that had been deparaffinized and rehydrated were stained
with hematoxylin and eosin. Proliferating tumor cells were stained
by Ki-67. Apoptotic tumor cells were stained by Bax. Images were
collected by using microscope with ×100 magnification.
Statistical analysis
A Student's t-test (two-tailed) one-way ANOVA and
Mann-Whitney test were employed to analyze the data using the SPSS
12.0 software (SPSS, Inc., Chicago, IL, USA). A P-value of 0.05 was
defined as being statistically significant, P<0.05;
P<0.01.
Results
The existence of a SP in prostate cancer
cells
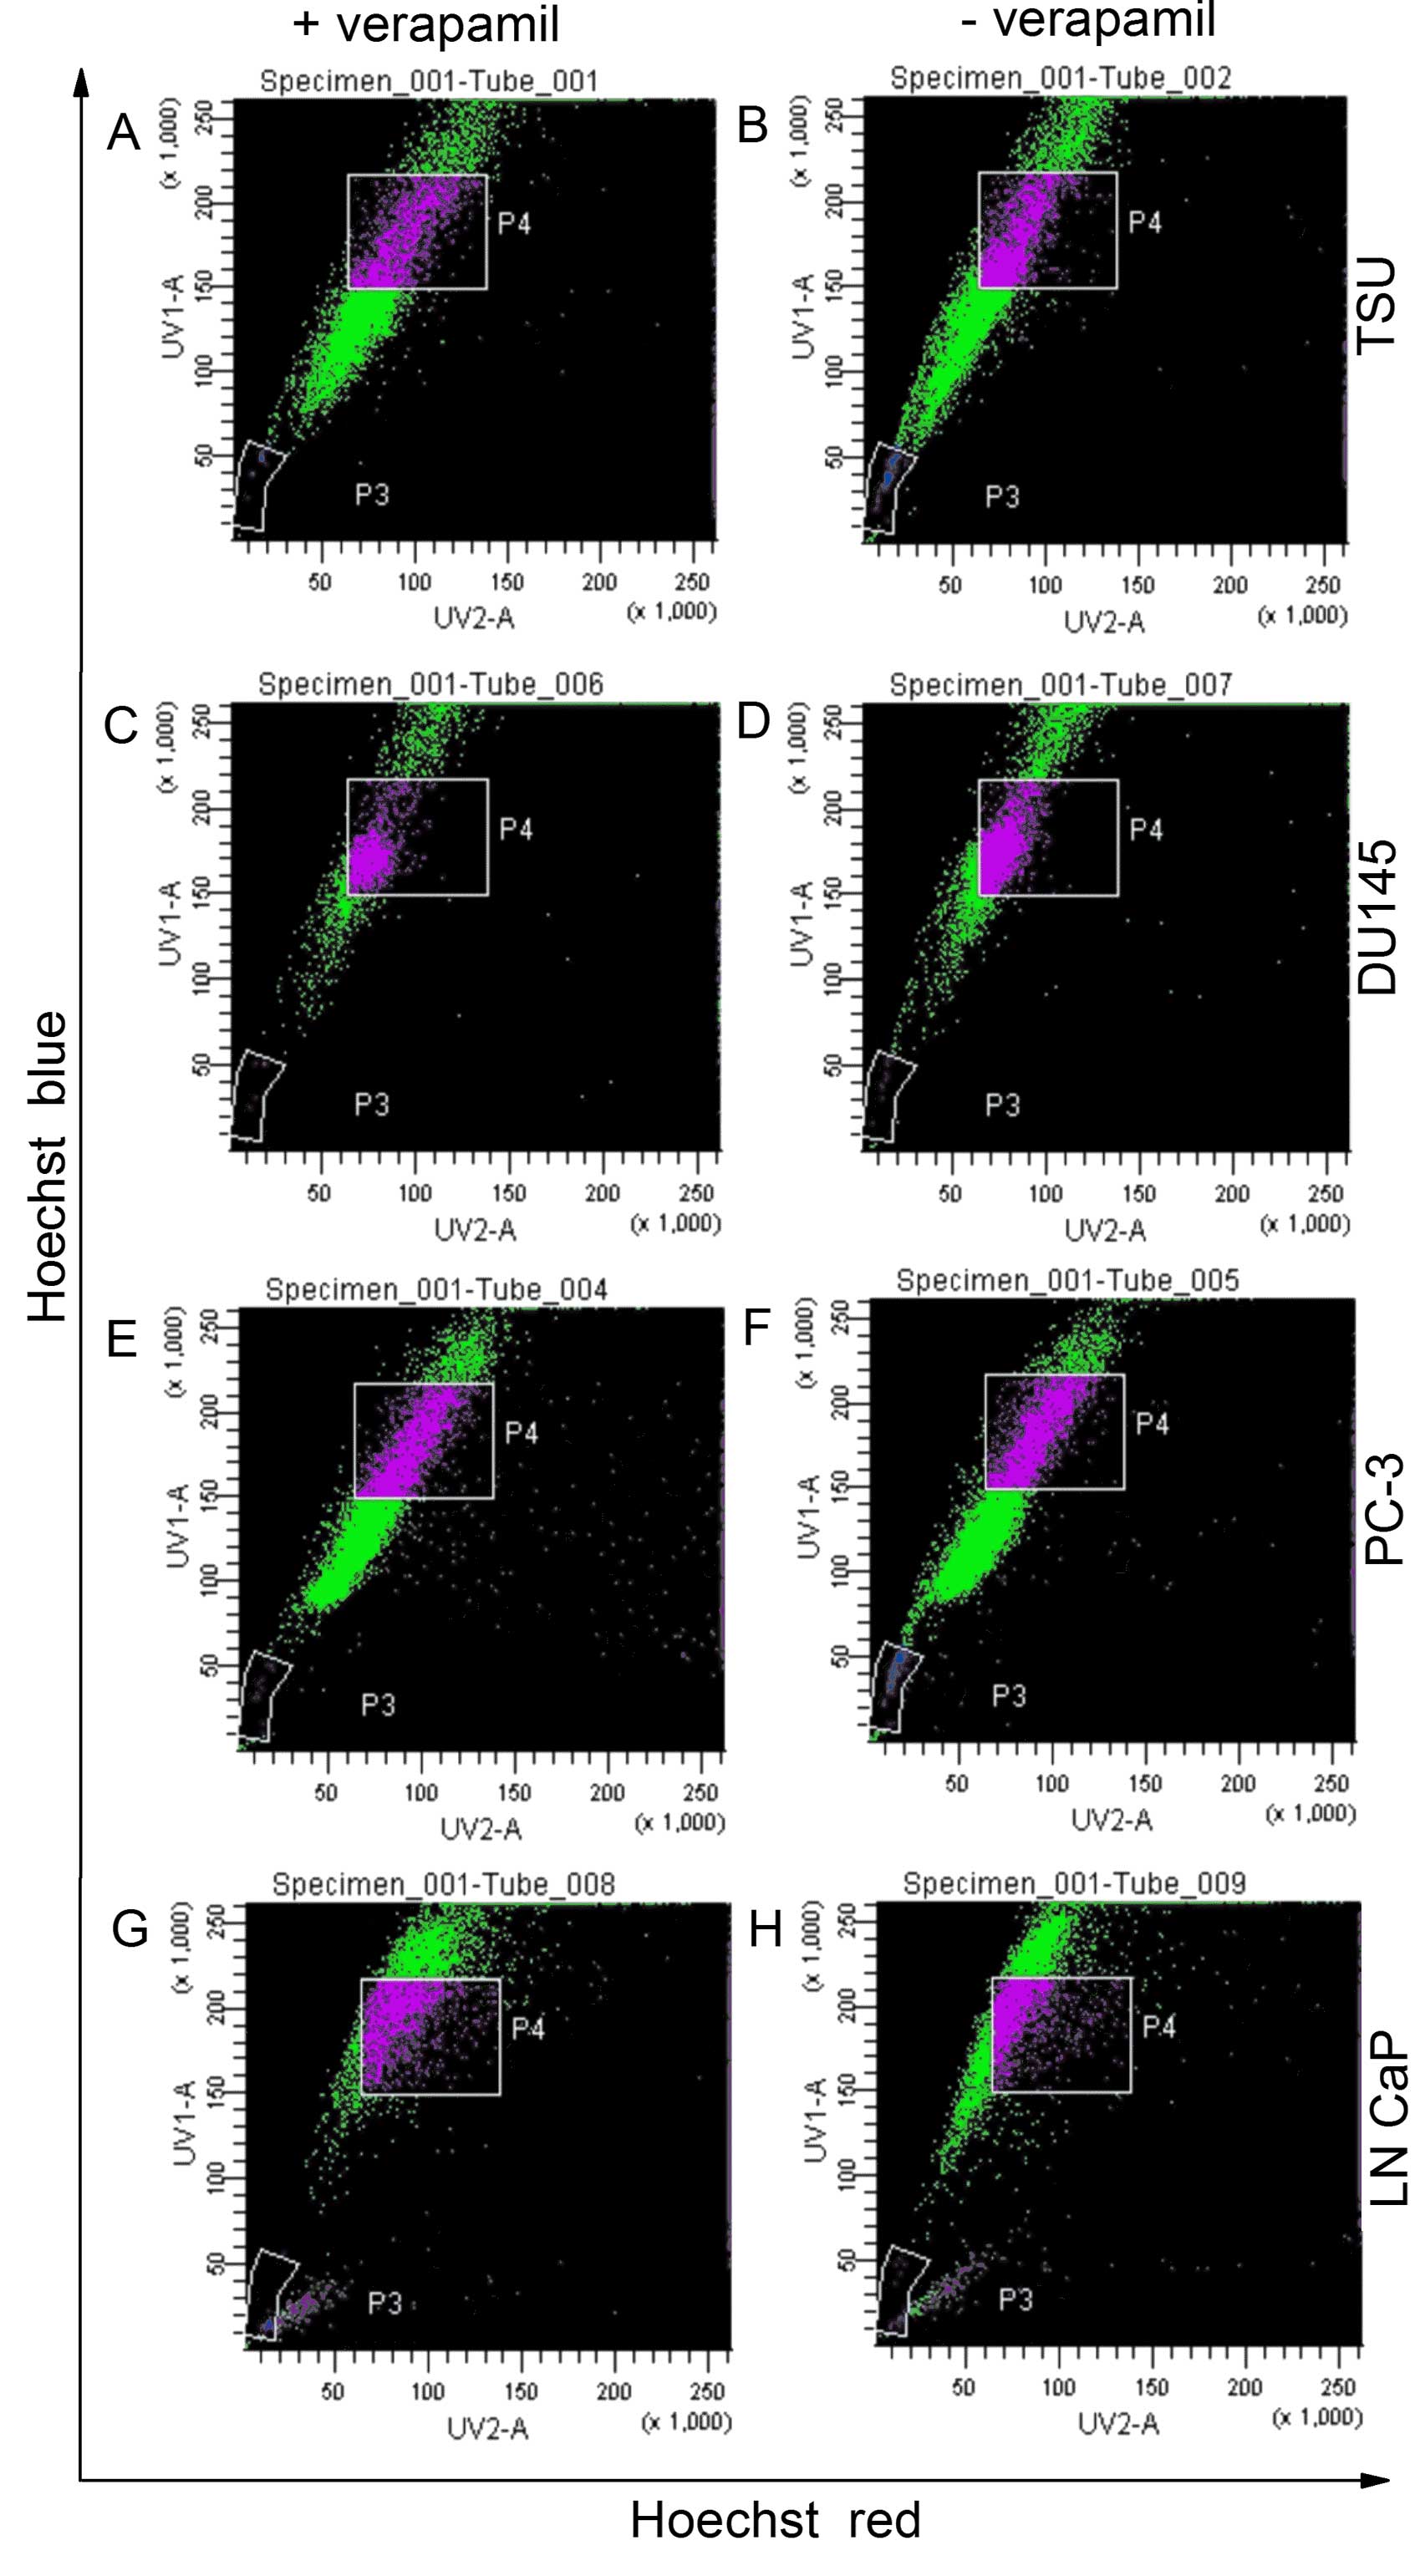
The existence of an SP fraction in prostate cancer
cells was confirmed by staining with Hoechst 33342 dye to generate
a Hoechst blue-red profile. A small fraction of low-fluorescing
cells in the lower-left region of each profile was gated as the SP.
The appearance of this fraction was blocked by verapamil, an ABC
transporter inhibitor. TSU cells contained a distinct fraction as
an SP. In contrast, DU145, PC-3 and LNCaP cells had a much smaller
SP fraction (Fig. 3). The SP
proportion of TSU cells was calculated to be 1.60±0.40% (mean ±
SD), while that of DU145, PC-3 and LNCaP cells was 0.60±0.05,
0.80±0.05 and 0.60±0.20%, respectively (Table II). Once identified, the cells
within the SP gate were sorted into a flow tube by FACS.
| Table IIThe mean SP proportion of TSU, DU145,
PC-3 and LNCaP (P<0.01). |
Table II
The mean SP proportion of TSU, DU145,
PC-3 and LNCaP (P<0.01).
| Cells | SP proportion (mean
± SEM) |
|---|
| TSU | 1.60±0.40% |
| DU145 | 0.60±0.05% |
| PC-3 | 0.80±0.05% |
| LNCaP | 0.60±0.20% |
Identification of stem-like properties in
side population cells sorted from the TSU prostate cancer cell
line
The stem-like properties of SP cells from TSU were
identified by in vivo and in vitro experiments, and a
related study was published (34).
Expression profiling of miRNAs between
TSU-derived SP cells and non-SP cells
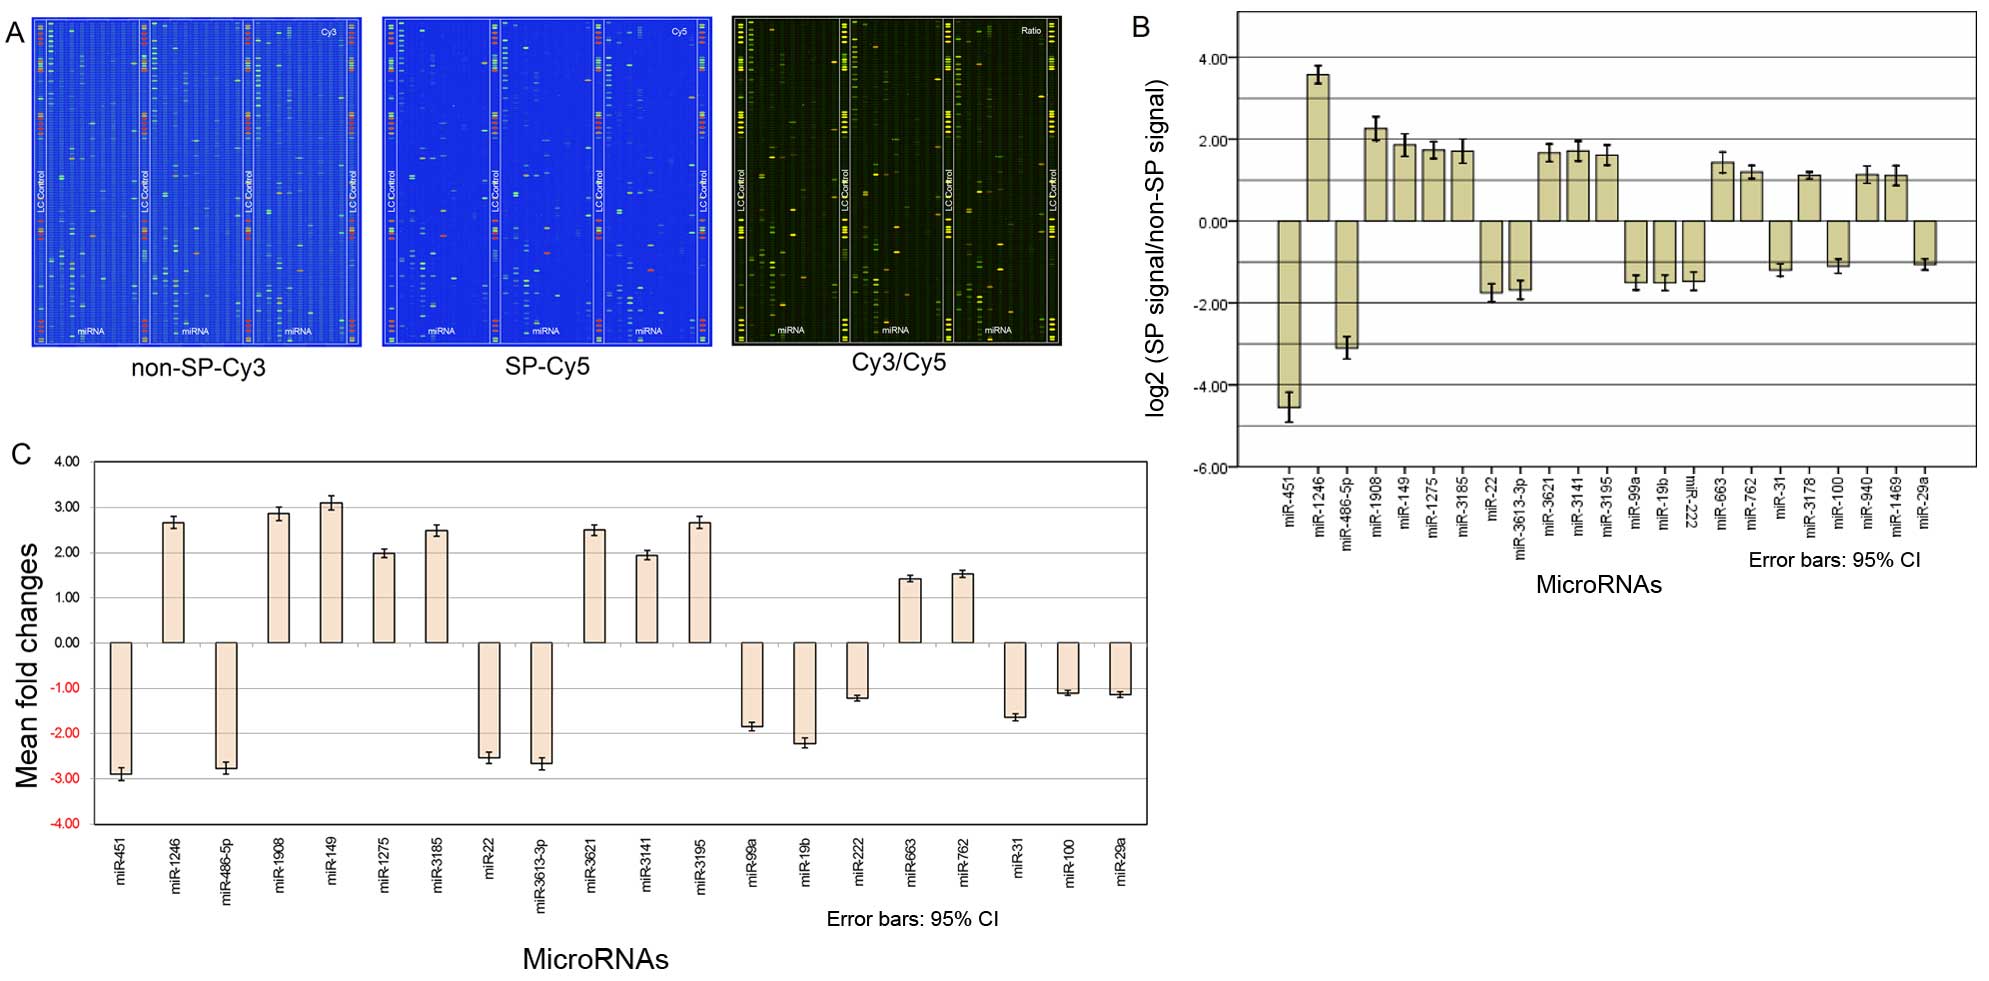
Dual-channel miRNA biochips from LC Sciences were
used to analyze the differences in the miRNA expression profiles
between the SP cells and non-SP cells isolated from the TSU cell
line. Fig. 4A presents an image of
the microarray experiments and demonstrates the results of the
comparative analysis of the miRNA expression profiling of the two
groups. In total, 53 significantly differentially expressed miRNAs
were listed (Table III), and only
a subset of the results were screened (Fig. 4B). Twenty miRNAs are significantly
upregulated in SP, in which the most significantly upregulated
miRNAs are hsa-miR-1246, hsa-miR-1908, hsa-miR-149. Thirty-three
miRNAs are significantly downregulated in SP, in which the most
significantly downregulated miRNAs are hsa-miR-451, hsa-miR-486-5p
and hsa-miR-22. The greater the absolute value of the
log2 (hybridization signal of the SP group/hybridization
signal of the non-SP group), the greater the difference between the
two groups, and the easier it is to distinguish the cancer stem
cell-specific miRNAs. In addition to considering the multiple
relationships of the signal strengths, the arithmetic difference of
the signal intensity is also important to assess the difference
between the two groups. The greater the arithmetic difference, the
greater the significance.
| Table IIISignificant differentially expressed
microRNAs in SP compared with non-SP (P<0.01). |
Table III
Significant differentially expressed
microRNAs in SP compared with non-SP (P<0.01).
| microRNAsa | Non-SP
signalb | SP signalc | log2 (SP
signal/non-SP signal)d | P-valuee |
|---|
| 20 miRNAs
upregulated | | | | | |
| hsa-miR-1246 | 21.99 | 221.26 | 3.60 | 1.46E-04 |
| hsa-miR-1908 | 49.85 | 242.91 | 2.28 | 1.08E-05 |
| hsa-miR-149 | 621.39 | 2,228.20 | 1.87 | 2.22E-16 |
| hsa-miR-1275 | 330.53 | 1,141.12 | 1.76 | 1.32E-13 |
| hsa-miR-3185 | 542.63 | 1,866.65 | 1.76 | 8.88E-16 |
| hsa-miR-3621 | 367.35 | 1,262.98 | 1.69 | 2.51E-10 |
| hsa-miR-3141 | 788.83 | 2,713.54 | 1.68 | 3.33E-16 |
| hsa-miR-3195 | 353.59 | 1,030.08 | 1.58 | 6.12E-11 |
| hsa-miR-663 | 2,649.39 | 7,227.58 | 1.45 | 1.74E-08 |
| hsa-miR-762 | 3,379.81 | 7,789.94 | 1.20 | 7.70E-04 |
| hsa-miR-3178 | 2,989.62 | 6,215.48 | 1.11 | 1.65E-14 |
| hsa-miR-940 | 96.21 | 200.12 | 1.10 | 4.32E-03 |
| hsa-miR-1469 | 3,533.57 | 7,305.28 | 1.08 | 8.23E-12 |
| hsa-miR-2861 | 2,736.42 | 5,341.13 | 0.96 | 3.33E-16 |
| hsa-miR-4281 | 4,284.57 | 7,921.97 | 0.96 | 8.70E-07 |
| hsa-miR-1915 | 4,431.97 | 8,047.89 | 0.86 | 8.20E-14 |
| hsa-miR-3656 | 11,330.38 | 18,409.56 | 0.69 | 7.11E-15 |
| hsa-miR-638 | 13,600.24 | 19,788.46 | 0.58 | 8.01E-03 |
| hsa-miR-3196 | 11,054.43 | 15,807.10 | 0.55 | 9.72E-04 |
| hsa-miR-3665 | 31,401.19 | 40,456.65 | 0.42 | 2.90E-11 |
| 33 miRNAs
downregulated | | | | | |
| hsa-miR-451 | 344.64 | 16.49 | −4.57 | 5.33E-15 |
| hsa-miR-486-5p | 266.95 | 34.91 | −3.06 | 6.98E-14 |
| hsa-miR-22 | 315.21 | 96.19 | −1.71 | 1.68E-06 |
|
hsa-miR-3613-3p | 2,585.51 | 822.50 | −1.70 | 2.99E-06 |
| hsa-miR-99a | 328.12 | 114.31 | −1.52 | 2.98E-06 |
| hsa-miR-19b | 209.96 | 73.48 | −1.49 | 6.49E-05 |
| hsa-miR-222 | 5,649.12 | 2,043.55 | −1.47 | 4.94E-05 |
| hsa-miR-31 | 661.67 | 283.37 | −1.19 | 4.33E-07 |
| hsa-miR-100 | 4,518.84 | 2,098.59 | −1.10 | 5.55E-16 |
| hsa-miR-29a | 5,529.50 | 2,599.13 | −1.05 | 3.26E-06 |
| hsa-miR-125b | 3,314.44 | 1,667.47 | −0.99 | 1.78E-13 |
| hsa-miR-221 | 2,701.58 | 1,377.80 | −0.98 | 1.11E-16 |
| hsa-miR-27a | 1,538.29 | 818.39 | −0.94 | 1.64E-09 |
| hsa-miR-17 | 1,736.28 | 944.55 | −0.89 | 5.00E-10 |
| hsa-miR-24 | 3,914.53 | 2,113.81 | −0.88 | 2.90E-12 |
| hsa-miR-16 | 3,982.38 | 2,191.03 | −0.86 | 5.95E-14 |
| hsa-miR-1280 | 7,249.43 | 4,059.76 | −0.84 | 1.55E-15 |
| hsa-miR-1260b | 2,453.50 | 1,379.86 | −0.82 | 3.69E-11 |
| hsa-miR-106a | 1,585.07 | 913.50 | −0.80 | 9.34E-08 |
| hsa-miR-30a | 598.77 | 359.81 | −0.72 | 2.84E-05 |
| hsa-miR-23b | 11,820.23 | 7,363.01 | −0.69 | 1.11E-16 |
| hsa-miR-23a | 17,287.14 | 11,471.30 | −0.64 | 8.22E-12 |
| hsa-miR-191 | 1,904.74 | 1,257.13 | −0.63 | 1.92E-05 |
| hsa-miR-107 | 1,144.24 | 751.05 | −0.62 | 7.16E-04 |
| hsa-miR-20a | 1,855.18 | 1,222.77 | −0.60 | 3.92E-07 |
| hsa-miR-103 | 1,356.94 | 934.27 | −0.57 | 3.86E-05 |
| hsa-let-7a | 11,124.80 | 7,747.60 | −0.55 | 4.23E-13 |
| 33 miRNAs
downregulated | | | | | |
| hsa-miR-92a | 4,273.21 | 3076.71 | −0.52 | 1.33E-12 |
| hsa-miR-320a | 1,672.15 | 1,246.14 | −0.43 | 5.09E-04 |
| hsa-let-7d | 5,945.60 | 4,671.88 | −0.35 | 6.94E-08 |
| hsa-miR-21 | 20,993.52 | 16,794.82 | −0.31 | 1.12E-13 |
| hsa-let-7c | 6,075.31 | 4,871.67 | −0.30 | 1.10E-03 |
| hsa-let-7f | 5,936.56 | 5,009.06 | −0.29 | 6.21E-04 |
qRT-PCR validation results
Given the high accuracy and specificity of the
TaqMan probe method, and due to the limitations of the probes
themselves, majority of the miRNAs were selected for further
verification. Among the 53 significantly differentially expressed
miRNAs identified in the biochips experiments, the top ten most
significantly differentially expressed ones in downregulated and
upregulated miRNAs were further validated using qRT-PCR
experiments. The results are shown in Fig. 4C, the P-values of hsa-miR-451,
hsa-miR-1246, hsa-miR-486-5p, hsa-miR-1908, hsa-miR-149,
hsa-miR-1275, hsa-miR-3185, hsa-miR-22, hsa-miR-3613-3p,
hsa-miR-3621, hsa-miR-3141, hsa-miR-3195, hsa-miR-99a, hsa-miR-19b,
hsa-miR-222, hsa-miR-663, hsa-miR-762, hsa-miR-31, hsa-miR-100, and
hsa-miR-29a for the comparison between the SP and non-SP groups
were 5.96E-02, 2.68E-01, 6.48E-02, 3.54E-02, 6.04E-03, 6.68E-01,
4.25E-02, 8.54E-03, 5.25E-02, 6.36E-01, 7.35E-01, 5.28E-01,
6.26E-02, 5.16E-01, 2.48E-01, 2.58E-01, 6.88E-03, 8.24E-02, 4.42
E-01 and 4.22E-01, while the fold changes were −2.89, 2.66, −2.76,
2.85, 3.09, 1.98, 2.48, −2.53, −2.66, 2.49, 1.94, 2.66, −1.84,
−2.21, −1.22, 1.42, 1.53, −1.64, −1.10 and −1.14, respectively. In
accordance with the standard that the difference is significant and
meaningful when the fold change is >3.0 and P-values <0.01,
hsa-miR-149 was identified as being significantly upregulated in
TSU-derived SP cells.
The downregulation of miRNA-149 leads to
a reduction in proliferation and an increase in apoptosis in
TSU-derived SP cells
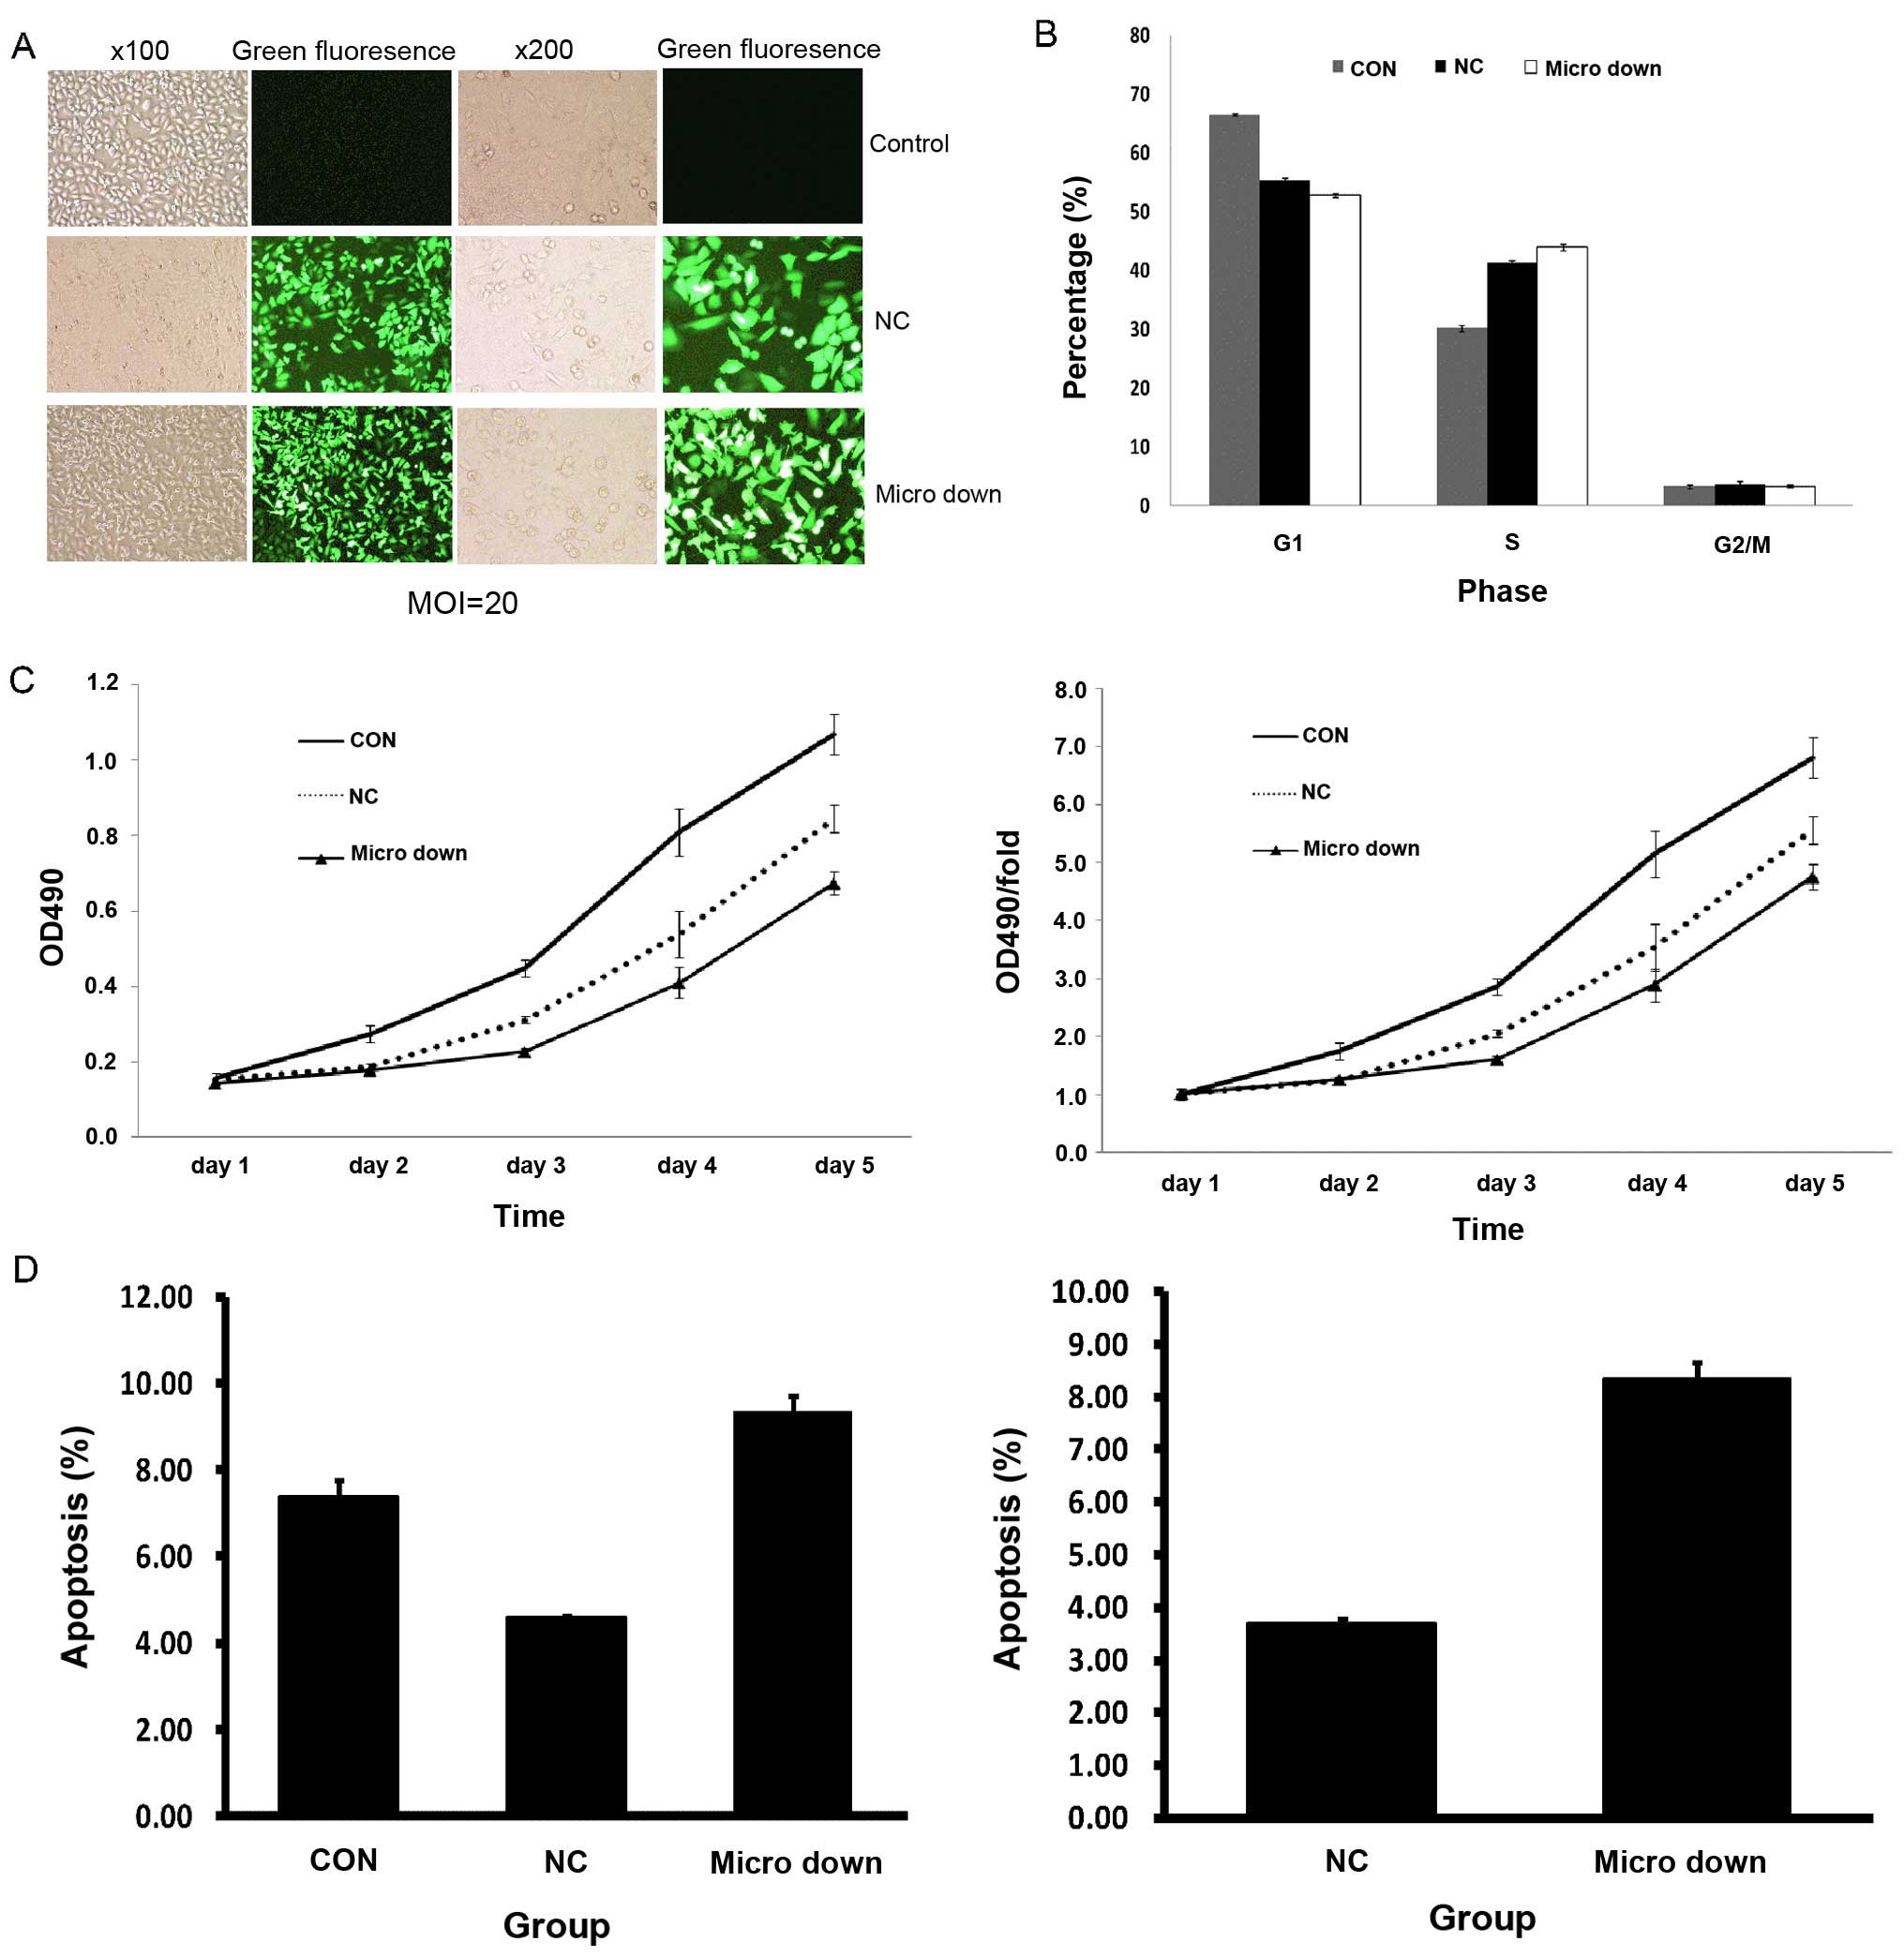
The experimental design was grouped as follows:
TSU-derived SP cells that were not infected (control); TSU-derived
SP cells that were infected with the lentiviral vector alone
(negative control); and TSU-derived SP cells that were infected
with the constructed lentivirus containing the miRNA-149-inhibition
fragment (micro down). Fig. 5A
shows representative images of the three groups, which were treated
under the same conditions, including media, culture time and MOI
(MOI=20). Fig. 5B shows the results
of the cell cycle assay. The number of cells in the S phase was
significantly greater in the micro down group than the other two
groups; for the G1 phase, the number of cells in the micro down
group was significantly less than the control group, and slightly
less than the negative control group; and there was no significant
difference in the number of cells in the G2/M phase among the three
groups. Fig. 5C depicts the results
of the MTT assay. The OD value represents the degree of cell
proliferation. A greater OD value indicates more cell
proliferation. As shown in Fig. 5C,
the proliferation rate of the micro down group was significantly
lower than the other two groups. Fig.
5D shows the results of the apoptosis assay in which the number
of apoptotic cells in the micro down group was significantly higher
than the other two groups.
Downregulation of miRNA-149 leads to a
significant reduction in the colony formation potential of
TSU-derived SP cells
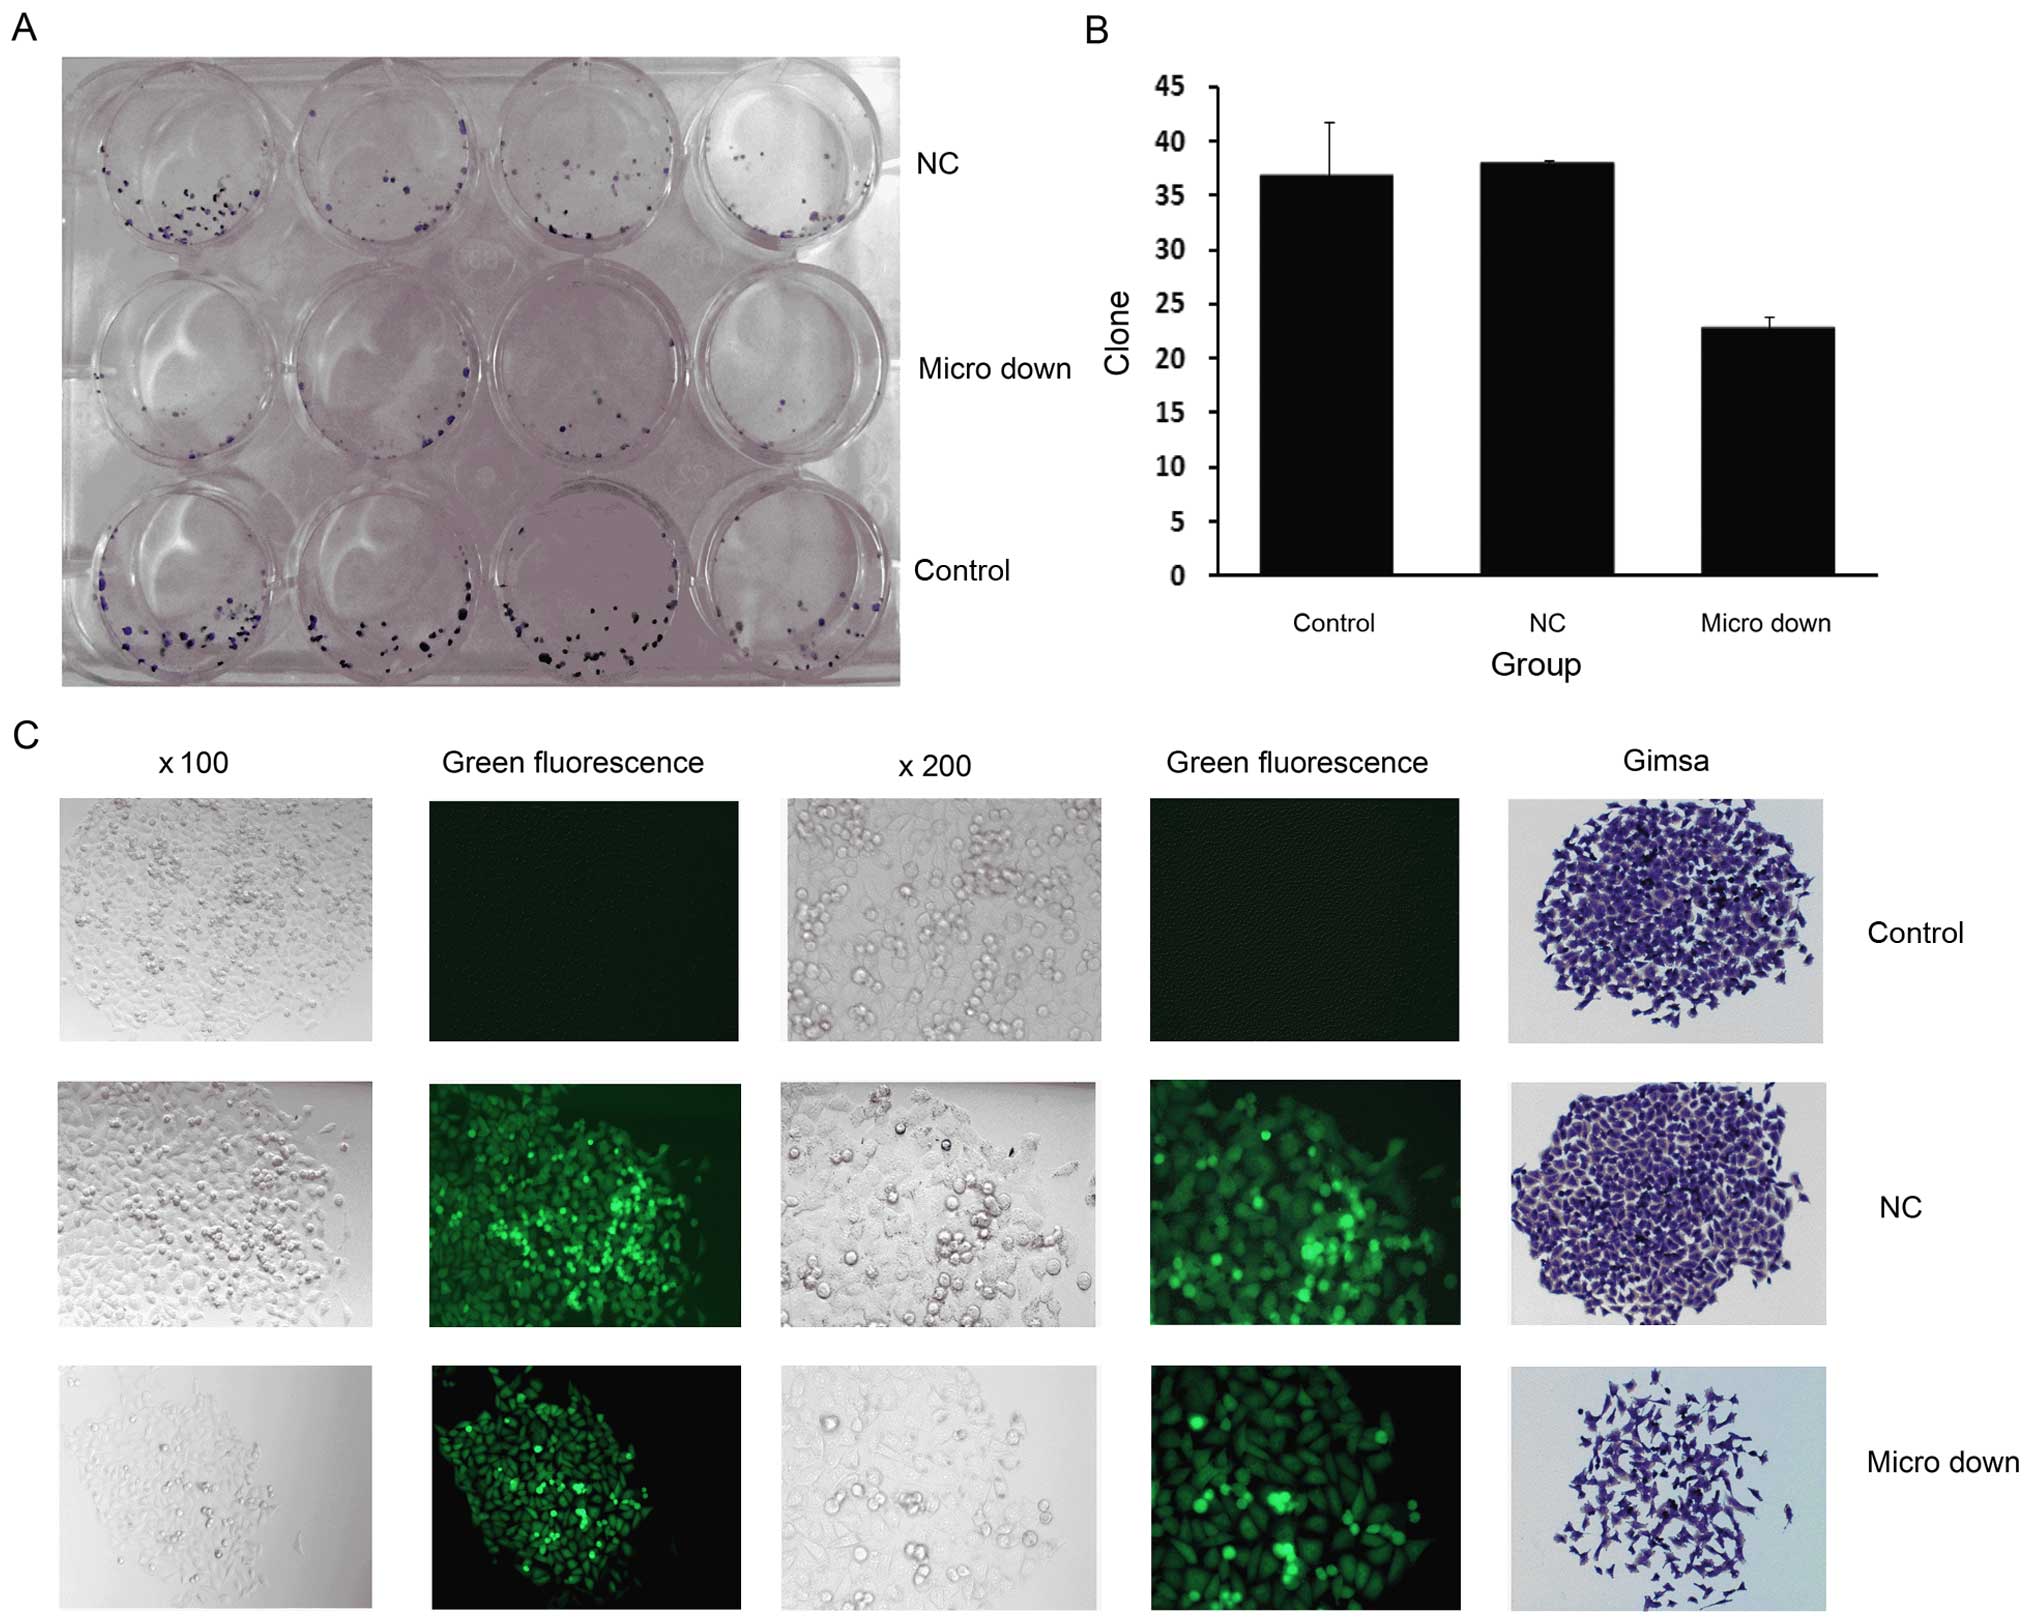
A classic colony formation assay was performed to
analyze the potential change in colony formation potential for
TSU-derived SP cells when miRNA-149 was downregulated. Fig. 6A shows the digital photos in which
the colony formation cells were stained with Giemsa solution. The
data analysis showed that the number of clones in the micro down
group was significantly less than the other two groups (Fig. 6B). Fig.
6C depicts a representative cell morphology for a clone using
either phase contrast or fluorescence microscopy and, finally,
Giemsa staining. The clones formed from the micro down group
contained fewer and more dispersed cells.
Downregulation of miRNA-149 in
TSU-derived SP cells inhibits tumor growth in vivo
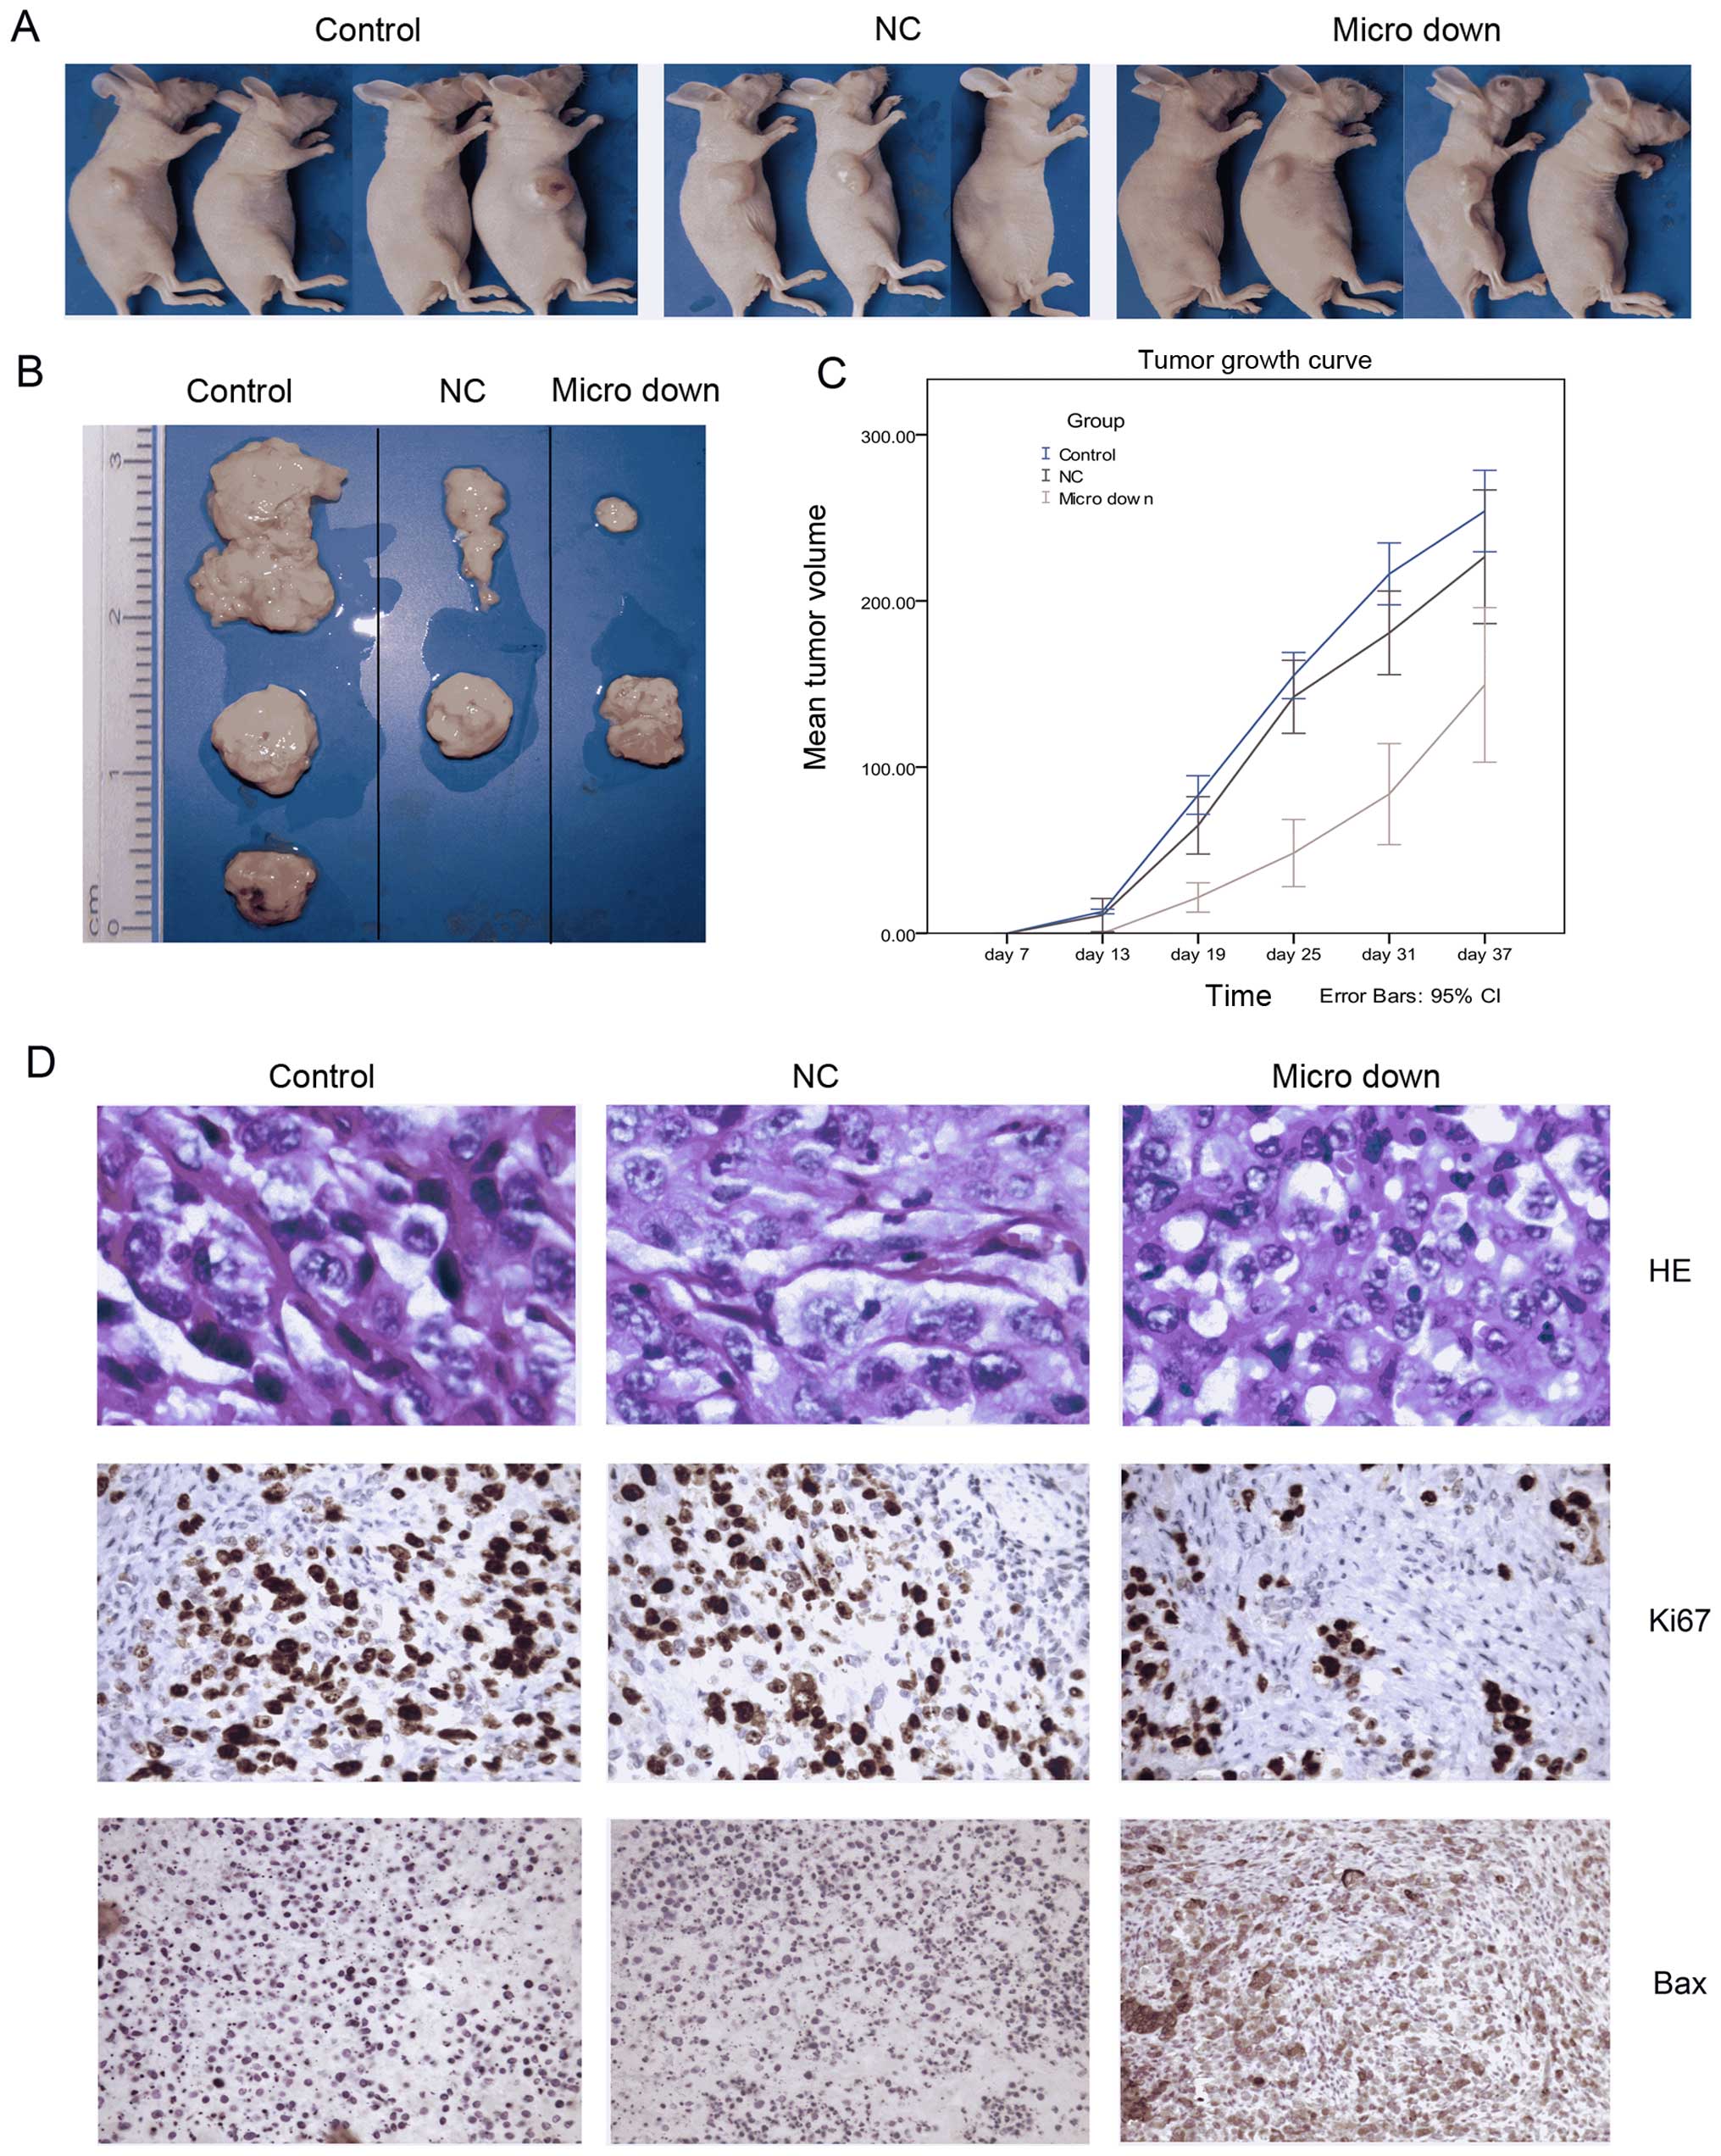
There were visible tumors in the control group and
the NC group from the 7th day after inoculation, whereas tumor
growth was not observed in micro down group until the 13th day
(Fig. 7). Until the 37th day before
the end of the experiment, we observed tumors in 3 out of 4 mice
from the control group, 2 out of 4 in the NC group (one mouse died
of unknown causes on the 7th day) and 2 out of 4 in the micro down
group (Fig. 7A). Images of the
formed tumors are shown in Fig. 7B.
The difference of tumorigenicity among the three groups is readily
apparent. We also determined a tumor growth curve for each group
and found that the mean growth rate of tumors in the micro down
group was notably lower than the other two groups (Fig. 7C). Fig.
7D shows immunohistochemistry images for the three groups.
H&E staining verified that all of the masses were tumors. Ki-67
indicates the distribution of the proliferating cells (dark brown
staining), and Bax staining depicts an apoptotic protein in the
cytoplasm and nucleus that is dyed brown. All of the above methods
demonstrated that the downregulation of miRNA-149 in TSU-derived SP
cells inhibits tumor growth in vivo.
Discussion
Because normal prostate and prostate cancer cells
are susceptible to androgen regulation (35), early prostate cancer can be
controlled using androgen suppression. However, most prostate
cancer patients develop androgen-independent prostate cancer
(AIPC), which is very difficult to treat (36). These clinical difficulties have
forced us to change our ways of thinking to create fundamentally
new avenues for the treatment of prostate cancer. Continuous
progress in cancer research has provided accumulating evidence for
the existence of a small group of cancer stem cells in many types
of tumor tissues, which could be the cause of prostate cancer
metastasis and recurrence as well as hormone-dependent receptor
changes. To some extent, prostate cancer is a stem cell disease.
Prostate cancer stem cells (PCSC) have the same characteristics as
stem cells, such as self-renewal, multi-differentiation, the
capacity for unlimited proliferation, immortalized resistance and
high tumor rates. More importantly, they are the tumor initiating
cells and form tumor cell heterogeneity through abnormal
differentiation. The identification of CSCs provides a new path for
the exploration of mechanisms underlying tumor formation. Many
studies have tried to transfer this new idea into tumor prognostic
and predictive information (37).
Through a tumor hierarchical pattern study, CSCs could originate
from normal tissue stem cells that have existed for a long time
(38). Therefore, the surface
markers of normal tissue stem cells may also exist on the surface
of homologous CSCs. For example, the stem cell surface marker
CD44+ of colon cancer also exists in normal colon cells
(39); the stem cell marker
CD133+ of ovarian cancer (40), ALDH1+ of lung cancer
(41), and the stem cell phenotype
SP of endometrial cancer all also exist in the corresponding normal
cells of these tissues (42). By
looking for the same marker, tumor stem cells could potentially be
isolated from tumor tissue. However, specific stem cell surface
markers for many tumor tissues are still undefined, thus, it
remains difficult to use a certain type of stem cell surface marker
to select and identify prostate cancer stem cells. Recent studies
have found that SP cells not only exist in the hematopoietic
system, but are also distributed in a variety of normal tissues,
tumor cell lines and solid tumors, including almost all normal
human tissues such as blood, the liver, lungs, skin, breasts and
ovarian cancer, nasopharyngeal carcinoma, and tumors of the nervous
system (43,44). Moreover, from the investigation of
many types of tumor cell lines and tumor tissues, SP cells have
been found to have the biological characteristics of self-renewal,
multipotent differentiation, a slow cell cycle, high-tumorigenic
force, and tolerance to radioactive substances and chemotherapy
drugs, which are similar to the biological characteristics of CSCs.
The discovery of an SP subgroup is very practical for solid tumor
stem cell research, especially when specific cell surface markers
have not been found. Therefore, it can be used as an effective
method for stem cell research. In the early stages, we used a side
population cell flow sorting method to separate and culture SP
cells from the prostate cancer cell lines LNCaP PC-3, TSU and
DU145, which are common cultured cell lines. Using a wide
methodological range of experiments to identify the characteristics
of CSCs from SP cells, it was found that side population cells are
prevalent in common prostate cancer. According to the different
types of prostate cancer cell lines, the proportion of SP cells
ranges from 0.6 to 1.6%. SP cells have the characteristics of high
CSC proliferation and tumorigenesis (45).
Cancer stem cells and miRNAs have become hot issues
in the oncology research community in recent years. If effectively
combined, they will be helpful in explaining the molecular
mechanisms underlying the biological characteristics of CSCs, and
could create new ways for cancer treatment and prognosis. The
present study mainly focuses on the expression and functional
differences of miRNAs between ordinary tumor cells and normal
tissue cells from the same source, so as to infer the occurrence
and biological characteristics of the tumor. However, the
comparative studies on CSCs, the source of tumors, have been less
effective. miRNAs may become a promising new anti-angiogenic target
for cancer (46,47). For example, hsa-miR-149 is the
earliest discovered human small molecule RNA. A recent study found
that hsa-miR-149 plays a regulatory role in the occurrence of
gastric cancer. miRNAs may serve as potential biomarkers and
therapeutic targets for gastric cancer (48). A number of studies have used large
sample statistics and gene expression analysis to show that habits
such as smoking and tea-drinking can cause changes in the
regulation of hsa-miR-149 and increase one's susceptibility to
gastric cancer (49). We have used
advanced flow sorting, biochip and real-time quantitative PCR
detection technology to effectively select tumor cells and then to
explore the changes in CSCs and ordinary tumor cells at the
molecular level, mainly in miRNA expression and functional
regulation, to discover the origin and fundamental mechanisms
underlying tumorigenesis. However, our experiments also have some
limitations. If we could add normal tissue cells from the same
source to compare and analyze the changes in miRNAs found in CSCs,
ordinary tumor cells and normal tissue cells, our results would be
more persuasive.
The miRNA biochip experiment is the key and core of
the present study. To ensure the smooth process of the experiment
and the accuracy and reliability of the results, sample preparation
is particularly important. To provide 2–3 µg of total RNA
(the small RNA amount is >0.5 µg), the steps of cell
culture and flow sorting should be strictly controlled to ensure
obtaining >106 cells with good cell activity. When
performing the total RNA extraction, an important step is to ensure
that the small RNA are retained during the process. Compared with a
column method, an RNA extraction kit can better ensure the purity
of the small RNA. For transportation, the sample is relatively
stable in the form of total RNA. qRT-PCR experiments can further
verify specifically selected miRNA and improve the accuracy of the
experiment. We adopted a probe method for the qRT-PCR experiment
because its specificity and accuracy are higher than the
fluorescent dye method and more suitable for small RNA research. A
miRNA expression interference experiment is the most common method
to study the function of miRNAs in cells (50). miRNA mimics or inhibitors
constructed by lentiviral vectors can efficiently infect the target
cells to promote or inhibit the corresponding miRNA expression in
these cells and study their function. This method has been widely
used by researchers (51–53). For example, lentivirus-mediated
interference to knock down eukaryotic translation initiation factor
3 subunit D expression inhibits proliferation of HCT116 colon
cancer cells (54). Downregulation
of β2SP by lentivirus short hairpin RNA activates Notch signaling
and SOX9 expression in esophageal adenocarcinoma (55). We used a constructed
miRNA-149-inhibition lentivirus to infect SP cells from the TSU
cell line and explored the best conditions for infection, which
laid the foundation for our subsequent experiments. Cell function
experiments confirmed that the downregulation of miRNA-149
expression could significantly decrease the in vitro
proliferation and colony formation capacity of TSU-derived SP
cells, promote apoptosis and inhibit the growth rate of tumors.
This may be related to miRNA-149's activation of intracellular
signal transduction pathways (56),
an idea that further specific experiments can confirm.
Although the research on CSCs has rapidly progressed
over the past few years, there are still many critical issues that
need to be resolved. The present study not only establishes a
technical platform for human prostate cancer stem cell sorting, but
more importantly, it provides a basis for the study of miRNA's
biological functions in human prostate cancer stem cells. The
research and application of CSCs and miRNAs are still in their
initial stages, and many problems such as developmental status,
biological properties, related function and their relationship with
tumor occurrence need reasonable and complete theories. Therefore,
deeper study and exploration of CSCs and miRNA regulation
relationships are necessary. It is believed that with the progress
of research technology and the advanced research on CSCs by
domestic and foreign counterparts, the identification of specific
markers and related signal transduction pathways of CSCs will be
discovered, which will have practical significance for the early
prevention, diagnosis, efficient drug therapy, recurrence and
metastasis and prognosis of cancers.
Acknowledgments
The present study was supported by the National
Natural Science Foundation of China (no. 81341066) and the Special
Foundation for High Level of Health Personnel of Beijing Health
System (no. 2013-2-003).
References
|
1
|
Li S and Li Q: Cancer stem cells and tumor
metastasis (Review). Int J Oncol. 44:1806–1812. 2014.PubMed/NCBI
|
|
2
|
Routray S and Mohanty N: Cancer stem cells
accountability in progression of head and neck squamous cell
carcinoma: The most recent trends! Mol Biol Int. 2014:3753252014.
View Article : Google Scholar : PubMed/NCBI
|
|
3
|
Wang D, Zhu H, Liu Y, Liu Q, Xie X, Zhou
Y, Zhang L, Zhu Y, Zhang Z and Su Z: The low chamber pancreatic
cancer cells had stem-like characteristics in modified transwell
system: Is it a novel method to identify and enrich cancer
stem-like cells? BioMed Res Int. 2014:7603032014. View Article : Google Scholar : PubMed/NCBI
|
|
4
|
Wang J, Ma Y and Cooper MK: Cancer stem
cells in glioma: Challenges and opportunities. Transl Cancer Res.
2:429–441. 2013.
|
|
5
|
Wieczorek K and Niewiarowska J: Cancer
stem cells. Postepy Hig Med Dosw Online. 66:629–636. 2012.In
Polish. View Article : Google Scholar
|
|
6
|
Qi W, Zhao C, Zhao L, Liu N, Li X, Yu W
and Wei L: Sorting and identification of side population cells in
the human cervical cancer cell line HeLa. Cancer Cell Int.
14:32014. View Article : Google Scholar : PubMed/NCBI
|
|
7
|
Wouters J, Stas M, gremeaux L, Govaere O,
Van den Broeck A, Maes H, Agostinis P, Roskams T, van den Oord JJ
and Vankelecom H: The human melanoma side population displays
molecular and functional characteristics of enriched
chemoresistance and tumorigenesis. PLoS One. 8:e765502013.
View Article : Google Scholar : PubMed/NCBI
|
|
8
|
Mendell JT and Olson EN: MicroRNAs in
stress signaling and human disease. Cell. 148:1172–1187. 2012.
View Article : Google Scholar : PubMed/NCBI
|
|
9
|
Tessitore A, Cicciarelli G, Del Vecchio F,
Gaggiano A, Verzella D, Fischietti M, Vecchiotti D, Capece D,
Zazzeroni F and Alesse E: MicroRNAs in the DNA damage/repair
network and cancer. Int J genomics. 2014:8202482014. View Article : Google Scholar : PubMed/NCBI
|
|
10
|
Cadamuro AC, Rossi AF, Maniezzo NM and
Silva AE: Helicobacter pylori infection: Host immune response,
implications on gene expression and microRNAs. World J
Gastroenterol. 20:1424–1437. 2014. View Article : Google Scholar : PubMed/NCBI
|
|
11
|
Litvinov IV and Peh K: Connecting the dots
in cutaneous T cell lymphoma (CTCL): STAT5 regulates malignant T
cell proliferation via miR-155. Cell Cycle. 12:1939–1947. 2013.
View Article : Google Scholar
|
|
12
|
Undi RB, Kandi R and Gutti RK: MicroRNAs
as haematopoiesis regulators. Adv Hematol. 2013:6957542013.
View Article : Google Scholar
|
|
13
|
Lawson SK, Dobrikova EY, Shveygert M and
Gromeier M: p38α mitogen-activated protein kinase depletion and
repression of signal transduction to translation machinery by
miR-124 and -128 in neurons. Mol Cell Biol. 33:127–135. 2013.
View Article : Google Scholar :
|
|
14
|
Adlakha YK and Saini N: Brain microRNAs
and insights into biological functions and therapeutic potential of
brain enriched miRNA-128. Mol Cancer. 13:332014. View Article : Google Scholar : PubMed/NCBI
|
|
15
|
Nagpal N and Kulshreshtha Ritu: miR-191:
an emerging player in disease biology. Front Genet. 5:1–10. 2014.
View Article : Google Scholar
|
|
16
|
Li M, Guan X, Sun Y, Mi J, Shu X, Liu F
and Li C: miR-92a family and their target genes in tumorigenesis
and metastasis. Exp Cell Res. 323:1–6. 2014. View Article : Google Scholar : PubMed/NCBI
|
|
17
|
Qin Q, Furong W and Baosheng L: Multiple
functions of hypoxia-regulated miR-210 in cancer. J Exp Clin Cancer
Res. 33:502014. View Article : Google Scholar : PubMed/NCBI
|
|
18
|
Konno Y, Dong P, Xiong Y, Suzuki F, Lu J,
Cai M, Watari H, Mitamura T, Hosaka M, Hanley SJ, et al:
MicroRNA-101 targets EZH2, MCL-1 and FOS to suppress proliferation,
invasion and stem cell-like phenotype of aggressive endometrial
cancer cells. Oncotarget. 5:6049–6062. 2014. View Article : Google Scholar : PubMed/NCBI
|
|
19
|
Wu K, Yang L, Li C, Zhu Ch, Wang X, Yao Y
and Jia YJ: MicroRNA-146a enhances Helicobacter pylori induced cell
apoptosis in human gastric cancer epithelial cells. Asian Pac J
Cancer Prev. 15:5583–5586. 2014. View Article : Google Scholar : PubMed/NCBI
|
|
20
|
Peng Y, Liu YM, Li LC, Wang LL and Wu XL:
MicroRNA-338 inhibits growth, invasion and metastasis of gastric
cancer by targeting NRP1 expression. PloS one. 9:e944222014.
View Article : Google Scholar : PubMed/NCBI
|
|
21
|
Zhu ED, Li N, Li BS, Li W, Zhang WJ, Mao
XH, Guo G, Zou QM and Xiao B: miR-30b, down-regulated in gastric
cancer, promotes apoptosis and suppresses tumor growth by targeting
plasminogen activator inhibitor-1. PLoS One. 9:e1060492014.
View Article : Google Scholar : PubMed/NCBI
|
|
22
|
Zhang F, Yang Z, Cao M, Xu Y, Li J, Chen
X, Gao Z, Xin J, Zhou S, Zhou Z, et al: MiR-203 suppresses tumor
growth and invasion and down-regulates MiR-21 expression through
repressing Ran in esophageal cancer. Cancer Lett. 342:121–129.
2014. View Article : Google Scholar
|
|
23
|
Zhang ZC, Li YY, Wang HY, Fu S, Wang XP,
Zeng MS, Zeng YX and Shao JY: Knockdown of miR-214 promotes
apoptosis and inhibits cell proliferation in nasopharyngeal
carcinoma. PLoS One. 9:e861492014. View Article : Google Scholar : PubMed/NCBI
|
|
24
|
Zhao Y, Miao G, Li Y, Isaji T, Gu J, Li J
and Qi R: MicroRNA-130b suppresses migration and invasion of
colorectal cancer cells through downregulation of integrin β1
[corrected]. PLoS One. 9:e879382014. View Article : Google Scholar
|
|
25
|
Bao Y, Chen Z, Guo Y, Feng Y, Li Z, Han W,
Wang J, Zhao W, Jiao Y and Li K: Tumor suppressor microRNA-27a in
colorectal carcinogenesis and progression by targeting SGPP1 and
Smad2. PLoS One. 9:e1059912014. View Article : Google Scholar : PubMed/NCBI
|
|
26
|
Du B, Wang Z, Zhang X, Feng S, Wang G, He
J and Zhang B: MicroRNA-545 suppresses cell proliferation by
targeting cyclin D1 and CDK4 in lung cancer cells. PLoS One.
9:e880222014. View Article : Google Scholar : PubMed/NCBI
|
|
27
|
Wang N, Liang H, Zhou Y, Wang C, Zhang S,
Pan Y, Wang Y, Yan X, Zhang J and Zhang CY: miR-203 suppresses the
proliferation and migration and promotes the apoptosis of lung
cancer cells by targeting SRC. PLoS One. 9:e1055702014. View Article : Google Scholar : PubMed/NCBI
|
|
28
|
Ip J, Canham P, Choo KH, Inaba Y, Jacobs
SA, Kalitsis P, Mattiske DM, Ng J, Saffery R, Wong NC, et al:
Normal DNA methylation dynamics in DICER1-deficient mouse embryonic
stem cells. PLoS Genet. 8:e10029192012. View Article : Google Scholar : PubMed/NCBI
|
|
29
|
Rosa A and Brivanlou AH: Regulatory
non-coding RNAs in pluripotent stem cells. Int J Mol Sci.
14:14346–14373. 2013. View Article : Google Scholar : PubMed/NCBI
|
|
30
|
Bier A, Giladi N, Kronfeld N, Lee HK,
Cazacu S, Finniss S, Xiang C, Poisson L, deCarvalho AC, Slavin S,
et al: MicroRNA-137 is downregulated in glioblastoma and inhibits
the stemness of glioma stem cells by targeting RTVP-1. Oncotarget.
4:665–676. 2013. View Article : Google Scholar : PubMed/NCBI
|
|
31
|
Floyd DH, Zhang Y, Dey BK, Kefas B, Breit
H, Marks K, Dutta A, Herold-Mende C, Synowitz M and Glass R: Novel
anti-apoptotic microRNAs 582-5p and 363 promote human glioblastoma
stem cell survival via direct inhibition of caspase-3, caspase-9,
and Bim. PLoS One. 9:e962392014. View Article : Google Scholar
|
|
32
|
Li R, Zhang L, Jia L, Duan Y, Li Y, Wang
J, Bao L and Sha N: MicroRNA-143 targets Syndecan-1 to repress cell
growth in melanoma. PLoS One. 9:e948552014. View Article : Google Scholar : PubMed/NCBI
|
|
33
|
Wallace TJ, Torre T, Grob M, Yu J, Avital
I, Brücher B, Stojadinovic A and Man YG: Current approaches,
challenges and future directions for monitoring treatment response
in prostate cancer. J Cancer. 5:3–24. 2014. View Article : Google Scholar : PubMed/NCBI
|
|
34
|
Chen Y, Zhao J, Luo Y, Wang Y, Wei N and
Jiang Y: Isolation and identification of cancer stem-like cells
from side population of human prostate cancer cells. J Huazhong
Univ Sci Technolog Med Sci. 32:697–703. 2012. View Article : Google Scholar : PubMed/NCBI
|
|
35
|
Pelekanou V, Notas G, Stathopoulos EN,
Castanas E and Kampa M: Androgen receptors in early and castration
resistant prostate cancer: Friend or foe? Hormones (Athens).
12:224–235. 2013. View Article : Google Scholar
|
|
36
|
Saraon P, Jarvi K and Diamandis EP:
Molecular alterations during progression of prostate cancer to
androgen independence. Clin Chem. 57:1366–1375. 2011. View Article : Google Scholar : PubMed/NCBI
|
|
37
|
Maugeri-Saccà M and Maria RD: Translating
basic research in cancer patient care. Ann Ist Super Sanita.
47:64–71. 2011.PubMed/NCBI
|
|
38
|
Bussolati B, Grange C and Camussi G: Tumor
exploits alternative strategies to achieve vascularization. FASEB
J. 25:2874–2882. 2011. View Article : Google Scholar : PubMed/NCBI
|
|
39
|
Sanders MA and Majumdar APN: Colon cancer
stem cells: Implications in carcinogenesis. Front Biosci (Landmark
Ed). 16:1651–1662. 2011. View
Article : Google Scholar
|
|
40
|
Silva IA, Bai S, McLean K, Yang K,
Griffith K, Thomas D, Ginestier C, Johnston C, Kueck A, Reynolds
RK, et al: Aldehyde dehydrogenase in combination with CD133 defines
angiogenic ovarian cancer stem cells that portend poor patient
survival. Cancer Res. 71:3991–4001. 2011. View Article : Google Scholar : PubMed/NCBI
|
|
41
|
Jiang F, Qiu Q, Khanna A, Todd NW, Deepak
J, Xing L, Wang H, Liu Z, Su Y, Stass SA, et al: Aldehyde
dehydrogenase 1 is a tumor stem cell-associated marker in lung
cancer. Mol Cancer Res. 7:330–338. 2009. View Article : Google Scholar : PubMed/NCBI
|
|
42
|
Kato K, Kuhara A, Yoneda T, Inoue T, Takao
T, Ohgami T, Dan L, Kuboyama A, Kusunoki S, Takeda S, et al: Sodium
butyrate inhibits the self-renewal capacity of endometrial tumor
side-population cells by inducing a DNA damage response. Mol Cancer
Ther. 10:1430–1439. 2011. View Article : Google Scholar : PubMed/NCBI
|
|
43
|
Kong QL, Hu LJ, Cao JY, Huang YJ, Xu LH,
Liang Y, Xiong D, Guan S, Guo BH, Mai HQ, et al: Epstein-Barr
virus-encoded LMP2A induces an epithelial-mesenchymal transition
and increases the number of side population stem-like cancer cells
in nasopharyngeal carcinoma. PLoS Pathog. 6:e10009402010.
View Article : Google Scholar : PubMed/NCBI
|
|
44
|
Harris MA, Yang H, Low BE, Mukherjee J,
Guha A, Bronson RT, Shultz LD, Israel MA and Yun K: Cancer stem
cells are enriched in the side population cells in a mouse model of
glioma. Cancer Res. 68:10051–10059. 2008. View Article : Google Scholar : PubMed/NCBI
|
|
45
|
Richard V, Nair MG, Santhosh Kumar TR and
Pillai MR: Side population cells as prototype of chemoresistant,
tumor-initiating cells. BioMed Res Int. 2013:5172372013. View Article : Google Scholar : PubMed/NCBI
|
|
46
|
Gallach S, Calabuig-Fariñas S,
Jantus-Lewintre E and Camps C: MicroRNAs: promising new
antiangiogenic targets in cancer. Biomed Res Int. 2014:8784502014.
View Article : Google Scholar : PubMed/NCBI
|
|
47
|
Di Leva G, Garofalo M and Croce CM:
MicroRNAs in cancer. Annu Rev Pathol. 9:287–314. 2014. View Article : Google Scholar :
|
|
48
|
Shin VY and Chu KM: MiRNA as potential
biomarkers and therapeutic targets for gastric cancer. World J
Gastroenterol. 20:10432–10439. 2014. View Article : Google Scholar : PubMed/NCBI
|
|
49
|
Wang Y, Zheng X, Zhang Z, Zhou J, Zhao G,
Yang J, Xia L, Wang R, Cai X, Hu H, et al: MicroRNA-149 inhibits
proliferation and cell cycle progression through the targeting of
ZBTB2 in human gastric cancer. PLoS One. 7:e416932012. View Article : Google Scholar : PubMed/NCBI
|
|
50
|
Franceschini A, Meier R, Casanova A,
Kreibich S, Daga N, Andritschke D, Dilling S, Rämö P, Emmenlauer M,
Kaufmann A, et al: Specific inhibition of diverse pathogens in
human cells by synthetic microRNA-like oligonucleotides inferred
from RNAi screens. Proc Natl Acad Sci USA. 111:4548–4553. 2014.
View Article : Google Scholar : PubMed/NCBI
|
|
51
|
Shin B, Oh H, Park SM, Han HE, Ye M, Song
WK and Park WJ: Intracellular cleavage of amyloid β by a viral
protease NIa prevents amyloid β-mediated cytotoxicity. PLoS One.
9:e986502014. View Article : Google Scholar
|
|
52
|
Grandchamp N, Altémir D, Philippe S,
Ursulet S, Pilet H, Serre MC, Lenain A, Serguera C, Mallet J and
Sarkis C: Hybrid lentivirus-phiC31-int-NLS vector allows
site-specific recombination in murine and human cells but induces
DNA damage. PLoS One. 9:e996492014. View Article : Google Scholar : PubMed/NCBI
|
|
53
|
Chu SC, Hsieh YS, Yu CC, Lai YY and Chen
PN: Thymoquinone induces cell death in human squamous carcinoma
cells via caspase activation-dependent apoptosis and LC3-II
activation-dependent autophagy. PLoS One. 9:e1015792014. View Article : Google Scholar : PubMed/NCBI
|
|
54
|
Yu X, Zheng B and Chai R:
Lentivirus-mediated knockdown of eukaryotic translation initiation
factor 3 subunit D inhibits proliferation of HCT116 colon cancer
cells. Biosci Rep. 5:1–17. 2014.
|
|
55
|
Song S, Maru DM, Ajani JA, Chan CH, Honjo
S, Lin HK, Correa A, Hofstetter WL, Davila M, Stroehlein J, et al:
Loss of TGF-β adaptor β2SP activates notch signaling and SOX9
expression in esophageal adenocarcinoma. Cancer Res. 73:2159–2169.
2013. View Article : Google Scholar : PubMed/NCBI
|
|
56
|
Pei N, Jie F, Luo J, Wan R, Zhang Y, Chen
X, Liang Z, Du H, Li A, Chen B, et al: Gene expression profiling
associated with angiotensin II type 2 receptor-induced apoptosis in
human prostate cancer cells. PLoS One. 9:e922532014. View Article : Google Scholar : PubMed/NCBI
|