Introduction
Therapeutic selectivity is one of the most important
criteria in the therapy of cancer. In order to achieve effective
destruction of cancer tissue without side-effects, it is important
to consider the biological differences between normal and cancer
cells. One change that occurs in malignant cells is the increase of
glycolysis for energy production regardless of the availability of
oxygen. This is known as the Warburg effect (1). In addition, in many tumors glucose
transporter 1 (GLUT1) is overexpressed resulting in increased
glucose uptake (2). The exact
molecular mechanisms that lead to these metabolic changes are not
yet completely understood, yet increased GLUT1 expression and the
central role of glycolysis in tumor cells represent an attractive
target of attack for selective tumor therapy (3). Due to the dependence of tumor cells on
glycolysis, 2-geoxy-D-glucose (2DG) has been considered as a
potential anticancer agent. 2DG is a glucose analog, which leads to
inhibition of glycolysis and a decrease in ATP production resulting
in induction of apoptosis through activation of caspase-3 in solid
tumors (4–8). Combination of chemotherapeutic agents
including GnRH receptor-targeted chemotherapy using AEZS-108
(AN-152) and 2DG has been successfully tested (9).
Metformin (1,1-dimethylbiguanide hydrochloride) is a
well-established drug used for the treatment of type 2 diabetes. It
acts by reducing insulin resistance via different mechanisms,
including increased glycogen synthesis, enhanced insulin receptor
tyrosine kinase activity, and an increase in glucose transporter 4
(GLUT4) recruitment and activity (10). In addition, metformin affects
fasting plasma insulin levels, resulting in the reduction in
glucose concentrations in the blood (11). Different preclinical studies have
demonstrated the anti-neoplastic effects of metformin in animal
models of different tumor entities including cancers of the breast
(12–17). The proposed mechanisms of these
antitumor effects include an indirect, insulin-dependent pathway by
reduction of serum insulin levels, direct modulation of cellular
protein synthesis, and direct growth inhibition through effects in
the phosphatidylinositide 3-kinase (PI3K)/protein kinase B (PKB and
Akt)/AMP-activated protein kinase (AMPK) signaling pathway
(18,19).
Increased glycolysis for energy production is
necessary for the survival of tumor cells, and thus represents a
selective therapeutic target. In the present study, we showed that
the glycolytic phenotype of human breast cancer cells can be
targeted for therapeutic intervention. We aimed to ascertain
whether treatment with well-tolerable doses of 2DG can reduce the
viability of triple-negative breast cancer (TNBC) cells in
vitro. In addition, we tested whether the antitumor efficacy of
glycolysis inhibition by 2DG can be enhanced by co-treatment with
pharmacologic doses of metformin.
Materials and methods
Cell lines and culture conditions
The TNBC cell lines HCC1806 and MDA-MB-231 were
obtained from the American Type Culture Collection (ATCC; Manassas,
Virginia, USA). In order to guarantee the identity of the cell
lines over the years, the cells were expanded after purchase and
aliquots were stored in liquid nitrogen. Every half year a new
frozen stock was opened and expanded to carry out the experiments.
The cells were cultured at 37̊C in a humidified atmosphere of 5%
CO2 in air as previously described (20–22).
Chemicals
2DG and metformin were purchased from Sigma Chemical
Company (Deisenhofen, Germany).
Viability assay
Five hundred cells/well were plated into 96-well
plates (Falcon, Heidelberg, Germany) in 100 µl Dulbeccos modified
Eagles medium (DMEM)/5% fetal calf serum (FCS; Biochrom GmbH,
Berlin, Germany) without phenol red, 2 mM glutamine, 50 U/ml
penicillin/streptomycin, 2.5 µg/ml amphotericin B and 1:100
non-essential amino acids. After cell attachment, 100 µl medium,
100 µl 2DG/medium solution, 100 µl metformin/medium solution or 100
µl solution with 2DG in combination with metformin was added to the
wells in six replicates and incubated for 96 h at 37̊C in 5%
CO2. Final concentrations of 2DG, metformin and the
combination of both agents are provided in the Results section.
Cell number was determined by a colorimetric assay using Alamar
Blue (BioSource, Solingen, Germany). The optical density (OD) of
the reduced dye was assessed at 570 vs. 630 nm after 4 h at
37̊C.
Mitochondrial membrane potential
Cells were treated for 48 h without or with 2DG,
metformin or the combination of both agents. Final concentrations
of 2DG, metformin and the combination of both agents are provided
in the Results section. Then the cells were washed once with
phosphate-buffered saline (PBS) and mitochondrial membrane
potential was measured using the JC-1 mitochondrial membrane
potential detection kit according the manufacturers instructions
(Biotium, Hayward, CA, USA).
Western blot analysis of cleaved
PARP
Cells were treated for 48 h without or with 2DG or
metformin or the combination of both. Final concentrations of 2DG,
metformin and the combination of both agents are provided in the
Results section. Then, the cells were detached with 0.5 g trypsin
(Biochrom) and 5 mmol EDTA in 1 l PBS/BSA. The pellets were washed
twice with PBS and resuspended with CelLytic™ buffer containing
protease inhibitors (both from Sigma). Equal amounts of
protein/sample were used and diluted to equal volumes with
Laemmli-buffer. The cell lysates were separated on SDS-PAGE (15%,
ProSieve® 50 Gel Solution; Cambrex, Verviers, Belgium)
under reducing conditions and transferred to nitrocellulose
membranes (Hybond ECL; GE Healthcare Europe, Munich, Germany). The
nitrocellulose membranes were blocked with 5% instant skimmed milk
powder, spray-dried (Naturaflor, Töpfer GmbH, Dietmannsried,
Germany) in Tris-buffered saline and Tween-20 (TBST) (137 mM NaCl,
2.7 mM KCL, 0.1% Tween-20, 25 mM Tris/Cl, pH 7.4) for 1 h at room
temperature (RT), washed with TBST and then incubated at 4̊C
overnight with rabbit anti-human active caspase-3 polyclonal
antibody (BD Pharmingen, Heidelberg, Germany) in a 1:5,000 dilution
in TBST and then, following washings, incubated at RT with
horseradish peroxidase-conjugated anti-rabbit IgG (GE Healthcare
Europe) at an 1:10,000 dilution in TBST for 1 h. After washings,
specifically bound antibody was detected using the SuperSignal™
West Femto Maximum Sensitivity chemiluminescence substrate (Thermo
Scientific, Rockford, IL, USA). For quantification, the bands were
analyzed using a C-DiGit Blot Scanner (Li-COR, Lincoln, NE,
USA).
Statistical analysis
All experiments were repeated at least three times
with different passages of the respective cell lines. The data were
tested for significant differences by one-way analysis (Figs. 1–4,
and 6) of variance or two-way
analysis of variance (Fig. 5)
followed by Tukey's multiple comparisons test for comparison of
individual groups, after a Bartlett test had shown that variances
were homogenous using GraphPad Prism 6.01 software (GraphPad
Software Inc., La Jolla, CA, USA).
Results
Dose-response effects of 2DG treatment
on cell viability
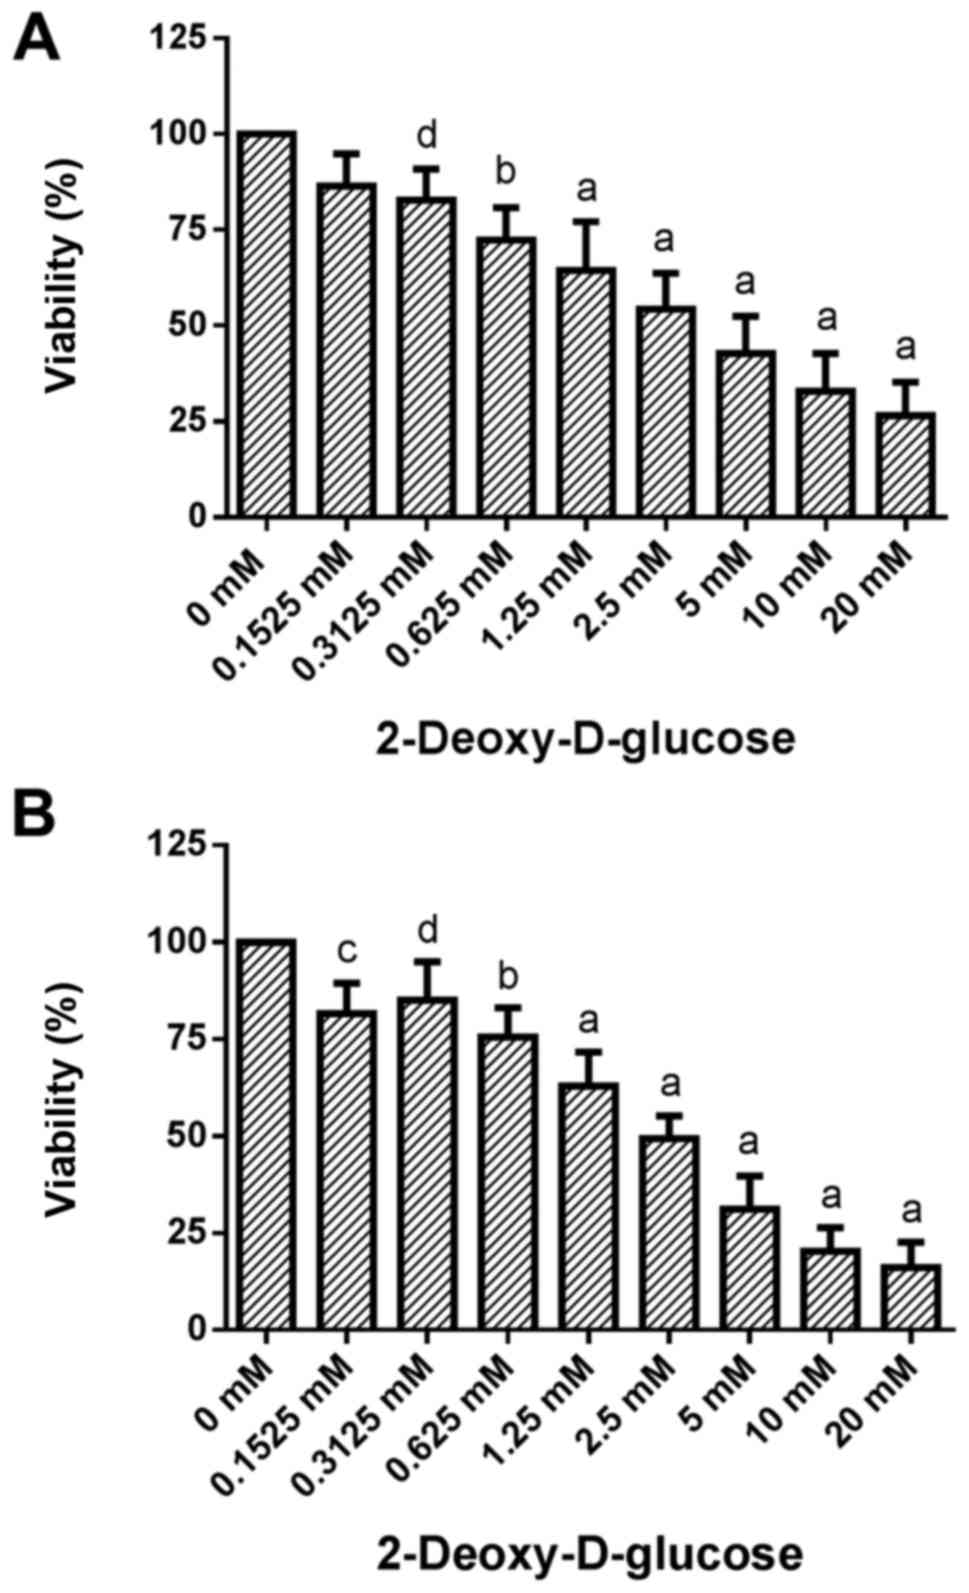
Treatment of HCC1806 (Fig. 1A) and MDA-MB-231 (Fig. 1B) human breast cancer cells with
increasing concentrations of 2DG (0.1525, 0.3125, 0.625, 1.25, 2.5,
5, 10 and 20 mM) for 96 h resulted in a significant dose-dependent
reduction in viability.
A slight decrease in the number of living HCC1806
cells to 86.4±8.4 (SD)% of the control (C=100%) was observed at
0.1525 mM concentration of 2DG. At a 0.3125 mM concentration of 2DG
the decrease in cell number became significant [82.8±8.1% of the
control (C=100%; P<0.05)]. A concentration of 0.625 mM of 2DG
resulted in a significant reduction in living HCC1806 cells to
72.4±8.4% of the control (C=100%; P<0.001). At 1.25, 2.5, 5 and
10 mM, as well as at 20 mM concentrations of 2DG a decrease in
living HCC1806 cells to 64.5±12.7, 54.4±9.3, 42.8±9.7, 32.8±9.9 and
26.5±8.8% of the control (C=100%; P<0.0001 in all
concentrations) was observed, respectively.
When the MDA-MB-231 cells were treated with 2DG for
96 h the number of living cells was dose-dependently reduced vs.
the control (C=100%) as follows: 0.1525 mM, 81.6±7.9% (P<0.01);
0.3125 mM, 85.0±9.9% (P<0.05); 0.625 mM, 75.6±7.5% (P<0.001);
1.25 mM, 63.0±8.8% (P<0.0001); 2.5 mM, 49.4±5.9% (P<0.0001);
5 mM, 31.2±8.5% (P<0.0001); 10 mM, 20.3±6.1% (P<0.0001); 20
mM, 16.1±6.5% (P<0.0001).
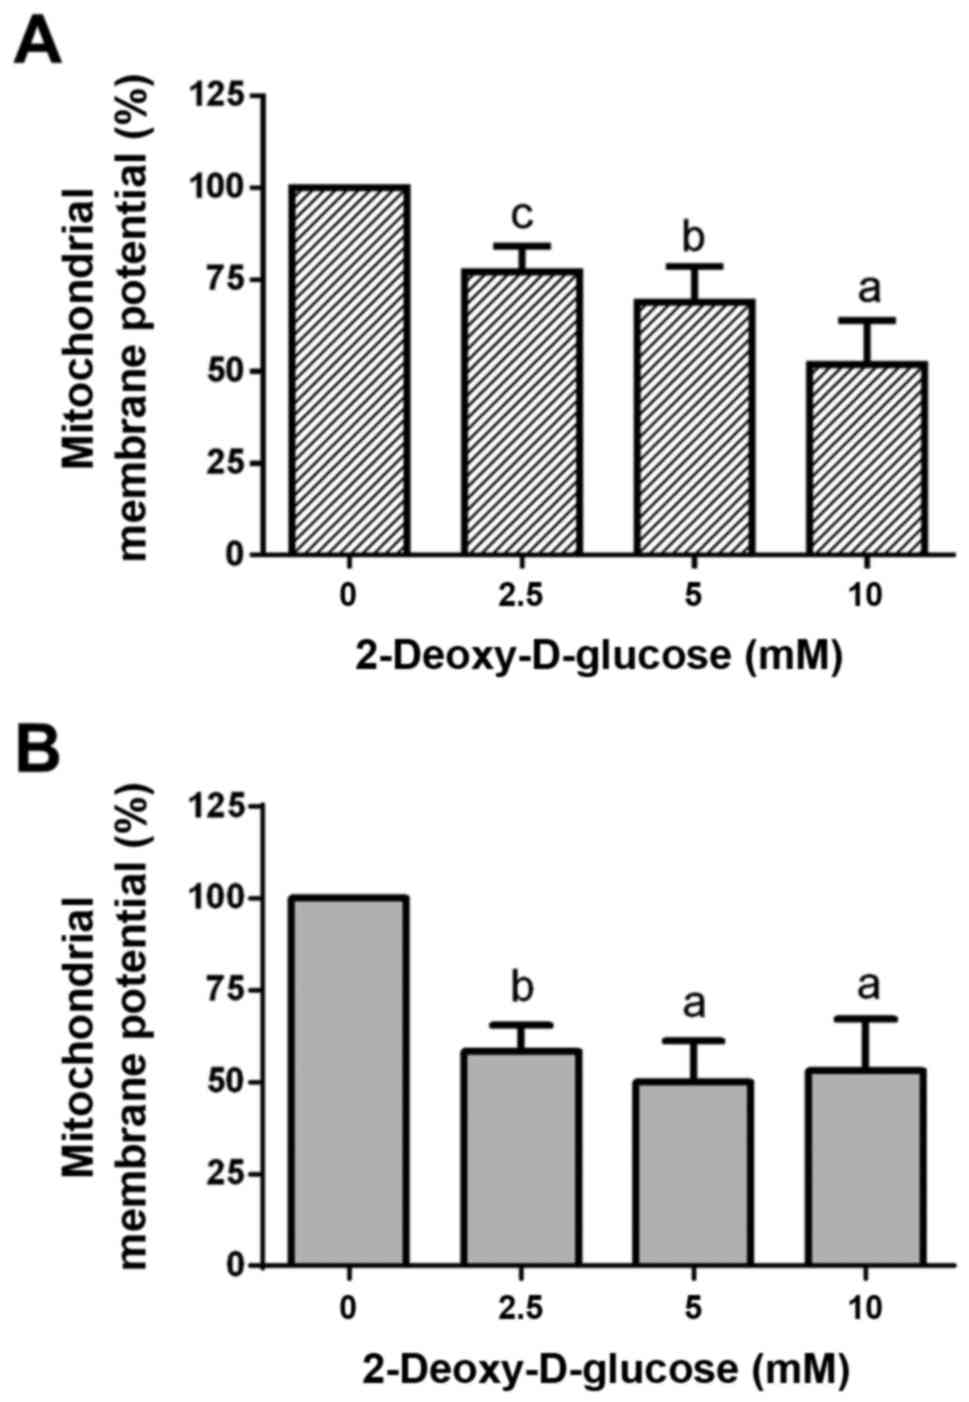
Dose-response effects of 2DG treatment
on mitochondrial membrane potential
Treatment of HCC1806 (Fig. 2A) and MDA-MB-231 (Fig. 2B) human breast cancer cells with
2.5, 5 and 10 mM of 2DG for 48 h resulted in a significant
dose-dependent reduction in mitochondrial membrane potential
(ΔΨm).
At a 2.5 mM concentration of 2DG, mitochondrial
membrane potential in the HCC1806 cells was significantly decreased
to 77.1±7.0% of the control (C=100%; P<0.01). A concentration of
5 mM of 2DG resulted in a significant reduction in mitochondrial
membrane potential to 68.9±9.7% of the control (C=100%;
P<0.001). At a 10 mM concentration of 2DG, a significant
reduction in mitochondrial membrane potential to 51.9±12.0% of the
control (C=100%; P<0.0001) was observed.
When MDA-MB-231 cells were treated with 2DG for 48
h, mitochondrial membrane potential was dose-dependently reduced
vs. the control (C=100%) as follows: 2.5 mM, 58.3±7.2%
(P<0.001); 5 mM, 50.1±11.0% (P<0.0001); 10 mM, 53.2±14.0%
(P<0.0001).
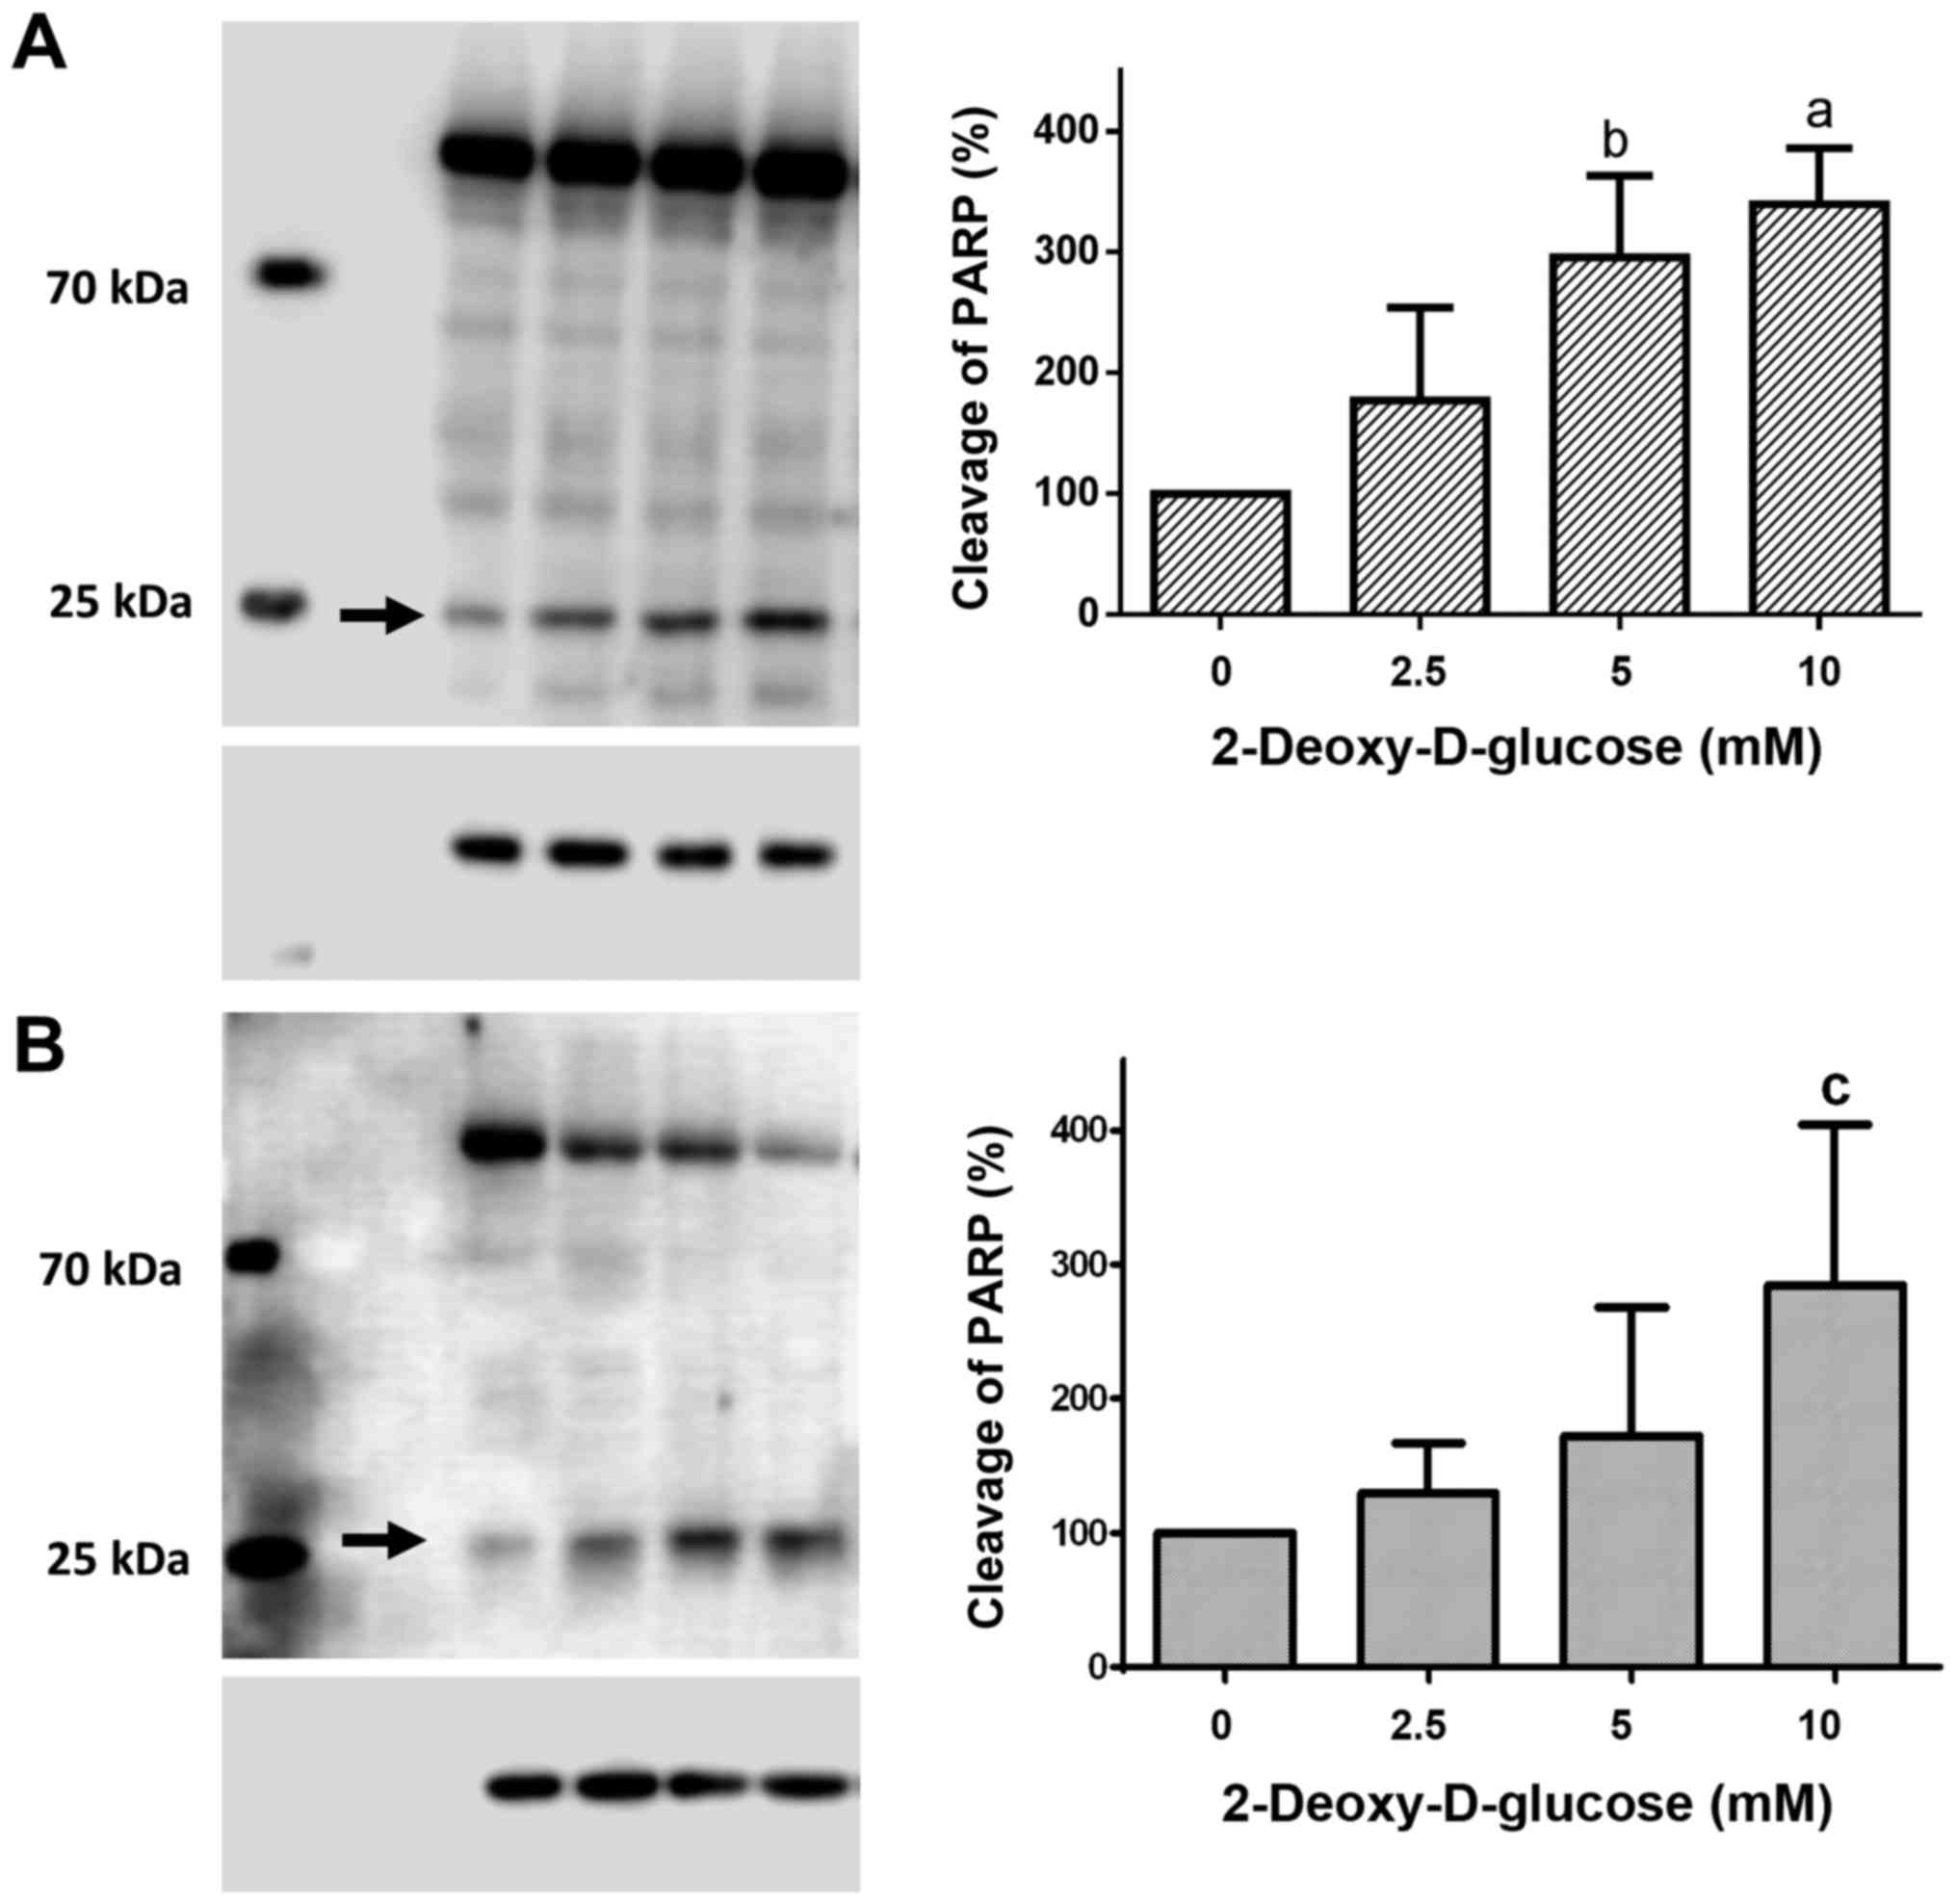
Dose-response effects of 2DG treatment
on PARP cleavage
Treatment of HCC1806 (Fig. 3A) and MDA-MB-231 (Fig. 3B) human breast cancer cells with
2.5, 5 and 10 mM of 2DG for 48 h resulted in a significant
dose-dependent increase in cleaved PARP protein.
Following treatment with a 2.5 mM concentration of
2DG for 48 h, the level of cleaved PARP protein in the HCC1806
cells was increased to 177.3±76.6% of the control (C=100%). A
concentration of 5 mM of 2DG resulted in a significant increase in
PARP cleavage to 295.8±67.3% of the control (C=100%; P<0.01). At
a 10 mM concentration of 2DG, a significant increase in cleaved
PARP protein to 339.5±46.5% of the control (C=100%; P<0.001) was
observed.
When MDA-MB-231 cells were treated with 2DG for 48
h, cleaved PARP protein was dose-dependently increased vs. the
control (C=100%) as follows: 2.5 mM, 129.6±37.3%; 5 mM,
172.1±95.6%; 10 mM, 284.5±119.4% (P<0.05).
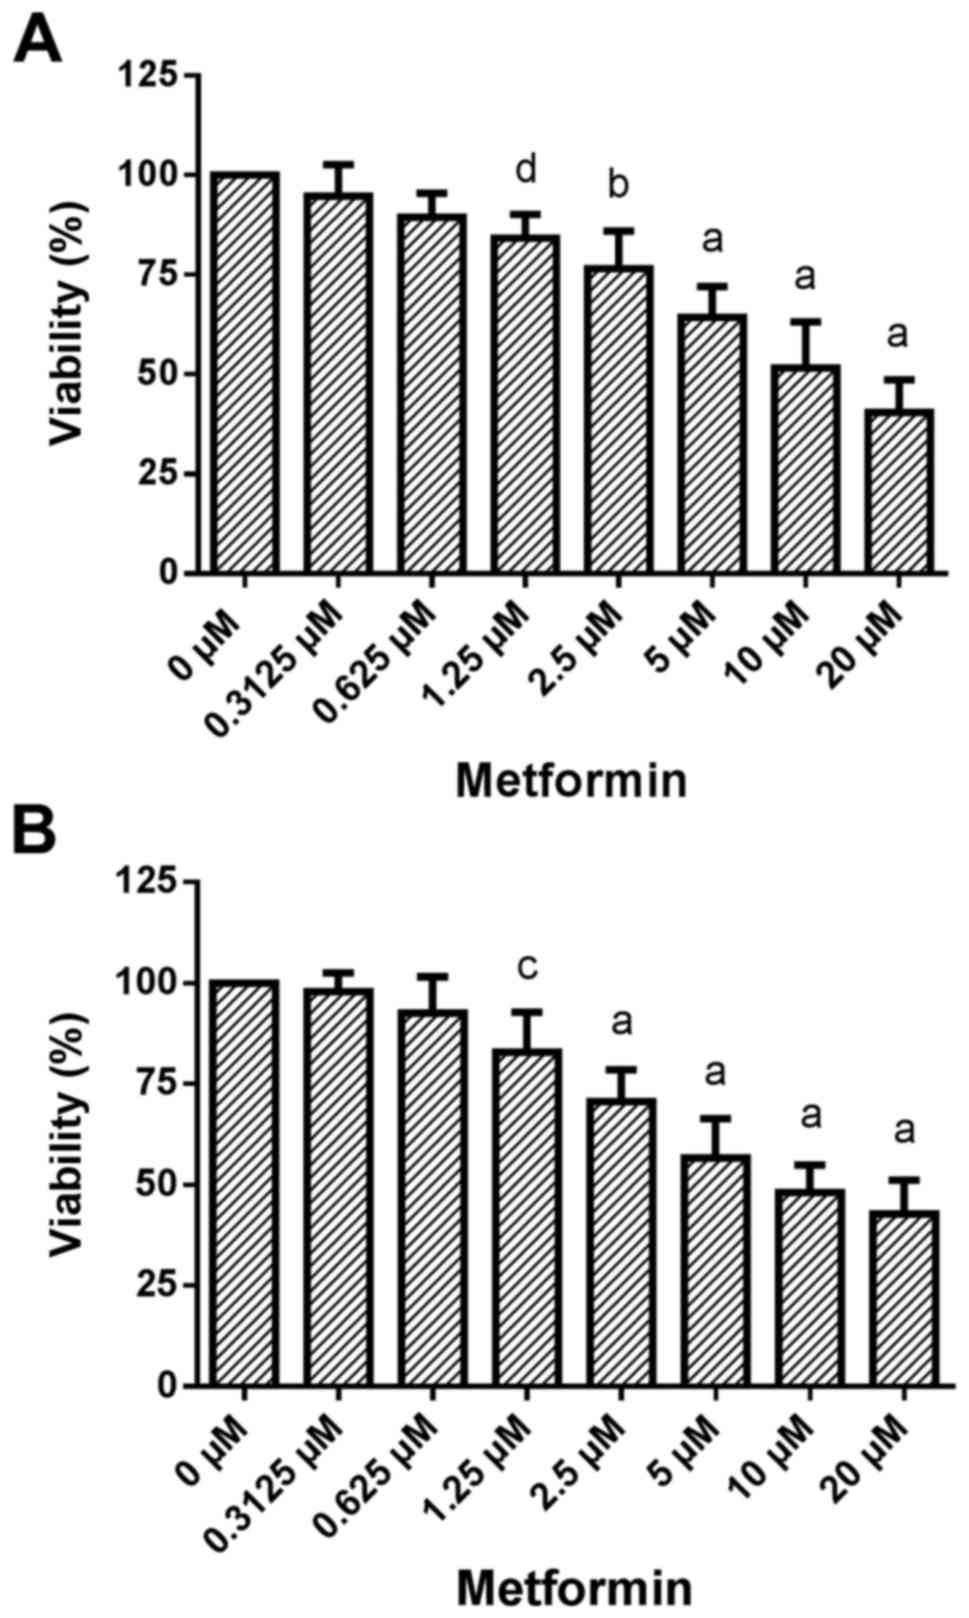
Dose-response effects of metformin treatment on cell
viability. Treatment of HCC1806 (Fig.
4A) and MDA-MB-231 (Fig. 4B)
human breast cancer cells with increasing concentrations of
metformin (0.3125, 0.625, 1.25, 2.5, 5, 10 and 20 µM) for 96 h
resulted in a significant dose-dependent reduction in
viability.
A very slight decrease in the number of living
HCC1806 cells to 94.8±7.9% of the control (C=100%) was observed at
0.3125 µM concentration of metformin. A concentration of 0.625 µM
of metformin resulted in a slight decrease in cell number to
89.4±6.0% of the control (C=100%). At a 1.25 µM concentration of
metformin, the decrease in cell number became significant
[84.2±5.9% of the control (C=100%; P<0.05)]. A concentration of
2.5 µM of metformin resulted in a significant reduction in living
HCC1806 cells to 76.6±9.5% of the control (C=100%; P<0.001). At
5 and 10 µM, as well as at 20 µM concentrations of metformin a
decrease in living HCC1806 cells to 64.3±7.7, 51.6±11.6 and
40.5±8.1% of the control (C=100%; P<0.0001 in all
concentrations) was observed, respectively.
When MDA-MB-231 cells were treated with metformin
for 96 h the number of living cells was dose-dependently reduced
vs. the control (C=100%) as follows: 0.3125 µM, 98.0±4.5%; 0.625
µM, 92.5±9.0%; 1.25 µM, 82.9±9.9% (P<0.01); 2.5 µM, 70.6±7.8%
(P<0.0001); 5 µM, 56.7±9.7% (P<0.0001); 10 µM, 48.1±6.8%
(P<0.0001); 20 µM, 42.8±8.3% (P<0.0001).
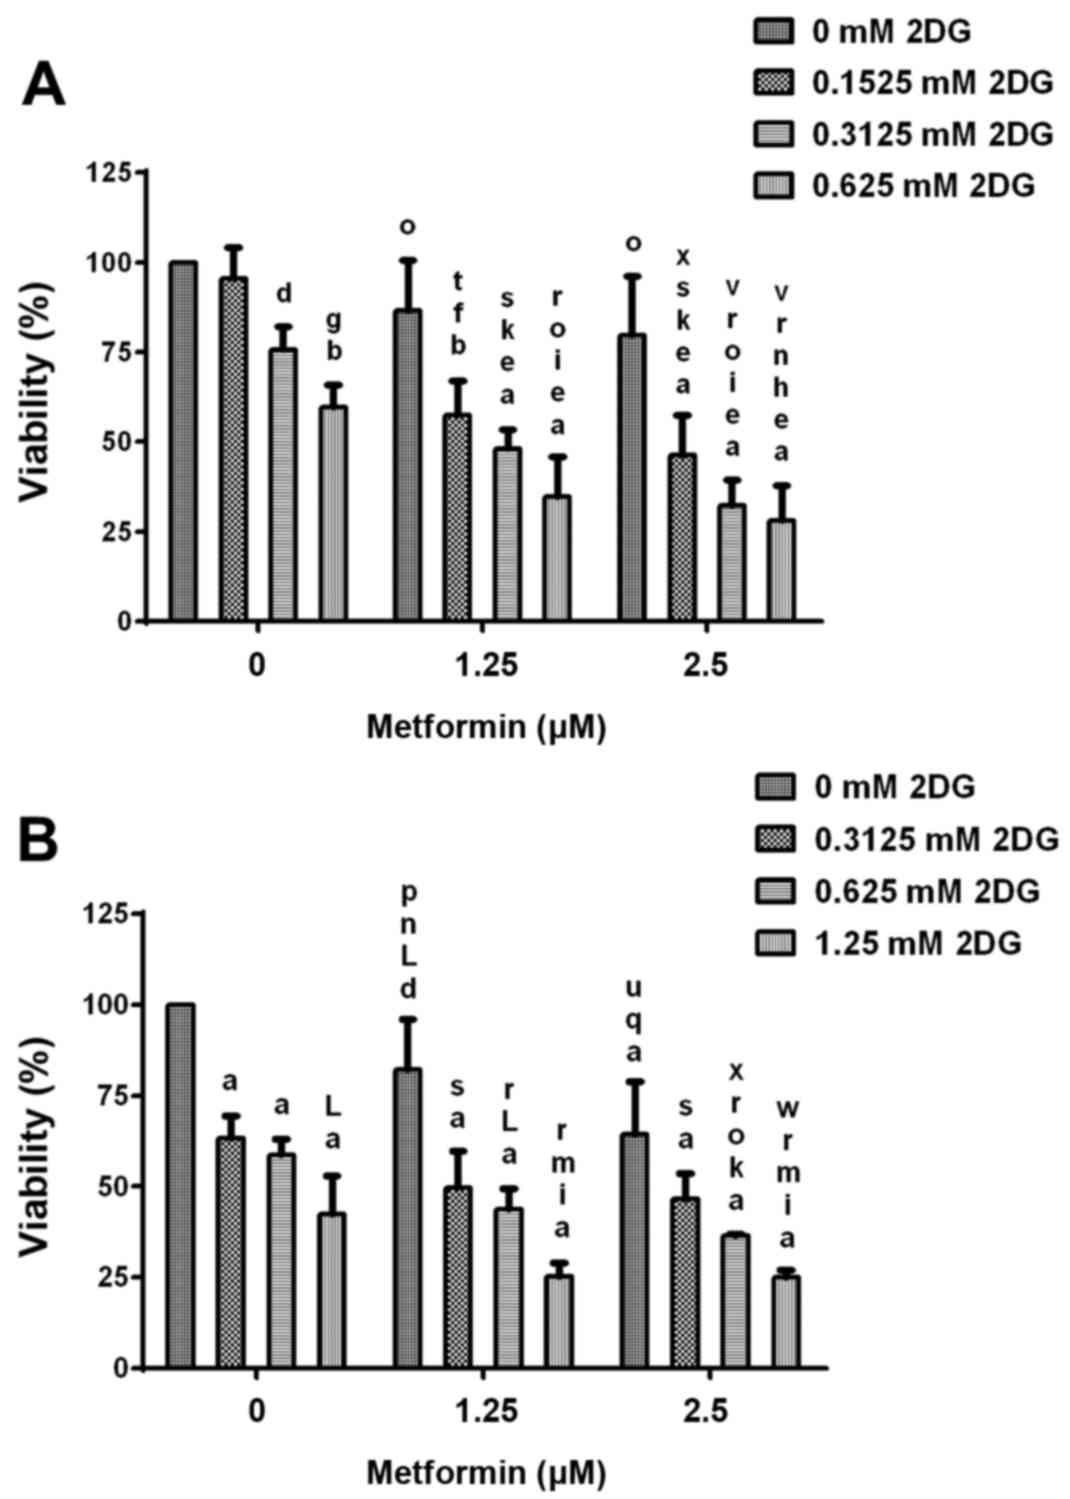
Cell viability after treatment with
2DG alone and in combination with metformin
During treatment of HCC1806 breast cancer cells with
2.5, 5 and 10 mM concentrations of 2DG in combination with 2.5 and
5 µM concentrations of metformin, a classic dose-response effect
was not shown (data not shown), indicating that at these
concentrations the maximal effects in this cell line were achieved.
Therefore, experiments using lower concentrations of 2DG and
metformin were performed (Fig. 5).
Treatment of HCC1806 human breast cancer cells (Fig. 5A) without or with increasing
concentrations (0.1525, 0.3125 and 0.625 mM) of 2DG and without or
with increasing concentrations (1.25 and 2.5 µM) of metformin for
96 h resulted in a significant dose-dependent reduction in cell
viability. Co-treatment with both agents resulted in a
significantly dose-dependent higher reduction of viability than 2DG
or metformin alone. At the highest concentrations of 2DG (0.625 mM)
and metformin (2.5 µM), viability of the HCC1806 cells was reduced
to 28.1±9.7% of the control (C=100%; P<0.0001). Treatment with
0.625 mM 2DG alone resulted in a decrease in viability to 59.5±6.3%
of the control (C=100%; P<0.001). After treatment with metformin
alone (2.5 µM), viability was reduced to 79.7±16.4% of the control
(C=100%).
Treatment of MDA-MB-231 human breast cancer cells
(Fig. 5B) without or with
increasing concentrations (0.3125, 0.625 and 1.25 mM) of 2DG and
without or with increasing concentrations (1.25 and 2.5 µM) of
metformin for 96 h resulted in a significant dose-dependent
reduction in cell number. Co-treatment with both agents resulted in
a significantly higher dose-dependent reduction in cell number than
2DG or metformin alone. At the highest concentrations of 2DG (1.25
mM) and metformin (2.5 µM), the viability of the HCC1806 cells was
reduced to 25.1±2.0% of the control (C=100%; P<0.0001).
Treatment with 1.25 mM 2DG alone resulted in a decrease in
viability to 42.5±10.5% of the control (C=100%; P<0.0001). After
treatment with metformin alone (2.5 µM), viability was reduced to
64.5±14.4% of the control (C=100%; P<0.0001).
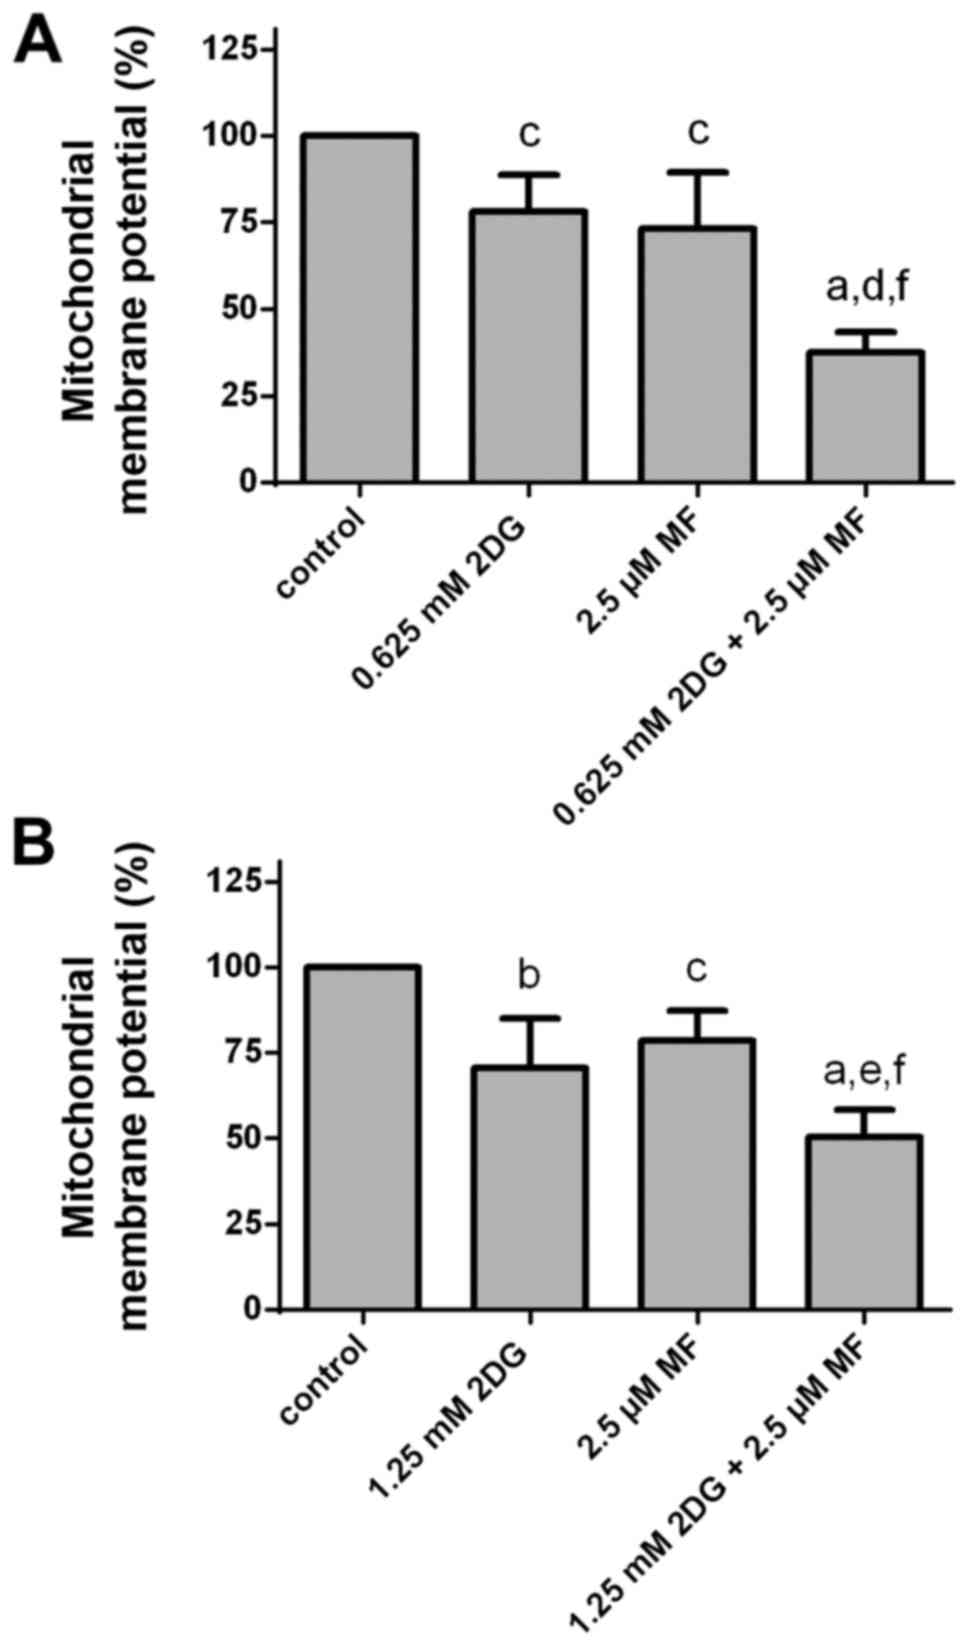
Effects of 2DG alone and in
combination with metformin on mitochondrial membrane potential
Treatment of HCC1806 (Fig. 6A) and MDA-MB-231 (Fig. 6B) human breast cancer cells with 2DG
(HCC1806, 0.625 mM; MDA-MB-231, 1.25 mM) or with metformin (2.5 µM)
for 48 h resulted in a reduction in mitochondrial membrane
potential (ΔΨm). Co-treatment with both agents resulted in a
significant higher reduction in mitochondrial membrane potential
than with 2DG or metformin alone.
After treatment of HCC1806 cells with a 0.625 mM
concentration of 2DG for 48 h, the mitochondrial membrane potential
was significantly decreased to 78.2±10.6% of the control (C=100%;
P<0.05). A concentration of 2.5 µM of metformin resulted in a
significant reduction in mitochondrial membrane potential to
73.3±16.1% of the control (C=100%; P<0.05). At 0.625 mM
concentration of 2DG in combination with 2.5 µM concentration of
metformin, a significant reduction in mitochondrial membrane
potential to 37.5±6.0% of the control (C=100%; P<0.0001 vs.
control; P<0.001 vs. 2DG alone; P<0.01 vs. metformin alone)
was observed.
When MDA-MB-231 cells were treated with 2DG (1.25
mM) for 48 h, the mitochondrial membrane potential was
significantly reduced to 70.6±14.4% of the control (C=100%;
P<0.01). A concentration of 2.5 µM of metformin resulted in a
significant decrease in mitochondrial membrane potential to
78.5±8.7% of the control (C=100%; P<0.05). At 1.25 mM
concentration of 2DG in combination with 2.5 µM concentration of
metformin a significant reduction in mitochondrial membrane
potential to 50.3±8.0% of the control (C=100%; P<0.0001 vs.
control; P<0.05 vs. 2DG alone; P<0.01 vs. metformin alone)
was observed.
Discussion
In the present study, we analyzed the combination of
2DG and metformin, two drugs which target two key sources of cell
energy and may represent a major advantage over classic
chemotherapies alone or in combination with 2DG. Our results showed
that inhibition of glycolysis using 2DG significantly reduced the
viability of the human breast cancer cells in a dose-dependent
manner. In addition, anti-diabetic drug metformin showed
significant and dose-dependent antitumor activity in the human
breast cancer cells. 2DG in combination with metformin led to a
significant higher reduction in viability than 2DG or metformin
alone. After co-treatment with 0.625 mM 2DG and 2.5 µM metformin,
HCC1806 cell viability was reduced by at least 72%. At 0.625 mM
concentration of 2DG and 2.5 µM concentration of metformin, cell
viability of the MDA-MB-231 cells was reduced by at least 64%. Even
lower concentrations of 2DG and metformin resulted in an impressive
decrease in cell viability. These concentrations are below those
achieved with doses normally administered in human treatment. In a
dose-escalation trial with 2DG orally administered once daily, 63
mg/kg was found to be a clinically well-tolerable dose (23). The median maximum plasma
concentration of 2DG at 63 mg/kg was 116 µg/ml (0.7 mM) (23). A typical treatment dose of metformin
is 1,000–2,500 mg given twice daily, resulting in steady state
plasma concentrations of ~1 µg/ml (7.7 µM) reached within 24–48 h
(24,25). During controlled clinical trials,
maximum metformin plasma levels did not exceed 5 µg/ml (38.7 µM),
even at maximum doses (24). Higher
concentrations of 2DG (>1.25 mM) in our co-treatment settings
resulted in a further decrease in cell viability in vitro.
However, these higher concentrations may not be well tolerated in
patients.
Treatment of the breast cancer cells with 2DG
resulted in a strong induction of apoptosis. Co-treatment with 2DG
in combination with metformin induced a significantly higher
decrease in viability and a significant higher increase in
apoptosis than treatment with the respective single substances. Our
observations regarding the antitumor effectiveness of both
substances alone and in combination are in agreement with the
results of other groups. Zhang and Aft demonstrated the
antiproliferative effects of 2DG in cell lines of different tumor
entities including breast cancer (26). In addition, our results confirm data
shown by Cheong et al, indicating that co-treatment with 2DG
and metformin is effective against breast cancer cell lines
(27). However, Cheong et al
used concentrations of 2DG (4 mM) and metformin (5 mM), which are
higher than well-tolerated concentrations or plasma accessible
concentrations in human beings (23–25).
In another publication, a combination of 2DG (1 mM) and metformin
(1 and 5 mM) was successfully tested in prostate cancer cells using
metformin concentrations which are higher than those accessible in
blood plasma of human beings (28).
Doses much greater than the pharmacologic
concentration of metformin inhibit mitochondrial complex I and
induce cell cycle arrest (29–33).
Pharmacologic metformin concentrations activate AMP-activated
protein kinase (AMPK) and inhibit expression of gluconeogenic
genes. In addition, pharmacologic concentrations of metformin
inhibit glycerol-3-phosphate dehydrogenase (GPDH) in mitochondria
resulting in a decrease in gluconeogenesis (34). The glucose analog 2DG inhibits
glycolysis and induces autophagy (35–37).
Co-treatment with 2DG and metformin resulted in significant cell
death, which is associated with a marked decrease in intracellular
ATP concentration, prolonged AMPK activation, and sustained
autophagy (27). However, the
marked antitumor effects of the combination of 2DG and metformin
have the clinical advantage of inducing no negative side-effects.
Only lactic acidosis was reported to be a very rare side-effect in
metformin-treated patients (38).
2DG as a glycolysis inhibitor represents an
attractive option for therapy including combination therapies.
Since increased glycolysis occurs in malignant cells, 2DG acts
specifically in tumor tissue. Therapy utilizing both specific
inhibition of glycolysis using 2DG, and the antitumor activity of
metformin appears to be valuable as an effective strategy for the
treatment of all inoperable, chemotherapy-resistant or recurring
breast cancers and should be further evaluated.
Acknowledgements
We thank Sonja Blume for the excellent technical
assistance. The present study was supported by a grant from the
Deutsche Krebshilfe, Dr Mildred Scheel Stiftung (no. 111027).
References
|
1
|
Warburg O: The Metabolism of Tumors.
Arnold Constable; London: pp. 254–270. 1930
|
|
2
|
Yamamoto T, Seino Y, Fukumoto H, Koh G,
Yano H, Inagaki N, Yamada Y, Inoue K, Manabe T and Imura H:
Over-expression of facilitative glucose transporter genes in human
cancer. Biochem Biophys Res Commun. 170:223–230. 1990. View Article : Google Scholar : PubMed/NCBI
|
|
3
|
Pelicano H, Martin DS, Xu RH and Huang P:
Glycolysis inhibition for anticancer treatment. Oncogene.
25:4633–4646. 2006. View Article : Google Scholar : PubMed/NCBI
|
|
4
|
Kaplan O, Navon G, Lyon RC, Faustino PJ,
Straka EJ and Cohen JS: Effects of 2-deoxyglucose on drug-sensitive
and drug-resistant human breast cancer cells: Toxicity and magnetic
resonance spectroscopy studies of metabolism. Cancer Res.
50:544–551. 1990.PubMed/NCBI
|
|
5
|
Laszlo J, Humphreys SR and Goldin A:
Effects of glucose analogues (2-deoxy-D-glucose,
2-deoxy-D-galactose) on experimental tumors. J Natl Cancer Inst.
24:267–281. 1960.PubMed/NCBI
|
|
6
|
Aft RL, Zhang FW and Gius D: Evaluation of
2-deoxy-D-glucose as a chemotherapeutic agent: Mechanism of cell
death. Br J Cancer. 87:805–812. 2002. View Article : Google Scholar : PubMed/NCBI
|
|
7
|
Bell SE, Quinn DM, Kellett GL and Warr JR:
2-Deoxy-D-glucose preferentially kills multidrug-resistant human KB
carcinoma cell lines by apoptosis. Br J Cancer. 78:1464–1470. 1998.
View Article : Google Scholar : PubMed/NCBI
|
|
8
|
Lee YJ, Galoforo SS, Berns CM, Tong WP,
Kim HR and Corry PM: Glucose deprivation-induced cytotoxicity in
drug resistant human breast carcinoma MCF-7/ADR cells: Role of
c-myc and bcl-2 in apoptotic cell death. J Cell Sci. 110:681–686.
1997.PubMed/NCBI
|
|
9
|
Reutter M, Emons G and Gründker C:
Starving tumors: Inhibition of glycolysis reduces viability of
human endometrial and ovarian cancer cells and enhances antitumor
efficacy of GnRH receptor-targeted therapies. Int J Gynecol Cancer.
23:34–40. 2013. View Article : Google Scholar : PubMed/NCBI
|
|
10
|
Giannarelli R, Aragona M, Coppelli A and
Del Prato S: Reducing insulin resistance with metformin: The
evidence today. Diabetes Metab. 29:6S28–6S35. 2003. View Article : Google Scholar : PubMed/NCBI
|
|
11
|
Nathan DM, Buse JB, Davidson MB,
Ferrannini E, Holman RR, Sherwin R and Zinman B: American Diabetes
Association; European Association for Study of Diabetes: Medical
management of hyperglycemia in type 2 diabetes: A consensus
algorithm for the initiation and adjustment of therapy: A consensus
statement of the American Diabetes Association and the European
Association for the Study of Diabetes. Diabetes Care. 32:193–203.
2009. View Article : Google Scholar : PubMed/NCBI
|
|
12
|
Anisimov VN, Berstein LM, Egormin PA,
Piskunova TS, Popovich IG, Zabezhinski MA, Kovalenko IG, Poroshina
TE, Semenchenko AV, Provinciali M, et al: Effect of metformin on
life span and on the development of spontaneous mammary tumors in
HER-2/neu transgenic mice. Exp Gerontol. 40:685–693. 2005.
View Article : Google Scholar : PubMed/NCBI
|
|
13
|
Anisimov VN, Egormin PA, Piskunova TS,
Popovich IG, Tyndyk ML, Yurova MN, Zabezhinski MA, Anikin IV,
Karkach AS and Romanyukha AA: metformin extends life span of
HER-2/neu transgenic mice and in combination with melatonin
inhibits growth of transplantable tumors in vivo. Cell Cycle.
9:188–197. 2010. View Article : Google Scholar : PubMed/NCBI
|
|
14
|
Ben Sahra I, Laurent K, Loubat A,
Giorgetti-Peraldi S, Colosetti P, Auberger P, Tanti JF, Le
Marchand-Brustel Y and Bost F: The antidiabetic drug metformin
exerts an antitumoral effect in vitro and in vivo through a
decrease of cyclin D1 level. Oncogene. 27:3576–3586. 2008.
View Article : Google Scholar : PubMed/NCBI
|
|
15
|
Janjetovic K, Harhaji-Trajkovic L,
Misirkic-Marjanovic M, Vucicevic L, Stevanovic D, Zogovic N,
Sumarac-Dumanovic M, Micic D and Trajkovic V: In vitro and in vivo
anti-melanoma action of metformin. Eur J Pharmacol. 668:373–382.
2011. View Article : Google Scholar : PubMed/NCBI
|
|
16
|
Memmott RM, Mercado JR, Maier CR, Kawabata
S, Fox SD and Dennis PA: Metformin prevents tobacco
carcinogen-induced lung tumorigenesis. Cancer Prev Res.
3:1066–1076. 2010. View Article : Google Scholar
|
|
17
|
Rattan R, Graham RP, Maguire JL, Giri S
and Shridhar V: Metformin suppresses ovarian cancer growth and
metastasis with enhancement of cisplatin cytotoxicity in vivo.
Neoplasia. 13:483–491. 2011. View Article : Google Scholar : PubMed/NCBI
|
|
18
|
Zhou G, Myers R, Li Y, Chen Y, Shen X,
Fenyk-Melody J, Wu M, Ventre J, Doebber T, Fujii N, et al: Role of
AMP-activated protein kinase in mechanism of metformin action. J
Clin Invest. 108:1167–1174. 2001. View
Article : Google Scholar : PubMed/NCBI
|
|
19
|
Camacho L, Dasgupta A and Jiralerspong S:
Metformin in breast cancer - an evolving mystery. Breast Cancer
Res. 17:882015. View Article : Google Scholar : PubMed/NCBI
|
|
20
|
Emons G, Ortmann O, Becker M, Irmer G,
Springer B, Laun R, Hölzel F, Schulz KD and Schally AV: High
affinity binding and direct antiproliferative effects of LHRH
analogues in human ovarian cancer cell lines. Cancer Res.
53:5439–5446. 1993.PubMed/NCBI
|
|
21
|
Emons G, Schröder B, Ortmann O, Westphalen
S, Schulz KD and Schally AV: High affinity binding and direct
antiproliferative effects of luteinizing hormone-releasing hormone
analogs in human endometrial cancer cell lines. J Clin Endocrinol.
77:1458–1464. 1993. View Article : Google Scholar
|
|
22
|
Irmer G, Bürger C, Müller R, Ortmann O,
Peter U, Kakar SS, Neill JD, Schulz KD and Emons G: Expression of
the messenger RNAs for luteinizing hormone-releasing hormone (LHRH)
and its receptor in human ovarian epithelial carcinoma. Cancer Res.
55:817–822. 1995.PubMed/NCBI
|
|
23
|
Raez LE, Papadopoulos K, Ricart AD,
Chiorean EG, Dipaola RS, Stein MN, Lima Rocha CM, Schlesselman JJ,
Tolba K, Langmuir VK, et al: A phase I dose-escalation trial of
2-deoxy-D-glucose alone or combined with docetaxel in patients with
advanced solid tumors. Cancer Chemother Pharmacol. 71:523–530.
2013. View Article : Google Scholar : PubMed/NCBI
|
|
24
|
FDA: Metformin: Official FDA Information.
Side-Effects And Uses. 2011.https://www.fda.gov/ohrms/dockets/dailys/02/May02/053102/800471e6.pdfAccession
date: October 25, 2016.
|
|
25
|
Shank JJ, Yang K, Ghannam J, Cabrera L,
Johnston CJ, Reynolds RK and Buckanovich RJ: Metformin targets
ovarian cancer stem cells in vitro and in vivo. Gynecol Oncol.
127:390–397. 2012. View Article : Google Scholar : PubMed/NCBI
|
|
26
|
Zhang F and Aft RL: Chemosensitizing and
cytotoxic effects of 2-deoxy-D-glucose on breast cancer cells. J
Cancer Res Ther. 5:(Suppl 1). S41–S43. 2009. View Article : Google Scholar : PubMed/NCBI
|
|
27
|
Cheong JH, Park ES, Liang J, Dennison JB,
Tsavachidou D, Nguyen-Charles C, Cheng Wa K, Hall H, Zhang D, Lu Y,
et al: Dual inhibition of tumor energy pathway by 2-deoxyglucose
and metformin is effective against a broad spectrum of preclinical
cancer models. Mol Cancer Ther. 10:2350–2362. 2011. View Article : Google Scholar : PubMed/NCBI
|
|
28
|
Ben Sahra I, Laurent K, Giuliano S,
Larbret F, Ponzio G, Gounon P, Le Marchand-Brustel Y,
Giorgetti-Peraldi S, Cormont M, Bertolotto C, et al: Targeting
cancer cell metabolism: The combination of metformin and
2-deoxyglucose induces p53-dependent apoptosis in prostate cancer
cells. Cancer Res. 70:2465–2475. 2010. View Article : Google Scholar : PubMed/NCBI
|
|
29
|
Andrzejewski S, Gravel SP, Pollak M and
St-Pierre J: Metformin directly acts on mitochondria to alter
cellular bioenergetics. Cancer Metab. 2:122014. View Article : Google Scholar : PubMed/NCBI
|
|
30
|
Bridges HR, Jones AJ, Pollak MN and Hirst
J: Effects of metformin and other biguanides on oxidative
phosphorylation in mitochondria. Biochem J. 462:475–487. 2014.
View Article : Google Scholar : PubMed/NCBI
|
|
31
|
Drahota Z, Palenickova E, Endlicher R,
Milerova M, Brejchova J, Vosahlikova M, Svoboda P, Kazdova L,
Kalous M, Cervinkova Z, et al: Biguanides inhibit complex I, II and
IV of rat liver mitochondria and modify their functional
properties. Physiol Res. 63:1–11. 2014.PubMed/NCBI
|
|
32
|
El-Mir MY, Nogueira V, Fontaine E, Avéret
N, Rigoulet M and Leverve X: Dimethylbiguanide inhibits cell
respiration via an indirect effect targeted on the respiratory
chain complex I. J Biol Chem. 275:223–228. 2000. View Article : Google Scholar : PubMed/NCBI
|
|
33
|
Owen MR, Doran E and Halestrap AP:
Evidence that metformin exerts its anti-diabetic effects through
inhibition of complex 1 of the mitochondrial respiratory chain.
Biochem J. 348:607–614. 2000. View Article : Google Scholar : PubMed/NCBI
|
|
34
|
He L and Wondisford FE: metformin action:
Concentrations matter. Cell Metab. 21:159–162. 2015. View Article : Google Scholar : PubMed/NCBI
|
|
35
|
Brown J: Effects of 2-deoxyglucose on
carbohydrate metablism: Review of the literature and studies in the
rat. Metabolism. 11:1098–1112. 1962.PubMed/NCBI
|
|
36
|
DiPaola RS, Dvorzhinski D, Thalasila A,
Garikapaty V, Doram D, May M, Bray K, Mathew R, Beaudoin B, Karp C,
et al: Therapeutic starvation and autophagy in prostate cancer: A
new paradigm for targeting metabolism in cancer therapy. Prostate.
68:1743–1752. 2008. View Article : Google Scholar : PubMed/NCBI
|
|
37
|
McComb RB and Yushok WD: Metabolism of
ascites tumor cells. Iv. Enzymatic reactions involved in
adenosinetriphosphate degradation induced by 2-deoxyglucose. Cancer
Res. 24:198–205. 1964.PubMed/NCBI
|
|
38
|
Lalau JD and Race JM: Lactic acidosis in
metformin therapy. Drugs. 58:(Suppl 1). 55–82. 1999. View Article : Google Scholar : PubMed/NCBI
|