Introduction
Worldwide, colorectal cancer (CRC) is the third most
common cancer in men and the second in women (1). The mortality rate can be reduced by
the detection of early-stage disease, since the majority of cases
are diagnosed at the late stage, and distant metastasis is the
major cause of death in individuals suffering from CRC. Therefore,
there is a high need for identification of predictive markers for
early detection and more effective prevention and treatment of
CRC.
Although many factors and biological mechanisms
related to CRC development have been defined, the etiology of this
disease is not completely known. The most important causes of CRC
include molecular abnormalities, including alterations in gene
expression that can be due to aberrations in the epigenetic
regulation of chromatin structure and function (2,3).
Chromatin activity is influenced by the modulation of nucleosomal
histones including their acetylation (4). Histone acetylotransferase (HAT) p300,
encoded by the E1A binding protein P300 (EP300) gene,
mediates histone and non-histone protein acetylation and is
involved in gene activation (5).
Apart from HAT activity, p300 can also function as a bridge by
connecting sequence-specific transcription factors to the
transcription apparatus. Moreover, p300 acts as a protein scaffold
for the assembly of multicomponent complexes that confer
transcriptional activation (6). The
p300 transcriptional coactivator protein plays a central role in
coordinating and integrating multiple signal-dependent events with
the transcription apparatus, allowing the appropriate level of gene
activity to occur in response to various physiological cues that
influence important cellular processes such as proliferation,
differentiation, cell cycle regulation, DNA damage response and
apoptosis (6,7). The EP300 gene is altered in
various human tumors. Somatic mutations in this gene have been
observed in gastric, colorectal, breast and pancreatic cancers
(8,9). Most EP300 mutations may clearly
lead to the loss of function, supporting the suggestion that loss
of p300 activity contributes to tumor development (10). Moreover, high expression of p300 was
found to be associated with poor prognosis in breast,
hepatocellular, nasopharyngeal, small and non-small cell lung
cancers (11–15). The expression dynamics of p300 in
CRC and its prognostic significance remain unclear. Huh et
al reported that p300 overexpression was an indicator of good
prognosis in patients with CRC (16), while in a study by Ishihama et
al, the opposite relationship was revealed since p300
overexpression correlated with a poor prognosis (17). The role of p300 in tumorigenesis is
debatable as various studies show that this protein is a tumor
suppressor, while others indicate that p300 is a coactivator of
several oncogenic transcription factors and promotes cell cycle
progression and tumor metastasis (5,7). p300
is an important cofactor in the proper functioning of other
tumor-suppressor proteins, including p53. The p53 pathway is
modulated by p300 at multiple levels (7,18).
p300 controls p53 stability by regulating its ubiquitination and
degradation (19). Vleugel et
al indicated that p300 is a cofactor highly associated with p53
accumulation in invasive breast cancer (20). After DNA damage, p53 is activated,
inter alia, by acetylation at specific amino acid residues
by p300. It has been suggested that p53 acetylation also increases
the stability of the p53-DNA complex at target gene promoters.
Moreover, p300 is required for p53-mediated transactivation of
target genes through its coactivator function and acetylation of
target gene histones (7,21). p53 is a transcriptional regulator of
the BCL2 associated X, apoptosis regulator (BAX) gene, which
encodes a downstream pro-apoptotic effector protein (22), and p300 knockdown has been shown to
inhibit apoptosis, by disrupting the p53-mediated response to DNA
damage (7,23).
Studies of the expression of EP300, tumor
protein P53 (TP53) and BAX genes in CRC and their
prognostic significance provide contradictory results (16,17,24–29).
Furthermore, the association between the expression levels of these
genes remains ambiguous. Therefore, the aim of the present study
was to analyze and compare the expression levels of EP300,
TP53 and BAX genes in samples of tumor and unchanged
colorectal tissues of CRC patients by quantitative real-time PCR
(qPCR) and immunohistochemical (IHC) techniques. Moreover, we
studied the relationships between the expression levels of analyzed
factors in CRC tissues. To estimate the prognostic value of the
studied gene expression levels, we investigated their correlations
with clinicopathological parameters, as well as the overall
survival (OS) of patients with CRC.
Materials and methods
Patients and the collection of tissue
samples
The present study was performed in accordance with
the ethical standards and was approved by the Bioethics Committee
of the University of Warmia and Mazury in Olsztyn, Poland (decision
nos. 3/2010 and 34/2010), and written informed consent regarding
the participation in the study and use of tissue was obtained from
each patient.
The specimens were collected at the Hospital of the
Ministry of Internal Affairs and Administration in Olsztyn (Poland)
from 2010 to 2013. The study included 121 patients with CRC (mean
age ± SD, 67.91±10.57 years; range, 33–91 years). None of the CRC
patients had a second neoplastic disease or suffered from
inflammatory bowel disease. None of the patients had previously
undergone chemotherapy or radiotherapy. Clinical and demographic
data were obtained at the time of enrollment. Data concerning OS
were collected for all patients.
Two types of matched samples were obtained within 20
min after the partial surgical resection of the large intestine: i)
tumor tissue and ii) macroscopically unchanged mucosa from a
distant part of the resected large intestine. Specimens were
immediately frozen in liquid nitrogen, and stored at −80°C for qPCR
analysis, whereas for routine histological evaluation and
immunohistochemistry, the samples were fixed in 10% neutral
buffered formalin and further processed into paraffin blocks.
Total RNA extraction, reverse
transcription and real-time quantitative PCR
Total RNA was extracted from all studied tissues and
reverse transcribed as previously described (30). Quantification of genes expression
was carried out using ABI 7500/7500 Fast Real-Time PCR System (Life
Technologies, Applied Biosystems, Foster City, CA, USA).
Hypoxanthine phosphoribosyltransferase 1 (HPRT1) gene was
used as an internal control to normalize the transcript levels of
EP300, TP53 and BAX. The levels of
EP300, TP53, BAX and HPRT1 cDNAs in
collected samples were determined using TaqMan® Fast
Advanced Master Mix and a respective TaqMan® Gene
Expression Assay (for EP300, Hs00914223_m1; TP53,
Hs01034249_m1; BAX, Hs00180269_m1; and HPRT1,
Hs02800695_m1; all from Life Technologies, Applied Biosystems)
according to the manufacturer's instructions, and using the
following conditions: polymerase activation for 20 sec at 95°C,
followed by 40 cycles of denaturation at 95°C for 3 sec and
annealing/extension at 60°C for 30 sec. All samples were prepared
in duplicates. No template control reactions were performed for
each qPCR run. Standard curves consisting of serial dilutions of
the appropriate cDNA were used to control the efficiency of the
qPCR reactions. Relative quantification of EP300,
TP53 and BAX expression was evaluated using the ΔΔCt
method (31). The fold-change in
the relative gene expression was determined by calculating the
2−ΔΔCt value. Fold increase >1 (2−ΔΔCt
>1) indicated overexpression of target RNA in CRC tissue, and
fold decrease <1 (2−ΔΔCt <1) indicated its
downregulation.
Immunohistochemistry and staining
analysis
Immunoreactivity of the studied proteins was
analyzed in sections of 49 tumor and 37 unchanged colorectal
tissues of CRC patients. Immunohistochemistry was performed
according to previously described methods (30), using rabbit primary antibodies
directed against p300 [diluted 1:400 in phosphate-buffered saline
(PBS); #ab61217] or BAX (1:400; #ab32503) (both from Abcam,
Cambridge, UK). The p53 protein immunostaining was conducted using
the Leica ST5010 Autostainer (Leica, Wetzlar, Germany) and
ready-to-use antibodies (#IR616; Dako, Glostrup, Denmark) according
to the manufacturer's instructions. The negative controls were
performed by omitting the primary antibody.
The p300, p53 or BAX immunostained sections were
evaluated using Olympus BX41 light microscope (Olympus, Tokyo,
Japan) by a pathologist who was blinded to the patient clinical
data. Immunoreactivity of p300 and BAX was assessed in enterocytes
or cancer cells of the studied sections using a scale based on the
reaction intensity (0, no reaction; 10, up to 10%; 30, 11–30%; 60,
31–60%; 80, 61–80%; and 100, >80%), while immunostaining of p53
was evaluated using a scale based on the percentage of cells
showing positive reaction (0, absence of staining; 10, when 1–10%
cells were stained; 30, 11–30%; 60, 31–60%; 80, 61–80%; and 100,
>80%). Based on median expression values, CRC cases which showed
expression scores <30 were regarded as having ‘low’ expression,
whereas scores ≥30 were regarded as ‘high’ p300, p53 or BAX
expression.
Statistical analyses
Statistical analyses were performed using Prism 6
(GraphPad Software, La Jolla, CA, USA) and STATISTICA v.10
(StatSoft, Tulsa, OK, USA) software. The differences in mRNA and
protein expression between matched tumor and unchanged colorectal
tissue samples of CRC patients were examined by the Wilcoxon
matched-pairs test. The correlations between the demographic,
clinicopathological and molecular parameters were analyzed by
Fisher's exact and Chi-square tests. Pearson's correlation
coefficient was used to determine the relationship between the
expression levels of the studied factors. The univariate and
multivariate survival associations were analyzed using the Cox
proportional hazards regression model. The survival curves were
plotted according to the Kaplan-Meier method. In all the analyses,
the results were considered statistically significant at
P<0.05.
Results
Altered expression of EP300, TP53 and
BAX mRNAs in CRC tissues
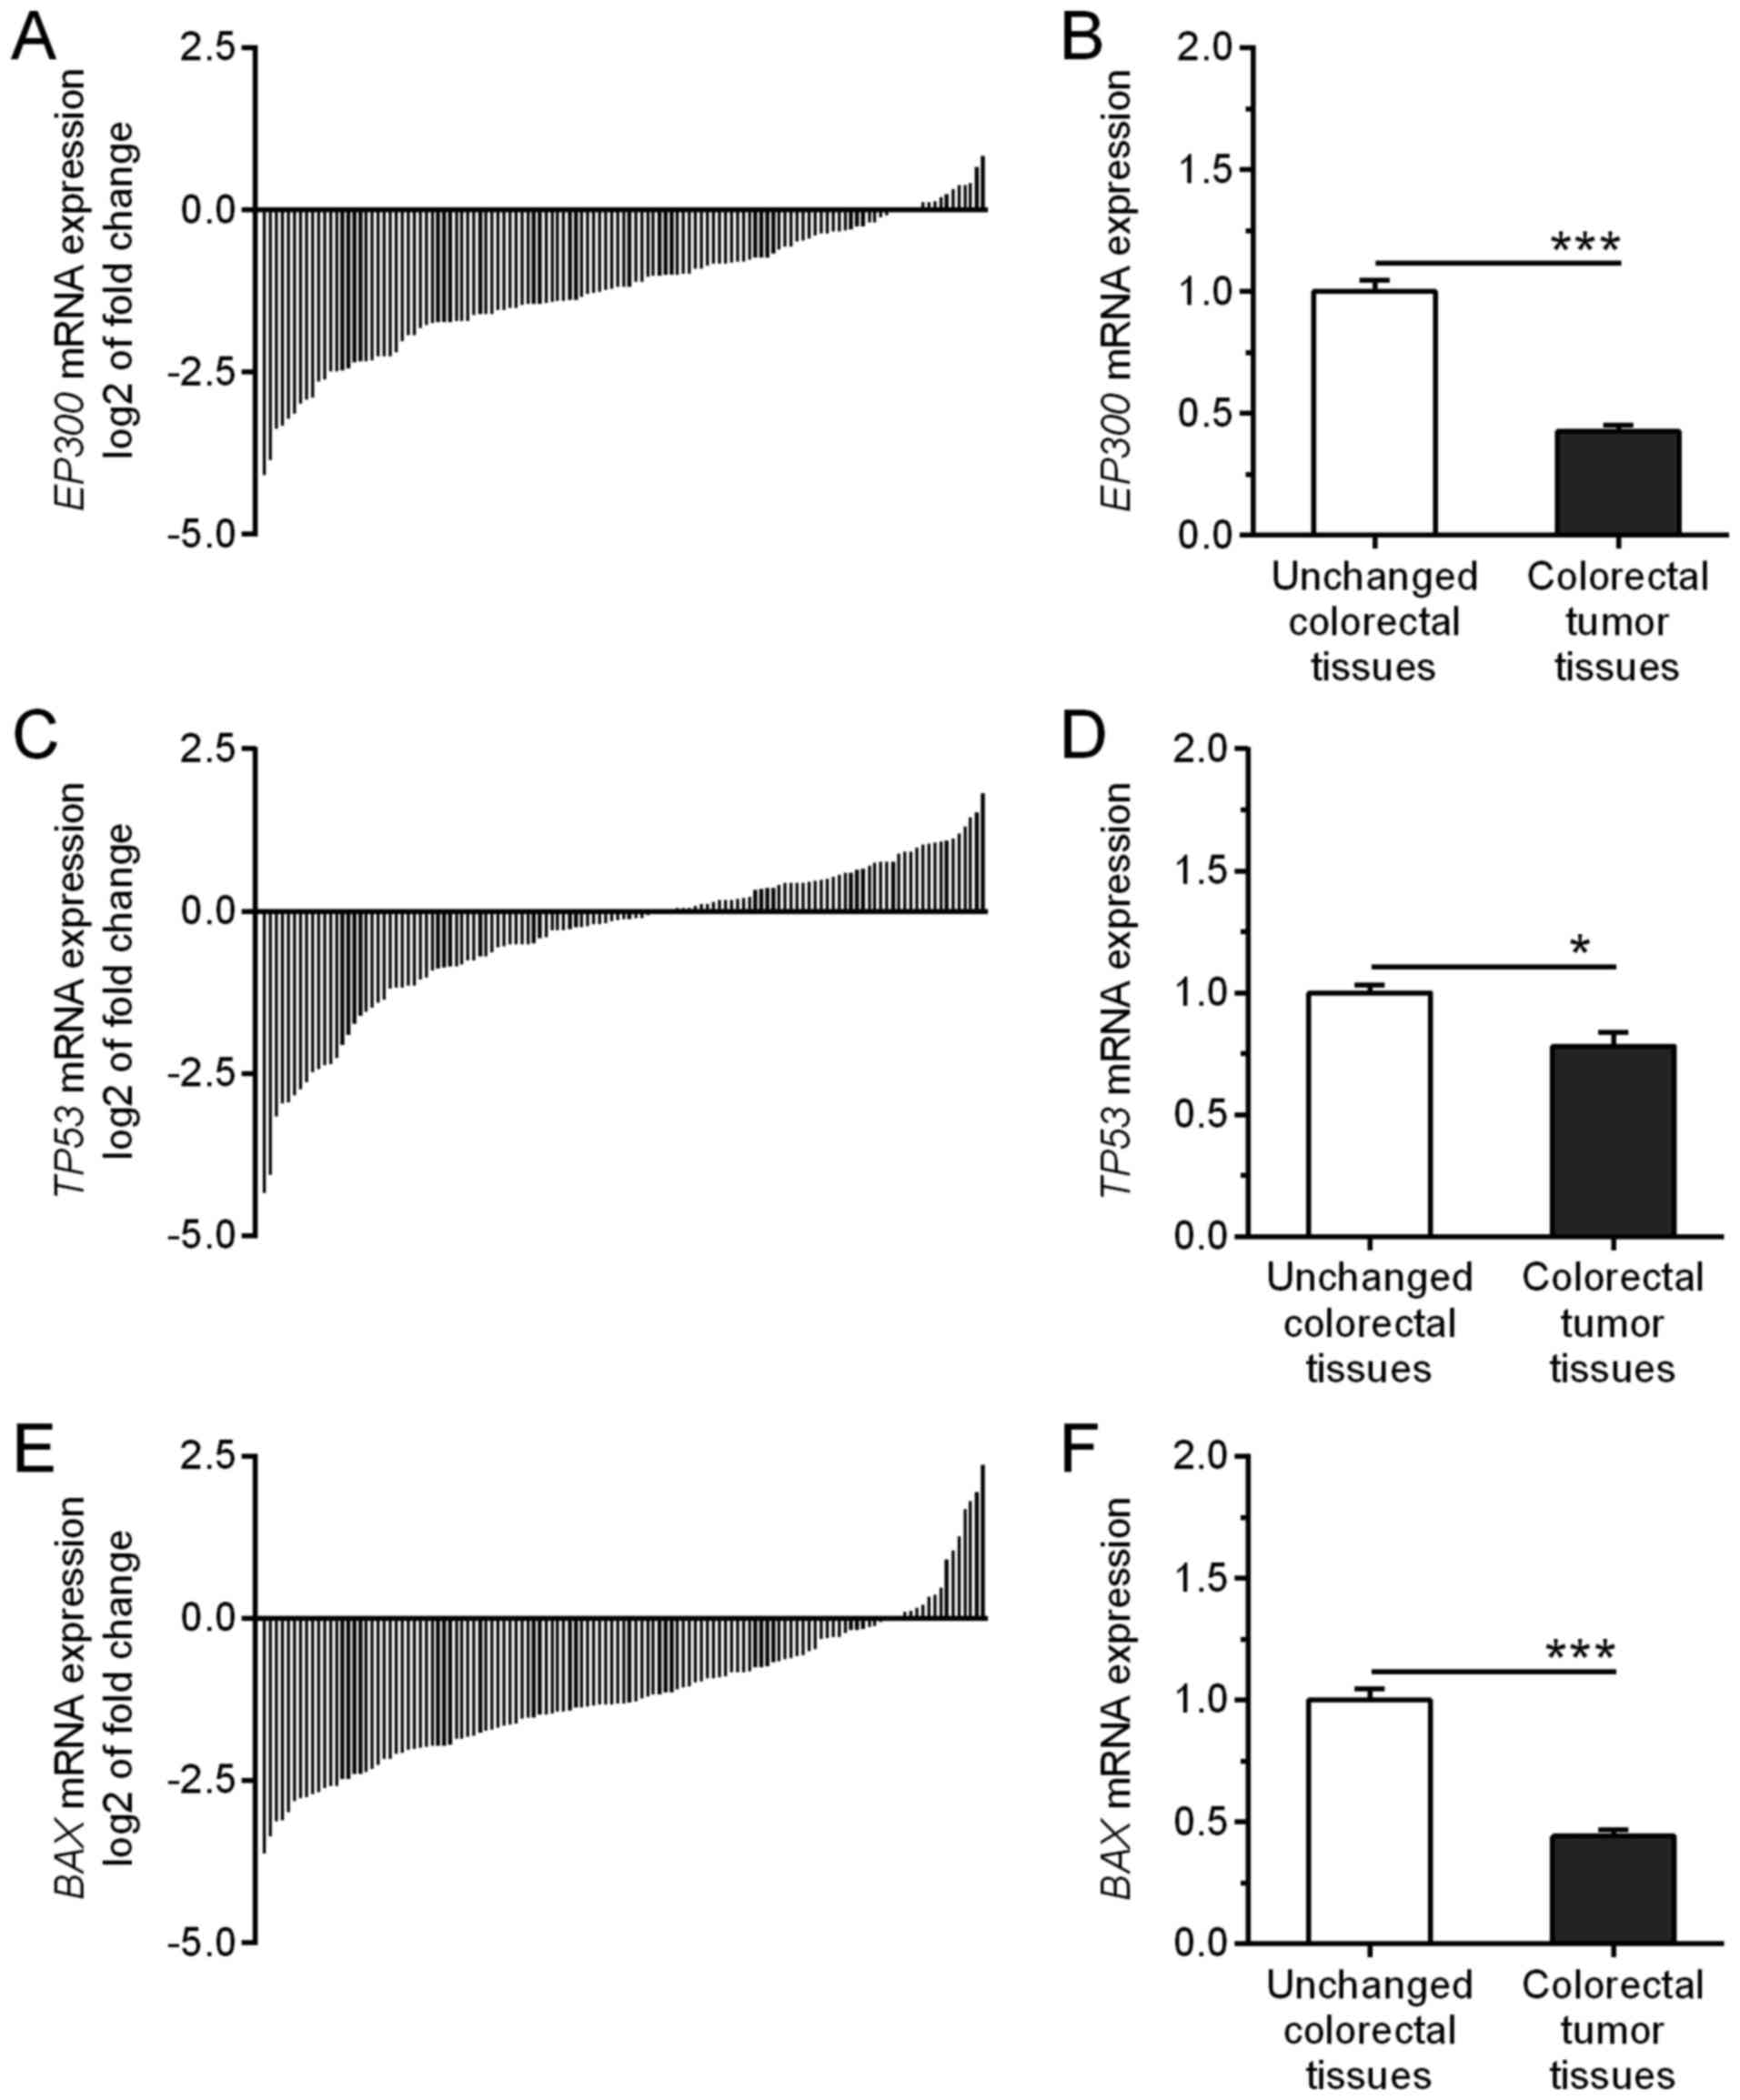
Among the 121 tumor specimens tested, the relative
EP300 mRNA level (tumor tissue vs. matching unchanged mucosa
of CRC patients) was decreased in 106 (87.6%) tumors while it was
increased in 15 (12.4%) cases (Fig.
1A). The average expression of EP300 mRNA was
significantly decreased in the tumor tissues when compared to that
noted in the unchanged tissue of the CRC patients (0.43±0.02 vs.
1.00±0.05; P<0.0001; Fig. 1B).
The relative expression of TP53 mRNA was downregulated in 67
(55.4%) tumors whereas it was upregulated in 54 (44.6%) specimens
(Fig. 1C; Table I). The average expression of
TP53 mRNA was lower in the tumor tissues in comparison to
that noted in the non-cancerous colorectal tissues (0.78±0.06 vs.
1.00±0.03; P=0.0207; Fig. 1D). The
level of BAX mRNA expression was decreased in 104 (86.0%)
tumors while it was increased in 17 (14.0%) cases (Fig. 1E; Table
II). The average expression of BAX mRNA was
significantly decreased in the tumor tissues when compared to the
unchanged tissues of the CRC patients (0.44±0.02 vs. 1.00±0.05;
P<0.0001; Fig. 1F).
 | Table I.Associations between demographic and
clinicopathological features of the CRC patients and the relative
mRNA expression of the TP53 gene in CRC tissues. |
Table I.
Associations between demographic and
clinicopathological features of the CRC patients and the relative
mRNA expression of the TP53 gene in CRC tissues.
|
|
| TP53 mRNA
levels in tumor vs. unchanged tissues of CRC patients |
|
|---|
|
|
|
|
|
|---|
| Parameters | Patients n (%) | Down (ratio <1)
n (%) | Up (ratio >1) n
(%) | P-value |
|---|
| Total | 121 (100.0) | 67 (55.4) | 54 (44.6) |
|
| Sex |
|
|
| 0.8543 |
|
Male | 67 (55.4) | 38 (56.7) | 29 (43.3) |
|
|
Female | 54 (44.6) | 29 (53.7) | 25 (46.3) |
|
| Age (years) |
|
|
| 0.1005 |
|
≤67 | 60 (49.6) | 38 (63.3) | 22 (36.7) |
|
|
>67 | 61 (50.4) | 29 (47.5) | 32 (52.5) |
|
| Location |
|
|
| 0.2501 |
|
Right | 44 (36.4) | 20 (45.5) | 24 (54.5) |
|
|
Left | 29 (24.0) | 18 (62.1) | 11 (37.9) |
|
|
Rectum | 48 (39.7) | 29 (60.4) | 19 (39.6) |
|
| Malignancy
grade |
|
|
| 0.7528 |
| G2 | 110 (90.9) | 60 (54.5) | 50 (45.5) |
|
| G3 | 11 (9.1) | 7 (63.6) | 4 (36.4) |
|
| Depth of invasion
(pT status) |
|
|
| 0.0249a |
|
T1+T2 | 20 (16.5) | 16 (80.0) | 4 (20.0) |
|
|
T3+T4 | 101 (83.5) | 51 (50.5) | 50 (49.5) |
|
| Lymph nodes (pN
status) |
|
|
| 0.8550 |
| N0 | 63 (52.1) | 34 (54.0) | 29 (46.0) |
|
|
N1+N2 | 58 (47.9) | 33 (56.9) | 25 (43.1) |
|
| Distant metastases
(pM status) |
|
|
| 0.2688 |
| M0 | 106 (87.6) | 61 (57.5) | 45 (42.5) |
|
| M1 | 15 (12.4) | 6 (40.0) | 9 (60.0) |
|
| TNM stage |
|
|
| 1.0000 |
|
I+II | 59 (48.8) | 33 (55.9) | 26 (44.1) |
|
|
III+IV | 62 (51.2) | 34 (54.8) | 28 (45.2) |
|
| Table II.Associations between demographic and
clinicopathological features of the CRC patients and the relative
mRNA expression of BAX gene in CRC tissues. |
Table II.
Associations between demographic and
clinicopathological features of the CRC patients and the relative
mRNA expression of BAX gene in CRC tissues.
|
|
| BAX mRNA
levels in tumor vs. unchanged tissues of CRC patients |
|
|---|
|
|
|
|
|
|---|
| Parameters | Patients n (%) | Down (ratio <1)
n (%) | Up (ratio >1) n
(%) | P-value |
|---|
| Total | 121 (100.0) | 104 (86.0) | 17 (14.0) |
|
| Sex |
|
|
| 0.5999 |
|
Male | 67 (55.4) | 59 (88.1) | 8 (11.9) |
|
|
Female | 54 (44.6) | 45 (83.3) | 9 (16.7) |
|
| Age (years) |
|
≤67 | 60 (49.6) | 52 (86.7) | 8 (13.3) | 1.0000 |
|
>67 | 61 (50.4) | 52 (85.2) | 9 (14.8) |
|
| Location |
|
Right | 44 (36.4) | 43 (97.7) | 1 (2.3) | 0.0074a |
|
Left | 29 (24.0) | 25 (86.2) | 4 (13.8) |
|
|
Rectum | 48 (39.7) | 36 (75.0) | 12 (25.0) |
|
| Malignancy
grade |
| G2 | 110 (90.9) | 93 (84.5) | 17 (15.5) | 0.3598 |
| G3 | 11 (9.1) | 11 (100.0) | 0 (0.0) |
|
| Depth of invasion
(pT status) |
|
T1+T2 | 20 (16.5) | 13 (65.0) | 7 (35.0) | 0.0081a |
|
T3+T4 | 101 (83.5) | 91 (90.1) | 10 (9.9) |
|
| Lymph nodes (pN
status) |
| N0 | 63 (52.1) | 53 (84.1) | 10 (15.9) | 0.6080 |
|
N1+N2 | 58 (47.9) | 51 (87.9) | 7 (12.1) |
|
| Distant metastases
(pM status) |
| M0 | 106 (87.6) | 91 (85.8) | 15 (14.2) | 1.0000 |
| M1 | 15 (12.4) | 13 (86.7) | 2 (13.3) |
|
| TNM stage |
|
I+II | 59 (48.8) | 49 (83.1) | 10 (16.9) | 0.4381 |
|
III+IV | 62 (51.2) | 55 (88.7) | 7 (11.3) |
|
Correlations between the mRNA
expression of the studied genes in CRC tissues and
clinicopathological features
Possible associations of EP300, TP53
and BAX expression with selected demographic and
clinicopathological parameters were analyzed based on the results
of the qPCR analysis. The depth of invasion was correlated
positively with the relative TP53 mRNA level in CRC tissues
(T1+T2 vs. T3+T4, P=0.0249; Table
I) and negatively with BAX mRNA expression (P=0.0081;
Table II). The BAX mRNA
content was also associated with tumor location (P=0.0074; Table II), demonstrating the lowest levels
in right-sided CRC. The EP300 mRNA level did not correlate
with any of the tested parameters, including sex, age, tumor
location, malignancy grade, tumor-node-metastasis (TNM) disease
stage, depth of invasion, lymph node involvement, or the presence
of metastases (P>0.05).
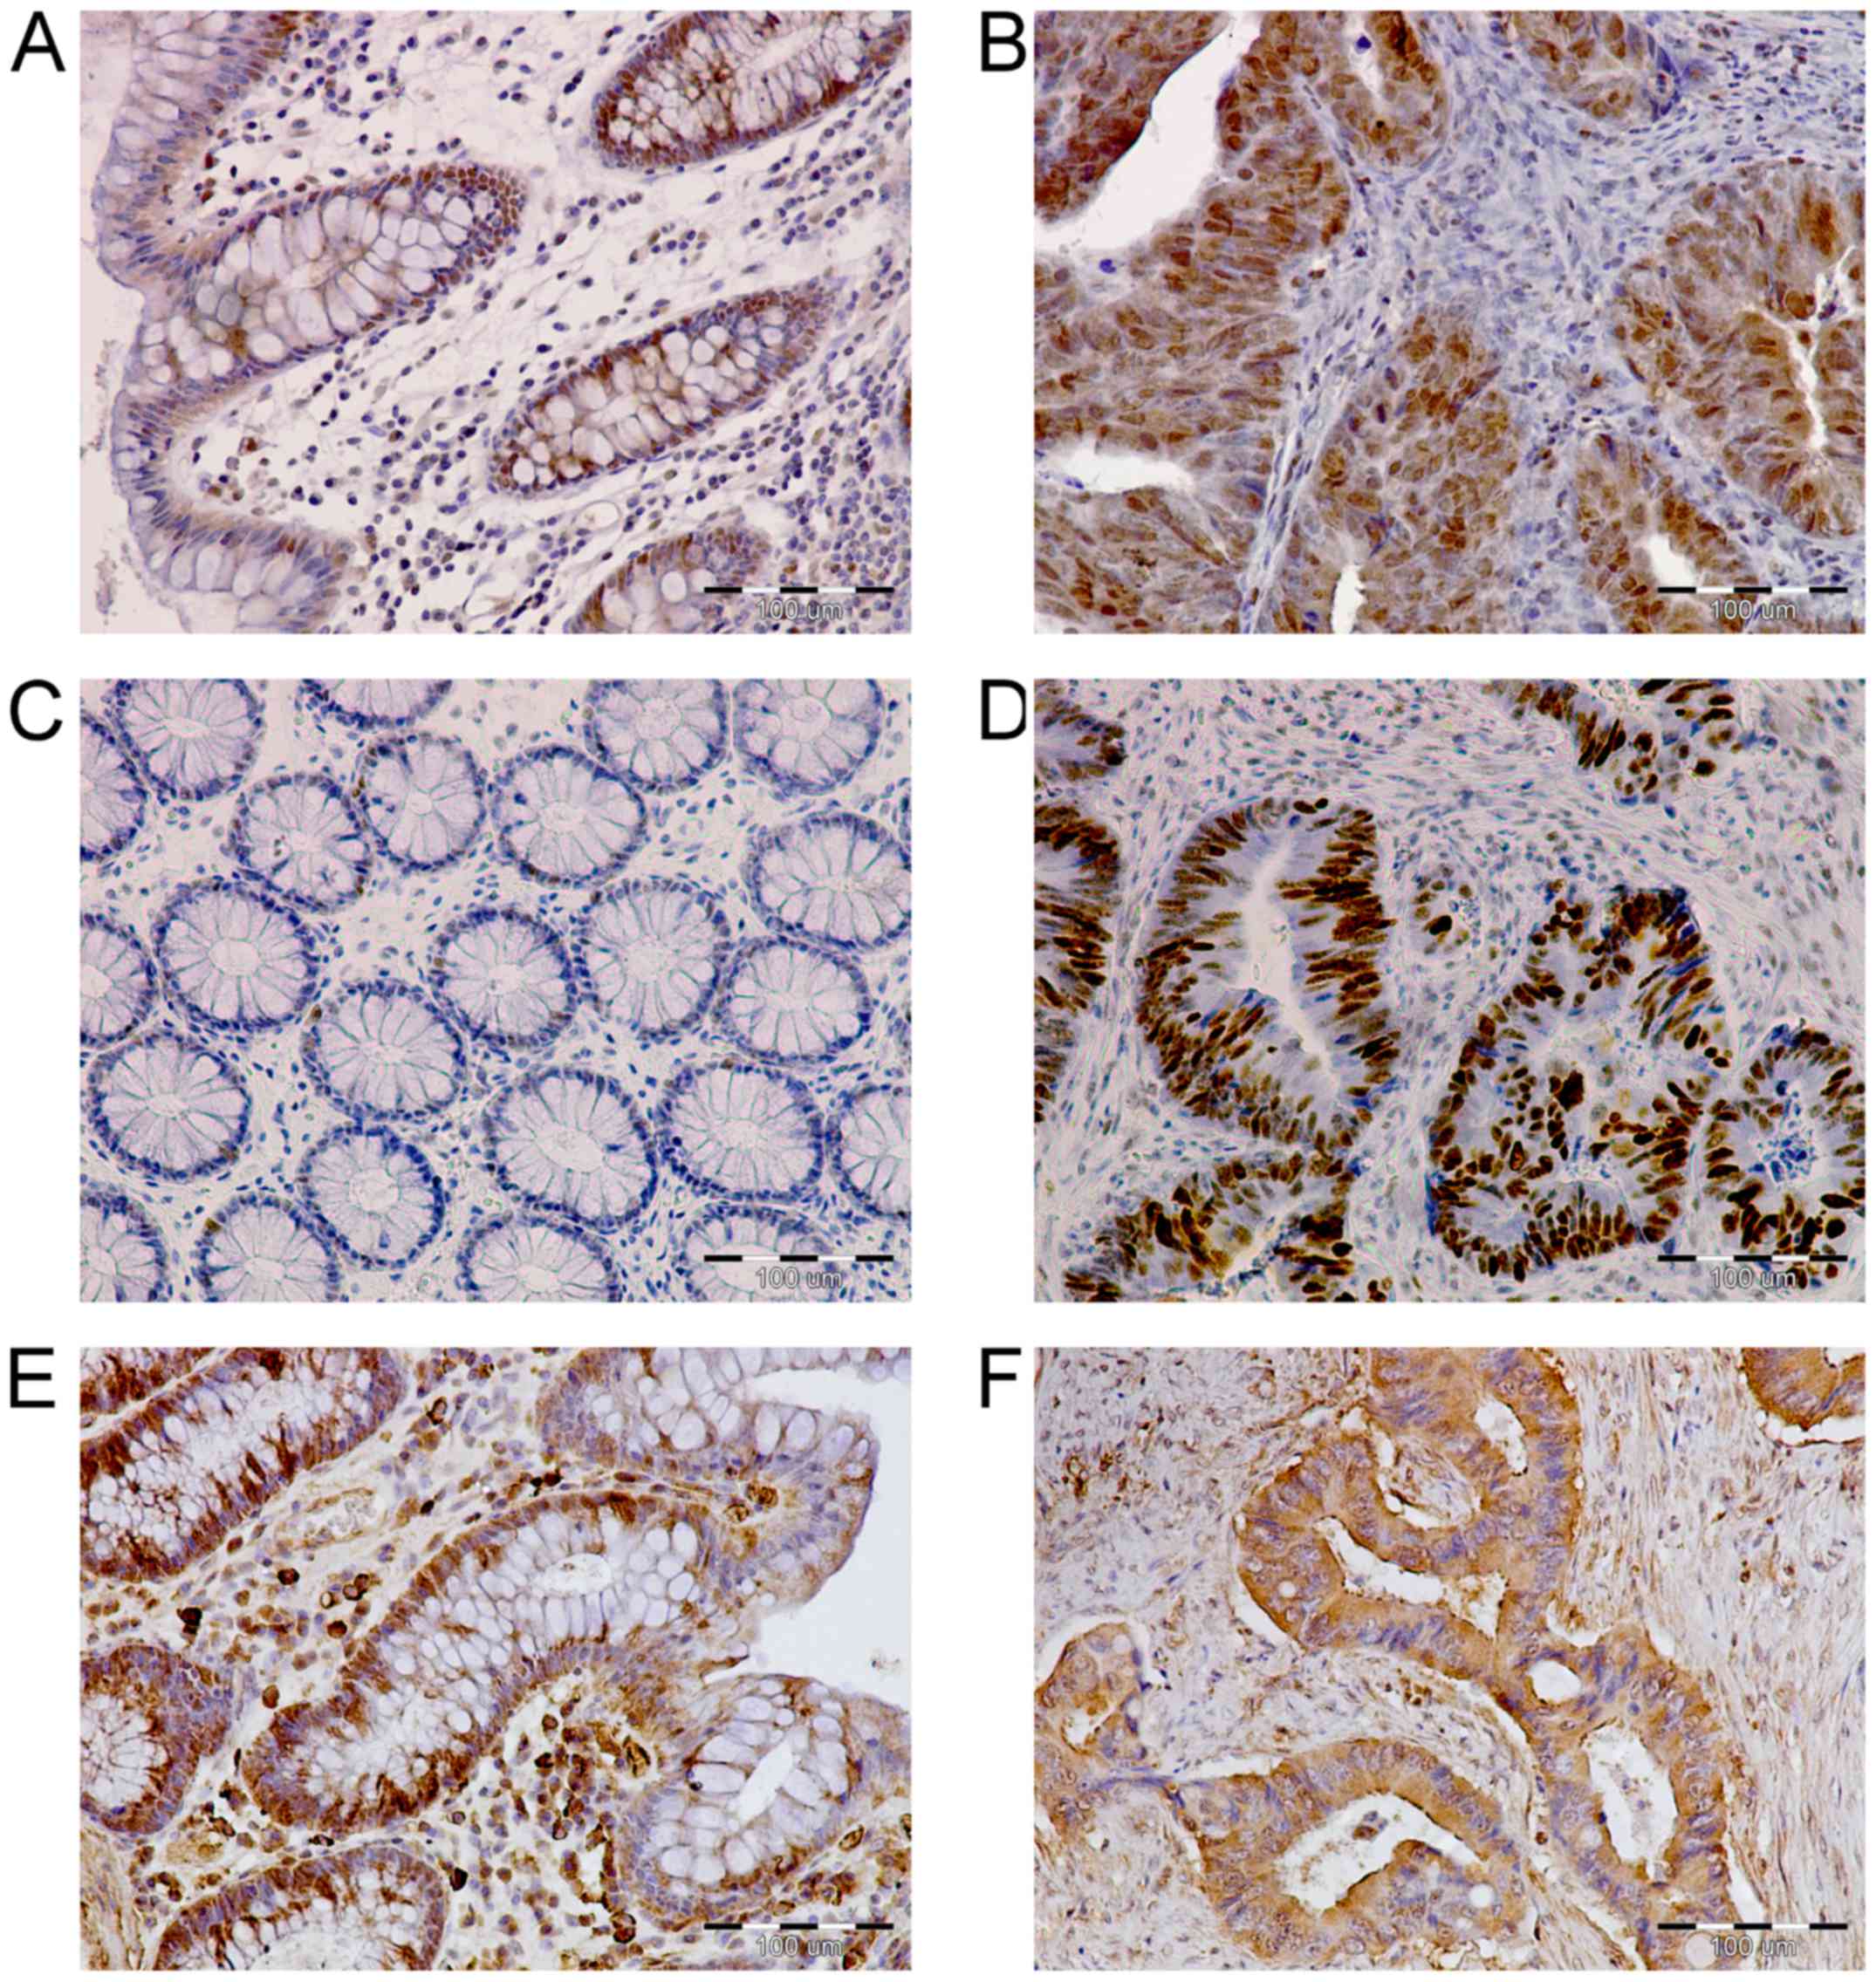
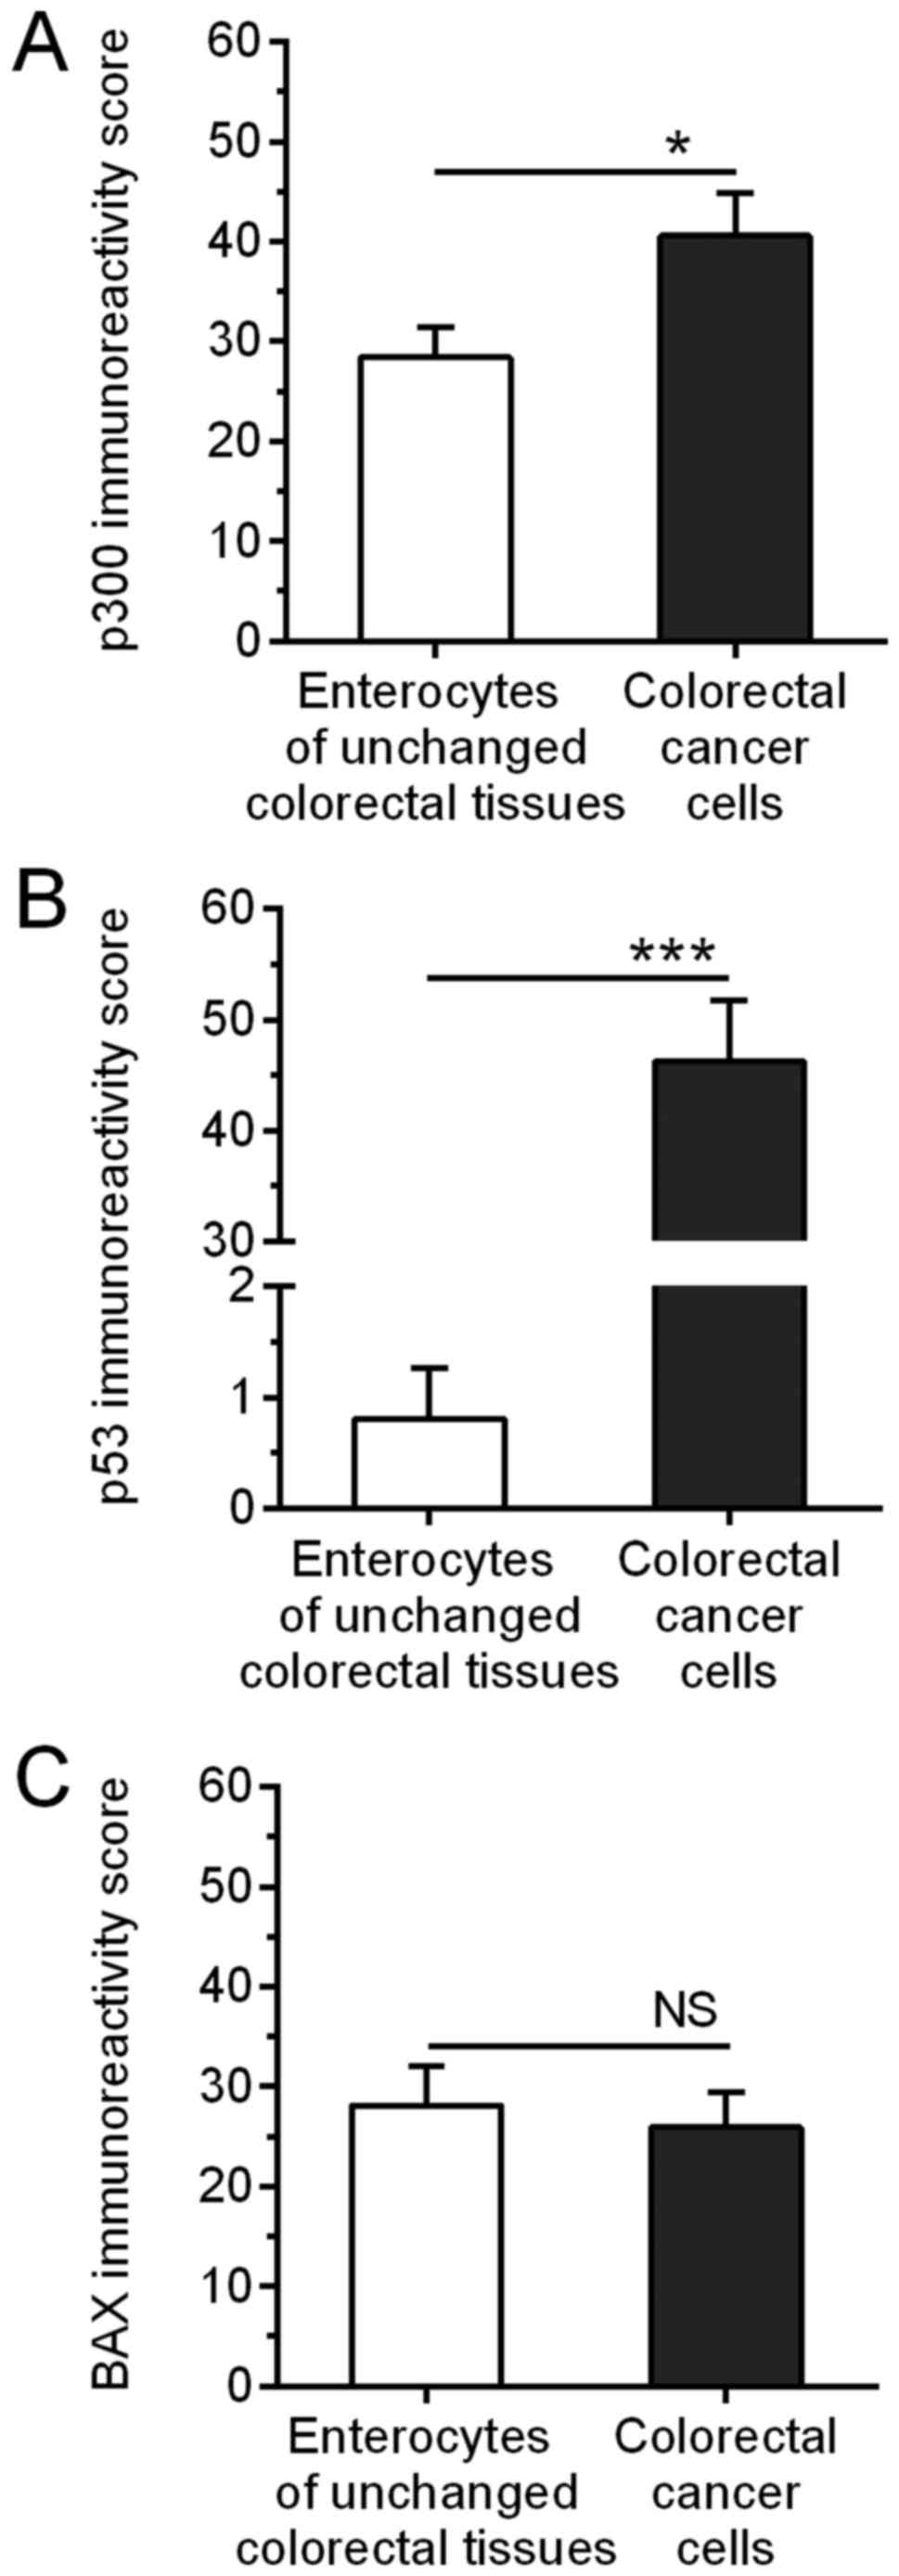
Elevated p300 and p53 immunoreactivity
in CRC tissues
p300 immunoreactivity was observed mainly in the
nuclei of enterocytes (Fig. 2A) and
cancer cells of the analyzed tissues (Fig. 2B). The average intensity of p300
immunostaining was significantly higher in CRC cells as compared to
p300 immunoreactivity in enterocytes of the matched unchanged
intestinal mucosa (40.54±4.33 vs. 28.38±3.06, respectively;
P=0.0219; Fig. 3A). Among the 49
tumor tissue specimens tested, the intensity of p300 staining was
high in 35 (71.4%) and low in 14 (28.6%) specimens. p53
immunoreactivity was observed in the nuclei of a few enterocytes of
unchanged intestinal mucosa (Fig.
2C) and numerous cancer cells (Fig.
2D). The average p53 immunoexpression was significantly higher
in CRC when compared to that in the matched large intestine tissues
(46.22±5.58 vs. 0.81±0.45, respectively; P<0.001; Fig. 3B). p53 immunoreactivity was high in
34/49 (69.4%) CRC specimens, whereas low immunostaining was
observed in 15/49 (30.6%) cancer tissues. BAX immunoreactivity was
found in the cytoplasm of enterocytes (Fig. 2E) as well as cancer cells of the
analyzed tissues (Fig. 2F). The
average intensity of BAX immunostaining did not significantly
differ between the tumor and unchanged tissues of the CRC patients
(25.95±3.52 vs. 28.11±3.95, respectively; P>0.05; Fig. 3C). The studied proteins were not
detected in the control immunonegative samples, in which
immunostaining was performed with the omission of the primary
antibodies.
The intensity of p300 immunostaining in CRC tissues
was correlated positively with BAX immunoreactivity (r=0.2903;
P=0.043), but not with the BAX mRNA level. There were no
other significant associations between immunoreactivity of the
studied proteins, as well as relationships with transcripts levels
of the respective genes (P>0.05).
Correlations between the
immunoreactivity of the studied proteins in CRC tissues and
clinicopathological characteristics
Possible correlations of the expression levels of
the studied proteins in CRC tissues with selected demographic and
clinicopathological parameters were analyzed based on the results
obtained by immunohistochemical analysis. The intensity of BAX
immunostaining was higher in tumor specimens derived from patients
diagnosed with: i) lymph node involvement (N0 vs. N1+N2; P=0.0448;
Table III); and ii) a higher TNM
disease stage (I+II vs. III+IV; P=0.0421; Table III). The levels of p300 and p53
immunoreactivity did not correlate with any of the tested
parameters, including sex, age, tumor location, malignancy grade,
TNM disease stage, depth of invasion, lymph node involvement, or
the presence of metastases (P>0.05).
| Table III.Associations between demographic and
clinicopathological features of the CRC patients and the
immunoreactivity of BAX protein in the tumor cells. |
Table III.
Associations between demographic and
clinicopathological features of the CRC patients and the
immunoreactivity of BAX protein in the tumor cells.
|
|
| BAX
immunoreactivity in CRC cells |
|
|---|
|
|
|
|
|
|---|
| Parameters | Patients n (%) | Score <30 n
(%) | Score ≥30 n
(%) | P-value |
|---|
| Total | 49 (100.0) | 20 (40.8) | 29 (59.2) |
|
| Sex |
|
|
| 0.7733 |
|
Male | 25 (51.0) | 11 (44.0) | 14 (56.0) |
|
|
Female | 24 (49.0) | 9 (37.5) | 15 (62.5) |
|
| Age (years) |
|
|
| 0.0903 |
|
≤67 | 22 (44.9) | 12 (54.5) | 10 (45.5) |
|
|
>67 | 27 (55.1) | 8 (29.6) | 19 (70.4) |
|
| Localization |
|
|
| 0.9733 |
|
Right | 14 (28.6) | 6 (42.9) | 8 (57.1) |
|
|
Left | 13 (26.5) | 5 (38.5) | 8 (61.5) |
|
|
Rectum | 22 (44.9) | 9 (40.9) | 13 (59.1) |
|
| Malignancy
grade |
|
|
| 0.6359 |
| G2 | 45 (91.8) | 19 (42.2) | 26 (57.8) |
|
| G3 | 4 (8.2) | 1 (25.0) | 3 (75.0) |
|
| Depth of invasion
(pT status) |
|
|
| 0.2096 |
|
T1+T2 | 6 (12.2) | 4 (66.7) | 2 (33.3) |
|
|
T3+T4 | 43 (87.8) | 16 (37.2) | 27 (62.8) |
|
| Lymph nodes (pN
status) |
|
|
| 0.0448a |
| N0 | 28 (57.1) | 15 (53.6) | 13 (46.4) |
|
|
N1+N2 | 21 (42.9) | 5 (23.8) | 16 (76.2) |
|
| Distant metastases
(pM status) |
|
|
| 0.4446 |
| M0 | 41 (83.7) | 18 (43.9) | 23 (56.1) |
|
| M1 | 8 (16.3) | 2 (25.0) | 6 (75.0) |
|
| TNM stage |
|
|
| 0.0421a |
|
I+II | 25 (51.0) | 14 (56.0) | 11 (44.0) |
|
|
III+IV | 24 (49.0) | 6 (25.0) | 18 (75.0) |
|
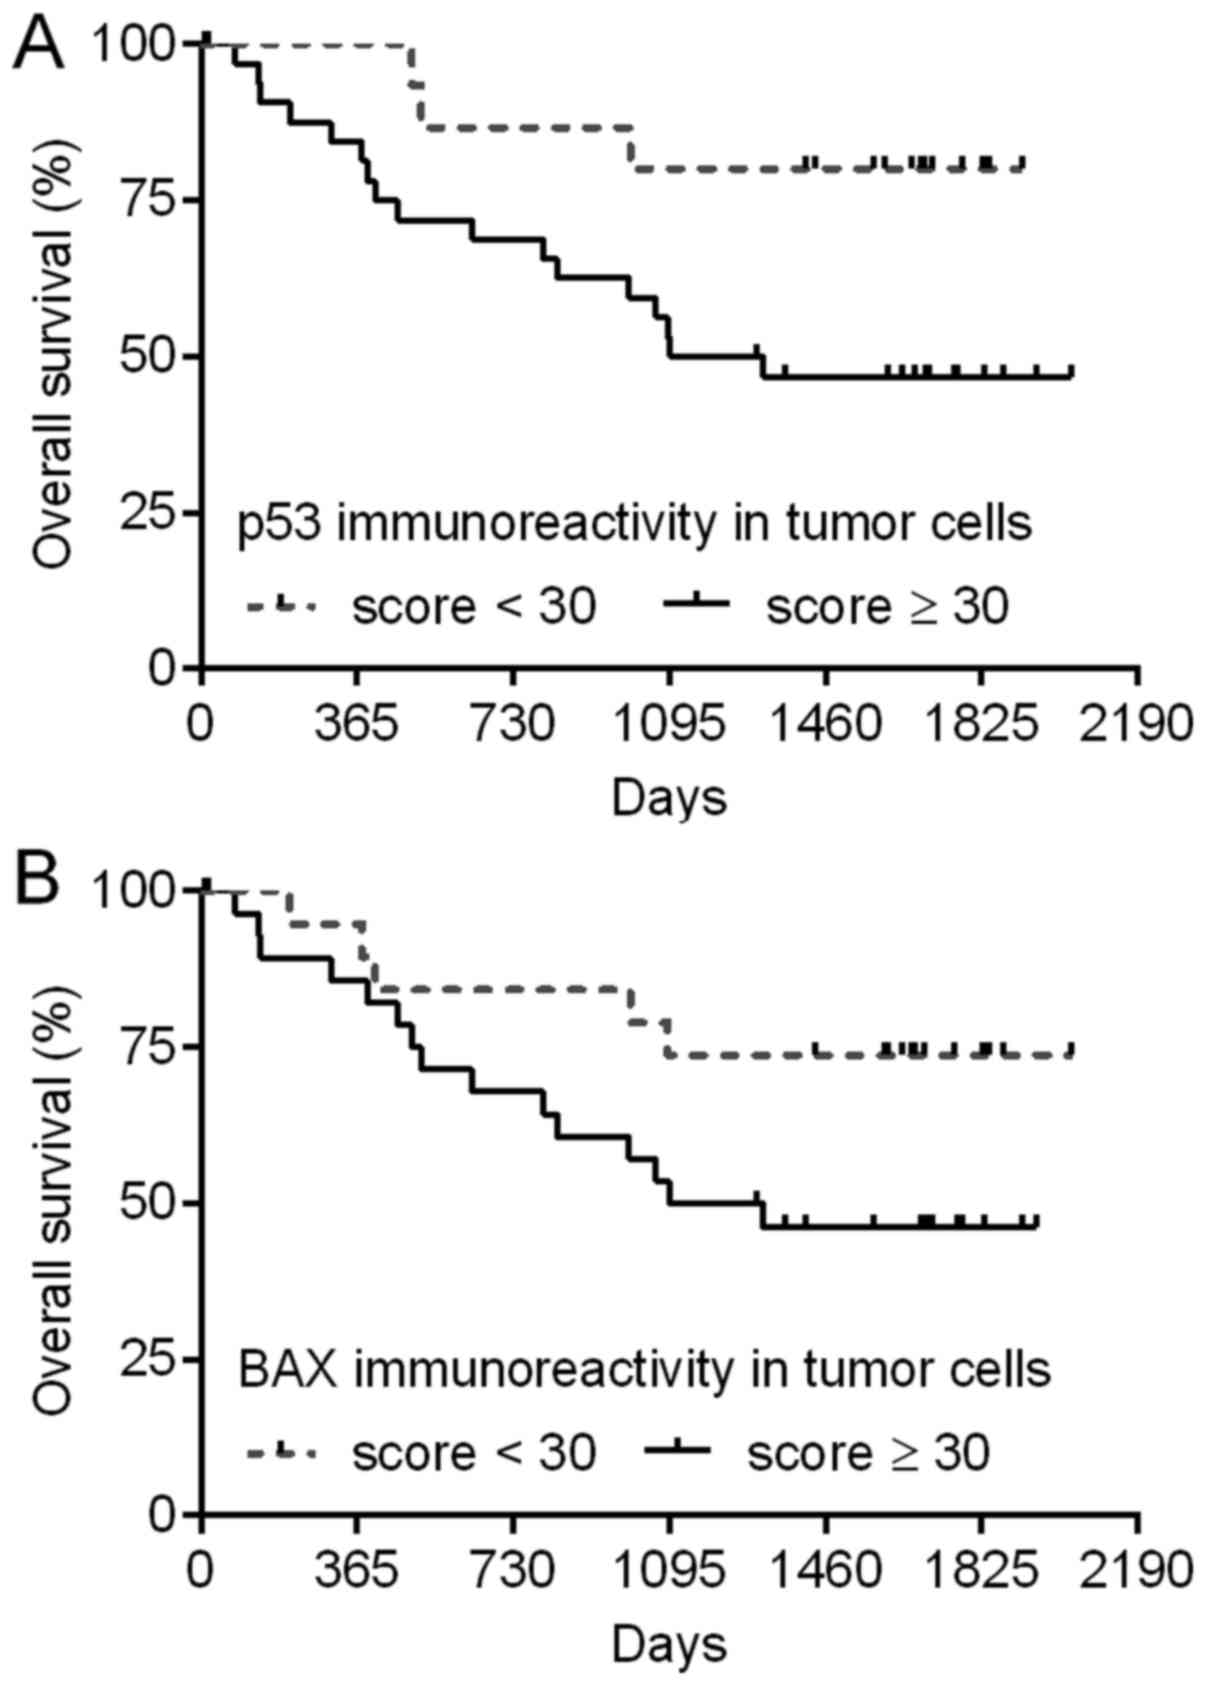
Levels of p53 and BAX immunoreactivity in CRC
tissues are associated with patient OS. To estimate the prognostic
significance of the studied genes, the levels of their expression
in CRC tissues were correlated with patient OS. Median follow-up
time of the 49 patients whose tissues were used in both analyses,
qPCR and immunohistochemistry, was 47.2 months. During this
observation period, 20 (40.8%) patients died.
Univariate Cox regression model revealed that higher
levels of p53 and BAX immunoreactivity in CRC tissues were
associated with worse patient prognosis (P=0.0499 and P=0.0127,
respectively; Table IV). The
intensity of p300 immunostaining, as well as expression of the
studied genes at the mRNA level were not significantly correlated
with patient OS (P>0.05; Table
IV). The expression level of any of the studied genes was not
an independent prognostic factor in CRC as was revealed by
multivariate Cox regression analysis. Kaplan-Meier plots presenting
the survival of CRC patients are shown in Fig. 4.
| Table IV.Univariate and multivariate Cox
proportional hazard regression of overall survival of the
colorectal cancer patients. |
Table IV.
Univariate and multivariate Cox
proportional hazard regression of overall survival of the
colorectal cancer patients.
|
| Univariate
analysis | Multivariate
analysis |
|---|
|
|
|
|
|---|
| Covariates | HR | 95% CI | P-value | HR | 95% CI | P-value |
|---|
| Sex (men vs.
women) | 1.82 | 0.74–4.47 | 0.1886 |
|
|
|
| Age (years) | 1.05 | 1.01–1.10 | 0.0116a | 1.03 | 0.96–1.10 | 0.4010 |
| Location (cecum,
ascending and transverse colon vs. rectum) | 0.24 | 0.05–1.05 | 0.0487a | 0.19 | 0.03–1.21 | 0.0616 |
| Location
(descending and sigmoid colon vs. rectum) | 1.07 | 0.40–2.86 | 0.1568 |
|
|
|
| Depth of invasion
(T1+T2 vs. T3+T4) | NAb | NAb | 0.9925 |
|
|
|
| Lymph node
metastasis (N1 vs. N0) | 1.59 | 0.55–4.58 | 0.4211 |
|
|
|
| Lymph node
metastasis (N2 vs. N0) | 5.56 | 1.88–16.4 | 0.0031a | 2.78 | 0.33–23.2 | 0.1415 |
| Distant metastasis
(present vs. absent) | 6.87 | 2.62–18.0 | 0.0001a | 7.46 | 1.92–28.9 | 0.0036a |
| TNM stage (I+II vs.
III+IV) | 4.22 | 1.52–11.7 | 0.0056a | 1.09 | 0.08–14.8 | 0.9458 |
|
EP300 mRNA relative
expression (RQ) | 0.32 | 0.06–1.73 | 0.1881 |
|
|
|
| p300
immunoreactivity (score) | 1.00 | 0.98–1.01 | 0.8418 |
|
|
|
|
TP53 mRNA relative
expression (RQ) | 1.14 | 0.67–1.95 | 0.6288 |
|
|
|
| p53
immunoreactivity (score) | 1.01 | 1.00–1.03 | 0.0499a | 1.00 | 0.99–1.02 | 0.7323 |
|
BAX mRNA relative
expression (RQ) | 1.01 | 0.49–2.09 | 0.9735 |
|
|
|
| BAX
immunoreactivity (score) | 1.03 | 1.01–1.05 | 0.0127a | 1.03 | 1.00–1.06 | 0.0504 |
Discussion
Altered expression of genes that encode important
transcriptional coactivators acting with other factors to regulate
gene expression can disrupt key cellular processes and lead to
carcinogenesis. A better understanding of the mechanisms underlying
colorectal cancer (CRC) development and progression may allow
improvement in the diagnostic, prognostic and anti-CRC therapeutic
approaches. Results of previous studies suggest that p300 protein
is a pleiotropic coactivator involved in a number of different
pathways, which affect apoptosis, cell cycle control,
differentiation and proliferation (32). Somatic mutations in the EP300
gene have been found in various human malignancies, including CRC
(8,9), supporting an idea that this is a
tumor-suppressor gene and its dysfunction contributes to tumor
formation. Bhandaru et al reported that patients with low
nuclear p300 expression in melanoma samples have worse 5-year
survival (33). Moreover, a study
by Ionov et al indicated that expression of EP300 in
colon cancer cell lines was associated with slower growth and a
higher level of acetylated p53 (34). Furthermore, Krubasik et al
found that absence of p300 in HCT116 CRC cells induced cellular
phenotypic changes characteristic of epithelial to mesenchymal
transition (EMT) (35), supporting
the finding by Peña et al that p300 levels are important in
the control of the expression of genes crucial for EMT, and
therefore, for tumor progression in human colon cancer (36). However, apart from participating in
various tumor-suppressor pathways, p300 is also essential for the
activity of many oncogenes (37).
It has been found that p300 binds to and acetylates
metastasis-associated protein MTA2 to promote CRC cell growth
(38). In prostate cancer, p300 was
shown to be involved in cell proliferation and progression of this
type of cancer (39). Previous
investigations revealed that high expression of p300 is associated
with aggressive features and/or poor prognosis in breast,
hepatocellular, nasopharyngeal, small and non-small cell lung
cancers (11–15). Aberrant expression of the
EP300 gene was also indicated in CRC; however, studies
present contradictory results (16,17).
It was demonstrated that both mRNA and protein levels were
increased in CRC and overexpression of p300 was found to be
correlated with poor prognosis (17), while Huh et al found that
p300 overexpression is an indicator of good prognosis in CRC
patients (16). Similarly to
Ishihama et al (17), we
noted high immunoreactivity of p300 in CRC cells. However, we
observed the opposite results at the mRNA level finding decreased
levels of the EP300 mRNA in the majority of the tested CRC
samples. A low degree of correlation between mRNA levels and actual
protein concentrations has also been reported by other authors
(40–42). The present study, in contrast to the
above mentioned findings, failed to reveal any relationships
between the EP300 expression level and patient survival, and
this may result from a shorter follow-up time. Huh et al
(16) demonstrated the association
between p300 expression and lymph node involvement, which was not
confirmed in our research. Discrepancies in the results of
different studies may be due to the methodological aspects, e.g.
choice of different antibodies, method of staining intensity
estimation, and number of samples. Another explanation of these
discrepancies may be the pleiotropic character of p300 and its
function as a coactivator of oncoproteins and tumor-suppressor
proteins. p300 appears to be capable of contributing to
diametrically opposed cellular processes, and it has been suggested
that whether p300 promotes apoptosis or cell proliferation appears
to be highly context-dependent (37).
p300 can both positively and negatively regulate p53
transactivation, as well as p53 protein turnover depending on
cellular context and environmental stimuli (18). Previous studies have demonstrated
that p300 is involved in controlling the stability of the p53
protein by facilitating both mdm2-dependent and -independent
ubiquitination, leading to p53 degradation in unstressed cells
(19,43). Moreover, it was shown that p300
siRNA increased steady-state p53 abundance and p53 half-life in
human osteosarcoma U2OS cells (44). However, it has also been proposed
that acetylation plays a positive role in the accumulation of p53
protein in stress response, since inhibition of deacetylation
increased the half-life of p53 and promoted its stability (45). In a study by Vleugel et al,
p300 staining intensity was correlated positively with p53
accumulation in invasive breast cancer (20). Our finding of high levels of p53
protein in CRC and only slight immunoreactivity of this protein in
unchanged colorectal mucosa corresponds to the demonstration of p53
overexpression in the majority of CRC tissues (46). However, the present study did not
reveal any relationship between expression of p300 and p53
proteins. Although we did not screen our cohort of patients for p53
gene mutations, we hypothesized that the overexpression of p53
protein could be due to genetic mutations that are thought to
increase the protein half-life and occur in approximately half of
all CRC cases (47). Similarly to
other authors (24,25), we found no correlation between p53
levels and clinicopathological features. However, several previous
studies demonstrated the relationship between p53 expression and
lymph node involvement (48), tumor
location, as well as disease stage (49) and T status (46). The present study indicated a
correlation between the expression of TP53 and depth of
tumor invasion, but only at the mRNA level. The majority of
published findings focusing on TP53 gene expression and
prognosis in CRC have been based exclusively on IHC analyses. The
variables related to the staining protocols and scoring system
hinder the comparison of the results of different studies. Although
p53 protein is one of the most intensively studied, there is no
consensus concerning the prognostic value of its expression. Some
investigators revealed the lack of correlations between the p53
level in CRC and survival (24,28);
however this could not be confirmed by us or by other authors
(25,26,50,51).
In line with previous studies (26,50),
we demonstrated an association between p53 overexpression and worse
survival, while in another studies of the same cancer type the
opposite relationship was proposed (25,51).
These discrepant results may be explained by findings indicating
that the prognostic significance of p53 expression may depend on
the ethnic group, site of tumor origin in the colon and stage of
disease (47). Moreover, Morikawa
et al demonstrated that p53 positivity was a significant
independent predictor of shorter survival among non-obese CRC
patients, but not among obese patients (49).
Stabilized p53 protein transactivates downstream
targets that mediate apoptosis or cell cycle arrest. Protein levels
of these p53-downstream effectors determine cell fate (43). p53 is a transcriptional regulator of
the BAX gene that is known for its pro-apoptotic activity.
It has been shown that the p53-p300-JMY (junction mediating and
regulatory protein) complex is enriched in cells exposed to stress
and upregulates a variety of p53-dependent target genes, including
BAX (6). Our finding of the
correlation between the expression of p300 and BAX proteins
confirms the regulatory link between these proteins. The observed
lack of relationship between expression of p300 protein and the
level of the BAX transcript may result from different
methodologies, since immunohistochemical analysis allows assessment
of protein expression in specific cell types, while the estimation
of the relative levels of mRNA in cancer tissue may be related not
only to tumor cells but also to other non-cancerous cells. In
contrast, using western blot assay, Iyer et al revealed that
p300 absence in the HCT116 cell line appeared to have no effect on
the pro-apoptotic BAX protein level in cells subjected to
UV-induced damage (43). Moreover,
it was shown that p300 co-transactivation was not required for BAX
regulation (52), whereas an in
vivo study suggested that p53 was not a major determinant for
BAX expression in colorectal carcinomas (53). According to the analysis of BAX
expression in breast cancer cells, probably additional regulators,
apart from p53, are involved in the regulation of BAX protein
expression (54). The lack of
correlation between the p53 level and expression of the BAX
gene in CRC found by us and other authors (27,28),
supports this suggestion. Notably, Wincewicz et al
demonstrated that expression of p53 in CRC was associated with BAX
exclusively in younger patients (55). Thus, estimation of the
interdependence among p300, p53 and BAX proteins requires further
detailed functional studies.
Contrary to findings of enhanced expression of BAX
in CRC compared to normal colorectal mucosa (56,57),
results of our and Krajewska et al (58) studies did not reveal differences in
the average Bax immunoreactivity between CRC and unchanged
colorectal tissues. However, similarly to the breast cancer study
(59), we observed a lower level of
BAX mRNA in CRC compared to that found in the matched
tissue. Paul-Samojedny et al indicated that the ratio of the
BAX mRNA expression in CRC in relation to that in normal
tissue differs depending on the Dukes stage (60). Previous studies provided
contradictory results regarding the BAX expression level in CRC and
correlations with clinicopathological parameters. Our findings, but
only at the mRNA level, are consistent with the results of Ogura
et al who found that BAX expression was significantly
correlated with reduced depth of tumor invasion (61). In contrast to our observations,
various studies revealed negative (29) or no associations (62) between BAX expression and lymph node
status. We indicated that high BAX levels correlated with advanced
TNM stage, however, the lack of any relationships with tumor stage
has also been reported (62).
Although studies have revealed that BAX expression is not
associated with tumor location (56,62),
our finding that the frequency of decreased BAX mRNA levels
was the highest in right-sided tumors corresponds to a study by
Nehls et al who observed a correlation between high BAX
immunostaining and left-sided tumors (63). Similarly, the evaluation of the
prognostic significance of BAX expression provided ambiguous
findings since the absence of BAX or its reduced expression was
related to poor prognosis (28,29,61) or
lack of association was found by other authors (64). Our surprising observation that
higher expression of the pro-apoptotic BAX protein in CRC tissues
was associated with worse prognosis, reported also by
Giatromanolaki et al (27),
may be partially explained by the involvement of BAX in additional
processes, apart from its role in the control of apoptosis, such as
the regulation of cell proliferation, since the correlation between
BAX expression and proliferative activity was revealed (65).
In summary, to the best of our knowledge, this is
the first comprehensive study to analyze the expression of
EP300, TP53 and BAX genes at the mRNA and
protein levels in a cohort of CRC patients as well as the
relationships between their expression, clinicopathological
parameters and OS of patients. The present study indicated that
dysregulation of the studied gene expression may contribute to CRC
pathogenesis. The association between p300 and BAX levels suggests
the existence of an interdependent regulatory mechanism of their
expression. Moreover, BAX expression may be regulated
alternatively, in a p53-independent manner, since the lack of
correlations between expression of these factors was observed.
However, further studies are warranted to fully evaluate the
mechanisms controlling the expression of the studied genes.
Acknowledgements
The present study was supported by the National
Science Centre grant no. NN402 452339.
References
|
1
|
Ferlay J, Soerjomataram I, Ervik M,
Dikshit R, Eser S, Mathers C, Rebelo M, Parkin DM, Forman D and
Bray F: GLOBOCAN 2012 v1.0, Cancer Incidence and Mortality
Worldwide: IARC CancerBase No. 11 (Internet). International Agency
for Research on Cancer. Lyon, France: 2013 HTTP://GLOBOCAN.IARC.FRDec 01–2014.
|
|
2
|
Cunningham D, Atkin W, Lenz HJ, Lynch HT,
Minsky B, Nordlinger B and Starling N: Colorectal cancer. Lancet.
375:1030–1047. 2010. View Article : Google Scholar : PubMed/NCBI
|
|
3
|
Popovic R and Licht JD: Emerging
epigenetic targets and therapies in cancer medicine. Cancer Discov.
2:405–413. 2012. View Article : Google Scholar : PubMed/NCBI
|
|
4
|
Chakravarthi BV, Nepal S and Varambally S:
Genomic and epigenomic alterations in cancer. Am J Pathol.
186:1724–1735. 2016. View Article : Google Scholar : PubMed/NCBI
|
|
5
|
Yang H, Salz T, Zajac-Kaye M, Liao D,
Huang S and Qiu Y: Overexpression of histone deacetylases in cancer
cells is controlled by interplay of transcription factors and
epigenetic modulators. FASEB J. 28:4265–4279. 2014. View Article : Google Scholar : PubMed/NCBI
|
|
6
|
Chan HM and La Thangue NB: p300/CBP
proteins: HATs for transcriptional bridges and scaffolds. J Cell
Sci. 114:2363–2373. 2001.PubMed/NCBI
|
|
7
|
Iyer NG, Ozdag H and Caldas C: p300/CBP
and cancer. Oncogene. 23:4225–4231. 2004. View Article : Google Scholar : PubMed/NCBI
|
|
8
|
Muraoka M, Konishi M, Kikuchi-Yanoshita R,
Tanaka K, Shitara N, Chong JM, Iwama T and Miyaki M: p300 gene
alterations in colorectal and gastric carcinomas. Oncogene.
12:1565–1569. 1996.PubMed/NCBI
|
|
9
|
Gayther SA, Batley SJ, Linger L, Bannister
A, Thorpe K, Chin SF, Daigo Y, Russell P, Wilson A, Sowter HM, et
al: Mutations truncating the EP300 acetylase in human cancers. Nat
Genet. 24:300–303. 2000. View
Article : Google Scholar : PubMed/NCBI
|
|
10
|
Phillips AC and Vousden KH:
Acetyltransferases and tumour suppression. Breast Cancer Res.
2:244–246. 2000. View
Article : Google Scholar : PubMed/NCBI
|
|
11
|
Xiao XS, Cai MY, Chen JW, Guan XY, Kung
HF, Zeng YX and Xie D: High expression of p300 in human breast
cancer correlates with tumor recurrence and predicts adverse
prognosis. Chin J Cancer Res. 23:201–207. 2011. View Article : Google Scholar : PubMed/NCBI
|
|
12
|
Li M, Luo RZ, Chen JW, Cao Y, Lu JB, He
JH, Wu QL and Cai MY: High expression of transcriptional
coactivator p300 correlates with aggressive features and poor
prognosis of hepatocellular carcinoma. J Transl Med. 9:52011.
View Article : Google Scholar : PubMed/NCBI
|
|
13
|
Liao ZW, Zhou TC, Tan XJ, Song XL, Liu Y,
Shi XY, Huang WJ, Du LL, Tu BJ and Lin XD: High expression of p300
is linked to aggressive features and poor prognosis of
nasopharyngeal carcinoma. J Transl Med. 10:1102012. View Article : Google Scholar : PubMed/NCBI
|
|
14
|
Gao Y, Geng J, Hong X, Qi J, Teng Y, Yang
Y, Qu D and Chen G: Expression of p300 and CBP is associated with
poor prognosis in small cell lung cancer. Int J Clin Exp Pathol.
7:760–767. 2014.PubMed/NCBI
|
|
15
|
Hou X, Li Y, Luo RZ, Fu JH, He JH, Zhang
LJ and Yang HX: High expression of the transcriptional co-activator
p300 predicts poor survival in resectable non-small cell lung
cancers. Eur J Surg Oncol. 38:523–530. 2012. View Article : Google Scholar : PubMed/NCBI
|
|
16
|
Huh JW, Kim HC, Kim SH, Park YA, Cho YB,
Yun SH, Lee WY and Chun HK: Prognostic impact of p300 expression in
patients with colorectal cancer. J Surg Oncol. 108:374–377. 2013.
View Article : Google Scholar : PubMed/NCBI
|
|
17
|
Ishihama K, Yamakawa M, Semba S, Takeda H,
Kawata S, Kimura S and Kimura W: Expression of HDAC1 and CBP/p300
in human colorectal carcinomas. J Clin Pathol. 60:1205–1210. 2007.
View Article : Google Scholar : PubMed/NCBI
|
|
18
|
Grossman SR: p300/CBP/p53 interaction and
regulation of the p53 response. Eur J Biochem. 268:2773–2778. 2001.
View Article : Google Scholar : PubMed/NCBI
|
|
19
|
Grossman SR, Deato ME, Brignone C, Chan
HM, Kung AL, Tagami H, Nakatani Y and Livingston DM:
Polyubiquitination of p53 by a ubiquitin ligase activity of p300.
Science. 300:342–344. 2003. View Article : Google Scholar : PubMed/NCBI
|
|
20
|
Vleugel MM, Shvarts D, van der Wall E and
van Diest PJ: p300 and p53 levels determine activation of HIF-1
downstream targets in invasive breast cancer. Hum Pathol.
37:1085–1092. 2006. View Article : Google Scholar : PubMed/NCBI
|
|
21
|
Barlev NA, Liu L, Chehab NH, Mansfield K,
Harris KG, Halazonetis TD and Berger SL: Acetylation of p53
activates transcription through recruitment of coactivators/histone
acetyltransferases. Mol Cell. 8:1243–1254. 2001. View Article : Google Scholar : PubMed/NCBI
|
|
22
|
Miyashita T and Reed JC: Tumor suppressor
p53 is a direct transcriptional activator of the human bax gene.
Cell. 80:293–299. 1995. View Article : Google Scholar : PubMed/NCBI
|
|
23
|
Yuan ZM, Huang Y, Ishiko T, Nakada S,
Utsugisawa T, Shioya H, Utsugisawa Y, Yokoyama K, Weichselbaum R,
Shi Y, et al: Role for p300 in stabilization of p53 in the response
to DNA damage. J Biol Chem. 274:1883–1886. 1999. View Article : Google Scholar : PubMed/NCBI
|
|
24
|
Poller DN, Baxter KJ and Shepherd NA: p53
and Rb1 protein expression: Are they prognostically useful in
colorectal cancer? Br J Cancer. 75:87–93. 1997. View Article : Google Scholar : PubMed/NCBI
|
|
25
|
Adrover E, Maestro ML, Sanz-Casla MT, del
Barco V, Cerdán J, Fernández C and Balibrea JL: Expression of high
p53 levels in colorectal cancer: A favourable prognostic factor. Br
J Cancer. 81:122–126. 1999. View Article : Google Scholar : PubMed/NCBI
|
|
26
|
Allegra CJ, Paik S, Colangelo LH, Parr AL,
Kirsch I, Kim G, Klein P, Johnston PG, Wolmark N and Wieand HS:
Prognostic value of thymidylate synthase, Ki-67, and p53 in
patients with Dukes' B and C colon cancer: A National Cancer
Institute-National Surgical Adjuvant Breast and Bowel Project
collaborative study. J Clin Oncol. 21:241–250. 2003. View Article : Google Scholar : PubMed/NCBI
|
|
27
|
Giatromanolaki A, Sivridis E, Stathopoulos
GP, Fountzilas G, Kalofonos HP, Tsamandas A, Vrettou E, Scopa C,
Polychronidis A, Simopoulos K, et al: Bax protein expression in
colorectal cancer: Association with p53, bcl-2 and patterns of
relapse. Anticancer Res. 2:253–259. 2001.
|
|
28
|
Katkoori VR, Suarez-Cuervo C, Shanmugam C,
Jhala NC, Callens T, Messiaen L, Posey J III, Bumpers HL, Meleth S,
Grizzle WE, et al: Bax expression is a candidate prognostic and
predictive marker of colorectal cancer. J Gastrointest Oncol.
1:76–89. 2010.PubMed/NCBI
|
|
29
|
Schelwies K, Sturm I, Grabowski P,
Scherübl H, Schindler I, Hermann S, Stein H, Buhr HJ, Riecken EO,
Zeitz M, et al: Analysis of p53/BAX in primary colorectal
carcinoma: Low BAX protein expression is a negative prognostic
factor in UICC stageIII tumors. Int J Cancer. 99:589–596. 2002.
View Article : Google Scholar : PubMed/NCBI
|
|
30
|
Kowalczyk AE, Krazinski BE, Godlewski J,
Kiewisz J, Kwiatkowski P, Sliwinska-Jewsiewicka A, Kiezun J,
Wierzbicki PM, Bodek G, Sulik M, et al: Altered expression of the
PLAGL1ZAC1/LOT1) gene in colorectal cancer: Correlations to the
clinicopathological parameters. Int J Oncol. 47:951–962.
2015.PubMed/NCBI
|
|
31
|
Livak KJ and Schmittgen TD: Analysis of
relative gene expression data using real-time quantitative PCR and
the 2ΔΔCT method. Methods. 25:402–408. 2001. View Article : Google Scholar : PubMed/NCBI
|
|
32
|
Bundy JG, Iyer NG, Gentile MS, Hu DE,
Kettunen M, Maia AT, Thorne NP, Brenton JD, Caldas C and Brindle
KM: Metabolic consequences of p300 gene deletion in human colon
cancer cells. Cancer Res. 66:7606–7614. 2006. View Article : Google Scholar : PubMed/NCBI
|
|
33
|
Bhandaru M, Ardekani GS, Zhang G, Martinka
M, McElwee KJ, Li G and Rotte A: A combination of p300 and Braf
expression in the diagnosis and prognosis of melanoma. BMC Cancer.
14:3982014. View Article : Google Scholar : PubMed/NCBI
|
|
34
|
Ionov Y, Matsui S and Cowell JK: A role
for p300/CREB binding protein genes in promoting cancer progression
in colon cancer cell lines with microsatellite instability. Proc
Natl Acad Sci USA101. 1273–1278. 2004. View Article : Google Scholar
|
|
35
|
Krubasik D, Iyer NG, English WR, Ahmed AA,
Vias M, Roskelley C, Brenton JD, Caldas C and Murphy G: Absence of
p300 induces cellular phenotypic changes characteristic of
epithelial to mesenchyme transition. Br J Cancer. 94:1326–1332.
2006. View Article : Google Scholar : PubMed/NCBI
|
|
36
|
Peña C, García JM, García V, Silva J,
Domínguez G, Rodríguez R, Maximiano C, García de Herreros A, Muñoz
A and Bonilla F: The expression levels of the transcriptional
regulators p300 and CtBP modulate the correlations between SNAIL
ZEB1, E-cadherin and vitamin D receptor in human colon carcinomas.
Int J Cancer. 119:2098–2104. 2006. View Article : Google Scholar : PubMed/NCBI
|
|
37
|
Goodman RH and Smolik S: CBP/p300 in cell
growth, transformation, and development. Genes Dev. 14:1553–1577.
2000.PubMed/NCBI
|
|
38
|
Zhou J, Zhan S, Tan W, Cheng R, Gong H and
Zhu Q: P300 binds to and acetylates MTA2 to promote colorectal
cancer cells growth. Biochem Biophys Res Commun. 444:387–390. 2014.
View Article : Google Scholar : PubMed/NCBI
|
|
39
|
Debes JD, Sebo TJ, Lohse CM, Murphy LM,
Haugen DA and Tindall DJ: p300 in prostate cancer proliferation and
progression. Cancer Res. 63:7638–7640. 2003.PubMed/NCBI
|
|
40
|
Gry M, Rimini R, Strömberg S, Asplund A,
Pontén F, Uhlén M and Nilsson P: Correlations between RNA and
protein expression profiles in 23 human cell lines. BMC Genomics.
10:3652009. View Article : Google Scholar : PubMed/NCBI
|
|
41
|
Chen G, Gharib TG, Huang CC, Taylor JM,
Misek DE, Kardia SL, Giordano TJ, Iannettoni MD, Orringer MB,
Hanash SM, et al: Discordant protein and mRNA expression in lung
adenocarcinomas. Mol Cell Proteomics. 1:304–313. 2002. View Article : Google Scholar : PubMed/NCBI
|
|
42
|
Lichtinghagen R, Musholt PB, Lein M, Römer
A, Rudolph B, Kristiansen G, Hauptmann S, Schnorr D, Loening SA and
Jung K: Different mRNA and protein expression of matrix
metalloproteinases 2 and 9 and tissue inhibitor of
metalloproteinases 1 in benign and malignant prostate tissue. Eur
Uro. l42:398–406. 2002. View Article : Google Scholar
|
|
43
|
Iyer NG, Chin SF, Ozdag H, Daigo Y, Hu DE,
Cariati M, Brindle K, Aparicio S and Caldas C: p300 regulates
p53-dependent apoptosis after DNA damage in colorectal cancer cells
by modulation of PUMA/p21 levels. Proc Natl Acad Sci USA101.
7386–7391. 2004. View Article : Google Scholar
|
|
44
|
Shi D, Pop MS, Kulikov R, Love IM, Kung AL
and Grossman SR: CBP and p300 are cytoplasmic E4 polyubiquitin
ligases for p53. Proc Natl Acad Sci USA. 106:16275–16280. 2009.
View Article : Google Scholar : PubMed/NCBI
|
|
45
|
Ito A, Lai CH, Zhao X, Saito S, Hamilton
MH, Appella E and Yao TP: p300/CBP-mediated p53 acetylation is
commonly induced by p53-activating agents and inhibited by MDM2.
EMBO J. 20:1331–1340. 2001. View Article : Google Scholar : PubMed/NCBI
|
|
46
|
Theodoropoulos GE, Karafoka E, Papailiou
JG, Stamopoulos P, Zambirinis CP, Bramis K, Panoussopoulos SG,
Leandros E and Bramis J: P53 and EGFR expression in colorectal
cancer: A reappraisal of ‘old’ tissue markers in patients with long
follow-up. Anticancer Res. 29:785–791. 2009.PubMed/NCBI
|
|
47
|
Iacopetta B: TP53 mutation in colorectal
cancer. Hum Mutat. 21:271–276. 2003. View Article : Google Scholar : PubMed/NCBI
|
|
48
|
Tomoda H and Kakeji Y: Immunohistochemical
analysis of p53 in colorectal cancer regarding clinicopathological
correlation and prognostic significance. J Surg Oncol. 58:125–128.
1995. View Article : Google Scholar : PubMed/NCBI
|
|
49
|
Morikawa T, Kuchiba A, Liao X, Imamura Y,
Yamauchi M, Qian ZR, Nishihara R, Sato K, Meyerhardt JA, Fuchs CS,
et al: Tumor TP53 expression status, body mass index and prognosis
in colorectal cancer. Int J Cancer. 131:1169–1178. 2012. View Article : Google Scholar : PubMed/NCBI
|
|
50
|
Zeng ZS, Sarkis AS, Zhang ZF, Klimstra DS,
Charytonowicz E, Guillem JG, Cordon-Cardo C and Cohen AM: p53
nuclear overexpression: An independent predictor of survival in
lymph nodepositive colorectal cancer patients. J Clin Oncol12.
2043–2050. 1994. View Article : Google Scholar
|
|
51
|
Ahnen DJ, Feigl P, Quan G,
Fenoglio-Preiser C, Lovato LC, Bunn PA Jr, Stemmerman G, Wells JD,
Macdonald JS and Meyskens FL Jr: Ki-ras mutation and p53
overexpression predict the clinical behavior of colorectal cancer:
A Southwest Oncology Group study. Cancer Res. 58:1149–1158.
1998.PubMed/NCBI
|
|
52
|
Thomas A and White E: Suppression of the
p300-dependent mdm2 negative-feedback loop induces the p53
apoptotic function. Genes Dev. 12:1975–1985. 1998. View Article : Google Scholar : PubMed/NCBI
|
|
53
|
De Angelis PM, Stokke T, Thorstensen L,
Lothe RA and Clausen OP: Apoptosis and expression of Bax, Bcl-x,
and Bcl-2 apoptotic regulatory proteins in colorectal carcinomas,
and association with p53 genotype/phenotype. Mol Pathol51. 254–261.
1998. View Article : Google Scholar
|
|
54
|
Sturm I, Papadopoulos S, Hillebrand T,
Benter T, Lück HJ, Wolff G, Dörken B and Daniel PT: Impaired BAX
protein expression in breast cancer: Mutational analysis of the BAX
and the p53 gene. Int J Cancer. 87:517–521. 2000. View Article : Google Scholar : PubMed/NCBI
|
|
55
|
Wincewicz A, Sulkowska M, Koda M and
Sulkowski S: Cumulative expression of HIF-1-alpha, Bax, Bcl-xL and
P53 in human colorectal cancer. Pathology. 39:334–338. 2007.
View Article : Google Scholar : PubMed/NCBI
|
|
56
|
Jansson A and Sun XF: Bax expression
decreases significantly from primary tumor to metastasis in
colorectal cancer. J Clin Oncol20. 811–816. 2002. View Article : Google Scholar
|
|
57
|
Cobanoglu B, Ceyran AB, Simsek M and Şenol
S: Immunohistochemical analysis of Bax and AIF in colorectal
tumors. Int J Clin Exp Med. 8:16071–16076. 2015.PubMed/NCBI
|
|
58
|
Krajewska M, Moss SF, Krajewski S, Song K,
Holt PR and Reed JC: Elevated expression of Bcl-X and reduced Bak
in primary colorectal adenocarcinomas. Cancer Res. 56:2422–2427.
1996.PubMed/NCBI
|
|
59
|
Bargou RC, Daniel PT, Mapara MY, Bommert
K, Wagener C, Kallinich B, Royer HD and Dörken B: Expression of the
bcl-2 gene family in normal and malignant breast tissue: Low
bax-alpha expression in tumor cells correlates with resistance
towards apoptosis. Int J Cancer. 60:854–859. 1995. View Article : Google Scholar : PubMed/NCBI
|
|
60
|
Paul-Samojedny M, Kokocińska D, Samojedny
A, Mazurek U, Partyka R, Lorenz Z and Wilczok T: Expression of cell
survival/death genes: Bcl-2 and Bax at the rate of colon cancer
prognosis. Biochim Biophys Acta. 1741:25–29. 2005. View Article : Google Scholar : PubMed/NCBI
|
|
61
|
Ogura E, Senzaki H, Yamamoto D, Yoshida R,
Takada H, Hioki K and Tsubura A: Prognostic significance of Bcl-2,
Bcl-xL/S, Bax and Bak expressions in colorectal carcinomas. Oncol
Rep6. 365–369. 1999.
|
|
62
|
Koda M, Reszec J, Sulkowska M,
Kanczuga-Koda L and Sulkowski S: Expression of the insulin-like
growth factor-I receptor and proapoptotic Bax and Bak proteins in
human colorectal cancer. Ann NY Acad Sci. 1030:377–383. 2004.
View Article : Google Scholar : PubMed/NCBI
|
|
63
|
Nehls O, Hass HG, Okech T, Zenner S, Hsieh
CJ, Sarbia M, Borchard F, Gruenagel HH, Gaco V, Porschen R, et al:
Prognostic implications of BAX protein expression and
microsatellite instability in all non-metastatic stages of primary
colon cancer treated by surgery alone. Int J Colorectal Dis.
24:655–663. 2009. View Article : Google Scholar : PubMed/NCBI
|
|
64
|
Bukholm IK and Nesland JM: Protein
expression of p53, p21WAF1/CIP1, bcl-2, Bax, cyclin D1 and pRb in
human colon carcinomas. Virchows Arch. 436:224–228. 2000.
View Article : Google Scholar : PubMed/NCBI
|
|
65
|
Binder C, Marx D, Binder L, Schauer A and
Hiddemann W: Expression of Bax in relation to Bcl-2 and other
predictive parameters in breast cancer. Ann Oncol. 7:129–133. 1996.
View Article : Google Scholar : PubMed/NCBI
|