Introduction
Epigenetic changes have been implicated in the
development of cancer through the transcriptional repression of
genes that encode for key-proteins involved in regulating cellular
proliferation. Mounting evidence has shown that the mechanisms that
underlie these events include silencing of several tumor suppressor
genes (1,2). Histone deacetylase enzymes (HDACs)
comprise one of the most prominent classes of transcription factors
that regulate gene expression by the removal of acetyl groups from
histone and non-histone proteins (3). Deacetylation of histone proteins has
been suggested to decrease the transcriptional activity of several
genes as histones with less acetyl groups exhibit weaker
interactions with DNA.
HDACs are broadly categorized in two families: The
Zn+2-dependent family that is composed of three classes
of HDACs I, II and IV, and the Zn+2-independent class
III HDACs or SIRT enzymes (3).
Class I HDACs comprise the four members HDAC1, 2, 3 and 8, which
are localized in the nucleus of the cells and act on histone
proteins (3). Class II HDACs are
divided into the subclasses IIa comprising of HDAC 4, 5, 7, 9, and
IIb comprising of HDAC6 and HDAC10 (3). Class II enzymes are primarily
localized in the cytoplasm, although they are also known to shuttle
in and out of the nucleus facilitating the deacetylation of several
histone and non-histone proteins (2,3). Class
IV includes HDAC11, whereas class III enzymes are
NAD+-dependent deacetylases with non-histone proteins as
substrates in mammalian cells. Class I enzymes have been
demonstrated to play a key role in cellular proliferation and
survival by knockout studies, whereas class II enzymes are involved
in cellular migration, differentiation and angiogenesis (3).
Due to the involvement of HDACs in the
transcriptional silencing of the nuclear protein tumor suppressor
genes and their implication in cellular signaling and
differentiation, HDAC inhibition has emerged as a powerful tool to
target cancer cells and design therapeutic drugs with improved
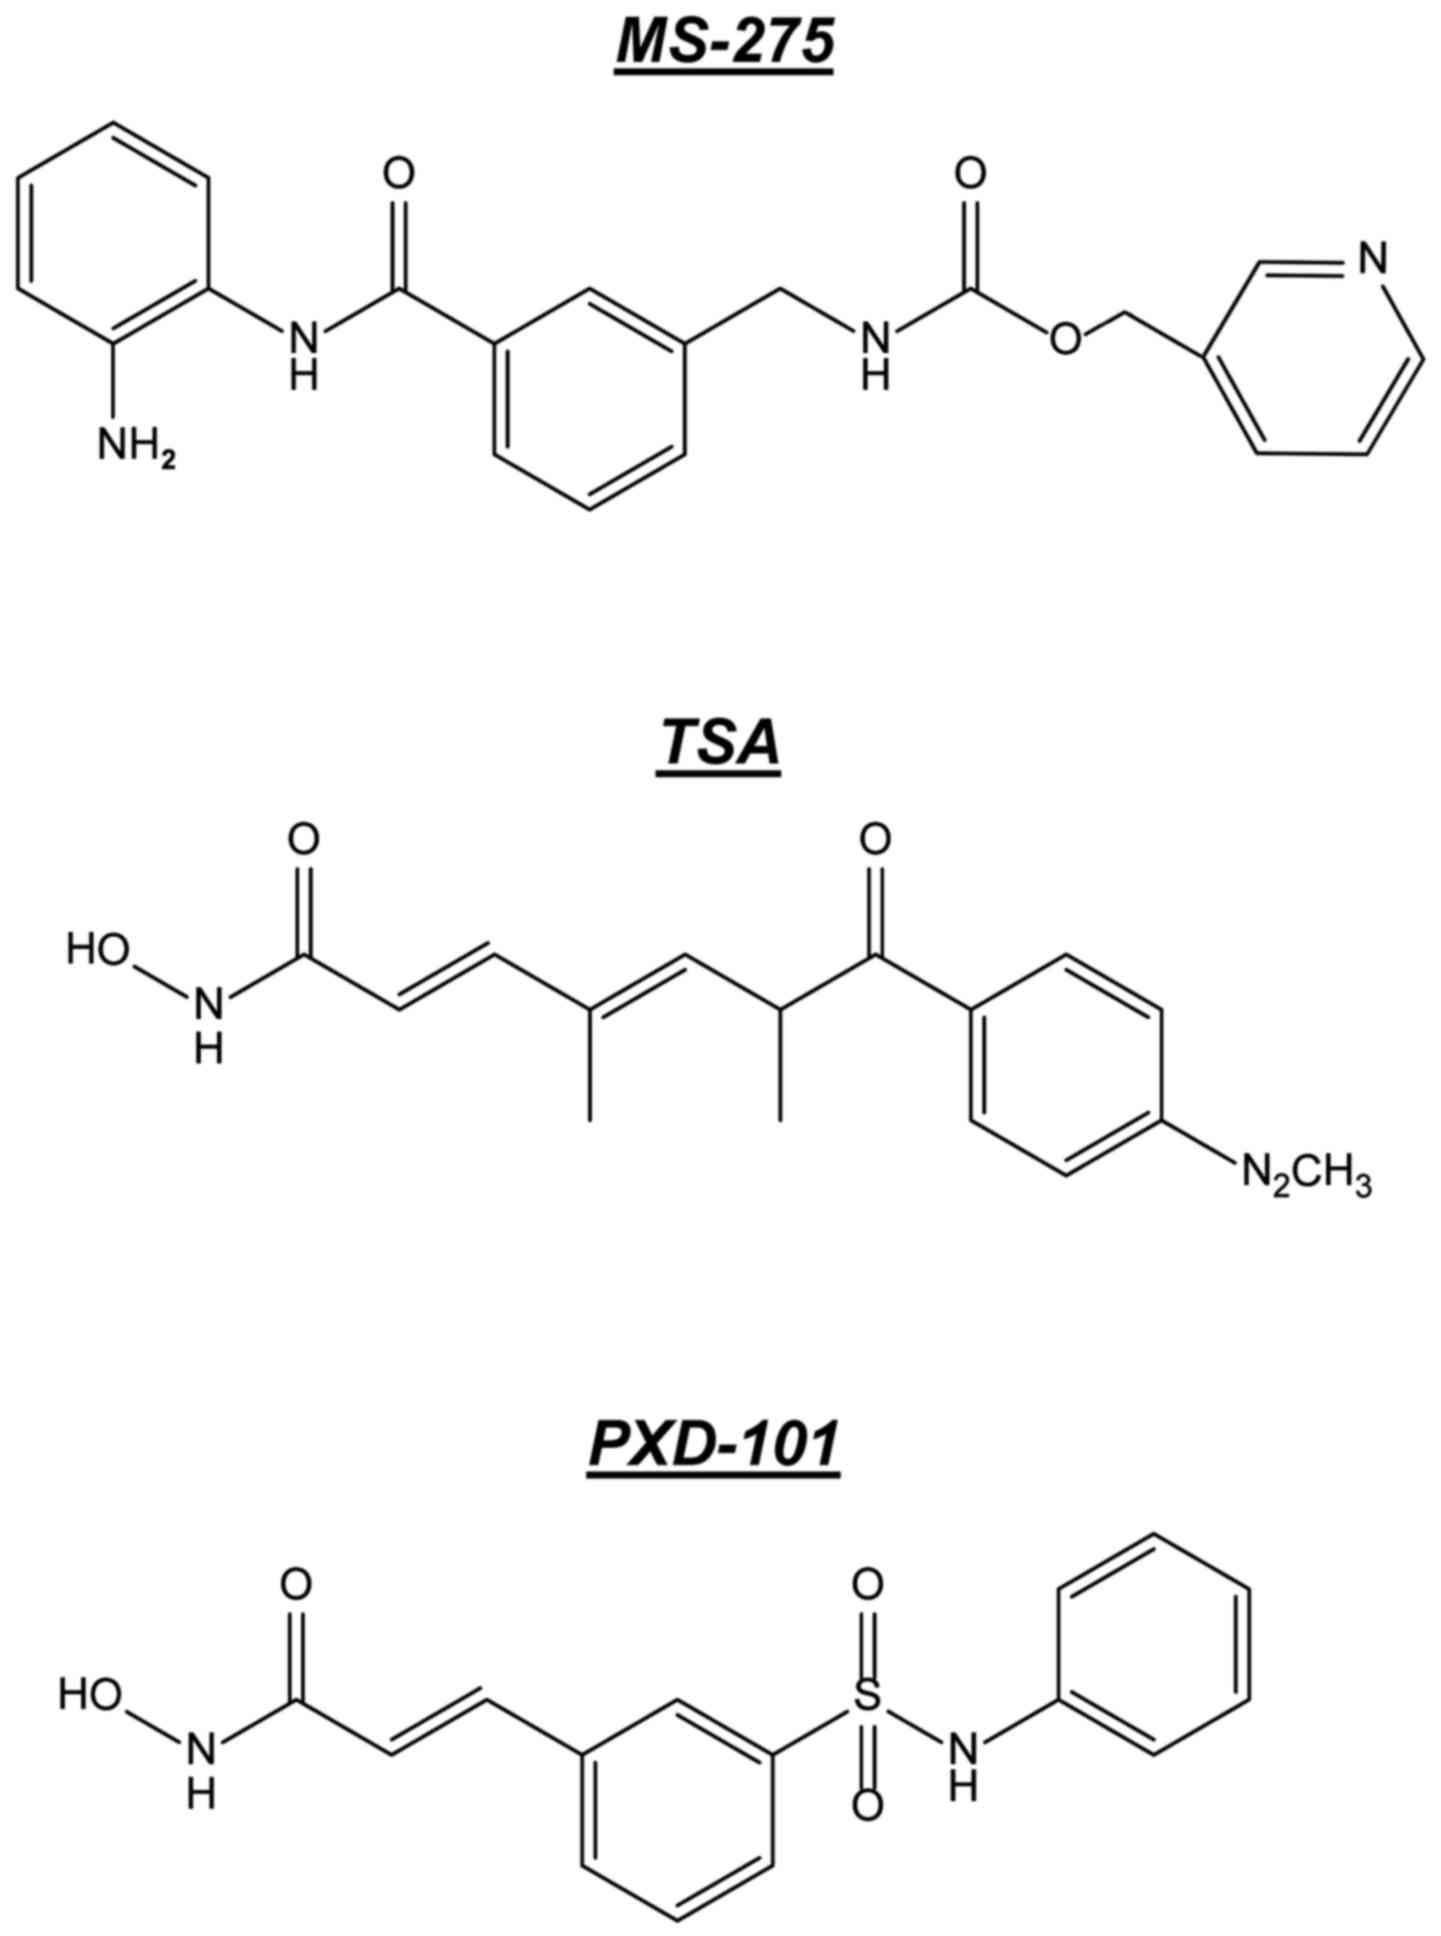
clinical efficacy (4,5). Trichostatin A (TSA) and Belinostat
(PXD-101) are two hydroxamic acid histone deacetylase inhibitors
that have shown promise in the treatment of several types of cancer
(6). The analogue of TSA (SAHA)
used clinically, was approved for the treatment of cutaneous T-cell
lymphoma (CTCL) in 2006 (7). TSA is
currently undergoing multiple clinical trials in combination with
other chemotherapeutic drugs, whereas PXD-101 is undergoing phase I
and II trials for the treatment of various types of hematological
malignancies and solid tumors such as relapsed malignant pleural
mesothelioma and relapsed or refractory peripheral T-cell lymphoma
(6,8–10).
Entinostat (MS-275) is a benzamide-based HDACi that has been
evaluated in a phase II study for the treatment of Hodgkin's
lymphoma (11). TSA and PXD-101
have been proven to be pan-HDACi since they inhibit both class I
and II enzymes, whereas MS-275 shows specificity for certain HDAC
enzymes (12,13).
The present study investigated the anticancer
effects of TSA, PXD-101 and MS-275 in A2780 ovarian carcinoma and
MCF7 breast adenocarcinoma cells by means of total HDAC enzyme
inhibition, cytotoxicity and induction of acetylated histone H4 and
acetylated tubulin expression. In addition, a flow cytometric assay
was employed, in order to quantify the potency of HDACi in inducing
acetylated histone H4 and acetylated tubulin levels in
vitro. The data suggest that benzamide MS-275 shows specificity
towards class I enzymes as opposed to the pan-HDACi TSA and
PXD-101.
Materials and methods
Reagents
MTT, DMSO, cell culture and western blot reagents
were purchased from Sigma (St. Louis, MO, USA). The primary
antibody for acetylated histone H4 was purchased from Upstate
Biotechnology, Inc. (Lake Placid, NY, USA), for acetylated tubulin
from Biomol International (Plymouth Meeting, PA, USA), for HDAC1
from Abcam (Cambridge, UK), for HDAC3 from New England Biolabs-Cell
Signalling (Ipswich, MA, USA) and for β-actin from Sigma.
Anti-mouse and anti-rabbit secondary antibodies used for western
blot analysis were from Dako (Carpinteria, CA, USA) whereas
anti-rabbit secondary antibody conjugated with FITC used for flow
cytometry was from Sigma.
Cell culture
A2780 and MCF7 cells were maintained in RPMI-1640
with phenol red, 2 mM glutamine, penicillin streptomycin 1X and 10%
(v/v) heat-inactivated fetal calf serum. Contamination was checked
by microscopic investigation. Cells were grown at 37°C, 5%
CO2 /95% air with 100% humidity, and passaged using
trypsin EDTA (0.25%).
MTT cytotoxicity assay
MCF7 or A2780 (2×10³) cells were plated
in 96-well flat-bottomed plates. Following 24 h of incubation, the
medium was removed and HDACi were added at a final concentration
range of 0.039, 0.078, 0.156, 0.31, 0.625, 1.25, 2.5, 5 and 10 µM.
The cells were left to grow for 96 h. The medium was removed and
MTT was added in fresh medium in each well at a final concentration
of 0.5 mg/ml for 3 h. The formazan product generated by viable
cells was solubilised with DMSO. Cell viability was measured from
the absorbance at 540 nm. Results were expressed as the percentage
of 100% (control) proliferation, and the IC50 was
calculated using Graph Pad Prism v.4.03 software.
Enzyme assay
Total HDAC activity was measured with a
Fluor-de-Lys™ HDAC fluorometric activity assay kit (Biomol
International). A master mix solution containing nuclear extract
lysate, HDAC assay buffer, and Fluor-de-Lys™ deacetylated standard
was prepared. The assay was carried out on a 96-well white
microplate in the presence of HDACi at a concentration range of 20,
2, 0.2, 0.02 and 0.005 µM. The reaction was initiated by the
addition of Fluor-de-Lys™ substrate, provided in the kit. Following
a 20-min incubation the reaction was terminated by the addition of
Fluor-de-Lys™ developer. Fluorescence was measured at an excitation
λ of 360 nm and emission λ of 460 nm.
Western blot analysis
A2780 and MCF7 cells that were treated for 24 h with
TSA, PXD-101 or MS-275 were trypsinised, washed once with PBS and
resuspended in 100–200 µl lysis solution containing protease
inhibitor cocktail and DTT (1 mM). The protein concentration of
each sample was estimated by the Bradford assay, and 15 µl were
mixed with SDS-PAGE 1X buffer containing 1.5 ml of Tris base (1 M
pH 6.8), 2.5 ml of 20% SDS, 2.5 ml of 100% glycerol, bromophenol
blue and β-mercaptoethanol at a concentration of 0.1% (w/v) and 10%
(v/v), respectively. The running and stacking gel (10%) were
composed of 7.9 and 2.5 ml of H2O, 6.7 and 0.625 ml of
30% acrylamide, 5 and 1.05 ml of 1.5 M Tris·Cl (pH 8.8), 0.2 and
0.04 ml of 10% sodium dodecyl sulfate (SDS), 0.2 and 0.02 ml of 10%
ammonium persulfate (APS) and 9 µl of TEMED (N-,N-
tetramethylethylenediamine), respectively. The running buffer was
prepared as 5X stock by mixing 75.5 g of Tris, 360 g of glycine and
25 g of SDS with 5 l of H2O. The gel was left to run for
1 h at 120 V and the proteins were transferred to a PVDF membrane
at a constant current of 300 mA for 1 h. The membrane was removed
and incubated with 5% milk in TBS-T at room temperature for 1.5 h
with gentle shaking or overnight at 4°C, depending on the
experiment. The membrane was then incubated either overnight at 4°C
or at room temperature for 1.5–3 h in 1% milk in TBS-T, containing
primary antibody. The following morning, the membrane was rinsed
briefly with TBS-T and washed three times with TBS-T for 10 min.
Secondary antibody was diluted in 1% milk TBS-T and added to the
membrane for 1 h at room temperature with gentle shaking. The
membrane was then washed three times for 10 min with TBS-T and
incubated with 1.5–2 ml of ECL Plus detection reagents for 5 min at
room temperature. The membrane was finally exposed for 2–30 min to
a film and developed using a standard developer and fixer
solutions.
The primary antibodies used were as follows:
Acetylated histone H4 for 3 h at 1:20,000 dilution, acetylated
tubulin for 1.5–2 h at 1:6,000 dilution, HDAC1 for overnight at
1:500 dilution, HDAC3 for overnight at 1:1,000 dilution and β-actin
for 1 h at 1:10,000 dilution. The secondary antibodies used were
the following: Anti-mouse IgG for 1 h at 1:1,000 dilution and
anti-rabbit IgG for 1 h at 1:2,000 dilution.
Flow cytometry
The method was adapted from Ronzoni et al
(14). Briefly, A2780 and/or MCF7
cells were seeded at a density of 5×10³ cells/ml and
left to grow for 24 h. HDACi were added at a final concentration of
2, 5 and/or 10 µM and incubated with the cells for another 24 h.
The cells were washed with PBS once, detached from the flasks with
the aid of trypsin-EDTA and resuspended in ice-cold PBS containing
1% formalin. Following incubation on ice for 15 min the cells were
centrifuged at 3,500 rpm for 5 min and resuspended in 70% ice-cold
ethanol. The same process was conducted and the cells were finally
resuspended in PBS containing 0.1% Triton-X. The supernatant was
removed and 1% BSA in PBS was added to each sample that was
vortexed, incubated at room temperature for 15 min and centrifuged
at 3,500 rpm for 5 min. The supernatant was discarded and blocking
of the non-specific binding sites was achieved by the addition of
PBS containing 10% normal goat serum and incubation on a rocker for
20 min at room temperature. A primary antibody of acetylated
histone H4 and/or acetylated tubulin was added at a 1:100 or 1:200
dilution, respectively, in PBS containing 1% BSA and incubated with
the cells for 1 h at room temperature by continuous shaking. The
cells were washed once with PBS. Secondary antibody conjugated with
FITC was added in PBS 1% BSA at a 1:1,000 dilution and incubated
with the cells in the dark for 1 h at room temperature by
continuous shaking. The cells were finally centrifuged at 3,500 rpm
for 5 min and the supernatant was discarded. PI (50 µg/ml) and
RNAse A (10 µg/ml) were added to the samples that were incubated in
the dark for 30 min. The fluorescence intensity was measured using
a BD FACSCalibur flow cytometer with an excitation λ of 488 nm and
emission λ of 520 nm for FITC, and 625 nm for PI. A total of 3
controls were prepared: One containing no stain, one with PI alone
and one with FITC alone.
Statistical analysis
The results are expressed as mean ± SD for n=3
determinations unless indicated otherwise. Statistical differences
were determined with a paired t-test.
Results
HDACi inhibit proliferation of A2780
and MCF7 cells
HDACs have been validated as targets for anticancer
therapy. The inhibitors TSA, PXD-101 and MS-275 (Fig. 1) were the initial small molecules
designed to test the therapeutic potential of HDAC enzymes and have
shown promise in the treatment of solid tumors and hematological
cancers (6,8,9). It
has been reported that among different tumor types, breast and
ovarian cancers are responsive to HDACi treatment (15,16).
Thus, the antiproliferative effects of TSA, PXD-101 and MS-275 were
examined in A2780 ovarian carcinoma and MCF7 breast adenocarcinoma
cells by the MTT cell viability assay. All HDACi exhibited
comparable IC50s, below the µM scale (Table I). PXD-101 showed a somewhat greater
potency in A2780 cells compared with MS-275 and TSA, whereas in
MCF7 cells, MS-275 was the most effective inhibitor of cellular
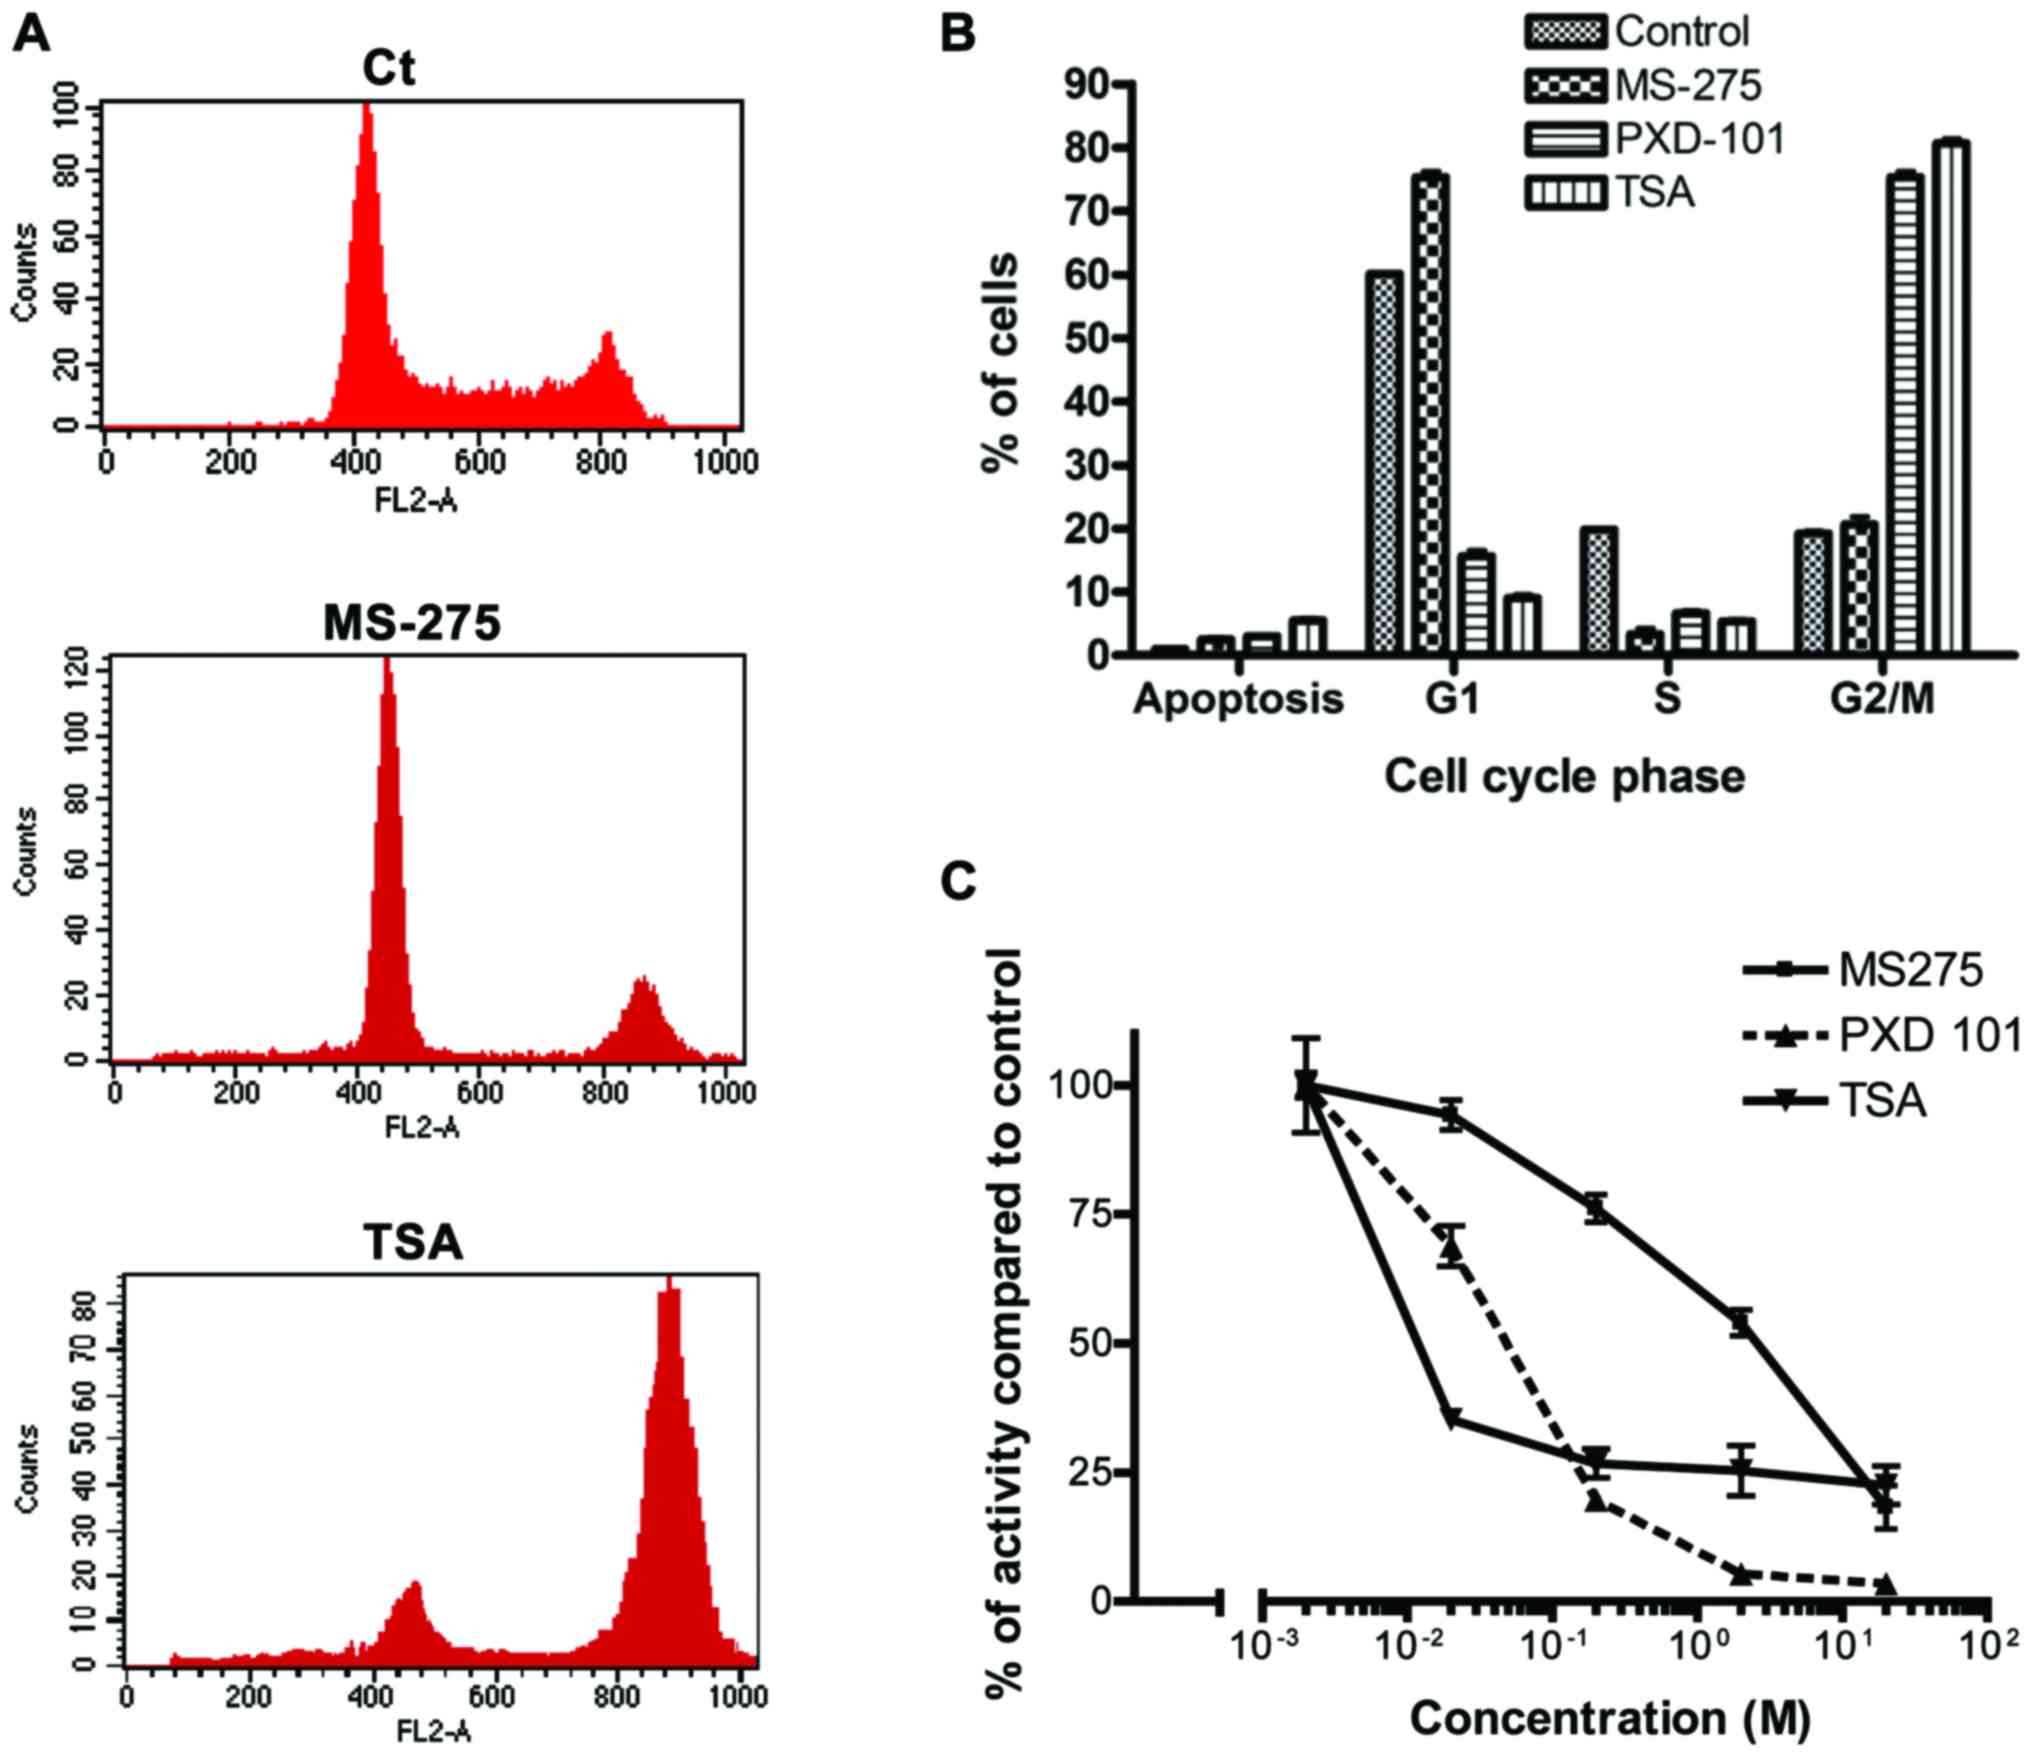
proliferation. The PI staining of A2780 cells showed that both
PXD-101 and TSA caused a blockage at the G2/M phase of the cell
cycle at 5 and 10 µM with a combined induction of apoptosis,
compared to control samples treated with 0.1% DMSO for 24 h
(Fig. 2A and B). In contrast to TSA
and PXD-101, MS-275 produced a G1 block in A2780 cells compared
with the control sample (Fig. 2A and
B). It is important to note that TSA induced higher G2/M arrest
(83±2.4%) compared with PXD-101 (78±1.9%) in A2780 cells (Fig. 2B).
 | Table I.Antiproliferative activity of MS-275,
TSA and PXD-101 in A2780 and MCF7 cells. |
Table I.
Antiproliferative activity of MS-275,
TSA and PXD-101 in A2780 and MCF7 cells.
| Compounds | A2780 (µM) | MCF7 (µM) |
|---|
| TSA |
0.5±0 |
0.6±0.01 |
| PXD-101 |
0.4±0.05 |
0.4±0 |
| MS-275 |
0.6±0 |
0.4±0.04 |
The hydroxamic acids PXD-101 and TSA
exhibit higher potency with regard to HDAC inhibition than MS-275
in enzyme and cell-based assays
In an effort to examine the association of the
antiproliferative effect with HDAC enzyme inhibition, the ability
of HDACi to inhibit total HDAC enzyme activity was further
investigated in a cell-free assay system that utilizes a
fluorogenic acetylated lysine side chain as a substrate. TSA was
the most potent inhibitor with an IC50 lower than 0.01
µM, whereas MS-275 was considerably weaker with an IC50
of 2 µM (Fig. 2C). PXD-101
indicated intermediate efficacy with regard to HDAC enzyme
inhibition, exhibiting an IC50 of 0.04 µM (Fig. 2C).
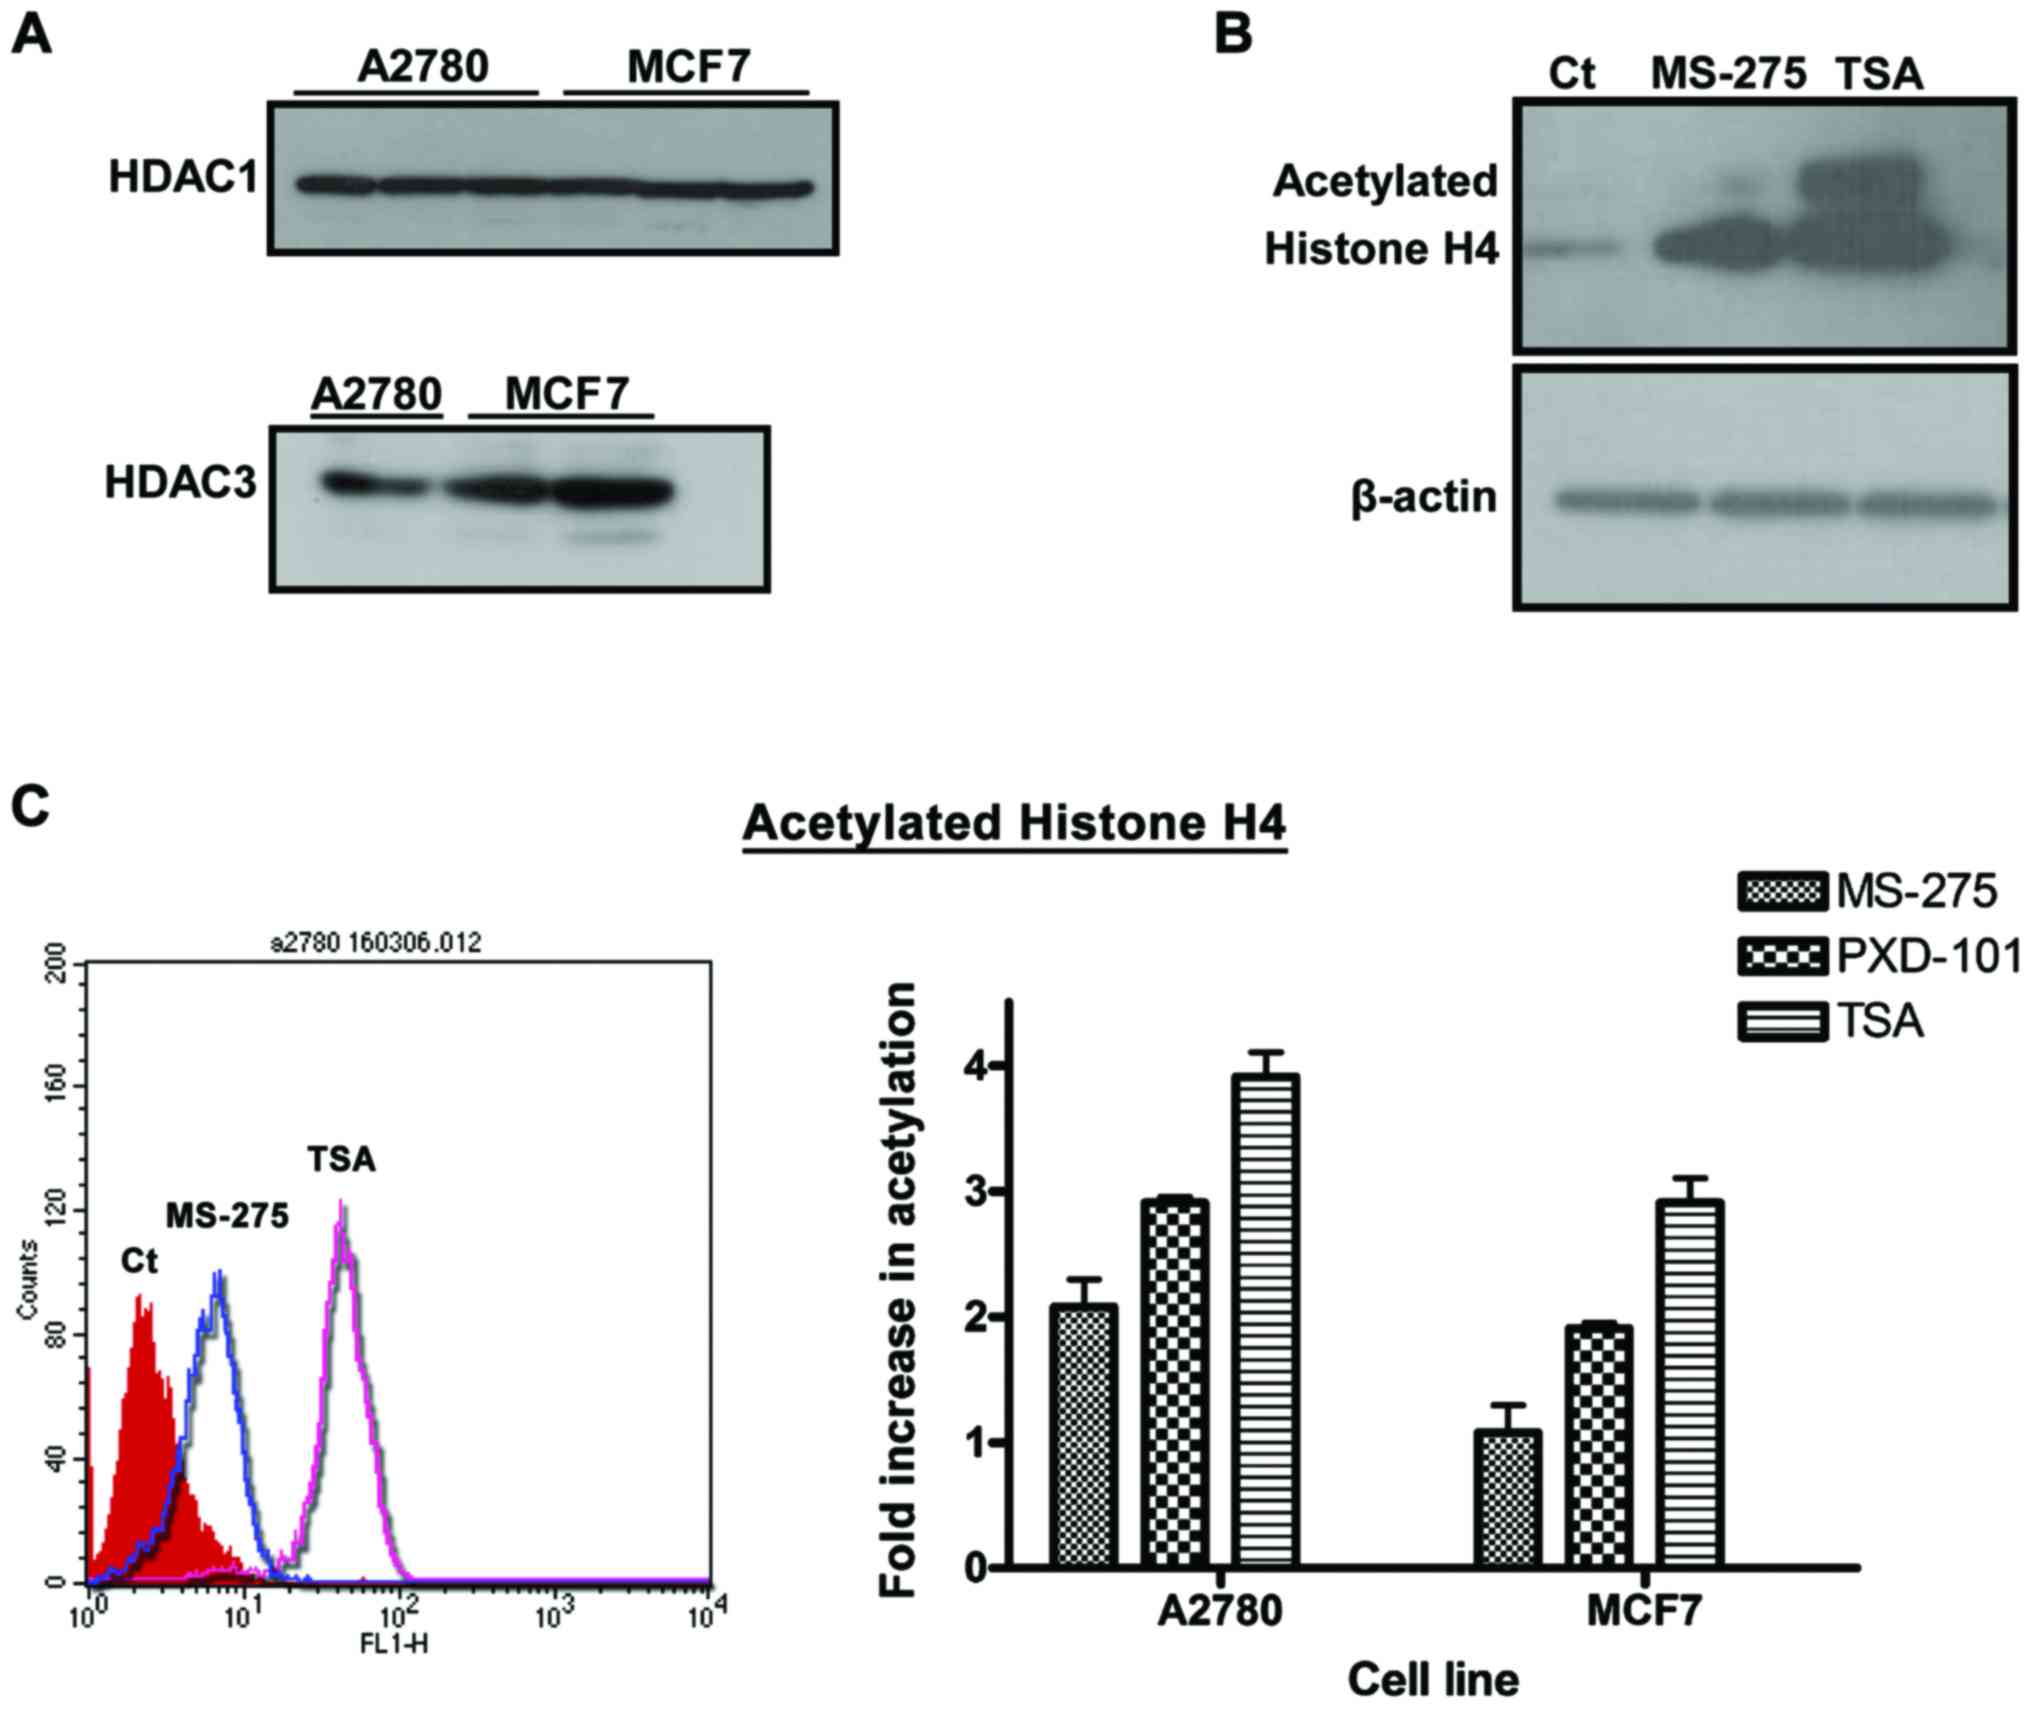
To extend the relevancy of the cell-free enzyme
inhibition results, the effect of HDACi on the induction of
acetylated histone H4 and acetylated tubulin was examined in MCF7
and A2780 cells. Acetylated histone H4 is a marker of HDAC1 and
HDAC3 activity, which were constitutively expressed in A2780 and
MCF7 cells (Fig. 3A). Western blot
analysis clearly demonstrated that both MS-275 and TSA induced a
high increase in the expression levels of acetylated histone H4 in
A2780 cells compared with the solvent control (0.1% DMSO) (Fig. 3B). Using immunoblotting, the potency
of these two inhibitors was initially found to be very similar.
Consequently, a flow cytometry assay was employed to quantify the
increase of acetylated histone H4, following HDACi treatment
(Fig. 3B). The methodology involved
incubation of the samples with high concentrations of primary
antibody (1:100 dilution) and detection using a secondary antibody
conjugated to FITC as described by Ronzoni et al (14). The linearity of the assay was
confirmed by treatment of A2780 and/or MCF7 cells with known
concentrations of HDACi (0, 2, 5 and 10 µM) (data not shown).
MS-275 induced a 2-fold increase in acetylated histone H4, whereas
PXD-101 and TSA were more potent inducing a 3- and 4-fold increase
in A2780 cells, respectively (Fig.
3C). Similar results were obtained in MCF7 cells for the three
HDACi (Fig. 3C).
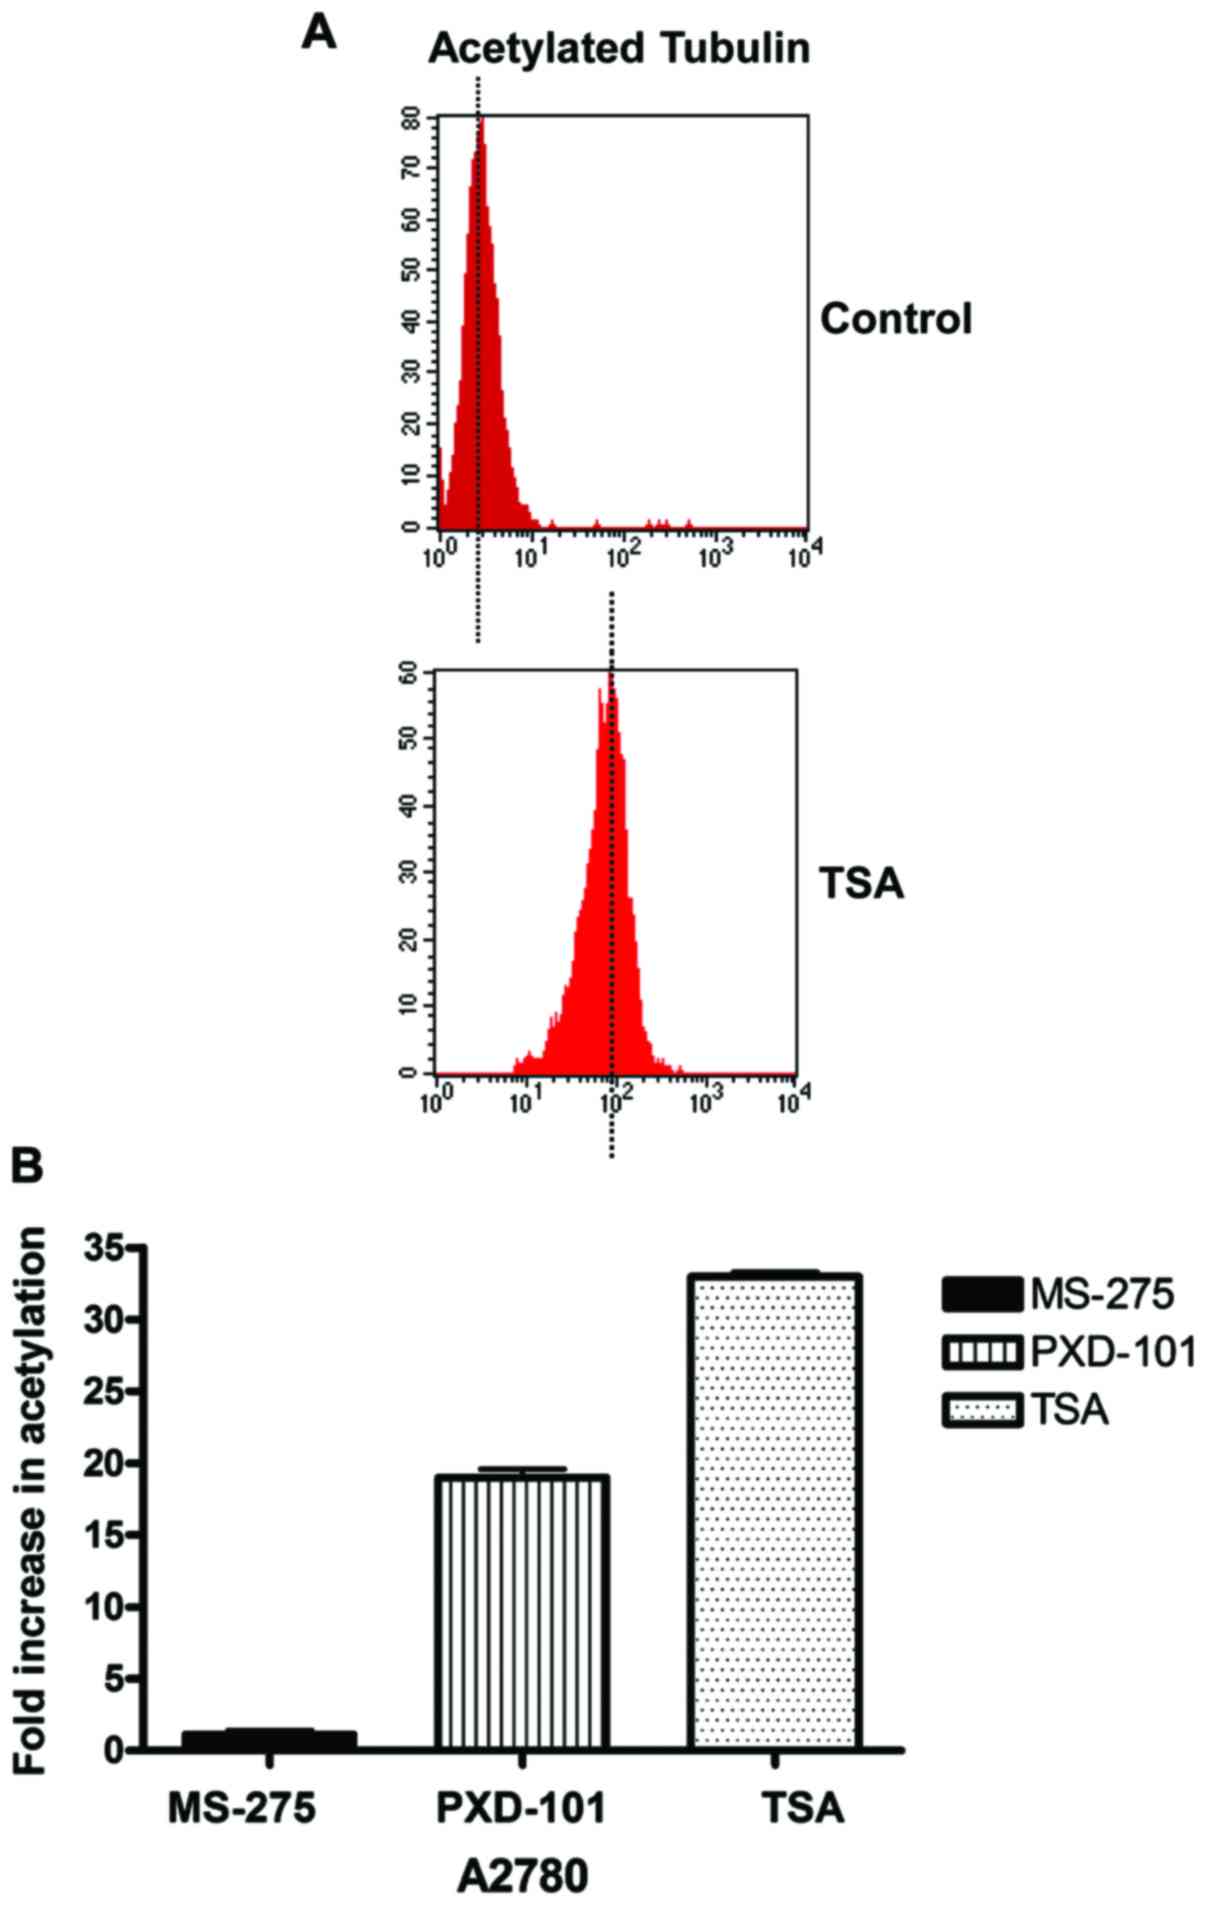
PXD-101 and TSA induce potent
upregulation of acetylated tubulin compared with MS-275 in A2780
and MCF7 cells
The effects of HDACi on the induction of acetylated
tubulin expression, which is a marker of HDAC6 enzyme activity,
were markedly different to those obtained for acetylated histone H4
in A2780. MS-275 induced a very weak increase of acetylated tubulin
expression in A2780 cells, whereas PXD-101 and TSA were
considerably more potent, as determined by western blot analysis
(Fig. 4A and B). Moreover, the flow
cytometry analysis demonstrated that the fold-increase in the
induction of acetylated tubulin caused by 5 µM of MS-275 in A2780
cells was negligible, compared to the other two HDACi, where a
remarkable 18- and 30-fold increase was observed (Fig. 5A and B).
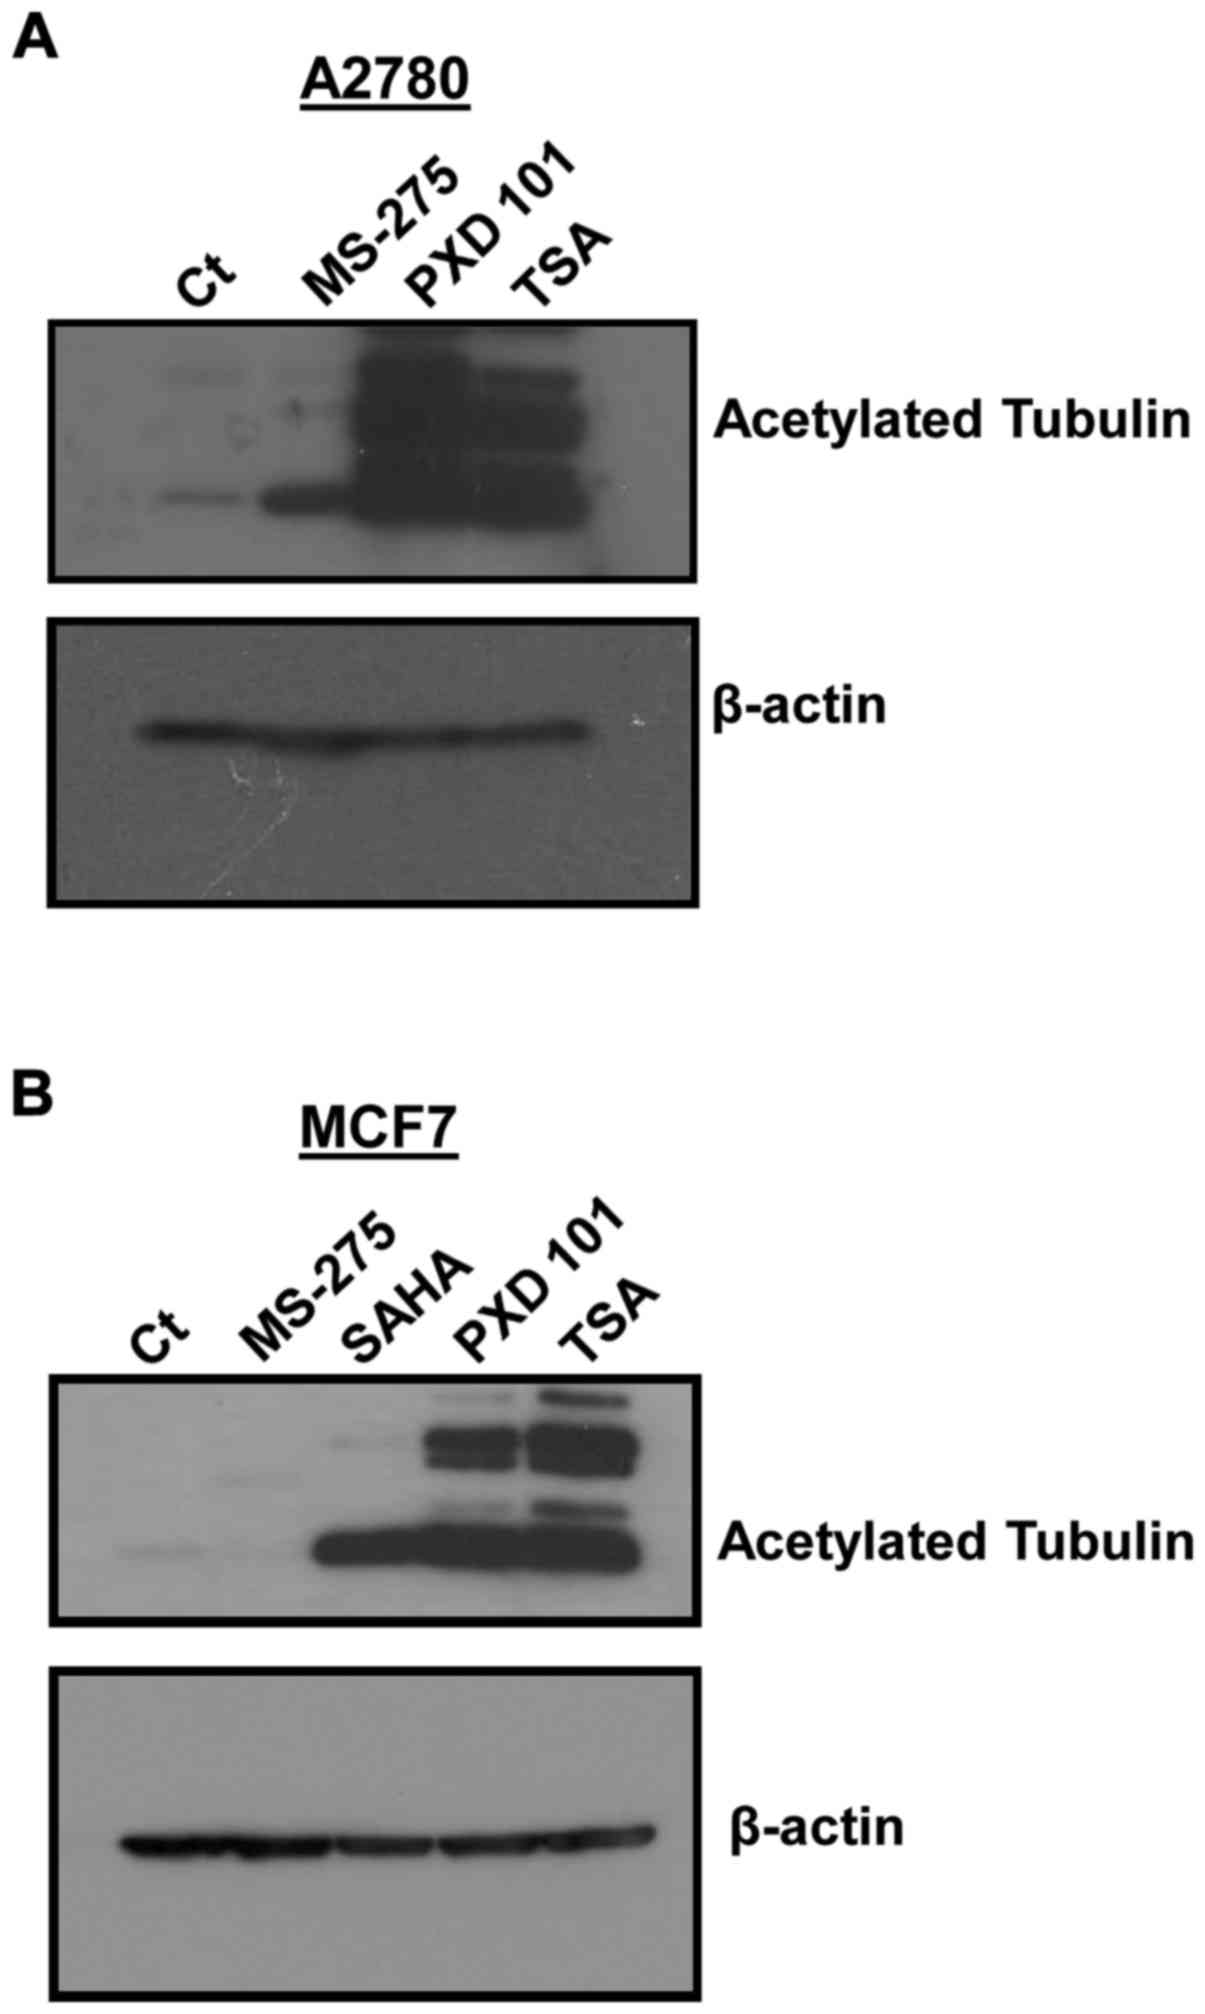 | Figure 4.HDACi-increased expression of
acetylated tubulin in A2780 and MCF7 cells. A2780 and MCF7 cells
were treated with 5 µM HDACi for 24 h and acetylated tubulin was
measured by western blot analysis, as described in Materials and
methods. (A) A2780 left to right lane 1–4: Control (0.1% DMSO),
MS-275, PXD-101, TSA. (B) MCF7 left to right lane 1–5: Control
(0.1% DMSO), MS-275, SAHA, PXD-101, TSA. HDACi, histone deacetylase
enzyme inhibitor; MS-275, Entinostat; PXD-101, Belinostat; TSA,
Trichostatin A. |
Discussion
Induction of acetylated histone H4 is a common
end-result observed following HDACi treatment. This protein has
been proposed as a marker for the diagnosis and evaluation of HDACi
efficacy in clinical trials involving human solid tumors (17). Flow cytometry was previously
employed and has successfully been validated as a powerful tool for
the detection of acetylated histone H4 levels in blood samples from
patients, as well as leukemic cell lines that were treated with
HDACi such as valproic acid and TSA (14,18).
The results presented in the current study indicated that TSA was
the most effective inducer of acetylated histone H4, compared to
the other two HDACi. Using western blot analysis, Duong et
al (19) reported similar
findings. A higher induction in the levels of acetylated histone H4
was noted in MCF7 cells treated with TSA compared with cells that
were treated with MS-275 (19).
Ronzoni et al (14)
demonstrated a 4-fold induction of acetylated histone H4 in U937
leukemic cells treated with 50 ng/ml TSA for 4 h, which
corresponded to an approximate concentration of 0.2 µM. This
increase was similar to that noted in the present study, although
the concentration and incubation times used were considerably
higher. Despite this discrepancy, the maximum induction in the
study conducted in U937 cells was noted at the 4-h period. It is
important to note that U937 leukemic cells may be more sensitive to
HDACi treatment than either MCF7 or A2780 cells, thereby accounting
for the difference in the concentration of TSA, required for
maximum induction.
A previous study by Khan et al (12) reported on the class and isoform
selectivity of small molecule HDAC inhibitors. The authors used a
similar enzymatic assay to the one described in the present study
and recombinant human HDAC isoforms to determine the potency of
each inhibitor. MS-275 was shown to be selective for HDAC1, whereas
both TSA and PXD-101 were potent pan-HDAC inhibitors, although both
classes of inhibitors inhibited HeLa cell growth. In the present
study, TSA and PXD-101 exhibited a higher potency than MS-275 in
inhibiting HDAC enzyme activity. One possible explanation is that
the Fluor-de-Lys™ enzyme assay utilizes a HeLa nuclear lysate,
which contains all HDAC isoforms, rather than recombinant HDAC
enzymes, thus, accounting for the IC50 difference noted
between the hydroxamic acid HDACi and MS-275.
Previous reports have underlined the antitumor
effect of HDACi in cancer cell line models. MS-275, PXD-101 and TSA
show considerably low IC50s, below the µM range
(15,20–22).
PXD-101 has been shown to inhibit proliferation of A2780 cells at a
higher potency than MCF7, with IC50 values of 30 and 50
nM, respectively. In contrast to the study by Qian et al
(22), TSA exhibited a 90%
reduction of cellular proliferation in A2780 cells at 100 ng/ml
following a 3-day incubation, which corresponded to an approximate
IC50 value of 0.8 µM (23–25).
Duong et al (19) previously
reported that, in MCF7 cells, TSA exhibited approximately 75%
reduction of proliferation at 0.07 µM following a 2-day treatment
and 85% following a 5-day treatment. This corresponds to
approximate IC50s of 0.15 and 0.25 µM, whereas Davies
et al (15) showed a 50%
reduction of MCF7 cell growth caused by treatment of 1 µM TSA for
48 h. These published data are in agreement with the results
presented in the current study. The mechanism of action of
hydroxamic acid HDACi involves cell cycle arrest at the G2/M phase
through p21 upregulation and induction of apoptosis via Bcl-2
expression (19,23–25).
Using western blot analysis, Duong et al
(19) reported on the potent
induction of acetylated tubulin in MCF7 cells treated with 1.7 µM
of TSA for 6 h, while treatment of 1 µM of MS-275 for the same time
period had no effect on the expression of the latter protein, which
concurs with our findings. In A2780 cells, acetylated tubulin was
upregulated following a 24-h treatment of TSA and/or PXD-101 at a
concentration range of 0.3, 1 and 3 µM, as opposed to MS-275 where
the levels of protein expression remained constant and similar to
the control sample (23). In
concordance with the studies by Duong et al (19) and Arts et al (23), we demonstrated upregulation of
acetylated tubulin following HDACi treatment in MCF7 cells by
western blot analysis, and in A2780 cells by flow cytometry and
western blot analysis. FACS has been used as a method to detect
acetylated histone H4 in cell lines and clinical samples (14). To the best of our knowledge,
acetylated tubulin induction following HDACi treatment has only
been detected by immunoblotting. Application of the flow cytometry
protocol described previously for acetylated histone H4 expression
showed that the induction of acetylated tubulin was higher by a
factor of 10, when the cells were incubated with either TSA and/or
PXD-101. It is noteworthy that incubation of either PXD-101 and/or
TSA with MCF7 and/or A2780 cells, produced a number of bands
corresponding to multiple levels of tubulin acetylation, compared
with MS-275 where a similar expression to the control was noted
(Fig. 4A and B). In contrast to
these observations, acetylated histone H4 induction was evident by
the presence of two bands, corresponding to two levels of
acetylation (Fig. 3B). Since
acetylated tubulin induction was a more sensitive marker of
hydroxamic acid HDACi treatment, compared with acetylated histone
H4, the western blot analysis results are in concordance with the
flow cytometry analysis undertaken in the present study. The data
confirm that TSA and PXD-101 are pan-HDACi, whereas MS-275 does not
inhibit some of the class II enzyme isoforms such as HDAC6.
Investigation of the mechanisms and function of
HDACs in tumor progression is an active research area that has
attracted considerable scientific attention in recent years.
Although the exact molecular pathways by which HDAC enzymes
contribute to cancer progression remain ill-defined, it is
generally believed that class I HDACs play a significant role in
cellular proliferation, whereas class II enzymes are involved in
other processes such as angiogenesis, adhesion and differentiation
(2). It is becoming increasingly
evident that targeting class I enzymes is more beneficial in cancer
therapy due to the pleiotropic effects of HDACi in multiple
cellular signaling pathways such as induction of apoptosis and
induction of cell cycle inhibition (26). In addition, the design of class- or
HDAC-specific small molecule inhibitors, such as MS-275, is
essential in order to unravel the mechanism of action of each HDAC
enzyme, since HDACs are known to participate in large protein
complexes and interact with several important transcriptional
factors that regulate cell growth, remodeling and differentiation,
namely p300 and Snail (27,28).
The present study therefore demonstrated the
selectivity and potency of three well-known HDACi in in
vitro cell and enzyme assays. The data demonstrated that MS-275
is a more selective inhibitor of HDACs than either TSA or PXD-101,
while all compounds indicated comparable submicromolar
IC50s against A2780 and MCF7 cells. Future
investigations should focus on the design of novel class I specific
benzamide-based HDACi as anticancer agents.
Acknowledgements
We would like to thank Xara Fouda for her assistance
in figure and artwork preparation.
References
|
1
|
Kristensen LS, Nielsen HM and Hansen LL:
Epigenetics and cancer treatment. Eur J Pharmacol. 625:131–142.
2009. View Article : Google Scholar : PubMed/NCBI
|
|
2
|
Witt O, Deubzer HE, Milde T and Oehme I:
HDAC family: What are the cancer relevant targets? Cancer Lett.
277:8–21. 2009. View Article : Google Scholar : PubMed/NCBI
|
|
3
|
Gray SG and Ekström TJ: The human histone
deacetylase family. Exp Cell Res. 262:75–83. 2001. View Article : Google Scholar : PubMed/NCBI
|
|
4
|
Mehnert JM and Kelly WK: Histone
deacetylase inhibitors: Biology and mechanism of action. Cancer J.
13:23–29. 2007. View Article : Google Scholar : PubMed/NCBI
|
|
5
|
Emanuele S, Lauricella M and Tesoriere G:
Histone deacetylase inhibitors: Apoptotic effects and clinical
implications (Review). Int J Oncol. 33:637–646. 2008.(Review).
PubMed/NCBI
|
|
6
|
Glaser KB: HDAC inhibitors: Clinical
update and mechanism-based potential. Biochem Pharmacol.
74:659–671. 2007. View Article : Google Scholar : PubMed/NCBI
|
|
7
|
Wilcox RA: Cutaneous T-cell lymphoma: 2016
update on diagnosis, risk-stratification, and management. Am J
Hematol. 91:151–165. 2016. View Article : Google Scholar : PubMed/NCBI
|
|
8
|
Hess-Stumpp H, Bracker TU, Henderson D and
Politz O: MS-275, a potent orally available inhibitor of histone
deacetylases-the development of an anticancer agent. Int J Biochem
Cell Biol. 39:1388–1405. 2007. View Article : Google Scholar : PubMed/NCBI
|
|
9
|
Tan J, Cang S, Ma Y, Petrillo RL and Liu
D: Novel histone deacetylase inhibitors in clinical trials as
anti-cancer agents. J Hematol Oncol. 3:52010. View Article : Google Scholar : PubMed/NCBI
|
|
10
|
O'Connor OA, Horwitz S, Masszi T, Van Hoof
A, Brown P, Doorduijn J, Hess G, Jurczak W, Knoblauch P, Chawla S,
et al: Belinostat in patients with relapsed or refractory
peripheral T-cell lymphoma: Results the pivotal phase II BELIEF
(CLN-19) study. J Clin Oncol. 33:2492–2499. 2015. View Article : Google Scholar : PubMed/NCBI
|
|
11
|
Batlevi CL, Kasamon Y, Bociek RG, Lee P,
Gore L, Copeland A, Sorensen R, Ordentlich P, Cruickshank S, Kunkel
L, et al: ENGAGE-501: Phase II study of entinostat (SNDX-275) in
relapsed and refractory Hodgkin lymphoma. Haematologica.
101:968–975. 2016. View Article : Google Scholar : PubMed/NCBI
|
|
12
|
Khan N, Jeffers M, Kumar S, Hackett C,
Boldog F, Khramtsov N, Qian X, Mills E, Berghs SC, Carey N, et al:
Determination of the class and isoform selectivity of
small-molecule histone deacetylase inhibitors. Biochem J.
409:581–589. 2008. View Article : Google Scholar : PubMed/NCBI
|
|
13
|
Boissinot M, Inman M, Hempshall A, James
SR, Gill JH, Selby P, Bowen DT, Grigg R and Cockerill PN: Induction
of differentiation and apoptosis in leukaemic cell lines by the
novel benzamide family histone deacetylase 2 and 3 inhibitor
MI-192. Leuk Res. 36:1304–1310. 2012. View Article : Google Scholar : PubMed/NCBI
|
|
14
|
Ronzoni S, Faretta M, Ballarini M, Pelicci
P and Minucci S: New method to detect histone acetylation levels by
flow cytometry. Cytometry A. 66:52–61. 2005. View Article : Google Scholar : PubMed/NCBI
|
|
15
|
Davies GF, Ross AR, Arnason TG, Juurlink
BH and Harkness TA: Troglitazone inhibits histone deacetylase
activity in breast cancer cells. Cancer Lett. 288:236–250. 2010.
View Article : Google Scholar : PubMed/NCBI
|
|
16
|
Takai N and Narahara H, Takai N and
Narahara H: Human endometrial and ovarian cancer cells: Histone
deacetylase inhibitors exhibit antiproliferative activity, potently
induce cell cycle arrest, and stimulate apoptosis. Curr Med Chem.
14:2548–2553. 2007. View Article : Google Scholar : PubMed/NCBI
|
|
17
|
Marquard L, Petersen KD, Persson M, Hoff
KD, Jensen PB and Sehested M: Monitoring the effect of belinostat
in solid tumors by H4 acetylation. APMIS. 116:382–392. 2008.
View Article : Google Scholar : PubMed/NCBI
|
|
18
|
Rigby L, Muscat A, Ashley D and Algar E:
Methods for the analysis of histone H3 and H4 acetylation in blood.
Epigenetics. 7:875–882. 2012. View Article : Google Scholar : PubMed/NCBI
|
|
19
|
Duong V, Bret C, Altucci L, Mai A,
Duraffourd C, Loubersac J, Harmand PO, Bonnet S, Valente S,
Maudelonde T, et al: Specific activity of class II histone
deacetylases in human breast cancer cells. Mol Cancer Res.
6:1908–1919. 2008. View Article : Google Scholar : PubMed/NCBI
|
|
20
|
Dejligbjerg M, Grauslund M, Litman T,
Collins L, Qian X, Jeffers M, Lichenstein H, Jensen PB and Sehested
M: Differential effects of class I isoform histone deacetylase
depletion and enzymatic inhibition by belinostat or valproic acid
in HeLa cells. Mol Cancer. 7:702008. View Article : Google Scholar : PubMed/NCBI
|
|
21
|
Baradari V, Huether A, Höpfner M, Schuppan
D and Scherübl H: Antiproliferative and proapoptotic effects of
histone deacetylase inhibitors on gastrointestinal neuroendocrine
tumor cells. Endocr Relat Cancer. 13:1237–1250. 2006. View Article : Google Scholar : PubMed/NCBI
|
|
22
|
Qian X, LaRochelle WJ, Ara G, Wu F,
Petersen KD, Thougaard A, Sehested M, Lichenstein HS and Jeffers M:
Activity of PXD101, a histone deacetylase inhibitor, in preclinical
ovarian cancer studies. Mol Cancer Ther. 5:2086–2095. 2006.
View Article : Google Scholar : PubMed/NCBI
|
|
23
|
Arts J, Angibaud P, Mariën A, Floren W,
Janssens B, King P, van Dun J, Janssen L, Geerts T, Tuman RW, et
al: R306465 is a novel potent inhibitor of class I histone
deacetylases with broad-spectrum antitumoral activity against solid
and haematological malignancies. Br J Cancer. 97:1344–1353. 2007.
View Article : Google Scholar : PubMed/NCBI
|
|
24
|
Strait KA, Dabbas B, Hammond EH, Warnick
CT, Iistrup SJ and Ford CD: Cell cycle blockade and differentiation
of ovarian cancer cells by the histone deacetylase inhibitor
trichostatin A are associated with changes in p21, Rb, and Id
proteins. Mol Cancer Ther. 1:1181–1190. 2002.PubMed/NCBI
|
|
25
|
Strait KA, Warnick CT, Ford CD, Dabbas B,
Hammond EH and Ilstrup SJ: Histone deacetylase inhibitors induce
G2-checkpoint arrest and apoptosis in cisplatinum-resistant ovarian
cancer cells associated with overexpression of the Bcl-2-related
protein Bad. Mol Cancer Ther. 4:603–611. 2005. View Article : Google Scholar : PubMed/NCBI
|
|
26
|
Liu T, Kuljaca S, Tee A and Marshall GM:
Histone deacetylase inhibitors: Multifunctional anticancer agents.
Cancer Treat Rev. 32:157–165. 2006. View Article : Google Scholar : PubMed/NCBI
|
|
27
|
Hong S, Derfoul A, Pereira-Mouries L and
Hall DJ: A novel domain in histone deacetylase 1 and 2 mediates
repression of cartilage-specific genes in human chondrocytes. FASEB
J. 23:3539–3552. 2009. View Article : Google Scholar : PubMed/NCBI
|
|
28
|
Chandrasekaran S, Peterson RE, Mani SK,
Addy B, Buchholz AL, Xu L, Thiyagarajan T, Kasiganesan H, Kern CB
and Menick DR: Histone deacetylases facilitate sodium/calcium
exchanger up-regulation in adult cardiomyocytes. FASEB J.
23:3851–3864. 2009. View Article : Google Scholar : PubMed/NCBI
|