Introduction
Pancreatic cancer (PC) is one of the most aggressive
solid tumours, and ranks as the fourth leading cause of
cancer-related death with a 5-year survival rate of only 7% in the
United States (1). In 2017, PC is
likely to overtake breast carcinoma as the third leading cause of
cancer-related death in European countries (2). Due to its ample ability to invade
surrounding tissue and early metastasis to distal organs, as well
as the natural resistance to chemoradiotherapy, PC is associated
with a poor patient prognosis. Therefore, it is urgent to elucidate
the biological mechanisms responsible for the tumourigenesis of
human PC and explore novel potential diagnostic biomarkers and
therapeutic targets.
Long non-coding RNAs (lncRNAs) are a class of
non-coding RNAs (ncRNAs) with a length of more than 200 nt. Instead
of coding for proteins, lncRNAs function as regulators of
epigenetic modifications, transcriptional and post-transcriptional
regulation. lncRNAs have been found to play vital roles in not only
physiological processes, but also tumour progression.
Maternally expressed gene 3 (MEG3) is a maternally
expressed imprinted gene approximately 1.6 kb nucleotides in length
(GenBank NR_002766) that is located on human chromosome 14q32.3. It
was first identified as a human homologue to mouse maternal
imprinting gene Glt2 (gene-trap locus 2) in 2000 (3). Without obvious open reading frames in
its sequence, MEG3 functions as a regulatory ncRNA instead of
coding for proteins. Conserved expression of MEG3 has been detected
in many human tissues and organs, especially in the brain and
pituitary gland (4). Meanwhile,
abnormal downregulation of MEG3 was reported in malignant
meningioma (5), pituitary tumours
(4), lung adenocarcinoma (6), colorectal carcinoma (7,8),
hepatocellular cancer (9),
urothelial carcinoma (10),
osteosarcoma (11) and adult T-cell
leukaemia (12). Furthermore, MEG3
was recognized as a tumour suppressor, and the significant absence
of expression of MEG3 caused by gene deletion, promoter
hypermethylation or hypermethylation of the intergenic
differentially methylated region could contribute to
tumourigenesis. Additionally, loss of MEG3 expression has been
verified to primarily promote cell proliferation in multiple
cancers via both p53-dependent and p53-independent pathways
(4,13). Zhao et al discovered that
cyclic AMP (cAMP) could induce MEG3 expression, which in turn
activated both the p53 and Rb pathways to modulate cell
proliferation (14). Moreover, Liu
et al found that MEG3 overexpression in lung adenocarcinoma
cells increased their chemosensitivity to cisplatin by inhibiting
cell proliferation and inducing apoptosis (6). On the other hand, Gordon et al
reported that downregulation of MEG3 could inhibit angiogenesis via
VEGF and Notch signaling to repress tumour metastasis (15). It has been confirmed that MEG3 is
associated with survival in many types of carcinoma. Tian et
al revealed that patients with low MEG3 expression in
osteosarcoma had a shorter overall survival (11); similar conclusions were drawn
regarding colorectal cancer (8) and
retinoblastoma (16). Chang et
al successfully delivered MEG3 RNA into hepatic cancer cells
using a designed vector based on MS2 virus-like particles (VLPs)
crosslinked with GE11 polypeptide and observed that cell
proliferation, colony formation and cell invasion were all
significantly suppressed (17).
To date, the relationship between MEG3 and human PC
has not been fully elucidated. The aim of this study was to reveal
whether MEG3 contributes to PC progression and to identify the
underlying regulatory mechanisms. MEG3 expression was evaluated in
both PC tissues and cell lines. The correlation of MEG3 expression
in PC tissues with various clinicopathological characteristics and
overall survival were also analysed. PC cells were transfected with
either siRNAs or lentiviral vectors to change the expression of
MEG3 in order to investigate the biological function of MEG3 on
cell proliferation, cell migration and invasion, EMT, CSC
properties and chemoresistance in vitro.
Materials and methods
Human tissue samples
Tissue samples from 25 PC patients who underwent
surgical resection of their tumours were obtained from Peking
University First Hospital. Both tumours and adjacent non-cancerous
tissues were frozen in liquid nitrogen and stored at −80°C until
further use. This study was approved by the Ethics Committee of
Peking University First Hospital, and written informed consent was
provided by each patient.
Laser captured microdissection
Given the tissue heterogeneity of PC, it was
necessary to isolate pure malignant cells from heterogeneous tissue
sections via laser capture microdissection (LCM) before further
examination. The tissue samples were processed into frozen sections
using PEN glass microscope slides specifically designed for LCM.
After the target cells were stained with haematoxylin and eosin
(H&E), they were recognized and labelled by computer. Then, a
Leica LMD7000 instrument (Leica, Wetzlar, Germany) was used to
separate the malignant pancreatic ducts from the frozen
sections.
Cell culture
The human PC cell lines SW 1990, COLO357, MIA
PaCa-2, T3M4, AsPC-1, BxPC-3, CAPAN-1 and PANC-1, as well as human
pancreatic normal epithelial cell line hTERT-HPNE, were maintained
in our laboratory. MIA PaCa-2, COLO357 and PANC-1 cells were
cultured in Dulbecco's modified Eagle's medium (DMEM, Gibco,
Waltham, MA, USA), and T3M4, AsPC-1, BxPC-3 and CAPAN-1 cells were
cultured in RPMI-1640 medium (Gibco) at 37°C in a humidified
atmosphere containing 5% CO2. Both types of media were
supplemented with 10% fetal bovine serum (FBS, Gibco), 100 U/ml
penicillin and 100 µg/ml streptomycin. SW 1990 cells were cultured
in Leibovitz's L-15 medium supplemented with 10% FBS and maintained
at 100% atmospheric air. hTERT-HPNE cells was cultured in 75% DMEM
without glucose and 25% Medium M3 Base (InCell Corp., San Antonio,
TX, USA) supplemented with 5% FBS, 5.5 mM D-glucose (1 g/l), 10
ng/ml human recombinant EGF and 750 ng/ml puromycin.
RNA extraction and real-time
quantitative PCR
Total RNA was extracted from microdissected PC
tissues using an RNeasy Micro kit (Qiagen, Hilden, Germany) and
from PC cell lines using TRIzol reagent (Invitrogen, Carlsbad, CA,
USA) according to the respective manufacturers' protocols. The
levels of MEG3, E-cadherin, N-cadherin, Snail, Vimentin, Nanog and
Oct4 expression were measured using real-time quantitative PCR
(qPCR). Eukaryotic 18S rRNA (18S) was adopted as the endogenous
control for the human tissues, and glyceraldehyde-3-phosphate
dehydrogenase (GAPDH) was used for the cells. MEG3 primers were
purchased from RiboBio (Guangzhou, China). The primers for the
other detected genes were as follows: 5′-GCCTCCTGAAAAGAGAGTGGAAG-3′
(sense) and 5′-TGGCAGTGTCTCTCCAAATCCG-3′ (antisense) for
E-cadherin, 5′-TTTGATGGAGGTCTCCTAACACC-3′ (sense) and
5′-ACGTTTAACACGTTGGAAATGTG-3′ (antisense) for N-cadherin,
5′-AGGCAAAGCAGGAGTCCACTGA-3′ (sense) and
5′-ATCTGGCGTTCCAGGGACTCAT-3′ (antisense) for Vimentin,
5′-TGCCCTCAAGATGCACATCCGA-3′ (sense) and
5′-GGGACAGGAGAAGGGCTTCTC-3′ (antisense) for Snail,
5′-TCCTCCTCTTCCTCTATACTAAC-3′ (sense) and 5′-CCCACAATCACAGGCATAG-3′
(antisense) for Nanog, 5′-CTTGAATCCCGAATGGAAAGGG-3′ (sense) and
5′-GTGTATATCCCAGGGTGATCCTC-3′ (antisense) for Oct4,
5′-GTAACCCGTTGAACCCCATT-3′ (sense) and 5′-CCATCCAATCGGTAGTAGCG-3′
(antisense) for 18S, 5′-GTATTGGGCGCCTGGTCACC-3′ (sense) and
5′-CGCTCCTGGAAGATGGTGATGG-3′ (antisense) for GAPDH. Each sample was
examined in triplicate. All the data were analysed using the
comparative threshold cycle (CT) (2−∆∆CT) method.
siRNA transfection and
lentiviral-mediated gene overexpression
To knock down MEG3 expression, we transfected PANC-1
cells (which expressed relatively high levels of MEG3) with three
different interfering siRNAs (RiboBio): siMEG3-1,
5′GGCCUUCCUGAACACCUUADTDT3′ and 3′DTDTCCGGAAGGACUUGUGGAAU5′;
siMEG3-2, 5′GACGUGACAAGCAGGACAUDTDT3′ and
3′DTDTCUGCACUGUUCGUCCUGUA5′; and siMEG3-3,
5′CCUCUAGCUUGGAAAUGAADTDT3′ and 3′DTDTGGAGAUCGAACCUUUACUU5′. A 30
nM mixture of three siRNAs was used to avoid off-target effect and
enhance the knockdown efficiency. A negative control siRNA (NC) was
also purchased from the same company. These siRNAs were transfected
using Lipofectamine 2000 according to the manufacturer's
protocol.
The full-length MEG3 sequence was subcloned into a
lentivirus vector designed by GeneChem (Shanghai, China). MIA
PaCa-2 and T3M4 cells (which exhibited relatively low levels of
MEG3) were stably transfected with lentivirus containing either
Lenti-MEG3-GFP or empty vector (Lenti-GFP). Transfection
efficiencies were verified using qPCR.
Cell proliferation assay
The CCK-8, colony formation and EdU incorporation
assays were adopted to evaluate the effect of MEG3 on cell
proliferation regulation.
For the CCK-8 assay, transfected cells were plated
in 96-well plates at a density of 3,000-5,000 cells/well. At 24, 48
and 72 h after plating, the cells were incubated with WST-8 reagent
(10 µl per well) for 2 h at 37°C in the dark, and the absorbance at
450 nm was then measured in each well using a microplate reader
(Bio-Rad Laboratories, Hercules, CA, USA) to determine cell
viability.
For the colony formation assay, transfected cells
were plated into 6-well plates at a density of 200 cells/well.
After 2–3 weeks, representative colonies were imaged, and the
number of colonies was carefully counted.
For the EdU incorporation assay, transfected cells
were plated into 96-well plates at a density of 3,000 cells/well.
At 24 h after plating, EdU reagent from an EdU
Apollo®567 In Vitro Imaging kit (RiboBio) was
added to the medium following the manufacturer's instructions and
incorporated into cells in the DNA synthesis phase (S phase) of the
cell cycle. Ten randomly chosen visual fields were observed, and
the percentage of EdU-incorporated cells was calculated. Each
experiment was performed in triplicate.
Boyden chamber assay
Cell migration was measured using uncoated Boyden
chambers, and cell invasion was assessed using Matrigel-coated
chambers. Boyden chambers (8-µm pore size, BD Biosciences, San
Jose, CA, USA) were purchased from Corning Inc. (Corning, NY, USA).
For the migration assays, 15,000 transfected cells suspended in
serum-free medium were placed on the non-coated membrane in the top
chamber. For the invasion assay, 30,000 transduced cells suspended
in serum-free medium were placed in the top chamber of inserts
previously coated with a 1:7 dilution of BD Matrigel matrix. Medium
supplemented with 10% FBS was added to the lower chambers and used
as a chemoattractant. After 36 to 48 h, nonmigratory cells were
removed from the upper chambers using a cotton swab. The cells on
the lower surface of the insert were fixed with methanol and
stained with DAPI. The cell numbers were determined by counting the
penetrating cells under an inverted fluorescence microscope at ×200
magnification in 5 random fields per well. Each experiment was
performed in triplicate.
Sphere formation assay
As anchorage-independent growth is a common
characteristic of the CSC phenotype, the sphere-forming ability of
the cells was evaluated by performing a sphere-forming assay using
ultralow attachment culture plates (Corning Inc.) in a serum-free
floating culture system. Single cell suspensions were seeded in
6-well ultralow attachment plates at a density of 10,000 cells per
well in serum-free DMEM:F12 medium (Gibco) supplemented with 20
ng/ml EGF (PeproTech, Rocky Hill, NJ, USA), 100 ng/ml bFGF
(PeproTech), 1:50 B27 supplement (Gibco), 100 U/ml penicillin and
100 µg/ml streptomycin. After 14 days, the formed spheres, which
were typically >75 mm in diameter, were counted using an
inverted fluorescence microscope.
Flow cytometric analysis
PC cells that express CD24, CD44 and
epithelial-specific antigen (ESA) are identified as cancer stem
cells (CSCs) and only compose 0.2–0.8% of the tumour. CSCs possess
self-renewal and differentiation properties and are more
tumourigenic than traditional cancer cells (18). To detect CSCs, the following
antibodies were used: anti-CD24-APC, anti-CD44-PE,
anti-ESA-PE-Vio770, IgG1-PE, IgG1-APC and IgG1-PE-Vio770 (Miltenyi
Biotec, Germany). After the transfected cells were dissociated with
trypsin and washed with PBS, they were incubated with the above
mentioned antibodies according to the manufacturer's instructions
and measured using flow cytometry (FACSCalibur, BD Biosciences).
All the data were analysed with BD FACSDiva software.
Chemosensitivity assay
A total of 3,000 transfected cells were seeded in
96-well plates. At 24 h after plating, different doses of
gemcitabine (Eli Lilly, Indianapolis, IN, USA) were added to the
plates depending on the cell type, and the cells were then cultured
for another 72 h. Cell viability was determined using a CCK-8 kit,
and the absorbance at 450 nm was measured using a microplate
reader. The cell inhibition rate was calculated using the following
formula: Inhibition rate = (1 - absorbance of treated
cells/absorbance of control cells) × 100%. Each experiment was
performed in triplicate.
Western blot analysis
Total proteins were extracted from transfected cells
using RIPA lysis. The protein concentration was measured using the
BCA assay (Thermo Fisher Scientific, Inc., Waltham, MA, USA), and
proteins (20 µg/lane) were separated on a 10% gel using SDS-PAGE
and transferred to PVDF membranes. After the membranes were then
blocked in 5% fat-free milk in TBST buffer (0.1% Tween-20) for 2 h
at room temperature, they were incubated with primary antibodies
against E-cadherin (1:2,000, Cell Signaling Technology, Danvers,
MA, USA), N-cadherin (1:2,000, Cell Signaling Technology), Vimentin
(1:2,000, Cell Signaling Technology), Snail (1:2,000, Cell
Signaling Technology), proliferating cell nuclear antigen (PCNA)
(1:500, Santa Cruz Biotechnology, Dallas, TX, USA), and β-actin
(1:40,000, MBL, USA) at 4°C overnight followed by incubation with
HRP-conjugated secondary antibodies (Jackson Laboratory, Bar
Harbor, ME, USA) at 4°C for 1 h. Protein bands were detected using
chemiluminescence (Millipore, Billerica, MA, USA) and exposure to
X-ray film.
Statistical analysis
All the data are expressed as the mean ± standard
deviation (SD). Differences between groups were determined using
the Student's t-test. Kaplan-Meier analysis was applied to evaluate
the prognostic significance of MEG3 expression regarding patient
survival. The data from the clinicopathological characteristics
analysis was calculated using the Fisher exact probability test.
All statistical analyses were performed using SPSS 13.0 software
(SPSS Inc. Chicago, IL, USA). A P-value <0.05 was considered to
indicate a statistically significant difference.
Results
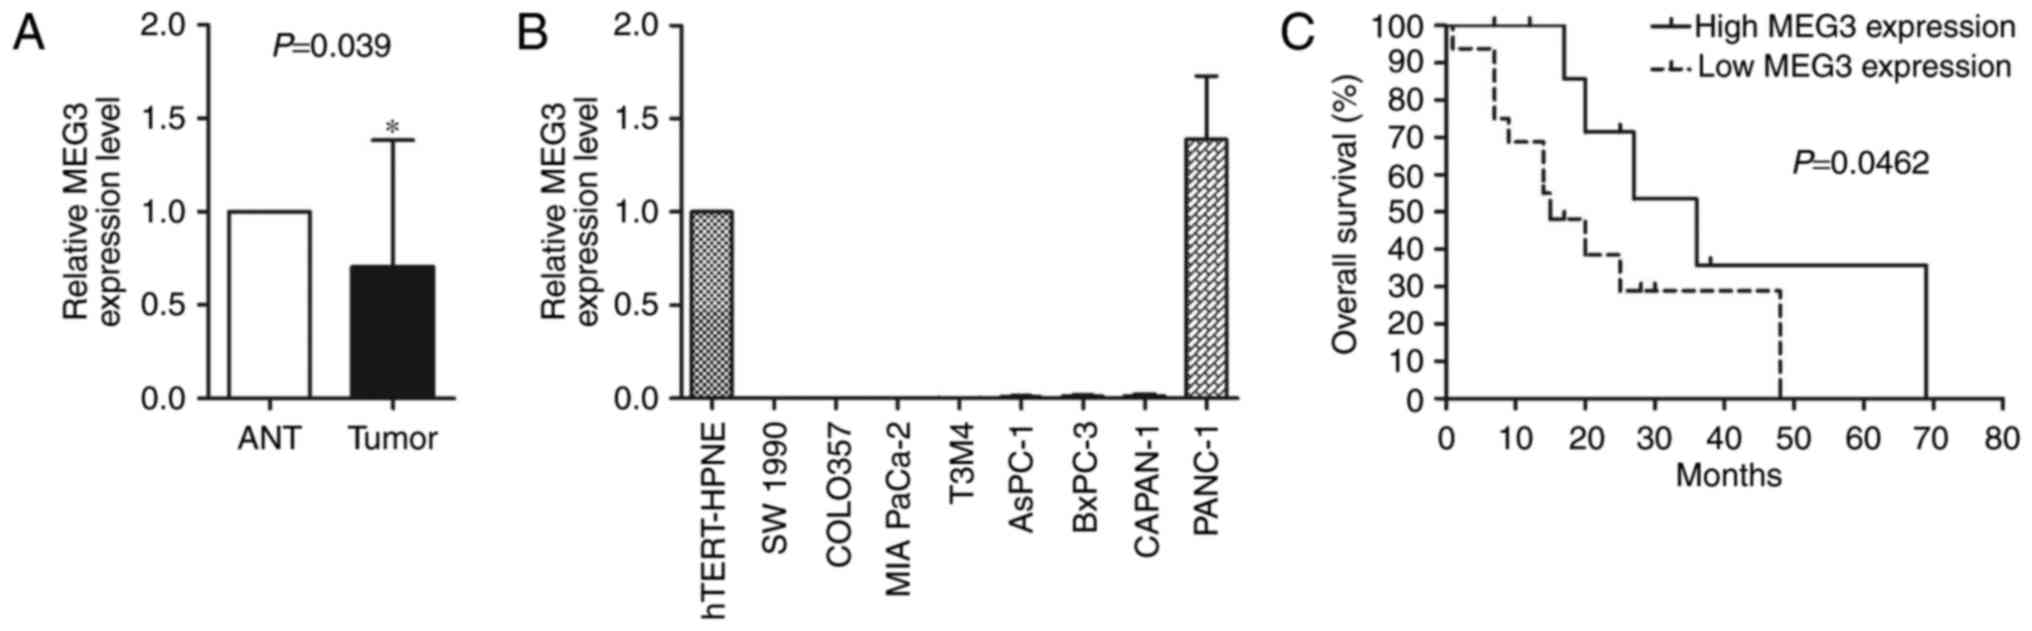
Decreased expression level of MEG3 is
detected in both PC tissues and cell lines and is correlated with
worse prognosis
We isolated pure malignant pancreatic ducts from
frozen PC sections using the LCM technique. Total RNA was
successfully extracted from 25 microdissected tissues, and MEG3
expression was examined using qPCR. Compared to MEG3 expression in
the adjacent normal tissues (ANT), MEG3 expression was
significantly decreased in 64% of the PC tumours (16/25) (Fig. 1A). Absence of expression of MEG3 was
observed in most of the PC cell lines when compared with that in
the hTERT-HPNE cells, except for PANC-1 cells (Fig. 1B). Although the statistical analysis
failed to identify any significant correlation between the
clinicopathological characteristics and the MEG3 expression level
(Table I), Kaplan-Meier analysis
revealed that patients with relatively elevated MEG3 expression
exhibited a longer overall survival time (P<0.05) (Fig. 1C).
 | Table I.Relationship between MEG3 expression
level and the clinicopathological characteristics of the PC
cases. |
Table I.
Relationship between MEG3 expression
level and the clinicopathological characteristics of the PC
cases.
|
|
| MEG3 expression
level |
|
|---|
|
|
|
|
|
|---|
| Characteristics | Number of cases
(n=25) | Low (n=16) (%) | High (n=9) (%) | P-value |
|---|
| Age (years) |
|
|
| 0.243 |
|
<60 | 12 | 8
(50) | 4 (44.44) |
|
| ≥60 | 13 | 8
(50) | 5 (55.56) |
|
| Sex |
|
|
| 0.560 |
| Male | 11 | 7
(43.75) | 4 (44.44) |
|
|
Female | 14 | 9
(56.25) | 5 (55.56) |
|
| Tumour size |
|
|
| 0.407 |
| <4
cm | 16 | 11 (68.75) | 5 (55.56) |
|
| ≥4
cm | 9 | 5
(31.25) | 4 (44.44) |
|
| Location |
|
|
| 0.626 |
| Head of
pancreas | 17 | 11 (68.75) | 6 (66.67) |
|
| Body and
tail of pancreas | 8 | 5
(31.25) | 3 (33.33) |
|
| Histological
grade |
|
|
| 0.174 |
| Well and
moderate | 7 | 6
(37.5) | 1 (11.11) |
|
|
Poor | 18 | 10 (62.5) | 8 (88.89) |
|
| Primary tumour |
|
|
| 0.542 |
| T1,
T2 | 4 | 3
(18.75) | 1 (11.11) |
|
| T3,
T4 | 21 | 13 (81.25) | 8 (88.89) |
|
| Lymph node |
|
|
| 0.626 |
| N0 | 17 | 11 (68.75) | 6 (66.67) |
|
| N1 | 8 | 5
(31.25) | 3 (33.33) |
|
| Venous
invasion |
|
|
| 0.593 |
|
Absent | 16 | 10 (37.5) | 6 (66.67) |
|
|
Present | 9 | 6
(62.5) | 3 (33.33) |
|
| Neural
invasion |
|
|
| 0.144 |
|
Absent | 4 | 4
(25) | 0 (0) |
|
|
Present | 21 | 12 (75) | 9 (100) |
|
| CA19-9 |
|
|
| 0.230 |
| <37
U/ml | 5 | 2
(12.5) | 3 (33.33) |
|
| ≥37
U/ml | 20 | 14 (87.5) | 6 (66.67) |
|
| CEA |
|
|
| 0.593 |
| <5
ng/ml | 16 | 10 (62.5) | 6 (66.67) |
|
| ≥5
ng/ml | 9 | 6
(37.5) | 3 (33.33) |
|
| CA-242 |
|
|
| 0.098 |
| <5
ng/ml | 11 | 5
(31.25) | 6 (66.67) |
|
| ≥5
ng/ml | 14 | 11 (68.75) | 3 (33.33) |
|
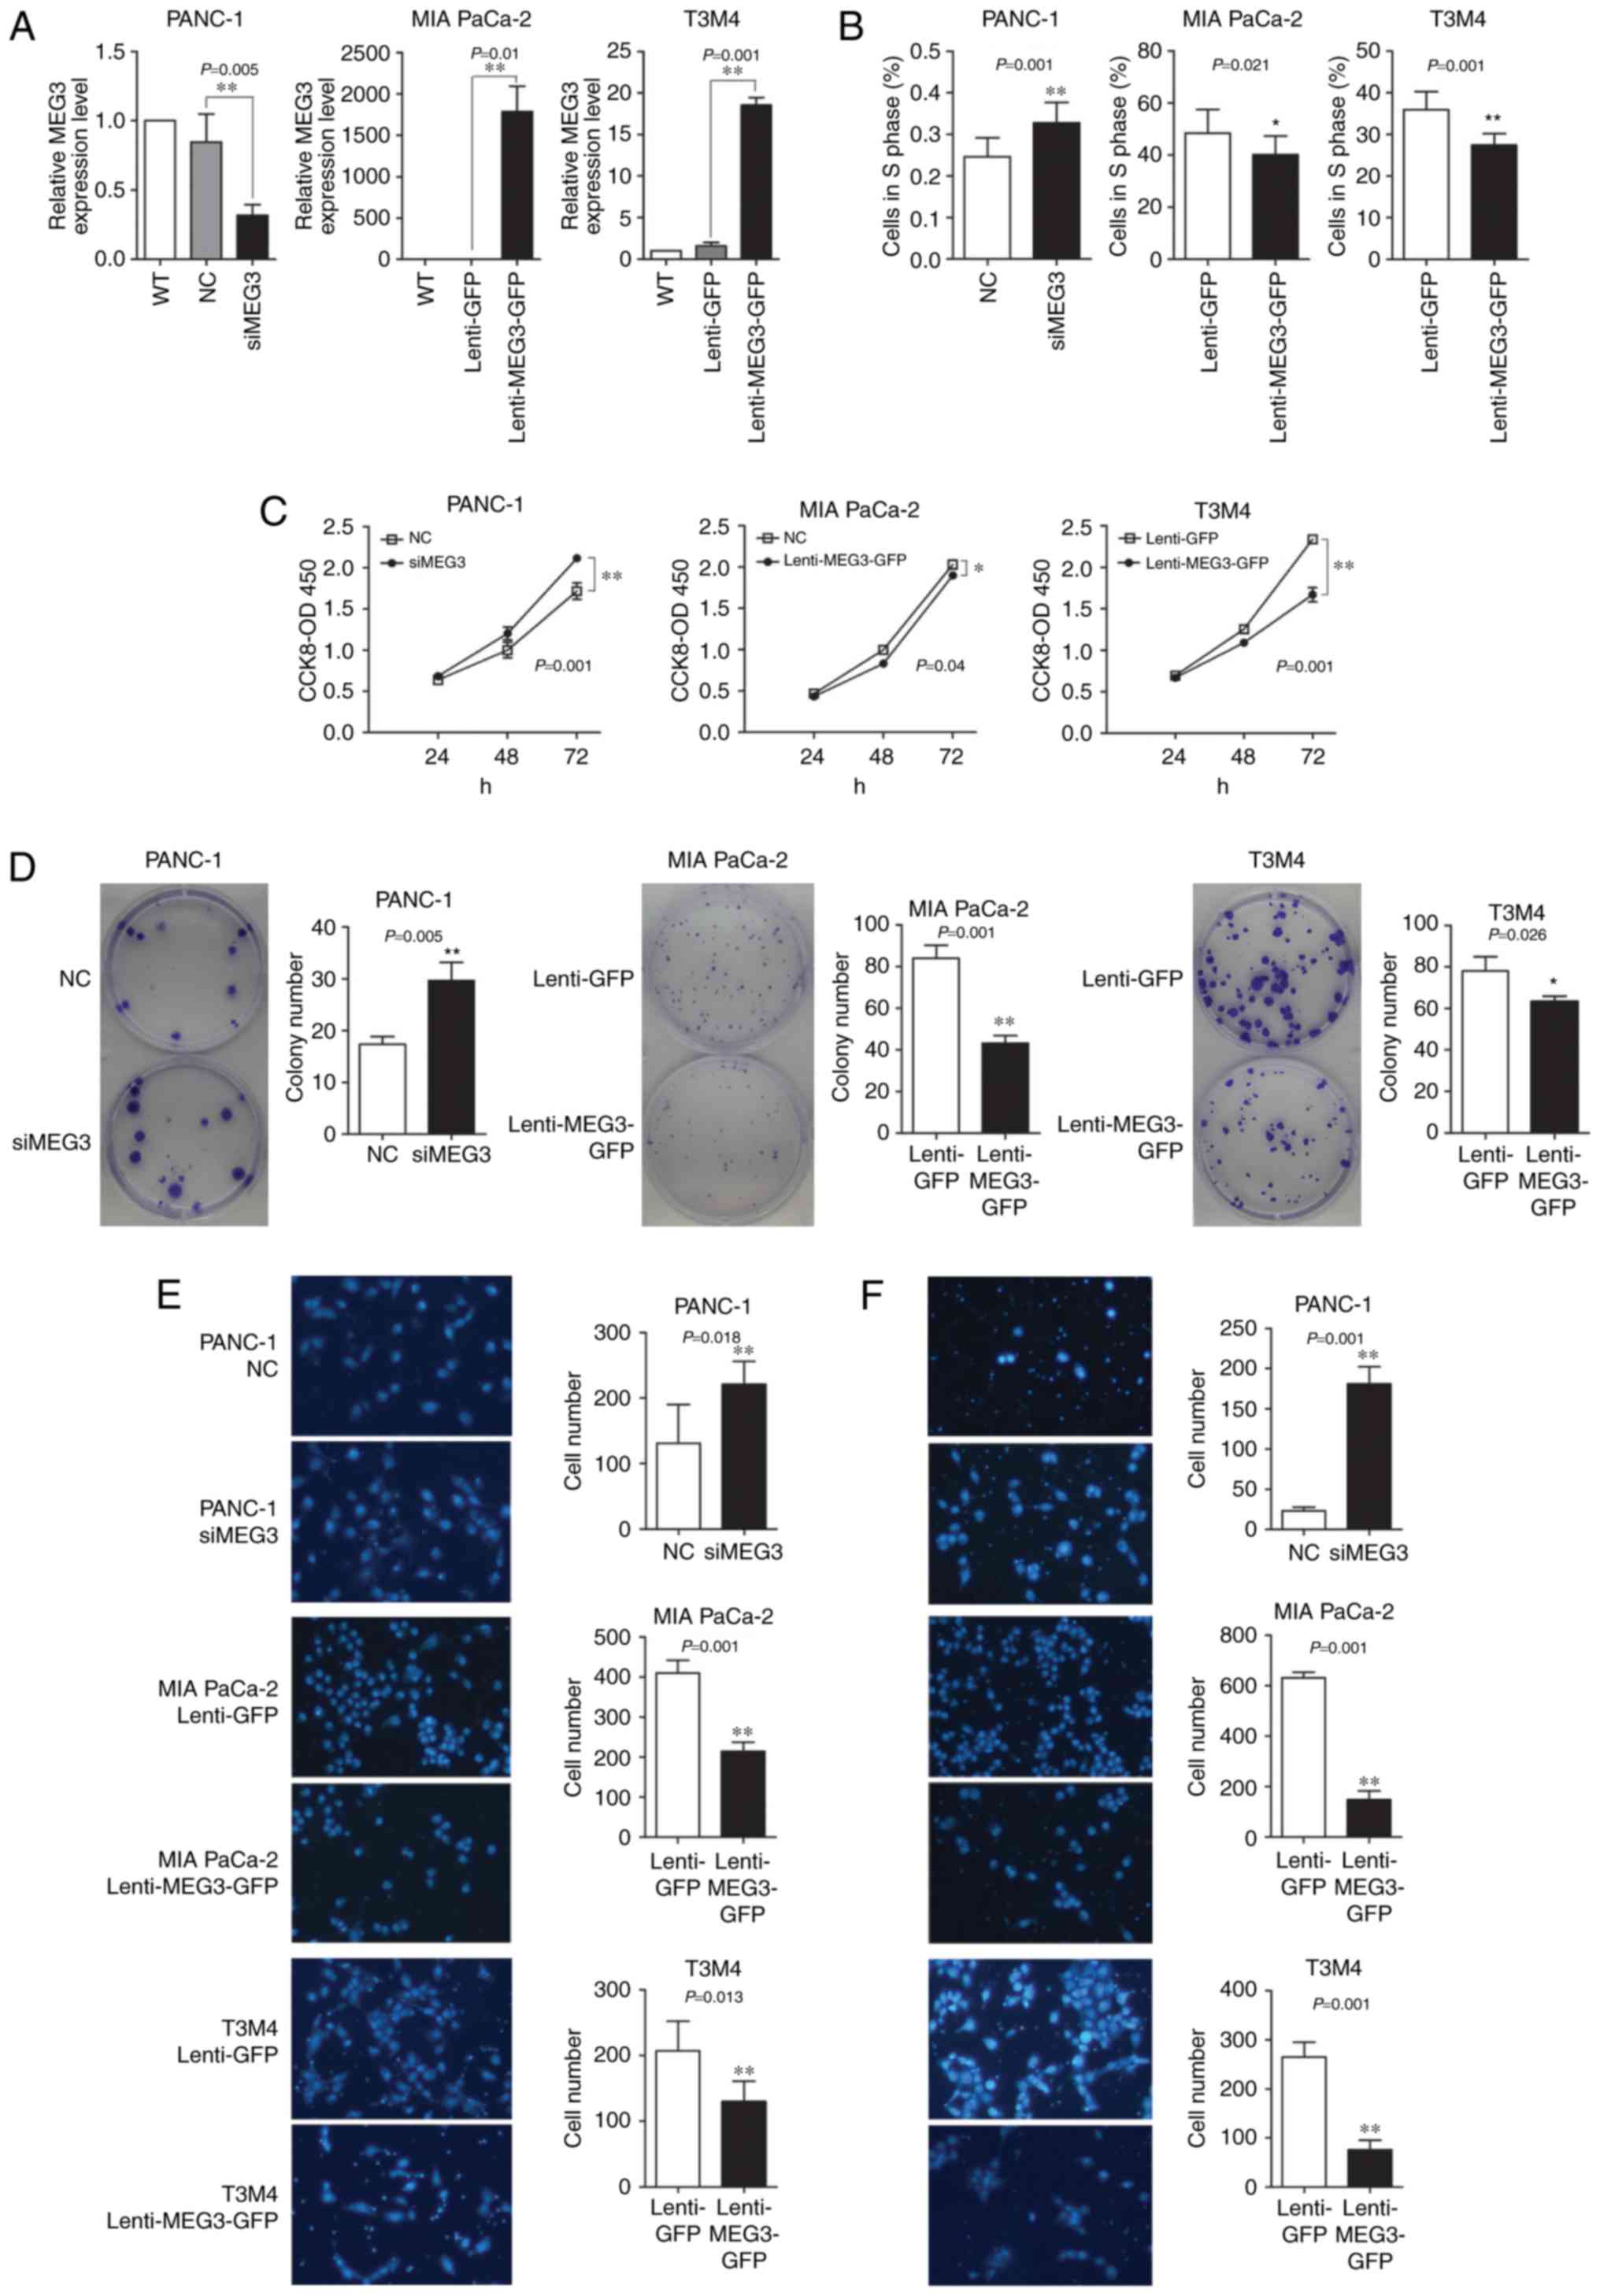
Effect of MEG3 on cell proliferation,
migration and invasion in PC cells
To investigate the functional role of MEG3 in the
tumour progression of PC, we established three transfected cell
lines in which MEG3 was differentially expressed. PANC-1 cells,
which naturally express relatively high levels of MEG3, were
transfected with siRNAs to knock down MEG3 expression; MIA PaCa-2
and T3M4 cells were stably transfected with a lentivirus vector
that overexpresses MEG3. qPCR confirmed that transfection of the
siMEG3 mixture reduced the MEG3 mRNA levels by 80%, whereas cells
with the Lenti-MEG3-GFP vector exhibited stably increased MEG3 mRNA
levels by two orders of magnitude compared to the levels in the
control group (Fig. 2A).
The CCK-8 assay suggested that knockdown of MEG3
expression in PANC-1 cells promoted cell growth, especially at 72 h
after transfection. Conversely, ectopic expression of MEG3 in MIA
PaCa-2 and T3M4 cells significantly decreased cell viability and
growth (Fig. 2C). The colony
formation ability of plated transfected cells was also affected by
the levels of MEG3 expression. The number of colonies formed by
PANC-1 cells (which were transfected with siMEG3s) was increased;
however, the number and size of the colonies formed by MIA PaCa-2
and T3M4 cells transfected with Lenti-MEG3-GFP decreased by nearly
50% (Fig. 2D). The EdU
incorporation assay showed that the knockdown of MEG3 in PANC-1
cells upregulated the percentage of cells in the S phase by 10%,
whereas overexpression of this lncRNA downregulated the percentage
of MIA PaCa-2 and T3M4 cells in S phase (Fig. 2B).
The influence of MEG3 on the migratory and invasive
abilities of PC cells was examined using the Boyden chamber assay.
MEG3 knockdown in PANC-1 cells significantly enhanced cell
migration and invasion to a large extent, especially the invasive
ability. However, ectopic overexpression of MEG3 in MIA PaCa-2 and
T3M4 elicited an opposing effect (Fig.
2E and F).
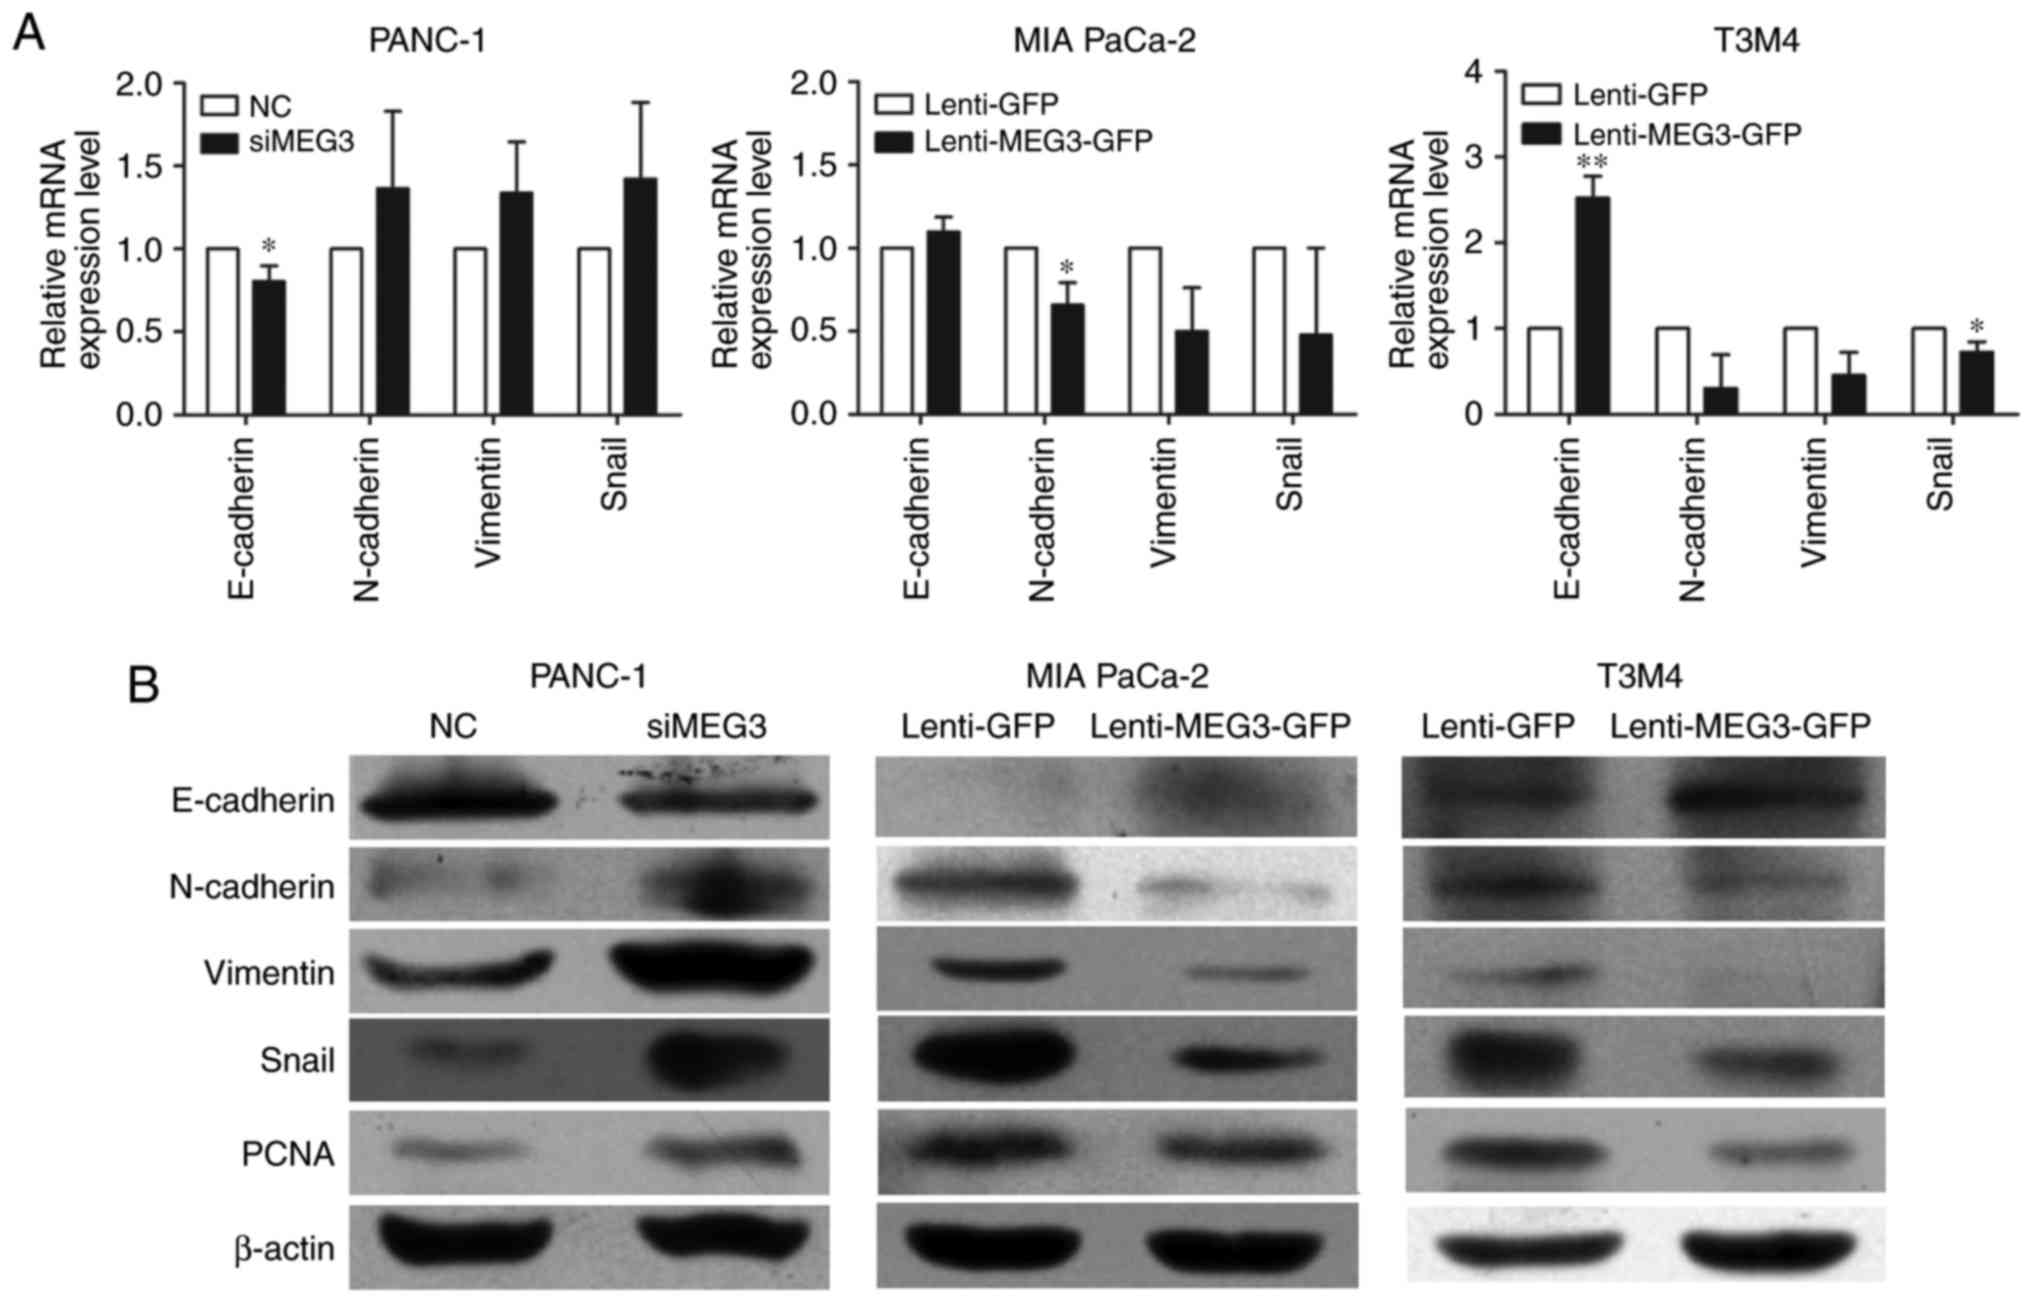
Effect of MEG3 on
epithelial-mesenchymal transition in PC cells
To elucidate the mechanisms by which MEG3
overexpression suppresses cell migration and invasion, we examined
the mRNA (Fig. 3A) and protein
levels (Fig. 3B) of several key
genes involved in EMT. The qPCR and western blot results
consistently showed that both the transcription and translation of
genes involved in EMT were affected when MEG3 expression was
altered. Knockdown of MEG3 in PANC-1 cells decreased E-cadherin
expression while inducing N-cadherin, Vimentin and Snail
expression. Inversely, inhibition of EMT process was observed in
MIA PaCa-2 and T3M4 cells with ectopic overexpression of MEG3.
Meanwhile, we examined the protein levels of PCNA, which reflects
the proliferative state of the cells, and found that PCNA
expression was suppressed in cells with MEG3 overexpression.
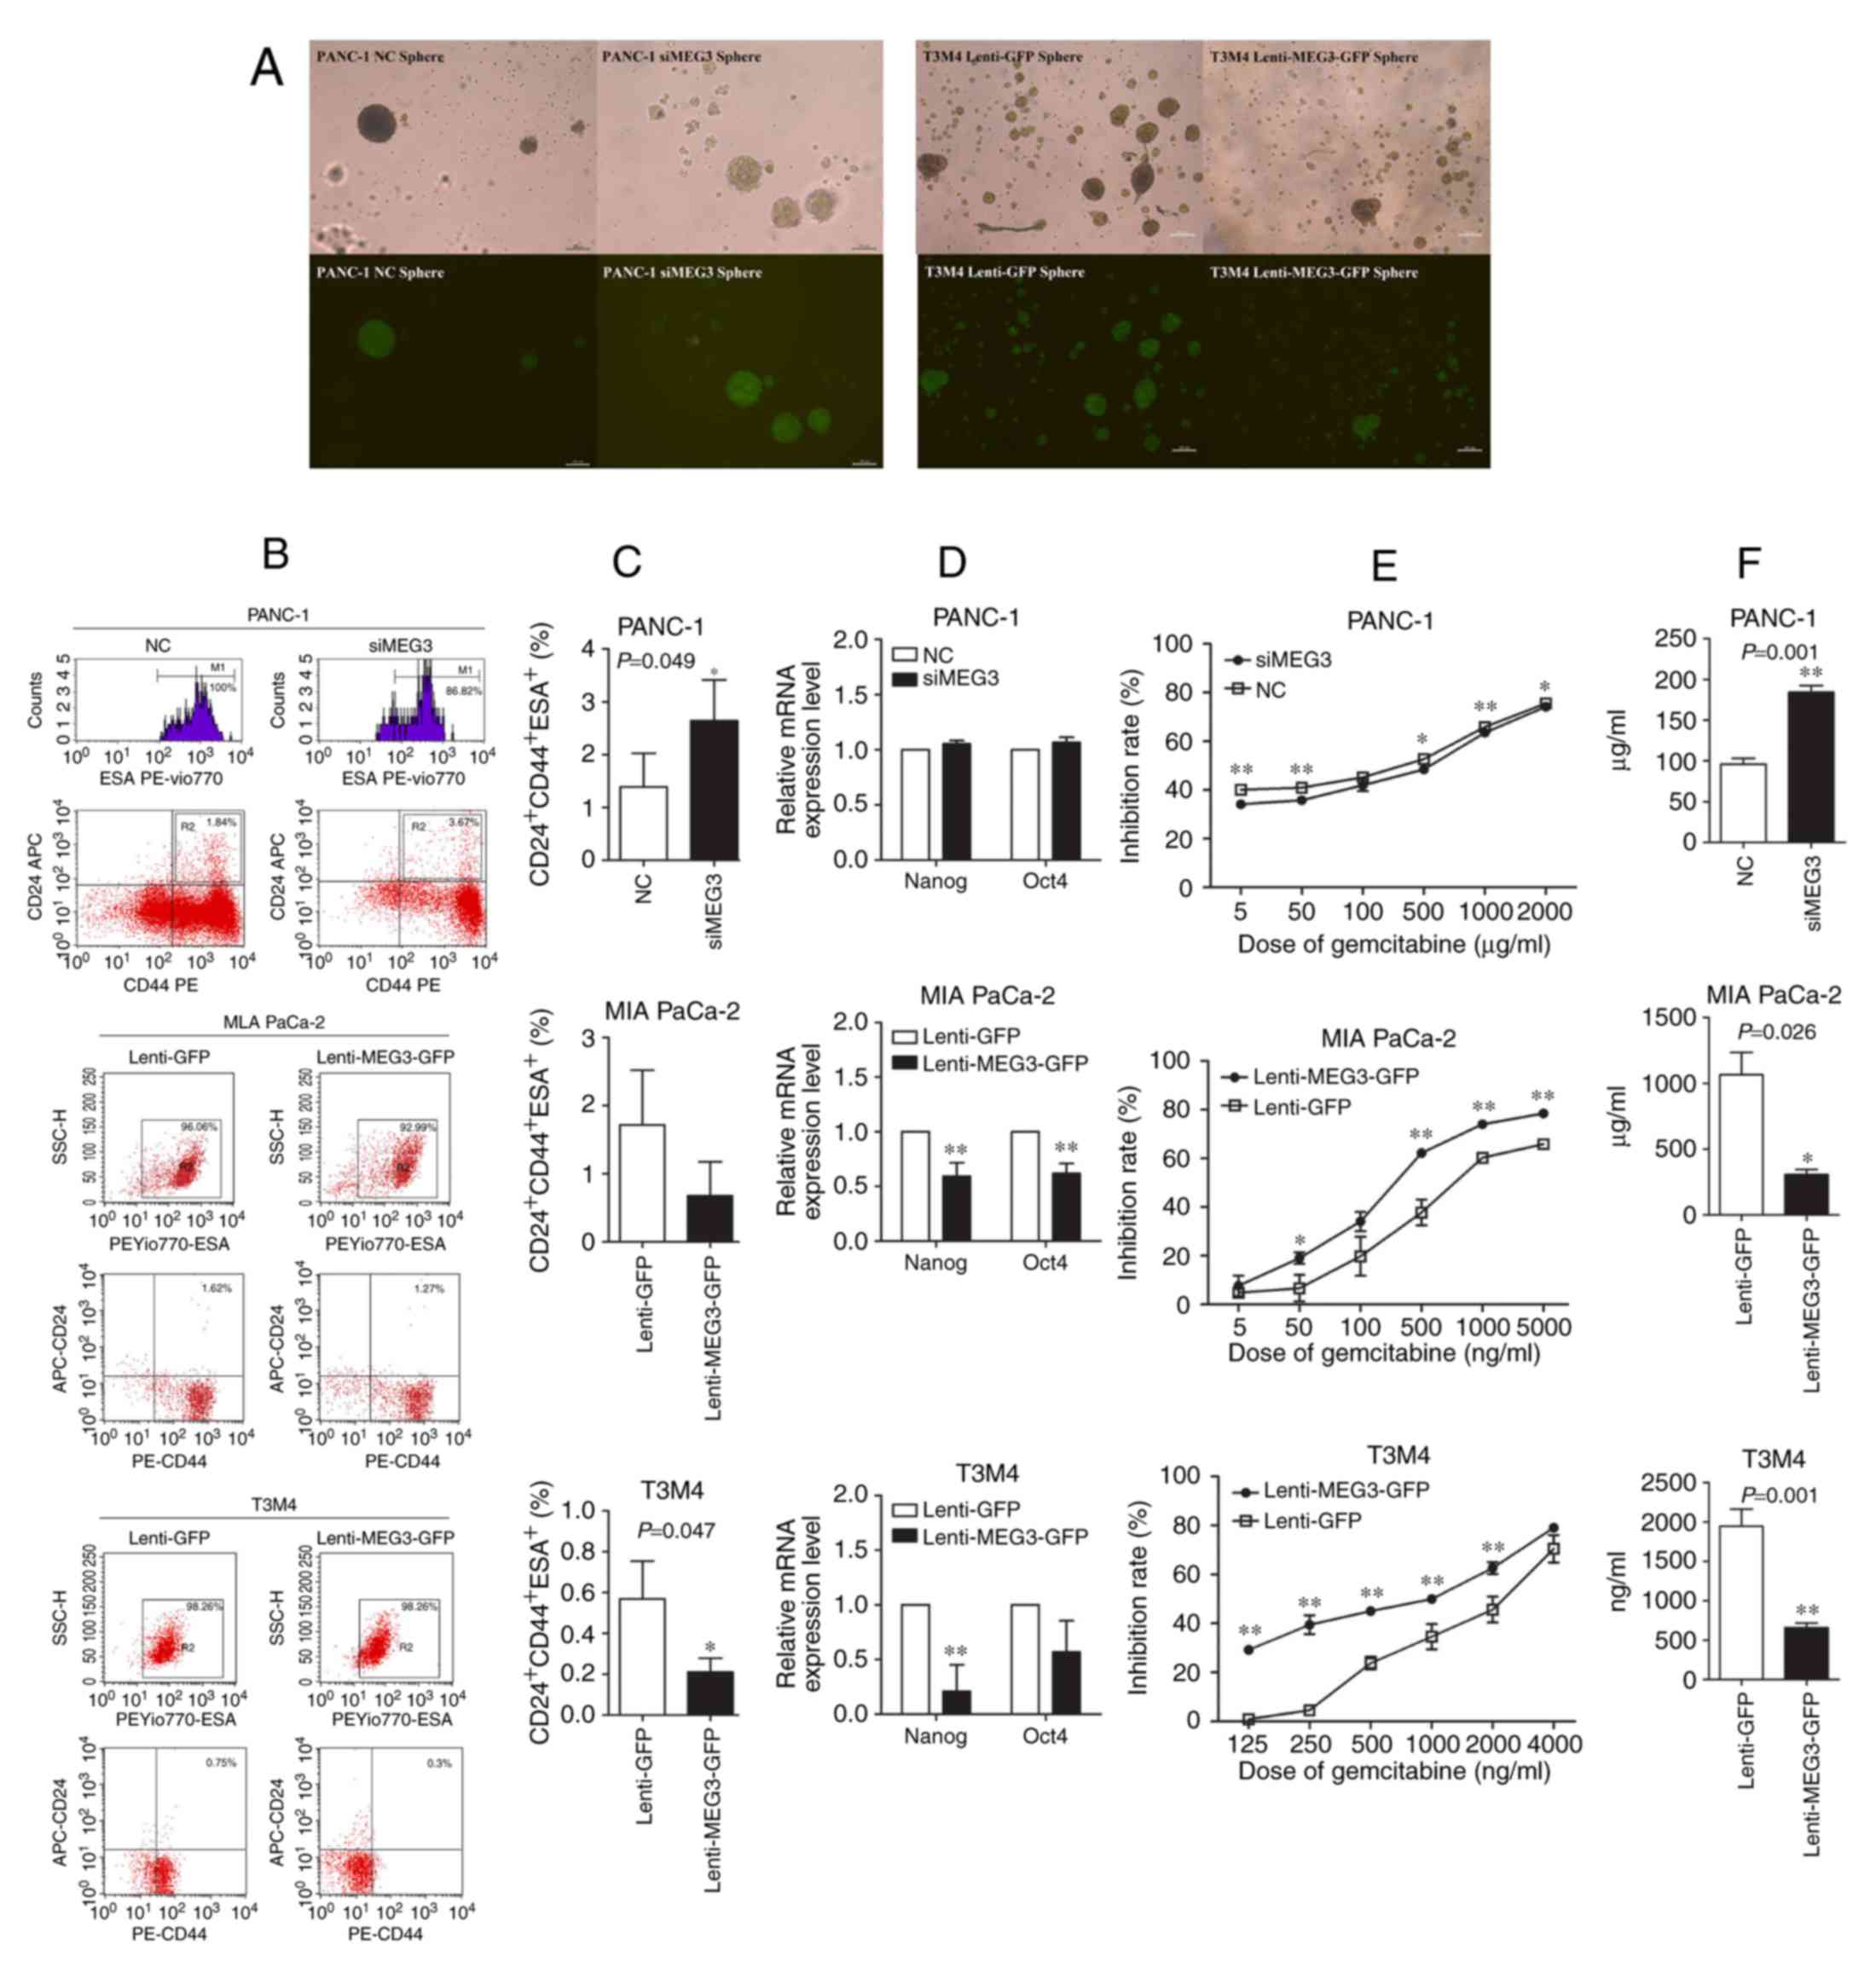
Effects of MEG3 on the sphere-forming
ability, the CSC properties and the chemosensitivity in PC
cells
As the MIA PaCa-2 cell line showed no ability to
form stem cell spheres, the sphere-forming assay was performed
using transfected PANC-1 and T3M4 cells. PANC-1 cells with MEG3
knockdown exhibited an increased number and size of spheres when
compared to the control cells, whereas ectopic expression of MEG3
in T3M4 cells decreased their sphere-forming ability (Fig. 4A). CSCs expressing CD24, CD44 and
ESA were detected in the three transfected cell lines using flow
cytometry, and the results were concordant with those of the
sphere-forming assay (Fig. 4B). The
percentage of CD24+CD44+ESA+ CSCs
in PANC-1 cells was significantly increased from 1.39±0.64% to
2.64±0.77%, when MEG3 was downregulated (P=0.049). And the opposite
effects were shown in both MIA PaCa-2 and T3M4 cells overexpressing
MEG3 (Fig. 4C). Nanog and Oct4 have
been identified as mature markers of CSCs, and the qPCR results
showed that downregulation of MEG3 in PANC-1 cells slightly
increased the mRNA expression of Nanog and Oct4, whereas
upregulation of MEG3 significantly decreased these genes in MIA
PaCa-2 and T3M4 cells (Fig. 4D).
Gemcitabine is a first-line chemotherapeutic agent used in PC. As
shown in Fig. 4E, upregulation of
MEG3 enhanced the chemosensitivity of MIA PaCa-2 and T3M4 cells to
gemcitabine, whereas downregulation of MEG3 increased the
chemoresistance of PANC-1 cells. In the transduced cell lines, the
IC50 of gemcitabine decreased from 1,065.33±170.85 ng/ml
to 307.66±39.37 ng/ml in MIA PaCa-2 cells and from 1,946.05±217.42
ng/ml to 660.57±57.38 ng/ml in T3M4 cells, but increased from
95.87±7.20 µg/ml to 184.19±8.13 µg/ml in PANC-1 cells (P<0.05)
(Fig. 4F).
Discussion
Accumulating evidence has identified MEG3 as a
tumour suppressor in various types of cancers. However, the
relationship between MEG3 and human PC remains poorly understood.
In this study, we focused on identifying the functional role of
MEG3 in PC and provided comprehensive data that the loss of MEG3
expression in PC could promote tumourigenesis with respect to cell
proliferation, EMT, CSC properties and chemoresistance.
Consistent with results in other malignancies, the
significantly decreased level of MEG3 expression was observed in
microdissected PC samples and cancer cell lines compared to normal
control tissues and cells. Although we failed to find a significant
correlation between MEG3 expression and the clinicopathological
features in the PC cases in this study (likely because of the small
sample size), our data suggested that the MEG3 expression level was
significantly associated with the overall survival rate in PC
patients. Compared with those with a relatively high level of MEG3,
the patients with a low level of MEG3 seemed to be correlated with
a worse outcome. This means that MEG3 may act as a tumour
suppressor and predict prognosis in human PC, and the specific
mechanisms of MEG3 in PC cells merit further investigation.
The tumour suppressor property of MEG3 has been
demonstrated in many malignancies, and the corresponding mechanisms
mainly involve the modulation of cell proliferation. In addition to
the high proliferation activity, early distant metastasis and
chemoresistance also contribute to the poor prognosis of PC
patients. However, less is known concerning the effects of MEG3 on
tumour metastasis and chemoresistance. In the present study, we
investigated the biological functions of MEG3 on cell
proliferation, cell migration and invasion, EMT, CSC properties and
chemoresistance in PC cells. In addition to verifying the previous
reports that MEG3 has a significantly negative correlation with the
proliferation modulation, our results also indicated that decreased
expression of MEG3 could promote PC cell migration and invasion, as
well as chemoresistance by regulating the EMT process and CSC
properties.
The EMT process has been considered as a hallmark of
the metastasis cascade of malignancies. During the process of EMT,
immobile epithelial cells are transformed into motile mesenchymal
cells and then gain the ability to invade through the stroma.
Meanwhile, cancer cells undergoing EMT often acquire stemness
characteristics, which exhibit the properties of dissemination and
self-renewal required for the initiation of a secondary tumour
(19). The CSCs, which account for
a very small proportion of the correspond cancer cells, are
naturally resistant to most chemotherapeutic agents. Moreover,
numerous studies suggest that chemoresistant cancer cells exhibit a
mesenchymal phenotype (20,21). Izumiya et al reported that
chemoresistant PC cells present CSC traits, as these cells initiate
sphere formation, express stem cell markers and respond to EMT
stimulation (22). Taken together,
all these data indicate that EMT, CSC properties and
chemoresistance are interrelated and inextricably linked to
tumourigenesis. Our results revealed that the loss of MEG3
expression in PC cells might be involved in the initiation of
chemoresistance, EMT and CSC properties, and is associated with a
worse patient prognosis.
The molecular mechanisms of MEG3 in regards to cell
proliferation, cell migration and invasion, EMT, CSC properties and
chemoresistance in PC cells warrant further investigation. In this
preliminary study, we found that differential expression of MEG3
significantly altered the mRNA and protein levels of Snail, a key
transcription factor that has been reported to be associated with
EMT and stemness maintenance. Considering that MEG3 is a ncRNA
which functions as a regulator of epigenetic modifications,
transcriptional or post-transcriptional regulation, we could
speculate that Snail might be a potential downstream target of MEG3
that regulates PC progression. Additional studies are needed to
elucidate how Snail is regulated by MEG3 in human PC.
In conclusion, our findings suggest that MEG3 is
expressed at low levels in human PC and is associated with patient
prognosis. The in vitro experiments illustrate that MEG3
could function as a tumour suppressor by modulating cell
proliferation, cell migration and invasion, EMT, CSC properties and
chemosensitivity. Therefore, MEG3 has great potential to serve as a
prognostic predictor and therapeutic target for individuals with
PC.
Acknowledgements
This research was supported by grants from the
National Natural Science Foundation of China (nos. 81372605,
81572339, and 81672353), the National High Technology Research and
Development Program of China (SS2014AA020405) and the Scientific
Research and Development Program of Beijing Railway Corporation of
China (no. J2017Z605). We thank Professor Zebin Mao at the
Department of Biochemistry and Molecular Biology in Health Science
Center, Peking University for the assistance and technical
support.
References
|
1
|
Siegel RL, Miller KD and Jemal A: Cancer
Statistics, 2017. CA Cancer J Clin. 67:7–30. 2017. View Article : Google Scholar : PubMed/NCBI
|
|
2
|
Ferlay J, Partensky C and Bray F: More
deaths from pancreatic cancer than breast cancer in the EU by 2017.
Acta oncol. 55:1158–1160. 2016. View Article : Google Scholar : PubMed/NCBI
|
|
3
|
Miyoshi N, Wagatsuma H, Wakana S,
Shiroishi T, Nomura M, Aisaka K, Kohda T, Surani MA, Kaneko-Ishino
T and Ishino F: Identification of an imprinted gene, Meg3/Gtl2 and
its human homologue MEG3, first mapped on mouse distal chromosome
12 and human chromosome 14q. Genes cells. 5:211–220. 2000.
View Article : Google Scholar : PubMed/NCBI
|
|
4
|
Zhang X, Zhou Y, Mehta KR, Danila DC,
Scolavino S, Johnson SR and Klibanski A: A pituitary-derived MEG3
isoform functions as a growth suppressor in tumor cells. J Clin
Endocrinol Metab. 88:5119–5126. 2003. View Article : Google Scholar : PubMed/NCBI
|
|
5
|
Cheng R, Lo K, Huang D and Tsao S: Loss of
heterozygosity on chromosome 14 in primary nasopharyngeal
carcinoma. Int J Oncol. 10:1047–1050. 1997.PubMed/NCBI
|
|
6
|
Liu J, Wan L, Lu K, Sun M, Pan X, Zhang P,
Lu B, Liu G and Wang Z: The long noncoding RNA MEG3 contributes to
cisplatin resistance of human lung adenocarcinoma. PLoS One.
10:e1145862015.
|
|
7
|
Bando T, Kato Y, Ihara Y, Yamagishi F,
Tsukada K and Isobe M: Loss of heterozygosity of 14q32 in
colorectal carcinoma. Cancer Genet Cytogenet. 111:161–165. 1999.
View Article : Google Scholar : PubMed/NCBI
|
|
8
|
Yin DD, Liu ZJ, Zhang E, Kong R, Zhang ZH
and Guo RH: Decreased expression of long noncoding RNA MEG3 affects
cell proliferation and predicts a poor prognosis in patients with
colorectal cancer. Tumour Biol. 36:4851–4859. 2015. View Article : Google Scholar : PubMed/NCBI
|
|
9
|
Braconi C, Kogure T, Valeri N, Huang N,
Nuovo G, Costinean S, Negrini M, Miotto E, Croce CM and Patel T:
MicroRNA-29 can regulate expression of the long non-coding RNA gene
MEG3 in hepatocellular. cancer. 30:1–4766. 2011.
|
|
10
|
Greife A, Knievel J, Ribarska T, Niegisch
G and Schulz WA: Concomitant downregulation of the imprinted genes
DLK1 and MEG3 at 14q32.2 by epigenetic mechanisms in urothelial
carcinoma. Clin Epigenetics. 6:292014. View Article : Google Scholar : PubMed/NCBI
|
|
11
|
Tian ZZ, Guo XJ, Zhao YM and Fang Y:
Decreased expression of long non-coding RNA MEG3 acts as a
potential predictor biomarker in progression and poor prognosis of
osteosarcoma. Int J Clin Exp Pathol. 8:15138–15142. 2015.PubMed/NCBI
|
|
12
|
Itoyama T, Chaganti RS, Yamada Y,
Tsukasaki K, Atogami S, Nakamura H, Tomonaga M, Ohshima K, Kikuchi
M and Sadamori N: Cytogenetic analysis and clinical significance in
adult T-cell leukemia/lymphoma: A study of 50 cases from the human
T-cell leukemia virus type-1 endemic area, Nagasaki. Blood.
97:3612–3620. 2001. View Article : Google Scholar : PubMed/NCBI
|
|
13
|
Huarte M, Guttman M, Feldser D, Garber M,
Koziol MJ, Kenzelmann-Broz D, Khalil AM, Zuk O, Amit I, Rabani M,
et al: A large intergenic noncoding RNA induced by p53 mediates
global gene repression in the p53 response. Cell. 142:409–419.
2010. View Article : Google Scholar : PubMed/NCBI
|
|
14
|
Zhao J, Zhang X, Zhou Y, Ansell PJ and
Klibanski A: Cyclic AMP stimulates MEG3 gene expression in cells
through a cAMP-response element (CRE) in the MEG3 proximal promoter
region. Int J Biochem Cell Biol. 38:1808–1820. 2006. View Article : Google Scholar : PubMed/NCBI
|
|
15
|
Gordon FE, Nutt CL, Cheunsuchon P,
Nakayama Y, Provencher KA, Rice KA, Zhou Y, Zhang X and Klibanski
A: Increased expression of angiogenic genes in the brains of mouse
meg3-null embryos. Endocrinology. 151:2443–2452. 2010. View Article : Google Scholar : PubMed/NCBI
|
|
16
|
Gao Y and Lu X: Decreased expression of
MEG3 contributes to retinoblastoma progression and affects
retinoblastoma cell growth by regulating the activity of
Wnt/β-catenin pathway. Tumour Biol. 37:1461–1469. 2016. View Article : Google Scholar : PubMed/NCBI
|
|
17
|
Chang L, Wang G, Jia T, Zhang L, Li Y, Han
Y, Zhang K, Lin G, Zhang R, Li J and Wang L: Armored long
non-coding RNA MEG3 targeting EGFR based on recombinant MS2
bacteriophage virus-like particles against hepatocellular
carcinoma. Oncotarget. 7:23988–24004. 2016.PubMed/NCBI
|
|
18
|
Li C, Heidt DG, Dalerba P, Burant CF,
Zhang L, Adsay V, Wicha M, Clarke MF and Simeone DM: Identification
of pancreatic cancer stem cells. Cancer Res. 67:1030–1037. 2007.
View Article : Google Scholar : PubMed/NCBI
|
|
19
|
Hollier BG, Evans K and Mani SA: The
epithelial-to-mesenchymal transition and cancer stem cells: A
coalition against cancer therapies. J Mammary Gland Biol Neoplasia.
14:29–43. 2009. View Article : Google Scholar : PubMed/NCBI
|
|
20
|
Shah AN, Summy JM, Zhang J, Park SI,
Parikh NU and Gallick GE: Development and characterization of
gemcitabine-resistant pancreatic tumor cells. Ann Surg Oncol.
14:3629–3637. 2007. View Article : Google Scholar : PubMed/NCBI
|
|
21
|
Wang Z, Li Y, Kong D, Banerjee S, Ahmad A,
Azmi AS, Ali S, Abbruzzese JL, Gallick GE and Sarkar FH:
Acquisition of epithelial-mesenchymal transition phenotype of
gemcitabine-resistant pancreatic cancer cells is linked with
activation of the notch signaling pathway. Cancer Res.
69:2400–2407. 2009. View Article : Google Scholar : PubMed/NCBI
|
|
22
|
Izumiya M, Kabashima A, Higuchi H,
Igarashi T, Sakai G, Iizuka H, Nakamura S, Adachi M, Hamamoto Y,
Funakoshi S, et al: Chemoresistance is associated with cancer stem
cell-like properties and epithelial-to-mesenchymal transition in
pancreatic cancer cells. Anticancer Res. 32:3847–3853.
2012.PubMed/NCBI
|