Introduction
Lung cancer is one of the most common types of
cancer and is the leading cause of cancer-related mortality
wordwide. Small cell lung cancer (SCLC) and non-small cell lung
cancer (NSCLC) are the most common types of lung cancer, of which
NSCLC accounts for approximately 85% of all cases (1). Lung adenocarcinoma is the most common
subtype of NSCLC (40%) in many countries (2,3). To
date, many genetic factors have been proposed to be involved in
lung adenocarcinoma, including several tumour-suppressor genes
(TP53, CDKN2A, STK11, NF1, ATM, RB1, and APC) (4,5).
Several new targeted therapies have resulted in considerable
clinical benefits for cancer patients in recent years, as well as a
deeper understanding of lung adenocarcinoma at the molecular level.
One example of a new targeted therapy is epidermal growth factor
receptor (EGFR) and KRAS targeted gene therapy (6,7).
However, targeted gene therapy is mainly used when patients have
special characteristics. EGFR mutations occur more frequently in
female lung adenocarcinoma patients with a non-smoking history
(8). HER2 mutations tend to occur
in non-smoking males (9). In
contrast, KRAS mutations occur during the early development of
smoking-related lung adenocarcinoma (10). Based on these observations, there is
a need to develop individualized treatment programs for patients
with unique clinical characteristics. Lung adenocarcinoma is caused
by a combination of genetic and environmental effects (11).
More recently, the incidence of lung adenocarcinoma
has increased in smokers (12).
Tobacco smoke contains a mixture of harmful compounds and
carcinogens (13). Therefore,
smoking plays an important role in the development of lung
adenocarcinoma. Although the correlation between smoking and lung
adenocarcinoma has been demonstrated in previous studies, a
meta-analysis of the gene mutations in a large number of tissue
samples that considers the smoking history in lung adenocarcinoma
has not yet been conducted (14).
This large scale analysis can reduce the differences caused by
different research conditions and can integrate the results from
previous studies to evaluate the issue from another point of view.
The development of microarray methods for large scale analysis of
gene expression makes it possible to perform a more comprehensive
analysis for potential genes and molecular pathways associated with
lung adenocarcinoma in smoking patients (15). DNA microarray analysis has been
applied to investigate whole genomic expression profiles and
physiological mechanisms in health and disease (16,17).
Therefore, a high-throughput microarray experiment was designed to
analyse the genetic expression patterns and identify potential
genes to target for lung adenocarcinoma (18). Meta-analysis provides a powerful
tool for analysing microarray experiments by combining data from
multiple studies (19). Genes
identified by meta-analysis tend to overlap with genes identified
in other studies, suggesting increased reliability (20). In addition to providing a new
perspective, this research topic will further the understanding of
the relationship between smoking and lung adenocarcinoma.
The aim of this study was to identify possible
candidate genes for personalized treatment for lung adenocarcinoma
patients with a history of smoking to provide patients with better
treatment options and ensure a good prognosis. Therefore, we
conducted a meta-analysis using the same platform of gene
expression profile data that associated smoking with lung
adenocarcinoma tissue.
Materials and methods
Selection of microarray datasets for
meta-analysis
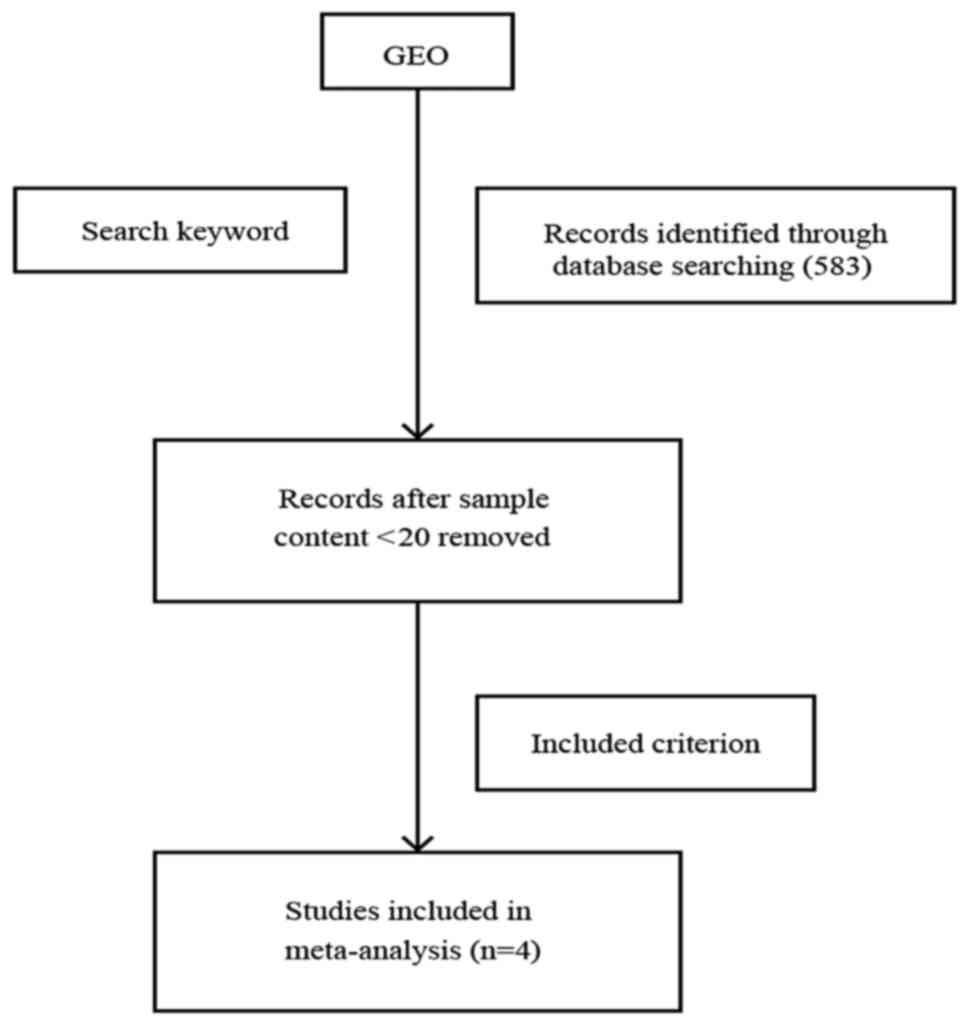
According to the Preferred Reporting Items for
Systematic Reviews and Meta-Analysis (PRISMA) guidelines published
in 2009, we performed a detailed and comprehensive search of
microarray datasets in the Gene Expression Omnibus (GEO) database
of the National Center for Biotechnology Information (NCBI)
(http://www.ncbi.nlm.nih.gov/geo/).
Meta-analysis data
To maintain objectivity, the data were
simultaneously extracted by two independent reviewers from the
original search. Any discrepancies that arose between the two
reviewers were resolved by consultation with a third reviewer. The
terms ‘lung neoplasms’ and ‘lung cancer’ were considered keywords
during our search for this study. In addition, studies that
reported non-human data were excluded in the selection process for
microarray datasets. Finally, 583 datasets were obtained from
searching the Gene Expression Omnibus (GEO) database. Datasets with
>20,288 samples were elected for the study. We included a
dataset in the meta-analysis if it contained i) all samples on the
Affymetrix Human Genome U133 Plus 2.0 Array platform, ii) samples
from lung adenocarcinoma tissue and iii) samples with valid smoking
statuses. According to the criteria, the four datasets that were
selected from the 288 datasets included 477 lung adenocarcinoma
tissues with valid smoking statuses. Then, we downloaded the lung
adenocarcinoma tissue files (CEL) of the four microarray datasets
from the GEO database with accession numbers GSE12667, GSE31210,
GSE40791, and GSE50081. The four datasets included 477 lung
adenocarcinoma patients; 327 of which were smokers, and 150 were
non-smokers; the smokers included former smokers, current smokers
and ex-smokers.
Meta-analysis of microarray datasets
using the same platform
We conducted the meta-analysis of gene expression
profiles of the selected four microarray datasets by using R
statistical software (http://www.r-project.org/) with the same platform.
Prior to the meta-analysis, we performed data normalization of the
four datasets using R statistical software. Then, we processed the
meta-analysis using the MAMA, mataMA, affyPLM and CLL packages in R
statistical software according to the t-test and z-score methods.
During the meta-analysis with R statistical software, a list of
differentially expressed genes (DEGs) (upregulated or
downregulated) were identified based on the P-values (where the
threshold was <0.005) and z-scores (where the threshold was an
absolute value >3).
Enrichment analysis of the GO function
and KEGG pathway
It is important to understand the biological
implications of the identified DEGs in lung adenocarcinoma tissue.
According to the meta-analysis results, the most significant 200
DEGs (100 upregulated and 100 downregulated) were selected for
enrichment analysis. Then, we conducted the functional enrichment
analysis of the gene ontology (GO) function and the Kyoto
Encyclopedia of Genes and Genomes (KEGG) pathway using the
WEB-based GEne SeT AnaLysis Toolkit (http://bioinfo.vanderbilt.edu/webgestalt/login.php)
under a significance threshold of P<0.05.
PPI network analysis
To further understand and predict the biological
activity of the identified DEGs that were based on the results of
the GO function and KEGG pathway enrichment analyses, we conducted
a protein-protein interaction (PPI) network using the Cytoscape
software. Prior to this analysis, we imported the DEG-encoding
proteins into a protein-protein interaction (PPI) network, which
was downloaded from the Biological General Repository for
Interaction Datasets (BioGRID, http://thebiogrid.org/).
Results
Selection of microarray datasets
related to lung adenocarcinoma for meta-analysis
From the microarray datasets retrieved from the GEO
database of NCBI, we extracted 477 GEO lung adenocarcinoma samples
that belonged to four microarray datasets, which met our criteria
for meta-analysis (see Materials and methods, and Fig. 1). All four GEO series (GSEs) were
microarray datasets that used only lung adenocarcinoma tissue with
valid smoking statuses. The GEO Platform Files (GPLs) from the four
datasets (GSE12667, GSE31210, GSE40791 and GSE50081) were obtained
using the Affymetrix ‘Gene Chip’ (Table
I).
 | Table I.Characteristic of individual studies
retrieved from Gene Expression Omnibus for meta-analysis. |
Table I.
Characteristic of individual studies
retrieved from Gene Expression Omnibus for meta-analysis.
|
| Sample |
|
|
|---|
|
|
|
|
|
|---|
| Dataset | Smoking status | Non-smoking
status | Tissue | Platform |
|---|
| GSE12667 | 40 |
8 | Lung
adenocarcinoma | Affymetrix Human
Genome U133 Plus 2.0 Array |
| GSE31210 | 111 | 115 | Lung
adenocarcinoma | Affymetrix Human
Genome U133 Plus 2.0 Array |
| GSE40791 | 82 |
4 | Lung
adenocarcinoma | Affymetrix Human
Genome U133 Plus 2.0 Array |
| GSE50081 | 94 | 23 | Lung
adenocarcinoma | Affymetrix Human
Genome U133 Plus 2.0 Array |
Identification of upregulated or
downregulated DEGs through meta-analysis
We performed the meta-analysis of gene expression
profiles according to t-test and z-score methods using MAMA,
mataMA, affyPLM and CLL packages in R statistical software on the
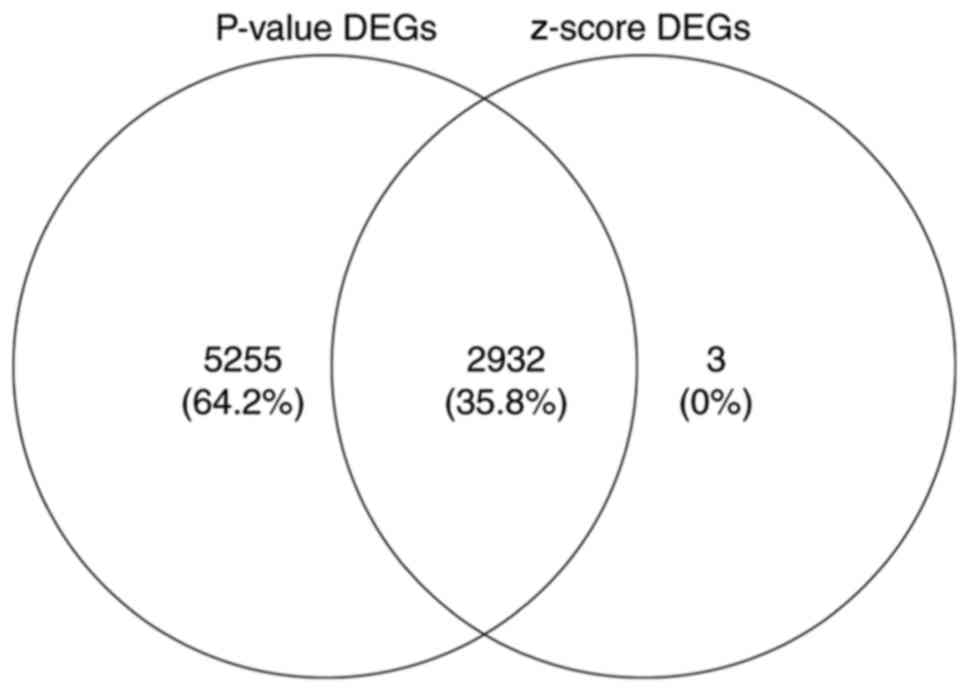
same platform. According to the P-value (where the threshold was
<0.005) and z-score (where the threshold was an absolute value
>3), we were able to identify a total of 2,932 DEGs, including
1,806 upregulated and 1,126 downregulated genes using Venny 2.0
(http://bioinfogp.cnb.csic.es/tools/venny/index.html).
The 200 genes that showed maximum upregulation and downregulation
are shown in Tables II and
III, and the overlapping DEGs
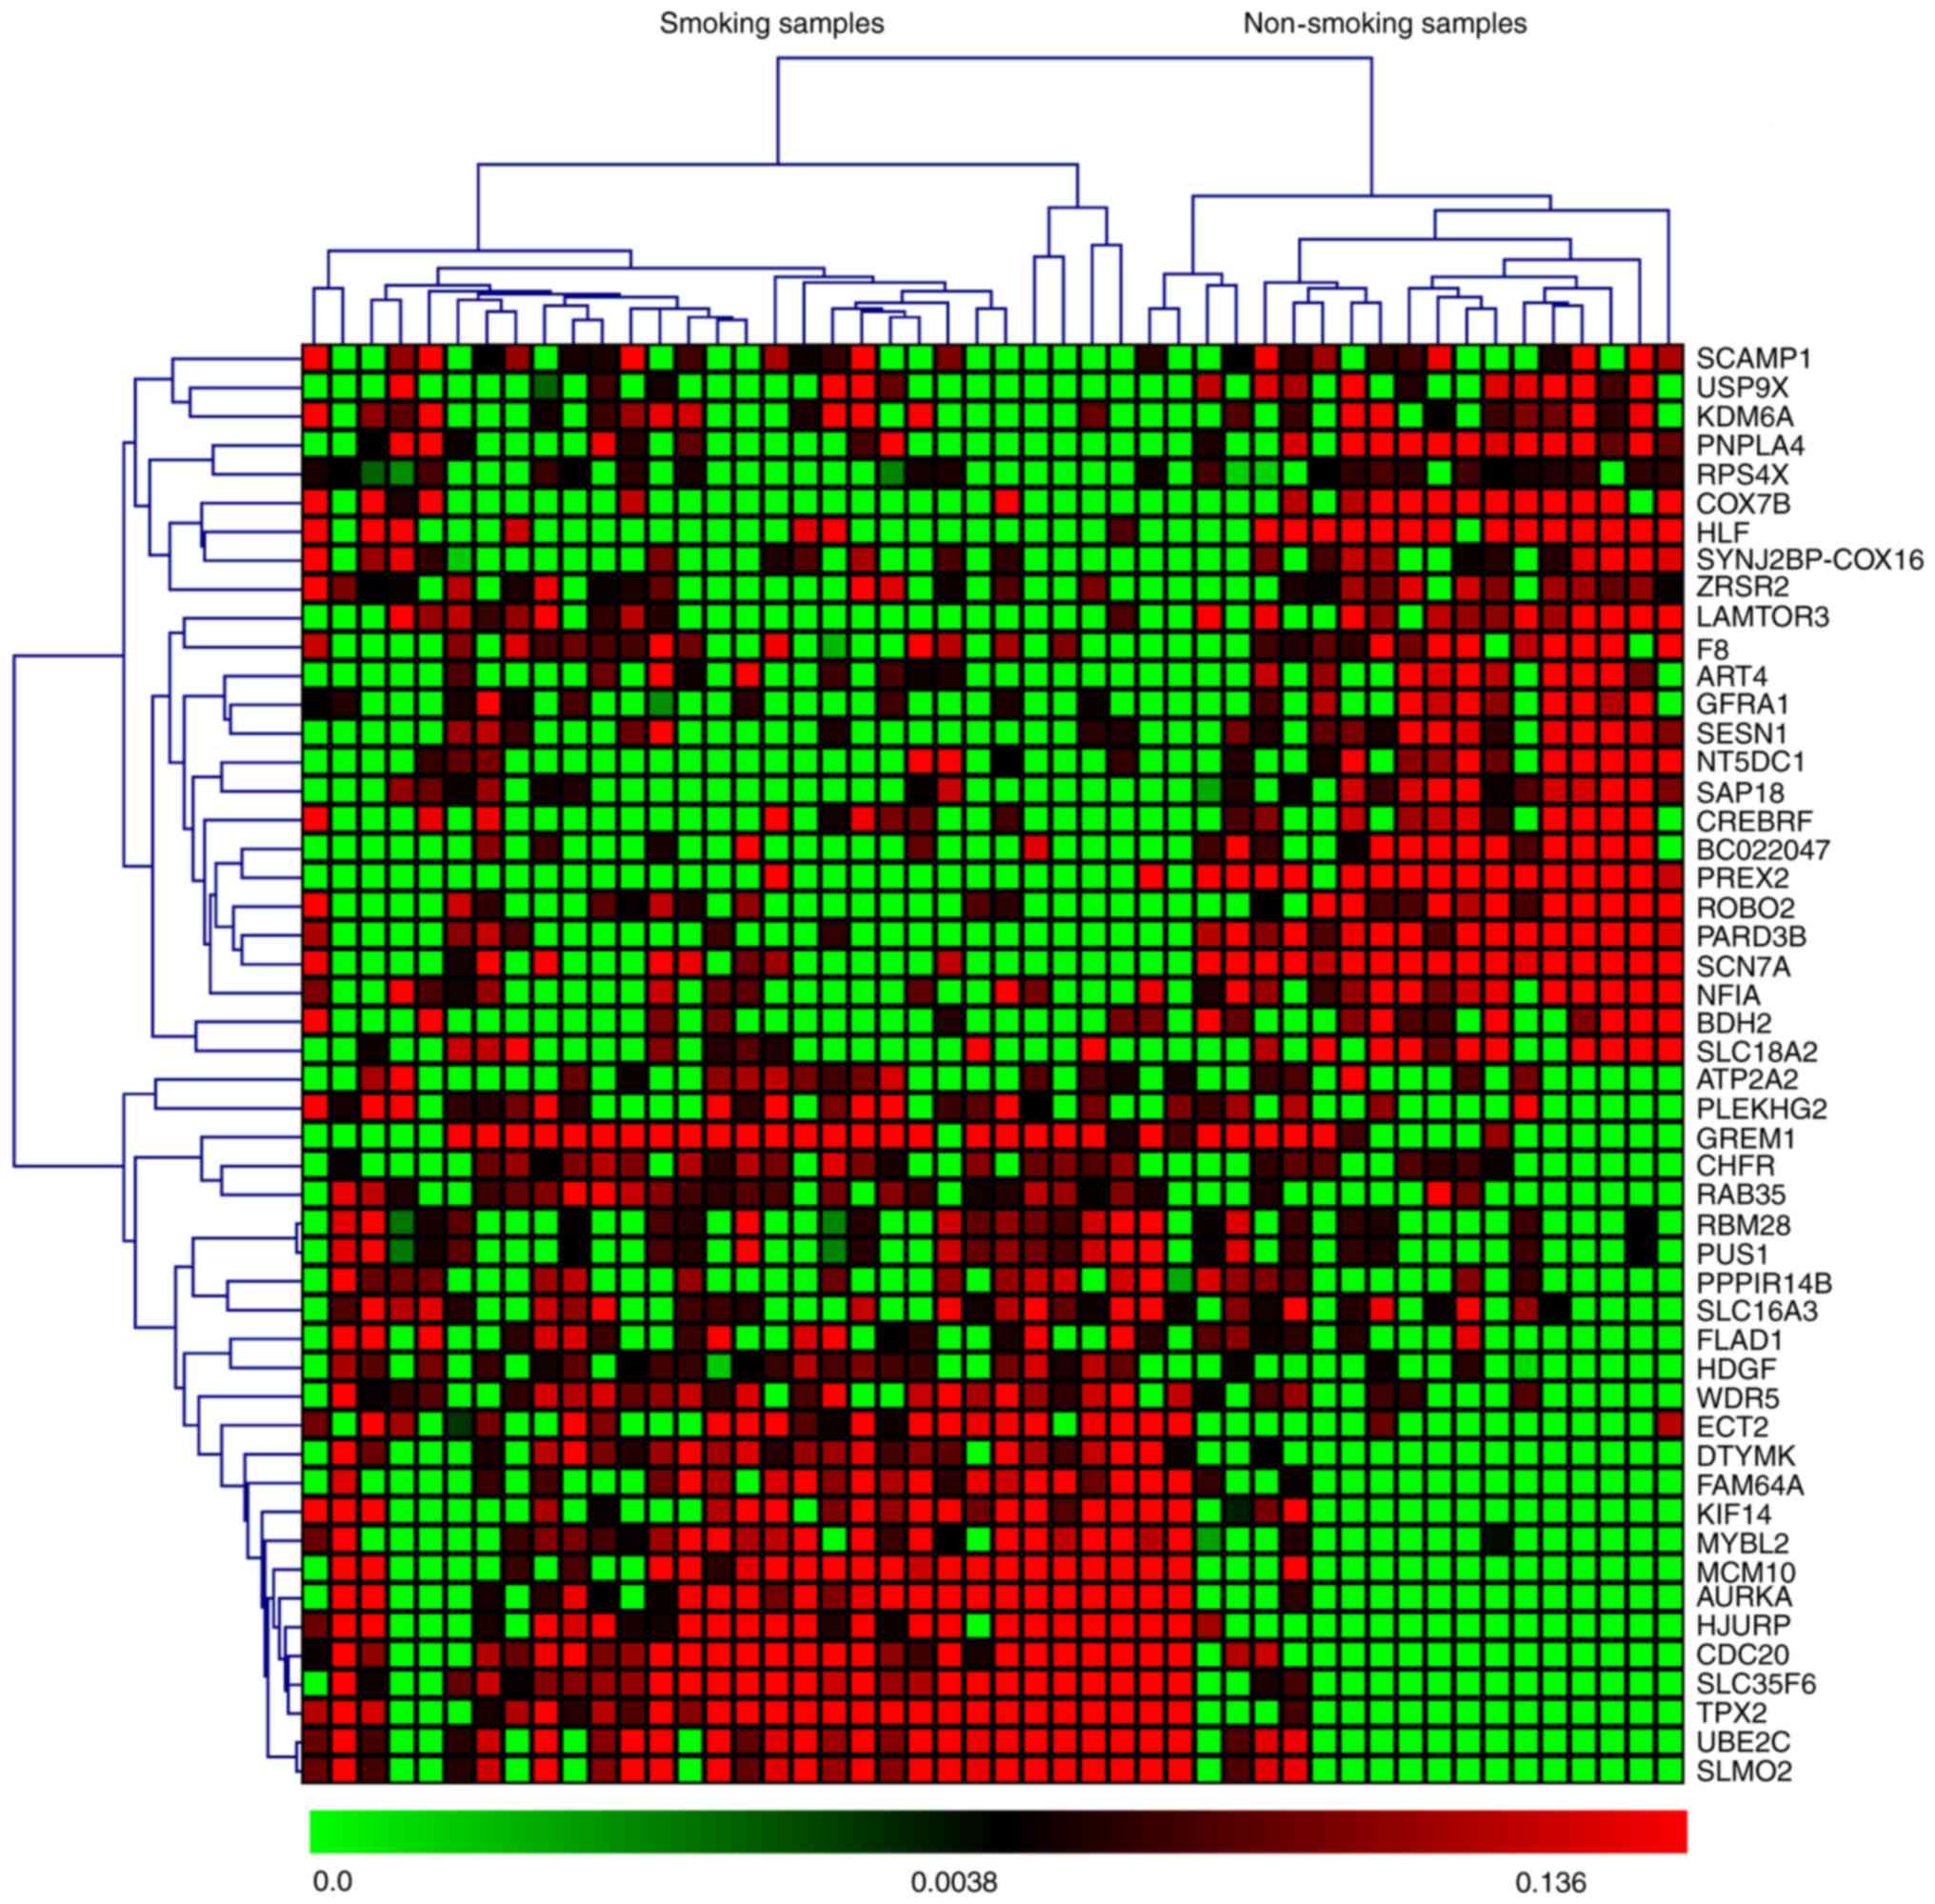
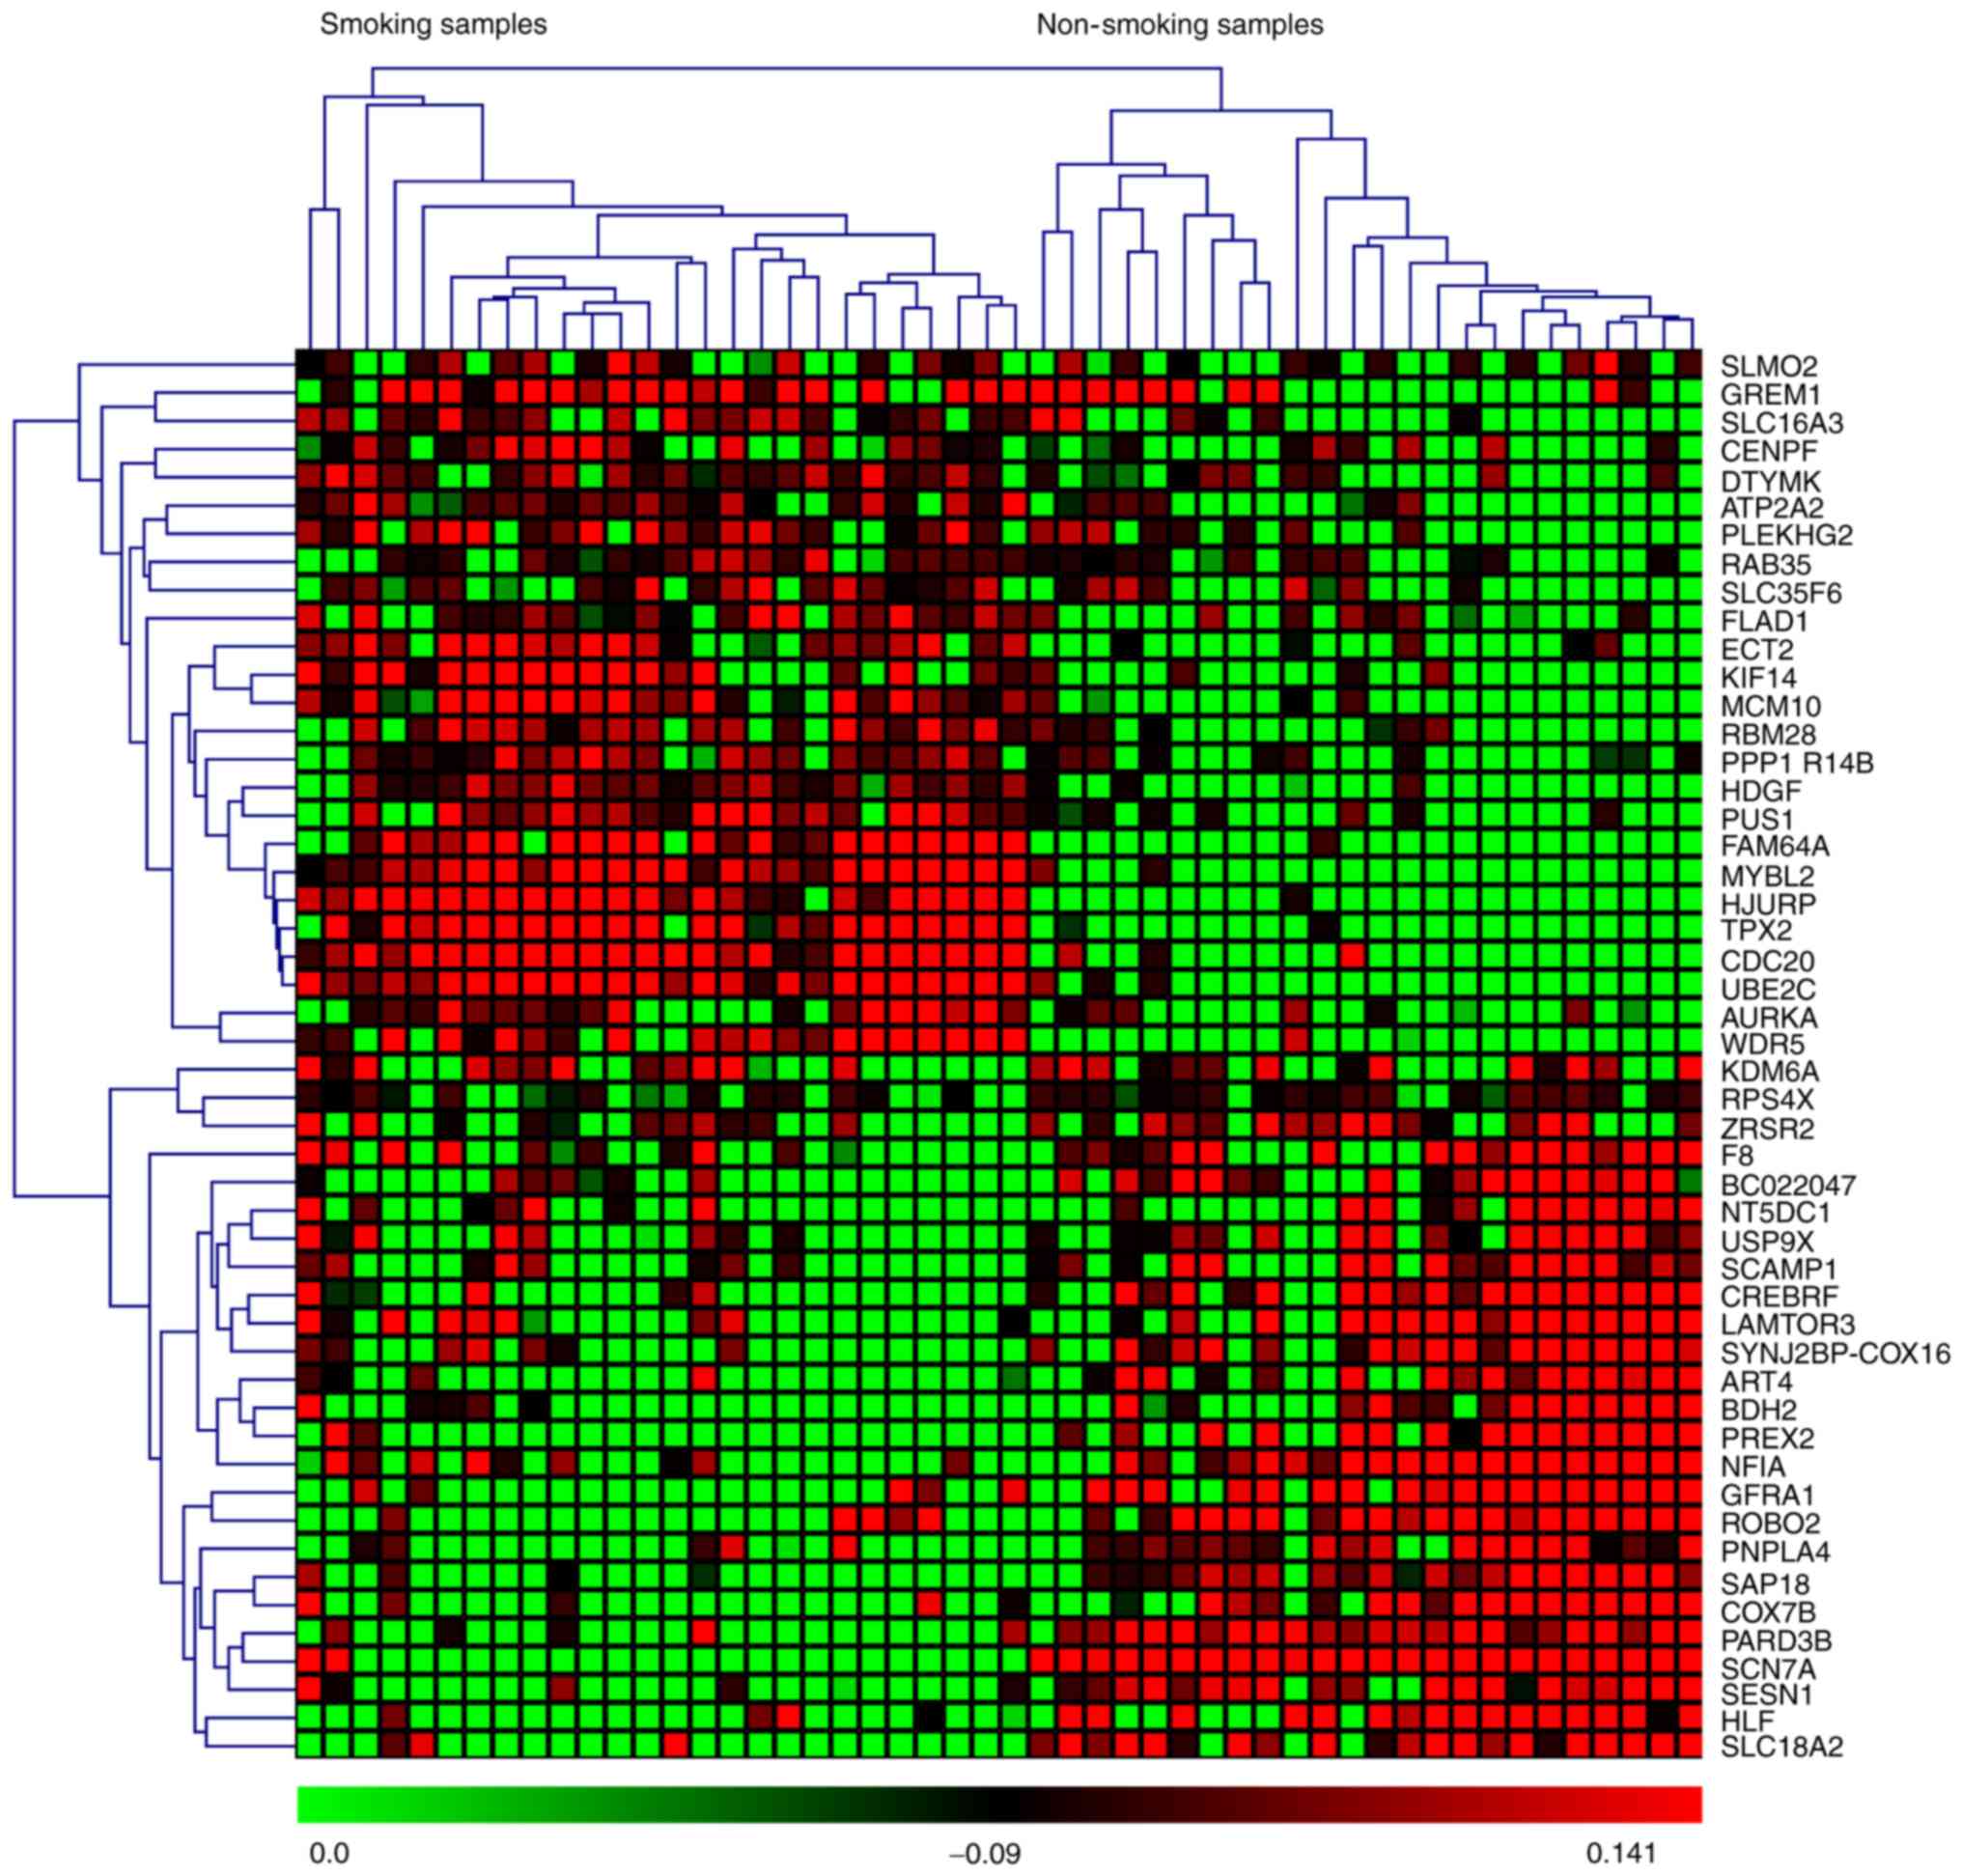
based on P-values and z-scores are shown in Fig. 2. A subset of the top 50 DEGs (25
upregulated and 25 downregulated) in the four microarray datasets
were visualized with heat maps using the Mev software and are shown
in Figs. 3–6.
| Table II.The 100 upregulated genes. |
Table II.
The 100 upregulated genes.
| Probe ID | Gene | P-value | z-score |
|---|
| 218670_at | PUS1 | 1.26565E-14 | −3.364765896 |
| 202856_s_at | SLC16A3 | 1.31006E-14 | −3.005755138 |
| 1553984_s_at | DTYMK | 2.73115E-14 | −3.77721059 |
| 210052_s_at | TPX2 | 3.28626E-14 | −3.156028484 |
| 225620_at | RAB35 | 6.72795E-14 | −3.977400883 |
| 201710_at | MYBL2 | 1.13465E-13 | −3.753904206 |
| 200896_x_at | HDGF | 1.32117E-13 | −6.606272774 |
| 233986_s_at | PLEKHG2 | 1.34559E-13 | −4.721664344 |
| 209186_at | ATP2A2 | 1.52767E-13 | −3.331133151 |
| 202954_at | UBE2C | 1.96732E-13 | −3.433957425 |
| 234992_x_at | ECT2 | 2.22933E-13 | −3.540186205 |
| 218468_s_at | GREM1 | 2.91323E-13 | −3.421989473 |
| 221591_s_at | FAM64A | 3.1064E-13 | −3.645233189 |
| 223308_s_at | WDR5 | 3.71925E-13 | −3.441383479 |
| 204092_s_at | AURKA | 4.20552E-13 | −4.669115008 |
| 218593_at | RBM28 | 5.6688E-13 | −3.725504934 |
| 204962_s_at | SLC35F6 | 6.05294E-13 | −3.16224673 |
| 218726_at | HJURP | 9.13047E-13 | −3.516355847 |
| 206364_at | KIF14 | 1.22724E-12 | −3.097688744 |
| 202870_s_at | CDC20 | 1.31761E-12 | −3.025537109 |
| 212680_x_at | PPP1R14B | 1.41753E-12 | −3.30292041 |
| 220651_s_at | MCM10 | 1.66711E-12 | −3.962832885 |
| 222441_x_at | SLMO2 | 1.88827E-12 | −3.580783528 |
| 212541_at | FLAD1 | 2.68452E-12 | −4.335857984 |
| 223931_s_at | CHFR | 2.91989E-12 | −5.133807637 |
| 203612_at | BYSL | 2.94276E-12 | −3.332540528 |
| 219874_at | SLC12A8 | 3.14992E-12 | −4.228880162 |
| 229538_s_at | IQGAP3 | 3.39373E-12 | −4.67663851 |
| 38158_at | ESPL1 | 3.52074E-12 | −4.330276826 |
| 224753_at | CDCA5 | 3.8165E-12 | −3.102794749 |
| 200044_at | SRSF9 | 5.19895E-12 | −4.335016805 |
| 234915_s_at | DENR | 6.64646E-12 | −3.045464333 |
| 206316_s_at | KNTC1 | 7.17115E-12 | −3.034017863 |
| 225468_at | PATL1 | 7.18048E-12 | −4.555045317 |
| 200756_x_at | CALU | 7.89546E-12 | −3.573314992 |
| 202095_s_at | BIRC5 | 8.23586E-12 | −3.071731969 |
| 209464_at | AURKB | 8.59246E-12 | −5.290213575 |
| 204430_s_at | SLC2A5 | 9.54348E-12 | −3.999406252 |
| 219918_s_at | ASPM | 9.98956E-12 | −3.385882475 |
| 218512_at | WDR12 | 1.10383E-11 | −3.127647757 |
| 203702_s_at | TTLL4 | 1.10745E-11 | −3.222581427 |
| 242944_at | FAM83A | 1.14144E-11 | −6.56980268 |
| 206205_at | MPHOSPH9 | 1.17426E-11 | −3.286743793 |
| 221520_s_at | CDCA8 | 1.222E-11 | −3.189226567 |
| 220011_at | AUNIP | 1.32323E-11 | −5.645650742 |
| 203004_s_at | MEF2D | 1.41975E-11 | −6.628593875 |
| 204005_s_at | PAWR | 1.44695E-11 | −4.589047842 |
| 200744_s_at | GNB1 | 1.57292E-11 | −3.309783419 |
| 202580_x_at | FOXM1 | 1.92268E-11 | −3.156340828 |
| 201761_at | MTHFD2 | 2.141E-11 | −3.158744955 |
| 204603_at | EXO1 | 2.21381E-11 | −3.093222948 |
| 225401_at | C1orf85 | 2.37168E-11 | −4.583223012 |
| 228703_at | P4HA3 | 2.44789E-11 | −4.354770166 |
| 204709_s_at | KIF23 | 2.78617E-11 | −3.130038648 |
| 212322_at | SGPL1 | 3.15128E-11 | −3.303129755 |
| 202779_s_at | UBE2S | 3.25431E-11 | −3.246262139 |
| 210386_s_at | MTX1 | 3.28946E-11 | −3.499628552 |
| 205733_at | BLM | 3.44063E-11 | −3.183717987 |
| 223307_at | CDCA3 | 3.49276E-11 | −3.223011207 |
| 1555943_at | PGAM5 | 3.49287E-11 | −4.908658645 |
| 219493_at | SHCBP1 | 3.69571E-11 | −3.171551777 |
| 223785_at | FANCI | 4.13012E-11 | −3.72118368 |
| 212021_s_at | MKI67 | 4.16123E-11 | −3.291213712 |
| 200750_s_at | RAN | 4.22222E-11 | −3.060882727 |
| 229892_at | EP400NL | 4.39129E-11 | −4.569469931 |
| 204126_s_at | CDC45 | 4.39451E-11 | −3.107729352 |
| 226949_at | GOLGA3 | 4.51967E-11 | −3.569550938 |
| 205895_s_at | NOLC1 | 4.80713E-11 | −3.479055682 |
| 205691_at | SYNGR3 | 4.92397E-11 | −6.345274404 |
| 204641_at | NEK2 | 4.94367E-11 | −3.260850411 |
| 223365_at | DHX37 | 5.08806E-11 | −6.413792983 |
| 229610_at | CKAP2L | 5.22091E-11 | −3.506800101 |
| 207590_s_at | CENPI | 5.60811E-11 | −3.706888048 |
| 224742_at | ABHD12 | 6.35478E-11 | −3.351775356 |
| 209052_s_at | WHSC1 | 6.63429E-11 | −3.610265902 |
| 206074_s_at | HMGA1 | 6.86768E-11 | −3.035687751 |
| 225554_s_at | ANAPC7 | 7.7532E-11 | −4.210797517 |
| 204649_at | TROAP | 8.73972E-11 | −3.344919358 |
| 212871_at | MAPKAPK5 | 9.64493E-11 | −6.062517519 |
| 201954_at | ARPC1B | 1.04984E-10 | −3.29272791 |
| 203967_at | CDC6 | 1.15562E-10 | −3.032999971 |
| 205024_s_at | RAD51 | 1.27276E-10 | −3.317013997 |
| 201127_s_at | ACLY | 1.40898E-10 | −3.598775099 |
| 201292_at | TOP2A | 1.69439E-10 | −3.586121076 |
| 1555274_a_at | EPT1 | 1.82091E-10 | −3.107139925 |
| 222077_s_at | RACGAP1 | 1.98689E-10 | −3.463568797 |
| 212949_at | NCAPH | 2.04934E-10 | −3.123094613 |
| 214866_at | PLAUR | 2.8521E-10 | −6.066208054 |
| 209836_x_at | BOLA2B | 3.03036E-10 | −3.581736948 |
| 236957_at | CDCA2 | 3.37438E-10 | −3.267349523 |
| 204318_s_at | GTSE1 | 3.6192E-10 | −3.165321627 |
| 222622_at | PGP | 3.89473E-10 | −3.166188967 |
| 218497_s_at | RNASEH1 | 4.25561E-10 | −3.276072648 |
| 218984_at | PUS7 | 4.45897E-10 | −4.331098443 |
| 205394_at | CHEK1 | 4.6472E-10 | −3.071160119 |
| 210821_x_at | CENPA | 4.95303E-10 | −3.345790152 |
| 223484_at | C15orf48 | 6.08452E-10 | −3.301630777 |
| 213523_at | CCNE1 | 6.55394E-10 | −4.360746545 |
| 209642_at | BUB1 | 7.26076E-10 | −3.325492652 |
| 202240_at | PLK1 | 8.52925E-10 | −3.537560833 |
| Table III.The 100 downregulated genes. |
Table III.
The 100 downregulated genes.
| Probe ID | Gene | P-value | z-score |
|---|
| 225956_at | CREBRF | 0 | 3.056084 |
| 209740_s_at | PNPLA4 | 0 | 8.750866 |
| 204754_at | HLF | 0 | 3.370263 |
| 230163_at | GFRA1 | 0 | 3.162875 |
| 242496_at | ART4 | 0 | 3.160279 |
| 221518_s_at | USP47 | 0 | 4.047036 |
| 235830_at | NT5DC1 | 0 | 3.951365 |
| 235155_at | BDH2 | 0 | 3.138416 |
| 208741_at | SAP18 | 0 | 3.588813 |
| 228692_at | PREX2 | 0 | 3.033953 |
| 211999_at | MIR4738 | 0 | 3.297597 |
| 227562_at | LAMTOR3 | 0 | 3.340261 |
| 229573_at | USP9X | 2.22E-16 | 4.870675 |
| 205756_s_at | F8 | 2.22E-16 | 3.20333 |
| 229319_at | BC022047 | 2.22E-16 | 3.024973 |
| 228411_at | PARD3B | 4.44E-16 | 3.454669 |
| 212425_at | SCAMP1 | 4.44E-16 | 3.064577 |
| 213876_x_at | ZRSR2 | 4.44E-16 | 5.174619 |
| 239252_at | COX7B | 4.44E-16 | 3.999039 |
| 200933_x_at | RPS4X | 4.44E-16 | 5.299386 |
| 210829_s_at | SSBP2 | 4.44E-16 | 3.082665 |
| 206767_at | RBMS3 | 6.66E-16 | 3.71459 |
| 226709_at | ROBO2 | 6.66E-16 | 3.615428 |
| 203991_s_at | KDM6A | 8.88E-16 | 5.796073 |
| 227274_at | SYNJ2BP-COX16 | 1.11E-15 | 3.517758 |
| 228504_at | SCN7A | 1.78E-15 | 3.16819 |
| 225998_at | GAB1 | 2E-15 | 3.00431 |
| 218346_s_at | SESN1 | 2.44E-15 | 3.055691 |
| 224976_at | NFIA | 3.11E-15 | 3.007387 |
| 205857_at | SLC18A2 | 4.22E-15 | 3.457499 |
| 225352_at | SEC62 | 6.88E-15 | 3.26132 |
| 200810_s_at | CIRBP | 1.49E-14 | 3.072028 |
| 200983_x_at | CD59 | 2.22E-14 | 3.24769 |
| 212249_at | PIK3R1 | 2.44E-14 | 4.98666 |
| 241689_at | METTL14 | 3.42E-14 | 3.311901 |
| 228716_at | THRB | 4.88E-14 | 3.021776 |
| 205259_at | NR3C2 | 5E-14 | 3.392261 |
| 223588_at | THAP2 | 5.44E-14 | 6.445672 |
| 201427_s_at | SEPP1 | 6.02E-14 | 3.146142 |
| 219427_at | FAT4 | 7.7E-14 | 3.056389 |
| 209807_s_at | NFIX | 7.97E-14 | 3.105386 |
| 201498_at | USP7 | 8.55E-14 | 3.827248 |
| 228243_at | RP11-5C23.1 | 8.84E-14 | 3.43588 |
| 238786_at | ANK3 | 1.58E-13 | 3.075604 |
| 233249_at | LOC100507073 | 1.61E-13 | 3.069721 |
| 208633_s_at | MACF1 | 1.79E-13 | 3.260397 |
| 226816_s_at | KIAA1143 | 1.94E-13 | 3.431996 |
| 208792_s_at | CLU | 2.46E-13 | 3.627978 |
| 210426_x_at | RORA | 2.51E-13 | 3.077789 |
| 229969_at | SEC63 | 2.86E-13 | 3.019815 |
| 225811_at | C11orf58 | 2.90212E-13 | 3.095344537 |
| 227847_at | EPM2AIP1 | 3.27738E-13 | 3.460553723 |
| 201019_s_at | EIF1AX | 3.35065E-13 | 4.257274339 |
| 223695_s_at | ARSD | 3.475E-13 | 5.635180257 |
| 228905_at | PCM1 | 3.53051E-13 | 3.340750721 |
| 217707_x_at | SMARCA2 | 3.67262E-13 | 4.020194349 |
| 225093_at | UTRN | 6.21503E-13 | 3.138806562 |
| 227425_at | REPS2 | 7.33413E-13 | 3.055352168 |
| 211734_s_at | FCER1A | 8.45324E-13 | 3.411503985 |
| 244007_at | ZNF462 | 9.36362E-13 | 3.786986943 |
| 212675_s_at | CEP68 | 1.00742E-12 | 3.307657084 |
| 238454_at | ZNF540 | 1.13221E-12 | 3.186059238 |
| 224889_at | FOXO3 | 1.14175E-12 | 3.853408162 |
| 1558512_at | RP11-819C21.1 | 1.37579E-12 | 3.144887286 |
| 213802_at | PRSS12 | 1.47216E-12 | 4.357472705 |
| 225465_at | MAGI1 | 1.47393E-12 | 4.208157151 |
| 223126_s_at | C1orf21 | 1.56142E-12 | 3.186640389 |
| 230479_at | EIF3F | 1.58984E-12 | 3.299359045 |
| 228448_at | MAP6 | 1.66223E-12 | 3.143593284 |
| 217779_s_at | PNRC2 | 1.91847E-12 | 3.246325539 |
| 1560648_s_at | TSPYL1 | 1.9309E-12 | 3.760805629 |
| 212936_at | FAM172A | 2.19358E-12 | 4.299840018 |
| 227091_at | CCDC146 | 2.29194E-12 | 3.206298087 |
| 221564_at | PRMT2 | 2.38565E-12 | 3.547995663 |
| 43427_at | ACACB | 2.44649E-12 | 3.004593504 |
| 229384_at | CTC-429P9.3 | 2.57394E-12 | 3.228782722 |
| 222663_at | RIOK2 | 2.69118E-12 | 3.35934368 |
| 238472_at | FBXO9 | 2.69273E-12 | 3.562133246 |
| 222533_at | CRBN | 2.82396E-12 | 3.004216036 |
| 228751_at | CLK4 | 3.30425E-12 | 3.359190366 |
| 208832_at | ATXN10 | 3.36042E-12 | 3.408974266 |
| 238043_at | ARID1B | 3.38618E-12 | 3.280003422 |
| 1559412_at | LINC00478 | 3.50475E-12 | 4.041998876 |
| 238081_at | WDFY3-AS2 | 3.68106E-12 | 3.077236586 |
| 228760_at | SRSF8 | 4.13358E-12 | 3.538832842 |
| 235240_at | ATXN3 | 4.47198E-12 | 3.59474854 |
| 240806_at | RPL15 | 5.22404E-12 | 3.229351616 |
| 228027_at | GPRASP2 | 5.30198E-12 | 3.191435286 |
| 209815_at | PTCH1 | 5.63194E-12 | 3.080285017 |
| 208760_at | UBE2I | 6.31295E-12 | 3.075043093 |
| 229317_at | KPNA5 | 6.53722E-12 | 3.749106743 |
| 228420_at | PDCD2 | 7.1736E-12 | 3.442288871 |
| 227520_at | TXLNG | 7.54685E-12 | 5.386988658 |
| 244294_at | GTF2H5 | 7.70273E-12 | 4.035395557 |
| 204011_at | SPRY2 | 7.75358E-12 | 3.811245705 |
| 209614_at | ADH1B | 7.83396E-12 | 3.188622844 |
| 226774_at | FAM120B | 8.43059E-12 | 3.286960689 |
| 235612_at | PRPF38A | 1.023E-11 | 3.636955078 |
| 232122_s_at | VEPH1 | 1.20886E-11 | 3.052642894 |
| 216342_x_at | RPS4XP2 | 1.22578E-11 | 6.967247025 |
Enrichment analysis of the GO function
and KEGG pathway for the top 100 upregulated and downregulated
DEGs
We classified the 200 DEGs that were identified
through meta-analysis according to the GO hierarchy into functional
categories (biological process, molecular function, and cellular
component) and based on the KEGG pathway, with a significance
threshold of <0.05. The most significant GO terms under the
biological processes category were enriched in the following
descending order: ‘cell cycle phase’ (GO:0022403), ‘M phase of
mitotic cell cycle’ (GO:0000087) and ‘mitotic cell cycle’
(GO:0000278). The most enriched GO terms under the molecular
functions and cellular components categories were ‘protein binding’
(GO:0005515) and ‘nuclear part’ (GO:0044428). The most enriched
KEGG pathway terms were (in descending order): ‘Cell cycle’
(kegg:04110), ‘Oocyte meiosis’ (kegg:04114) and ‘Ubiquitin mediated
proteolysis’ (kegg:04120) (Tables
IV and V).
| Table IV.The enrichment based on the top 10 GO
functions shows the top 100 upregulated and downregulated DEGs. |
Table IV.
The enrichment based on the top 10 GO
functions shows the top 100 upregulated and downregulated DEGs.
| GO ID | GO term | No. of Genes | P-value |
|---|
| GO:0022403 | Cell cycle
phase | 48 | 3.26E-18 |
| GO:0000087 | M phase of mitotic
cell cycle | 33 | 6.78E-18 |
| GO:0022402 | Cell cycle
process | 52 | 6.78E-18 |
| GO:0000278 | Mitotic cell
cycle | 45 | 6.78E-18 |
| GO:0044428 | Nuclear part | 70 | 6.12E-10 |
| GO:0031981 | Nuclear lumen | 64 | 1.48E-09 |
| GO:0044422 | Organelle part | 112 | 1.63E-09 |
| GO:0005515 | Protein
binding | 112 | 1.27E-05 |
| GO:0042975 | Peroxisome
proliferator activated receptor binding |
3 | 0.0097 |
| GO:0019899 | Enzyme binding | 25 | 0.0135 |
| Table V.The enrichment based on the top KEGG
pathway shows the top 100 upregulated and downregulated DEGs. |
Table V.
The enrichment based on the top KEGG
pathway shows the top 100 upregulated and downregulated DEGs.
| KEGG ID | KEGG pathway | No. of Genes | P-value |
|---|
| kegg:04110 | Cell cycle | 8 | 2.45E-06 |
| kegg:04114 | Oocyte meiosis | 7 | 9.76E-06 |
| kegg:04120 | Ubiquitin mediated
proteolysis | 5 | 0.0032 |
| kegg:03013 | RNA transport | 5 | 0.0036 |
| kegg:04610 | Complement and
coagulation cascades | 3 | 0.013 |
| kegg:04115 | p53 signalling
pathway | 3 | 0.013 |
| kegg:05200 | Pathways in
cancer | 6 | 0.013 |
| kegg:03060 | Protein export | 2 | 0.0144 |
| kegg:03008 | Ribosome biogenesis
in eukaryotes | 3 | 0.0152 |
| kegg:03440 | Homologous
recombination | 2 | 0.0168 |
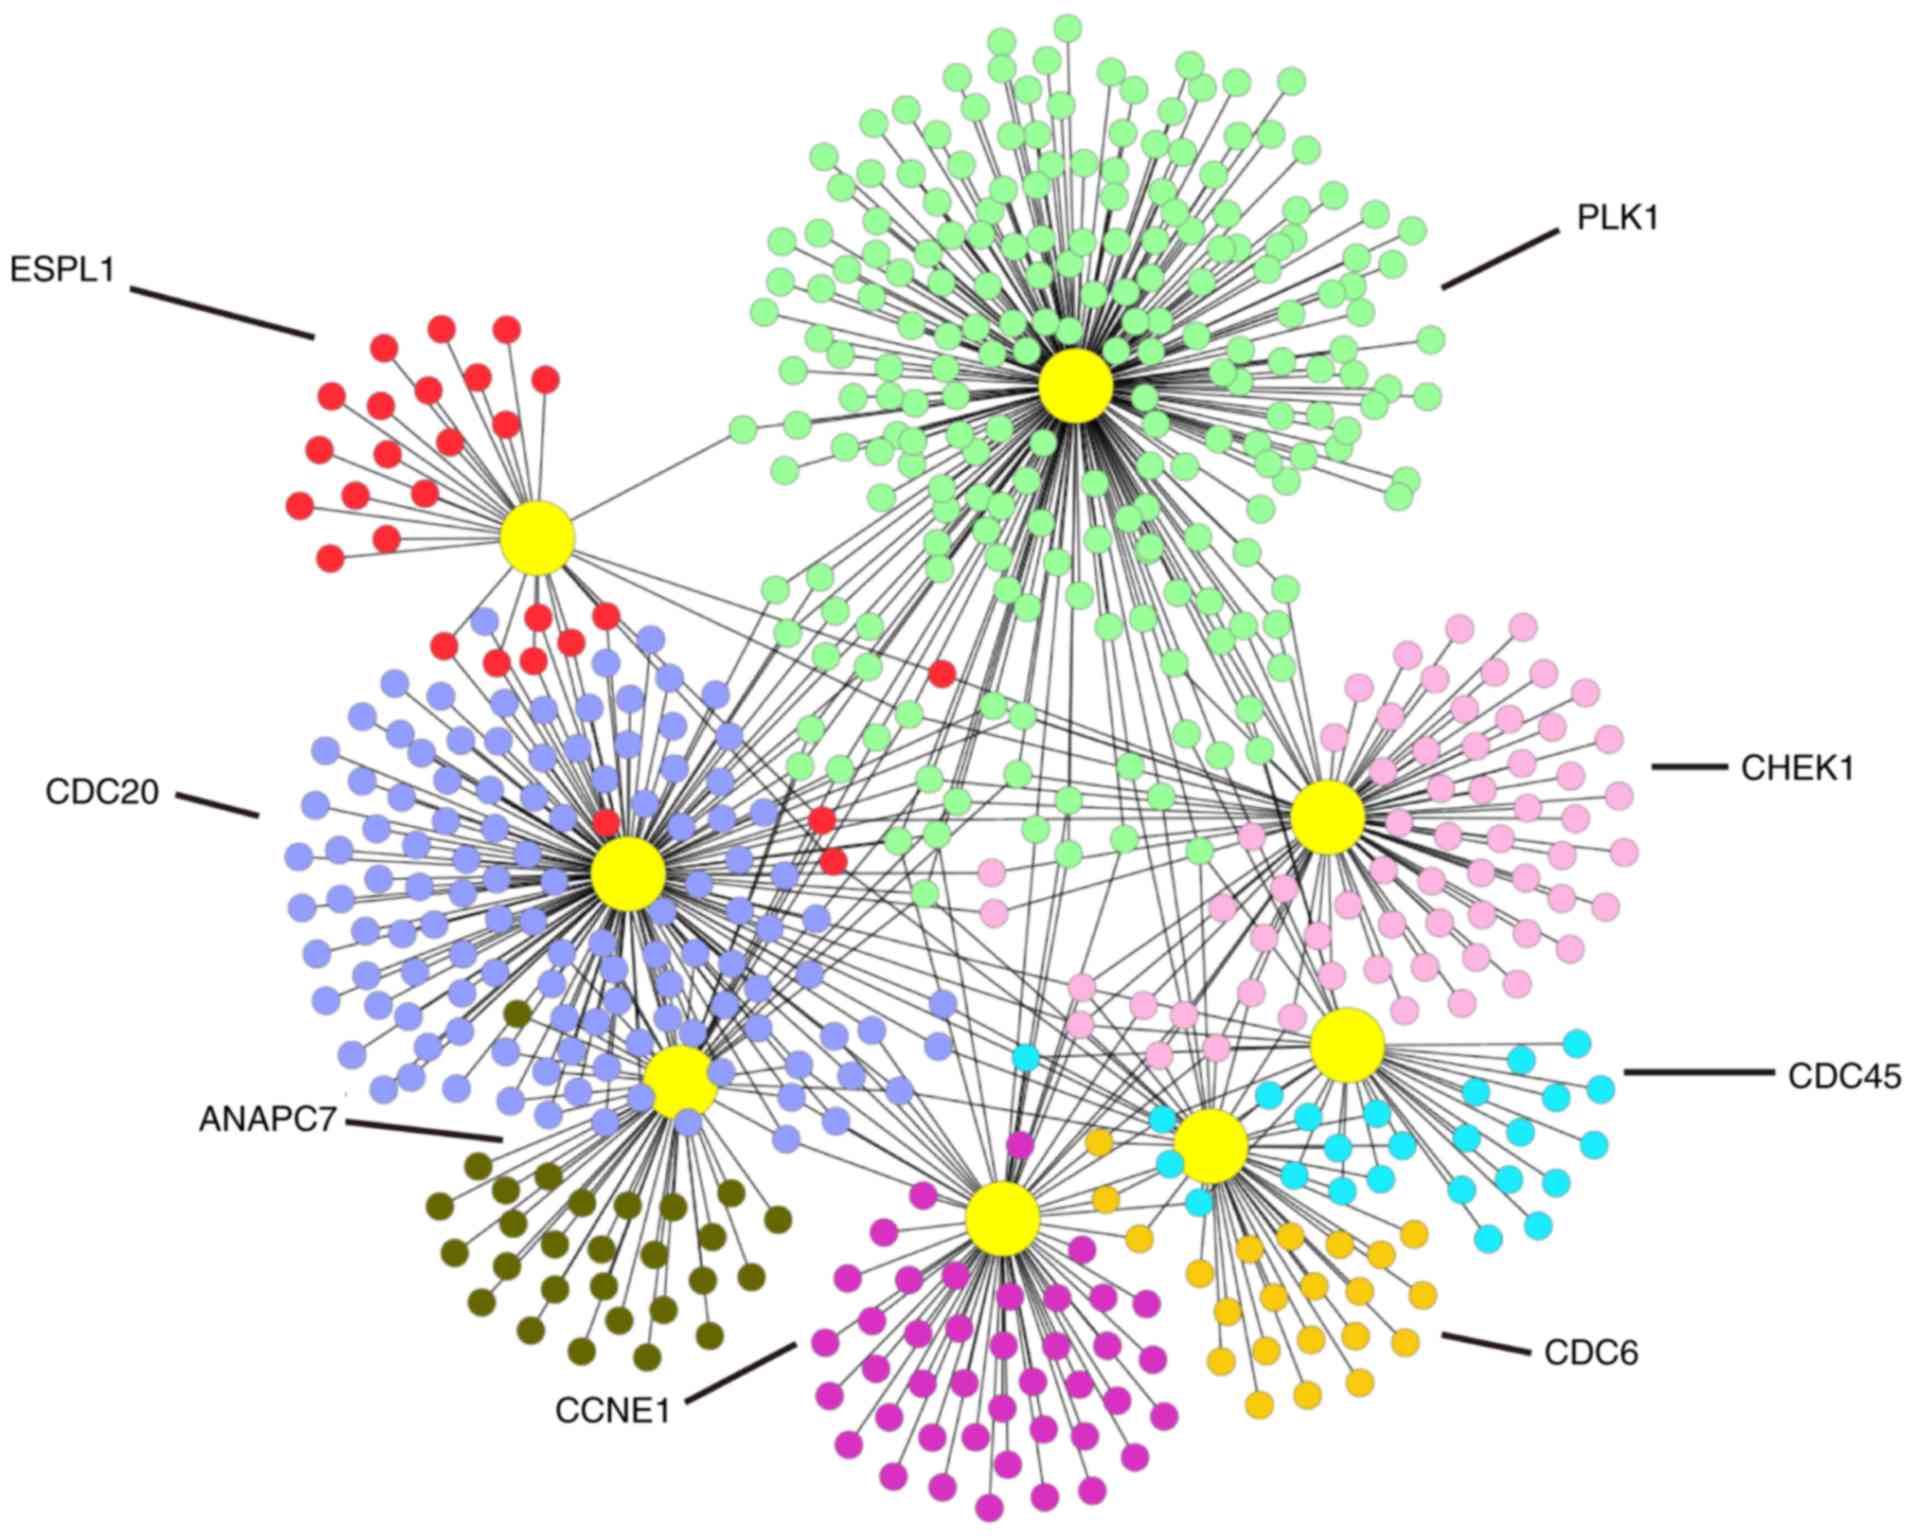
PPI network analysis of the DEGs
To understand the biological meaning of the 8
upregulated DEGs identified by the KEGG pathway under the cell
cycle pathway at the protein level, we constructed a PPI network
for the proteins encoded by the 8 DEGs with interactions that
included 541 nodes and 671 edges as shown in Fig. 7.
Discussion
In the present study, we showed that genes are
differentially expressed in lung adenocarcinoma in smoking and
non-smoking patients. Some genes that showed the highest expression
levels were found in lung adenocarcinoma patients who had a smoking
history. Smoking consistently plays an important role in the
development of lung adenocarcinoma. Cigarette smoke contains over
400 identified chemicals, at least 250 of which are implicated in
tumour initiation and promotion (21). It is estimated that more than 50
chemicals in tobacco smoke cause cancers (22). Cigarette smoke is by far the most
widespread link between exposure to known carcinogens and death
from lung cancer (23). Lung
adenocarcinoma is one of the main types of lung cancer in smokers
and cannot be successfully treated with traditional treatments.
Therefore, the effects of cigarette smoke on the genes that are
implicated in lung adenocarcinoma are critical to increase our
understanding of the carcinogenesis and in finding targeted genes.
In our study, we found that the cell cycle pathway was
significantly altered in lung adenocarcinoma tissues from patients
with a smoking history.
Using several perspectives would allow us to
characterise the underlying mechanisms of lung adenocarcinoma in
smokers. Thus, we performed a meta-analysis of four independent
microarray datasets using the same platform. The large number of
DEGs identified in our study implies that our approach produces
more reliable results in identifying differences in gene expression
levels among lung adenocarcinoma patients who either had a smoking
or a non-smoking history. In this study, the microarray expression
datasets derived from lung adenocarcinoma tissue with patients with
either a smoking or non-smoking history were publicly available. A
number of previous studies have molecularly characterised the
genetic profiles in lung cancer patients with or without a smoking
history. The present investigation focused on a relatively larger
cohort with 477 lung adenocarcinoma tissues from 327 smoking
patients and 150 non-smoking patients, thereby providing a more
powerful analysis. Our study results were highly consistent with
previous DEG analyses, supporting the utility and validity of this
analytical approach. Additionally, it also revealed that multiple
biological processes and pathways, including cell cycle phase and
the cell cycle pathway, were significantly affected in lung
adenocarcinoma tissues from smoking patients compared to the
non-smoking patients. Consistently, many previous studies have
revealed that cigarette smoke extract accelerated premature gene
mutations in the cell cycle pathway. Cigarette smoke extract alters
the cell cycle via the phospholipid transfer protein/transforming
growth factor-β1/cyclinD1/CDK4 pathway (24). Cigarette smoking is a major factor
for many cancers including, pancreatic cancer, human ovarian cancer
and colon cancer (25–27). This study identified the 8
overexpressed genes in the cell cycle pathway as CDC45, PLK1,
CDC20, ANAPC7, CDC6, CHEK1, CCNE1 and ESPL1. According to the
P-values in the meta-analysis, we identified a few significant DEGs
including CDC45, CDC20, ANAPC7, CDC6, and ESPL1. Based on our
meta-analysis results, these five genes may be potential target
genes for the treatment of this disease.
CDC45 is a member of the highly conserved
multiprotein complex including Cdc6/Cdc18. The replication factor
CDC45 has essential functions in the initiation and plays an
important role in the intra-S-phase checkpoint (28). CDC45 has been found to be
upregulated in many neoplasms, such as breast neoplasms, colorectal
neoplasms, lung neoplasms and haematological neoplasms (29).
CDC20 appears to act as a regulatory protein by
interacting with several other proteins at multiple points in the
cell cycle (30). The CDC20 gene
might play an important role in the malignancy of NSCLC.
Additionally, CDC20 has been found to be upregulated in lung cancer
patients with a smoking history (31). In addition, through this analysis,
we identified the overexpression of the CDC20 gene in lung
adenocarcinoma patients who had a smoking history compared to the
non-smoking patients. Combined with previous research, our analysis
demonstrates that the CDC20 gene might play an important role in
the treatment of lung adenocarcinoma in smoking patients.
ANAPC7 is an E3 ligase enzyme that ubiquinates
various proteins involved in the cell cycle (32). This protein complex may have a
pivotal role in the cell cycle control affecting pathological
conditions such as cancer (33).
ANAPC mutations have been reported in lung squamous cell carcinoma
and small cell lung carcinoma.
CDC6, a cell cycle regulatory gene, is an essential
regulator of DNA replication and plays important roles in the
activation and maintenance of the checkpoint mechanism in the cell
cycle (34). CDC6 has been
associated with the oncogenic activities in human cancers, such as
ovarian cancer, lung cancer and prostate cancer (35,36).
However, the biological function and clinical significance of CDC6
in lung adenocarcinoma remain unclear. A previous study suggests
that CDC6 is associated with the decline in lung function of
ex-smoking in COPD (37). Our study
also revealed CDC6 overexpression in lung adenocarcinoma patients
with a smoking history compared to non-smoking patients.
ESPL1 is a protein-coding gene, and its
overexpression has been found in a variety of human cancers such as
rectum adenocarcinoma, prostate carcinoma, breast carcinoma and
lung carcinoma (38,39). Consistent with earlier results, our
study revealed that ESPL is overexpressed in lung adenocarcinoma in
patients with a smoking history compared to those who had a
non-smoking history.
Overall, the present study identified that a few
genes are differentially expressed in lung adenocarcinoma samples
between smoker and non-smoker patients. This observation supports
previous studies; however, our analysis provides new insights that
enable better understanding of the molecular mechanisms of lung
adenocarcinoma in smokers, which may provide potential targets for
the therapeutic design of individualized treatments for lung
adenocarcinoma patients who have a smoking history.
Acknowledgements
This research was supported in part by grants form
the National Natural Science Foundation of China (31560314 to Q.L.)
and the Natural Science Foundation of Jiangxi Province
(2016BAB204168 to Q.L.).
References
|
1
|
Kalemkerian GP, Akerley W, Bogner P,
Borghaei H, Chow LQ, Downey RJ, Gandhi L, Ganti AK, Govindan R,
Grecula JC, et al National Comprehensive Cancer Network, : Small
cell lung cancer. J Natl Compr Canc Netw. 11:78–98. 2013.
View Article : Google Scholar : PubMed/NCBI
|
|
2
|
Pasche B and Grant SC: Non-small cell lung
cancer and precision medicine: A model for the incorporation of
genomic features into clinical trial design. JAMA. 311:1975–1976.
2014. View Article : Google Scholar : PubMed/NCBI
|
|
3
|
Saito M, Shiraishi K, Kunitoh H,
Takenoshita S, Yokota J and Kohno T: Gene aberrations for precision
medicine against lung adenocarcinoma. Cancer Sci. 107:713–720.
2016. View Article : Google Scholar : PubMed/NCBI
|
|
4
|
Ding L, Getz G, Wheeler DA, Mardis ER,
McLellan MD, Cibulskis K, Sougnez C, Greulich H, Muzny DM, Morgan
MB, et al: Somatic mutations affect key pathways in lung
adenocarcinoma. Nature. 455:1069–1075. 2008. View Article : Google Scholar : PubMed/NCBI
|
|
5
|
Weir BA, Woo MS, Getz G, Perner S, Ding L,
Beroukhim R, Lin WM, Province MA, Kraja A, Johnson LA, et al:
Characterizing the cancer genome in lung adenocarcinoma. Nature.
450:893–898. 2007. View Article : Google Scholar : PubMed/NCBI
|
|
6
|
de Mello RA, Madureira P, Carvalho LS,
Araújo A, O'Brien M and Popat S: EGFR and KRAS mutations, and ALK
fusions: Current developments and personalized therapies for
patients with advanced non-small-cell lung cancer.
Pharmacogenomics. 14:1765–1777. 2013. View Article : Google Scholar : PubMed/NCBI
|
|
7
|
Paul D and Rafael OC: Concurrent
targetable genetic driver alterations in KRAS-mutant lung
adenocarcinoma. Eur J Cancer. 60:e15–e16. 2016. View Article : Google Scholar
|
|
8
|
Nie Q, Yang XN, An SJ, Zhang XC, Yang JJ,
Zhong WZ, Liao RQ, Chen ZH, Su J, Xie Z, et al: CYP1A1*2A
polymorphism as a predictor of clinical outcome in advanced lung
cancer patients treated with EGFR-TKI and its combined effects with
EGFR intron 1 (CA)n polymorphism. Eur J Cancer. 47:1962–1970. 2011.
View Article : Google Scholar : PubMed/NCBI
|
|
9
|
Gow CH, Chang HT, Lim CK, Liu CY, Chen JS
and Shih JY: Comparable clinical outcomes in patients with
HER2-mutant and EGFR-mutant lung adenocarcinomas. Genes Chromosomes
Cancer. 56:373–381. 2017. View Article : Google Scholar : PubMed/NCBI
|
|
10
|
Raponi M, Winkler H and Dracopoli NC: KRAS
mutations predict response to EGFR inhibitors. Curr Opin Pharmacol.
8:413–418. 2008. View Article : Google Scholar : PubMed/NCBI
|
|
11
|
Wu C, Zhu J and Zhang X: Network-based
differential gene expression analysis suggests cell cycle related
genes regulated by E2F1 underlie the molecular difference between
smoker and non-smoker lung adenocarcinoma. BMC Bioinformatics.
14:3652013. View Article : Google Scholar : PubMed/NCBI
|
|
12
|
Andreev K, Trufa ID, Siegemund R, Rieker
R, Hartmann A, Schmidt J, Sirbu H and Finotto S: Impaired
T-bet-pSTAT1α and perforin-mediated immune responses in the tumoral
region of lung adenocarcinoma. Br J Cancer. 113:902–913. 2015.
View Article : Google Scholar : PubMed/NCBI
|
|
13
|
Talhout R, Schulz T, Florek E, van Benthem
J, Wester P and Opperhuizen A: Hazardous compounds in tobacco
smoke. Int J Environ Res Public Health. 8:613–628. 2011. View Article : Google Scholar : PubMed/NCBI
|
|
14
|
Li Y, Xiao X, Ji X, Liu B and Amos CI:
RNA-seq analysis of lung adenocarcinomas reveals different gene
expression profiles between smoking and nonsmoking patients. Tumour
Biol. 36:8993–9003. 2015. View Article : Google Scholar : PubMed/NCBI
|
|
15
|
Chee M, Yang R, Hubbell E, Berno A, Huang
XC, Stern D, Winkler J, Lockhart DJ, Morris MS and Fodor SP:
Accessing genetic information with high-density DNA arrays.
Science. 274:610–614. 1996. View Article : Google Scholar : PubMed/NCBI
|
|
16
|
Spies M, Dasu MR, Svrakic N, Nesic O,
Barrow RE, Perez-Polo JR and Herndon DN: Gene expression analysis
in burn wounds of rats. Am J Physiol Regul Integr Comp Physiol.
283:R918–R930. 2002. View Article : Google Scholar : PubMed/NCBI
|
|
17
|
Guo QM: DNA microarray and cancer. Curr
Opin Oncol. 15:36–43. 2003. View Article : Google Scholar : PubMed/NCBI
|
|
18
|
Li R, Wang H, Bekele BN, Yin Z, Caraway
NP, Katz RL, Stass SA and Jiang F: Identification of putative
oncogenes in lung adenocarcinoma by a comprehensive functional
genomic approach. Oncogene. 25:2628–2635. 2006. View Article : Google Scholar : PubMed/NCBI
|
|
19
|
Yasrebi H: Comparative study of joint
analysis of microarray gene expression data in survival prediction
and risk assessment of breast cancer patients. Brief Bioinform.
17:771–785. 2016. View Article : Google Scholar : PubMed/NCBI
|
|
20
|
Hong F, Breitling R, McEntee CW, Wittner
BS, Nemhauser JL and Chory J: RankProd: A bioconductor package for
detecting differentially expressed genes in meta-analysis.
Bioinformatics. 22:2825–2827. 2006. View Article : Google Scholar : PubMed/NCBI
|
|
21
|
Hecht SS: Tobacco carcinogens, their
biomarkers and tobacco-induced cancer. Nat Rev Cancer. 3:733–744.
2003. View
Article : Google Scholar : PubMed/NCBI
|
|
22
|
Brüske-Hohlfeld I: Environmental and
occupational risk factors for lung cancer. Methods Mol Biol.
472:3–23. 2009. View Article : Google Scholar : PubMed/NCBI
|
|
23
|
Taioli E: Gene-environment interaction in
tobacco-related cancers. Carcinogenesis. 29:1467–1474. 2008.
View Article : Google Scholar : PubMed/NCBI
|
|
24
|
Chai XM, Li YL, Chen H, Guo SL, Shui LL
and Chen YJ: Cigarette smoke extract alters the cell cycle via the
phospholipid transfer protein/transforming growth
factor-β1/CyclinD1/CDK4 pathway. Eur J Pharmacol. 786:85–93. 2016.
View Article : Google Scholar : PubMed/NCBI
|
|
25
|
Glauert HP, Elliott RS, Han SG, Athey M,
Lee EY and Gairola CG: Effect of cigarette smoke exposure and
mutant Kras overexpression on pancreatic cell proliferation. Oncol
Lett. 13:1939–1943. 2017. View Article : Google Scholar : PubMed/NCBI
|
|
26
|
Jeon SY, Go RE, Heo JR, Kim CW, Hwang KA
and Choi KC: Effects of cigarette smoke extracts on the progression
and metastasis of human ovarian cancer cells via regulating
epithelial-mesenchymal transition. Reprod Toxicol. 65:1–10. 2016.
View Article : Google Scholar : PubMed/NCBI
|
|
27
|
Schmidt U, Wollmann Y, Franke C, Grosse F,
Saluz HP and Hänel F: Characterization of the interaction between
the human DNA topoisomerase IIbeta-binding protein 1 (TopBP1) and
the cell division cycle 45 (Cdc45) protein. Biochem J. 409:169–177.
2008. View Article : Google Scholar : PubMed/NCBI
|
|
28
|
Tercero JA, Longhese MP and Diffley JFX: A
central role for DNA replication forks in checkpoint activation and
response. Mol Cell. 11:1323–1336. 2003. View Article : Google Scholar : PubMed/NCBI
|
|
29
|
Broderick R, Rainey MD, Santocanale C and
Nasheuer HP: Cell cycle-dependent formation of Cdc45-Claspin
complexes in human cells is compromized by UV-mediated DNA damage.
FEBS J. 280:4888–4902. 2013. View Article : Google Scholar : PubMed/NCBI
|
|
30
|
Weinstein J: Cell cycle-regulated
expression, phosphorylation, and degradation of p55Cdc. A mammalian
homolog of CDC20/Fizzy/slp1. J Biol Chem. 272:28501–28511. 1997.
View Article : Google Scholar : PubMed/NCBI
|
|
31
|
Pollok S, Bauerschmidt C, Sänger J,
Nasheuer HP and Grosse F: Human Cdc45 is a proliferation-associated
antigen. FEBS J. 274:3669–3684. 2007. View Article : Google Scholar : PubMed/NCBI
|
|
32
|
Rahimi H, Ahmadzadeh A, Yousef-amoli S,
Kokabee L, Shokrgozar MA, Mahdian R and Karimipoor M: The
expression pattern of APC2 and APC7 in various cancer cell lines
and AML patients. Adv Med Sci. 60:259–263. 2015. View Article : Google Scholar : PubMed/NCBI
|
|
33
|
Zhang X, Xiao T, Cheng S, Tong T and Gao
Y: Cigarette smoke suppresses the ubiquitin-dependent degradation
of OLC1. Biochem Biophys Res Commun. 407:753–757. 2011. View Article : Google Scholar : PubMed/NCBI
|
|
34
|
Borlado LR and Méndez J: CDC6: From DNA
replication to cell cycle checkpoints and oncogenesis.
Carcinogenesis. 29:237–243. 2008. View Article : Google Scholar : PubMed/NCBI
|
|
35
|
Sun T-Y, Xie H-J, Li Z, He H and Kong L-F:
Expression of CDC6 in ovarian cancer and its effect on
proliferation of ovarian cancer cells. Int J Clin Exp Med.
9:10544–10550. 2016.
|
|
36
|
Yun SJ, Kim YH, Kang HW, Kim WT, Kim YJ,
Lee SC, Kim W-J and Kim T: CDC6 mRNA expression is associated with
the aggressiveness of prostate cancer. Eur Urol Suppl.
15:e16252016. View Article : Google Scholar
|
|
37
|
Takabatake N, Toriyama S, Igarashi A,
Tokairin Y, Takeishi Y, Konta T, Inoue S, Abe S, Shibata Y and
Kubota I: A novel polymorphism in CDC6 is associated with the
decline in lung function of ex-smokers in COPD. Biochem Biophys Res
Commun. 381:554–559. 2009. View Article : Google Scholar : PubMed/NCBI
|
|
38
|
Finetti P, Guille A, Adelaide J, Birnbaum
D, Chaffanet M and Bertucci F: ESPL1 is a candidate oncogene of
luminal B breast cancers. Breast Cancer Res Treat. 147:51–59. 2014.
View Article : Google Scholar : PubMed/NCBI
|
|
39
|
Zhang N and Pati D: Biology and insights
into the role of cohesin protease separase in human malignancies.
Biol Rev Camb Philos Soc. 92:2070–2083. 2017. View Article : Google Scholar : PubMed/NCBI
|