Introduction
Renal cell carcinoma (RCC) represents >90% of all
kidney and renal pelvis cancer cases and ranks among the 10 most
common cancer types globally (1).
There are 3 major histologic subtypes of RCC: Clear cell RCC
(ccRCC), papillary RCC (pRCC) and chromophobe RCC. ccRCC accounts
for 75–80% of all RCC cases and the majority of mortality cases
from kidney cancer (2). Despite the
availability of numerous types of treatments, ~30% of patients with
ccRCC eventually develop metastasis, resulting in high mortality
rates (3).
Previous advances in high-throughput platforms to
profile genome-wide changes have contributed substantially to
improvements in the genomic and molecular characterization and
treatment of ccRCC (2,4,5).
Genetic alterations in a number of genes, including von
Hippel-Lindau tumor suppressor (VHL), polybromo 1, SET domain
containing 2, BRCA1 associated protein 1, lysine demethylase 5C and
mechanistic target of rapamycin kinase, are prevalent in ccRCC
(6). Genetic loss of the tumor
suppressor gene VHL, which was originally identified in von
Hippel-Lindau disease, is the best recognized gene associated with
the development of ccRCC. Loss of VHL, which is located at
chromosome 3p25 and encodes phosphorylated (p-)VHL, is the
characteristic genetic alteration of ccRCC and is believed to occur
at a very early step in renal carcinogenesis (5). VHL inactivation increases the risk of
developing ccRCC, whereas the restoration of VHL function in VHL−/−
ccRCC cells is sufficient to inhibit tumorigenesis in vivo
(7).
C-Type Lectin Domain Family 3 Member B (CLEC3B), a
member of the C-type lectin superfamily, encodes tetranectin in
cells (8). Tetranectin was
originally isolated from human plasma in 1986 (9). Tetranectin binds to kringle 4 of
plasminogen in a lysine-dependent manner and regulates proteolytic
processes via the activation of plasminogen (9). Tetranectin has been reported to
regulate mineralization in osteogenesis (10), myogenesis and muscle development
(11) in addition to cardiovascular
disease (12,13). A previous study has also proposed a
neuroprotective role of this gene in Parkinson's disease (14).
In malignancies, the expression and function of
CLEC3B remain poorly studied and controversial. A decreased level
of tetranectin was identified in blood samples from patients with
various cancer types, including ovarian cancer, myeloma, breast
cancer, colon carcinoma, B-chronic lymphocytic leukemia, oral and
pancreatic cancer (15–19), but not in blood samples from
patients with endometrial adenocarcinoma (20). Low levels of serum tetranectin
correlate with cancer progression and unfavorable survival rates
(21) and predict patients with a
poor chemotherapy response (22).
In addition to the serum, the expression of CLEC3B has also been
detected within the stroma and cancer cells of tumor tissues with
varied expression statuses and distribution patterns, but the
expression of CLEC3B correlates with inverse prognosis outcomes,
suggesting that CLEC3B may exert distinct functions in a
cancer-specific manner. Chen et al (23) revealed that CLEC3B expression was
significantly downregulated in gastric tumor tissues and that a
high intratumoral tetranectin level was correlated with advanced
tumor progression and shorter survival time. In breast cancer,
CLEC3B exhibits high cellular protein expression in 69% of tumor
tissues, predicting a poorer survival time (24). However, positive tetranectin
expression in ovarian cancer tissues predicts a more favorable
prognosis (25). So far, there are
no reports on the genetic alterations, tissue expression and the
functional role of CLEC3B in ccRCC. Therefore, the present study
aimed to investigate the expression and potential role of CLEC3B in
ccRCC.
Materials and methods
Computational analysis of the CLEC3B
transcriptional levels in ccRCC
RNA-seq data for the paired samples of 72 patients
with ccRCC (including 20 female and 52 male patients, age range
from 38 to 90, mean age, 62.5) from a The Cancer Genome Atlas
(TCGA) dataset (https://cancergenome.nih.gov/) were obtained on July
20, 2017 and Fragments Per Kilobase of transcript per Million
normalized expression values were used to compare CLEC3B mRNA
expression between cancer tissues and matched normal tissues. For
validation, Robust Multi-chip Average normalized mRNA expression
data of Beroukhim's ccRCC cohort (GSE14994) from a Gene Expression
Omnibus (GEO) database (https://www.ncbi.nlm.nih.gov/geo/) were obtained on
December 12, 2017 and analyzed using the GEO2R online tool
(https://www.ncbi.nlm.nih.gov/geo/geo2r/), containing
55 cancerous and 11 non-paired normal kidney tissues.
Immunohistochemistry (IHC) analysis of
the CLEC3B protein levels in ccRCC
Tissue microarray IHC analysis was performed with a
standard protocol to evaluate the expression levels of CLEC3B
protein in ccRCC. A total of 19 patients (12 male and 7 female, age
range from 39 to 76, mean age 56.5 who underwent surgical resection
between February 2008 and June 2008 at Beijing Chaoyang Hospital)
containing tumorous and adjacent normal tissues in a ccRCC tissue
microarray were included as valid cases for statistical analysis.
Written informed patient consent was obtained from all patients
prior to the study. Briefly, the formalin-fixed (24–48 h at room
temperature), paraffin-embedded (58–60°C for ~10 min) tissue
sections at a thickness of 4 µm were initially treated with
deparaffinization and hydration, and then subjected to the
heat-induced epitope retrieval using 0.01 mol/citrate buffer at pH
6.0 for 30 min in a pressure cooker. Sections were blocked with 5%
goat serum for 30 min at room temperature and were subsequently
incubated overnight at 4°C with the primary anti-rabbit Tetranectin
monoclonal antibody (1:300; cat. no. ab108999, Abcam, Cambridge,
UK), and then incubated with horseradish peroxidase-conjugated goat
anti-rabbit IgG secondary antibodies (1:1,000; cat. no. ZB-2301;
OriGene Technologies, Inc., Rockville, MD, USA) for 30 min at 4°C.
Immunolabeling was detected using a diaminobenzidine (DAB)
Detection kit (cat. no. ZLI-9017; OriGene Technologies, Inc.).
Subsequent to rinsing in water for 10 min, the sections were
counterstained with 0.5% hematoxylin (cat. no. ZLI-9609; OriGene
Technologies, Inc.) for 1.5 min at room temperature.
Immunohistochemical signals were captured under a light microscope
(Olympus Corporation, Tokyo, Japan) at a magnification of ×200.
Copy number variation analysis
Putative copy-number calls determined using GISTIC
2.0 for the TCGA datasets were analyzed for copy-number variation
(CNV) analysis (26). The
cBioPortal for Cancer Genomics (http://www.cbioportal.org/) (27) was used to illustrate the CNV status
of CLEC3B in ccRCC and other cancer types. Comparison of the copy
numbers in 489 ccRCC tissues, 43 papillary renal cell carcinoma
tissues, 441 paired normal kidney tissues and 98 paired normal
blood specimens from the TCGA dataset was conducted using Oncomine
analysis (28). The genomic
distribution of CLEC3B and VHL was queried in Ensemble (https://asia.ensembl.org/index.html).
Cell line culture
The human ccRCC cell lines 786-O,769-P, ACHN and
Caki-1 were all purchased from the National Infrastructure of Cell
Line Resources (Beijing, China). Cells were cultured in Dulbecco's
modified Eagle's medium (Hyclone; GE Healthcare Life Sciences,
Logan, UT, USA) containing 10% fetal bovine serum (Gibco; Thermo
Fisher Scientific, Inc., Waltham, MA, USA) at 37°C in a humidified
incubator with 5% CO2.
Plasmid transfection
The complete CLEC3B coding sequence was cloned into
the pCMV6-Entry vector (OriGene Technologies, Inc., Rockville, MD,
USA), and transfected into 786-O and 769-P cells using
Lipofectamine 2000 (Invitrogen; Thermo Fisher Scientific, Inc.)
according to the manufacturer's protocol. pCMV6-Entry vector alone
transfection was used as a negative control.
Western blot analysis
For western blot analysis, the transfected and
control 786-O and 769-P cells were harvested 48 h after
transfection and lysed in RIPA buffer (Beyotime Institute of
Biotechnology, Haimen, China) for 30 min at 4°C, and the protein
concentrations were quantified using a BCA kit (Sigma-Aldrich;
Merck KGaA, Darmstadt, Germany). Samples were boiled in loading
buffer for 10 min at 95°C. Proteins (40 µg per lane) were loaded
and separated by 10% SDS PAGE and then transferred onto a
polyvinylidene fluoride membrane (EMD Millipore, Billerica, MA,
USA). The membrane was blocked in 5% skim milk diluted with
tris-buffered saline with 0.1% Tween-20 (TBST) for 1 h at 4°C.
Then, the membrane was incubated with the following first
antibodies overnight at 4°C: Anti-Tetranectin (cat. no. ab108999;
1:1,000 dilution, Abcam), anti-β-actin (cat. no. #8457; 1:3,000
dilution), GAPDH (cat. no. #5174; 1:2,000 dilution), P38 (cat. no.
#9212; 1:1,000 dilution), phosphorylated (p)-P38 (cat. no. #4511;
1:1,000 dilution), extracellular signal-regulated kinase (ERK; cat.
no. #9102; 1:1,000 dilution), p-ERK (cat. no. #4376; 1:1,000
dilution) (all Cell Signaling Technology, Inc., Danvers, MA, USA)
and anti-Ki-67 (cat. no. ZM-0166; 1:1,000 dilution; OriGene
Technologies, Inc.). Following washing with TBST 3 times, the
membrane was subsequently incubated with horseradish peroxidase
(HRP)-conjugated goat anti-mouse or goat anti-rabbit IgG secondary
antibodies (cat. nos. ZB-2305 and ZB-2301; 1:8,000 dilution;
OriGene Technologies, Inc.) for 1 h at 4°C. Subsequent to the final
wash with TBST 3 times, the signal was detected using
chemiluminescent HRP substrate (EMD Millipore) on a Bio-Rad imaging
system (Bio-Rad ChemiDoc MP, 1708195; Bio-Rad Laboratories, Inc.,
Hercules, CA, USA). The experiments were replicated at least three
times, and the results were analyzed using Image J 1.46r software
(National Institutes of Health, Bethesda, MD, USA).
In vitro cell proliferation
analysis
A real-time cell analyzer system (RTCA; xCELLigence;
ACEA Biosciences, San Diego, CA, USA) was used to monitor the cell
proliferation in real-time as previously described (29). This system is able to measure
electrical impedance variations and present the results as the cell
index which directly reflects cellular proliferation. A total of 48
h after cell transfection, 3,000 cells/well of 786-O and 769-P
cells were seeded in an E-plate. The E-plate was then placed into
in a RTCA device at 37°C with 5% CO2, and the cell index
was recorded automatically at 15-min intervals. The recorded curve
is presented as the cell index ± standard error of the mean.
Co-expression analysis
The TCGA kidney renal clear cell carcinoma (KIRC)
cohort (n=533) and another large ccRCC cohort (GSE2109, n=193) from
the GEO database were used to perform co-expression data mining
analysis using the R2: Genomics Analysis and Visualization Platform
(http://r2.amc.nl). For the selection of co-expressing
genes in the TCGA cohort, a screening criterion of P<0.00000001
was used, while for co-expressing genes in the GSE2109 cohort, the
screening criteria used was P<0.001. For Gene Ontology (GO)
analysis of the enriched biological processes (30), the Database for Annotation,
Visualization and Integrated Discovery (DAVID) Bioinformatics
Resources 6.8 was used (31).
Statistical analysis
Statistical analyses were performed using GraphPad
Prism 7.0 (GraphPad Software, Inc., La Jolla, CA, USA) or SPSS
Statistics version 22 (IBM Corp., Armonk, NY, USA). A paired
Student's t-test was used to compare CLEC3B mRNA expression in 72
TCGA paired samples, and a Mann-Whitney U test was used for
unpaired samples in GSE14994. To compare CLEC3B protein levels in
the 19 paired ccRCC tissues, a Binomial test was used. To determine
the association between CLEC3B and clinicopathological features, a
Mann-Whitney U test was used and the CLEC3B expression in TCGA KIRC
samples were stratified based on the American Joint Committee on
Cancer Tumor Node Metastasis (TNM) staging system (32) or Institute of Statistics of the
University of Paris/World Health Organization grading system
(32,33). For TNM, T: Size or direct extent of
the primary tumor; N: Degree of spread to reginal lymph nodes; M:
Presence of distant metastasis. For staging, stage I: T1 N0 M0;
stage II: T2 N0 M0; stage III: T3 or N1 with M0; stage IV: T4 or
M1. For grading, grade 1: tumors have nucleoli that are
inconspicuous and basophilic at a ×400 magnification; grade 2:
tumors have nucleoli that are clearly visible at a ×400
magnification and are eosinophilic; grade 3: Tumors have clearly
visible nucleoli at a ×100 magnification; grade 4: Tumors have
extreme pleomorphism or rhabdoid and/or sarcomatoid morphology. For
Kaplan-Meier analyses, the cut-off values (727 and 797.7,
respectively) for overall survival (OS) and disease-free survival
(DFS) rates were determined by the receiver operating
characteristic curve method and a log-rank test was used to compare
different survival curves. The Cox regression model was used for
univariate and multivariate survival analyses. For all correlation
analyses in the present study, a Pearson's test was used. The data
were presented as the mean ± standard deviation. P<0.05 was
considered to indicate a statistically significant difference.
Results
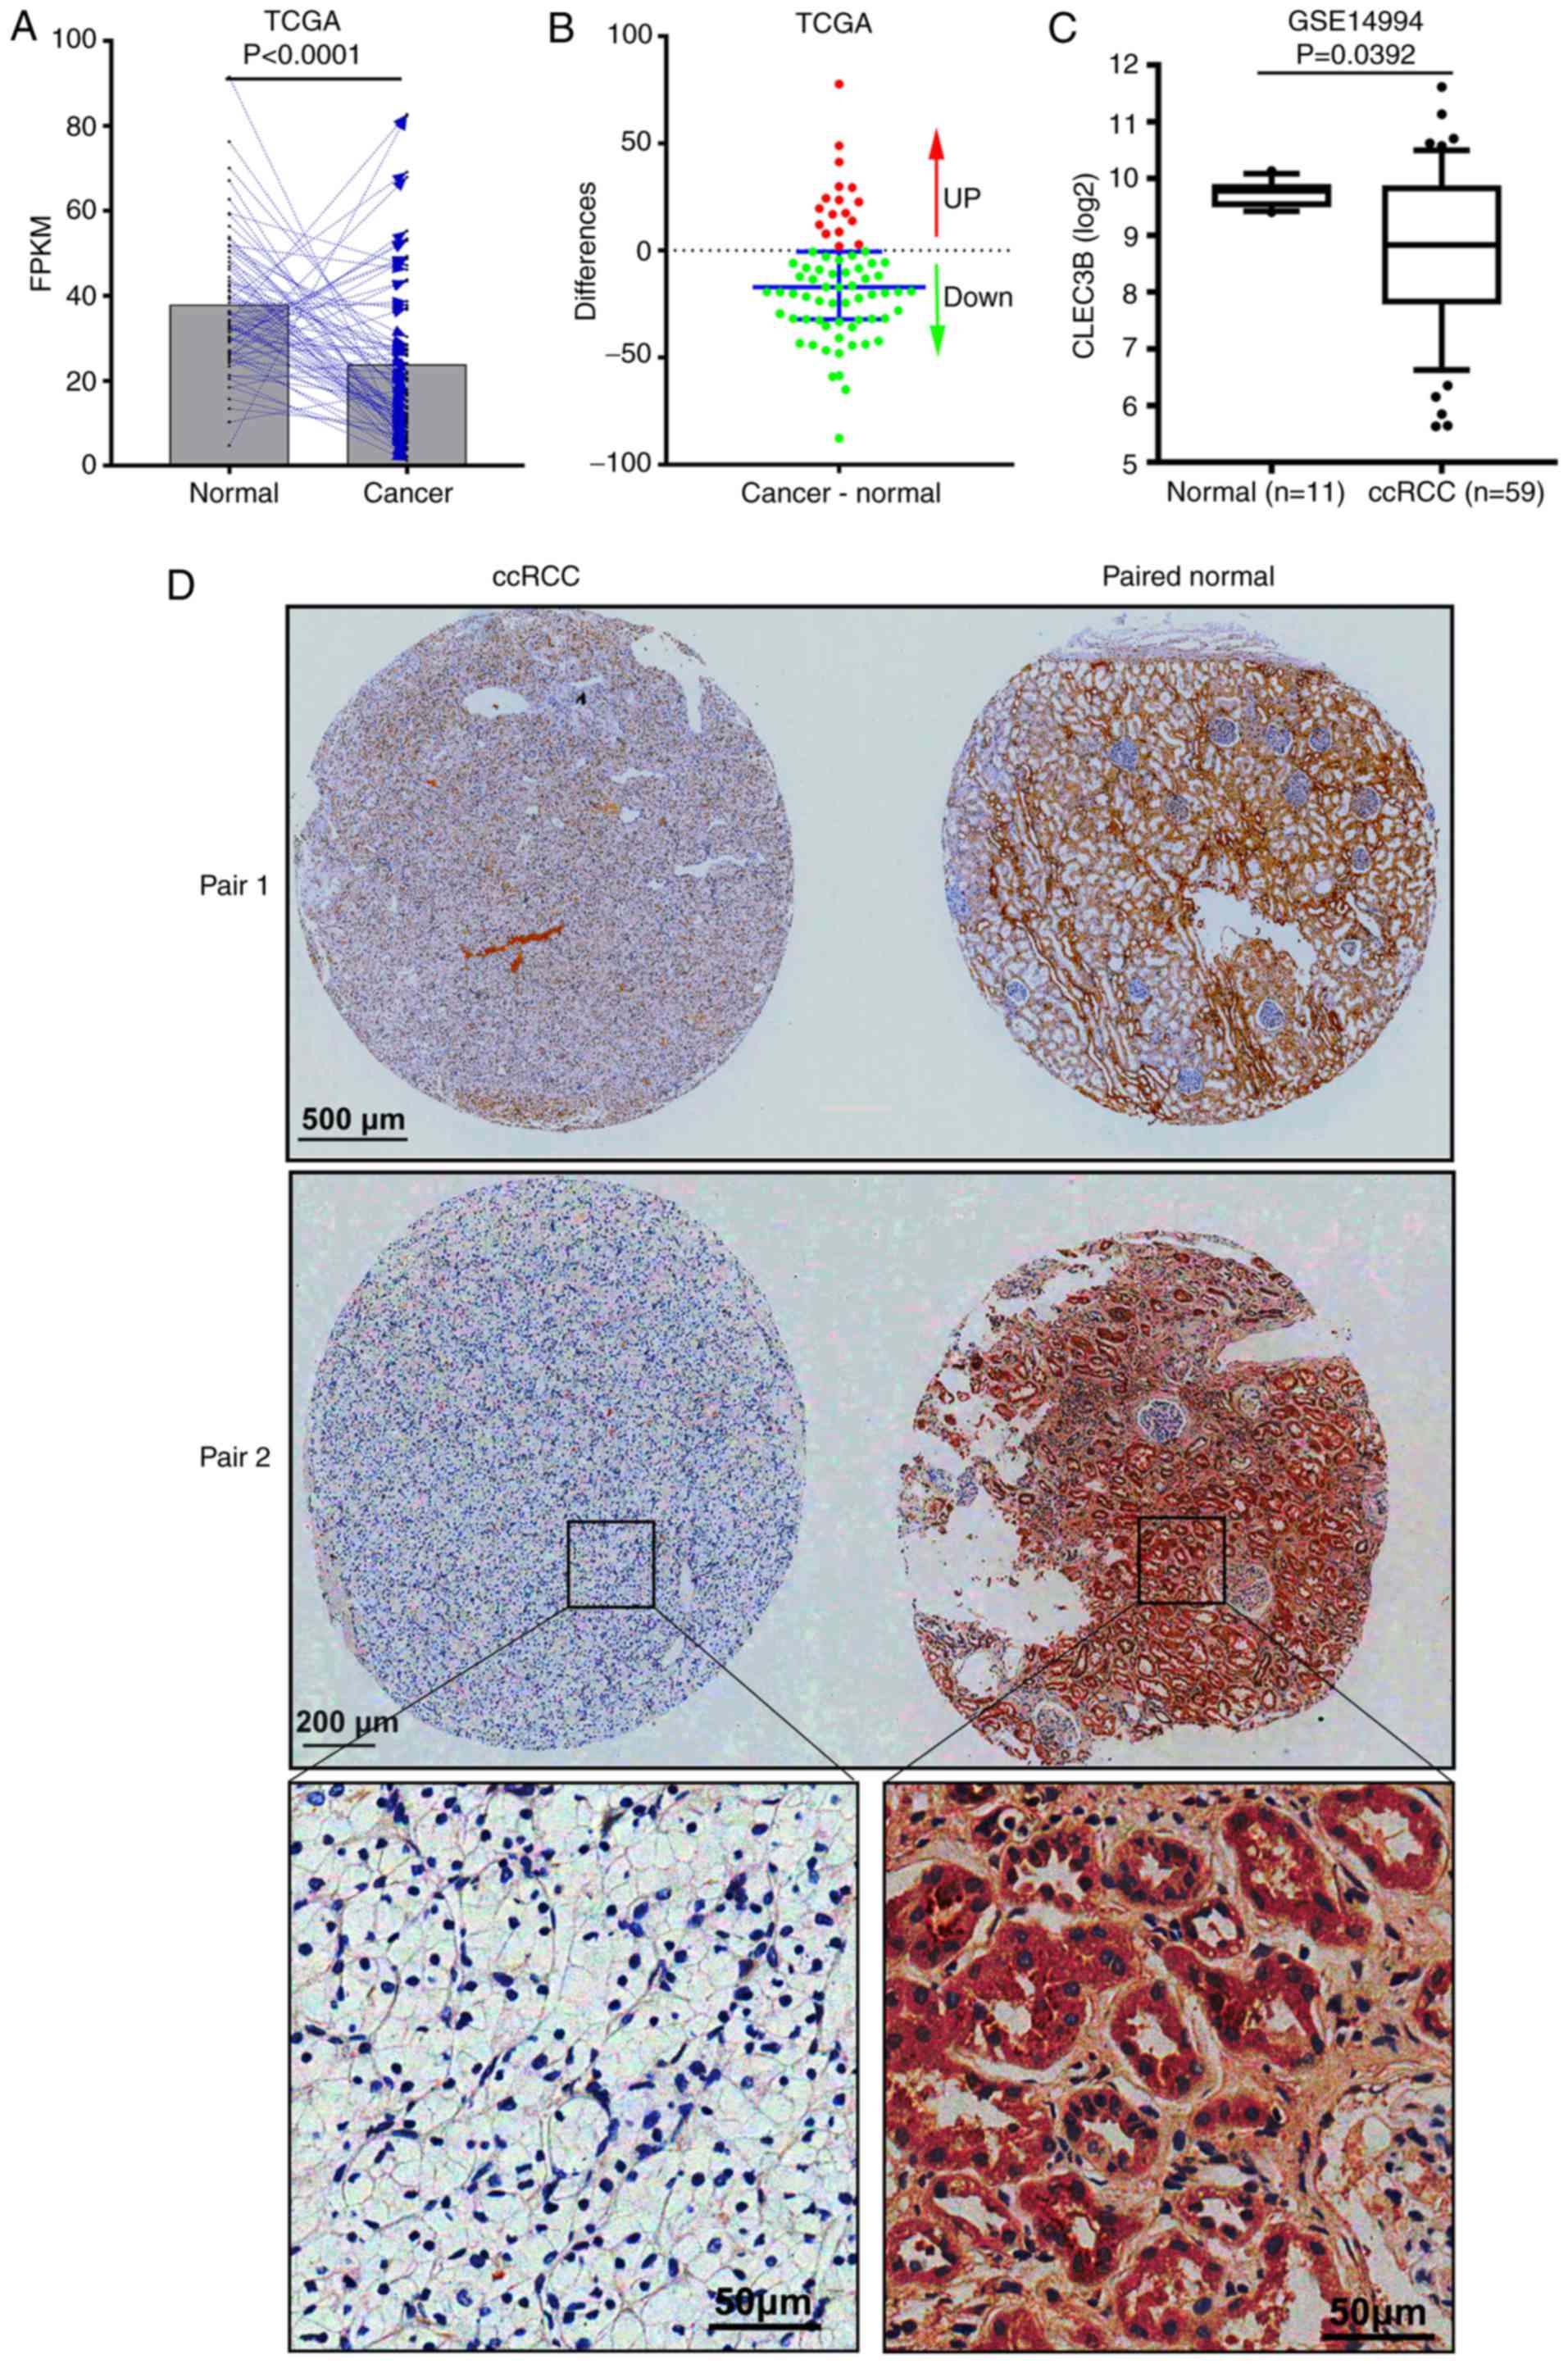
CLEC3B is downregulated in ccRCC
To examine the expression status of CLEC3B in ccRCC,
RNA-seq data from 72 patients with cancer and matched adjacent
normal tissues in the TCGA KIRC dataset was analyzed. The results
revealed that in comparison with the matched normal tissue, CLEC3B
mRNA was significantly downregulated in the cancerous tissue from
76.4% (55 of 72) of the patients with ccRCC (P<0.0001; paired
Student's t-test; Fig. 1A and B).
The downregulation of CLEC3B at the transcriptional level was
further verified in a GEO ccRCC dataset (GSE14994) from Beroukhim
(34) (P=0.0392; Mann-Whitney U
test; Fig. 1C). To further validate
this result, IHC staining was performed to assess CLEC3B expression
at the protein level in a cohort of 19 patients with ccRCC with
cancer and matched adjacent noncancerous tissues. In line with the
aforementioned mRNA results, a significant downregulation of CLEC3B
protein levels in matched ccRCC tissues (Fig. 1D), was observed in 78.9% (15 of 19)
of patients compared with the normal tissues (P=0.019; Binomial
test, two-tailed). These data suggest that CLEC3B is downregulated
in ccRCC at the mRNA and protein levels.
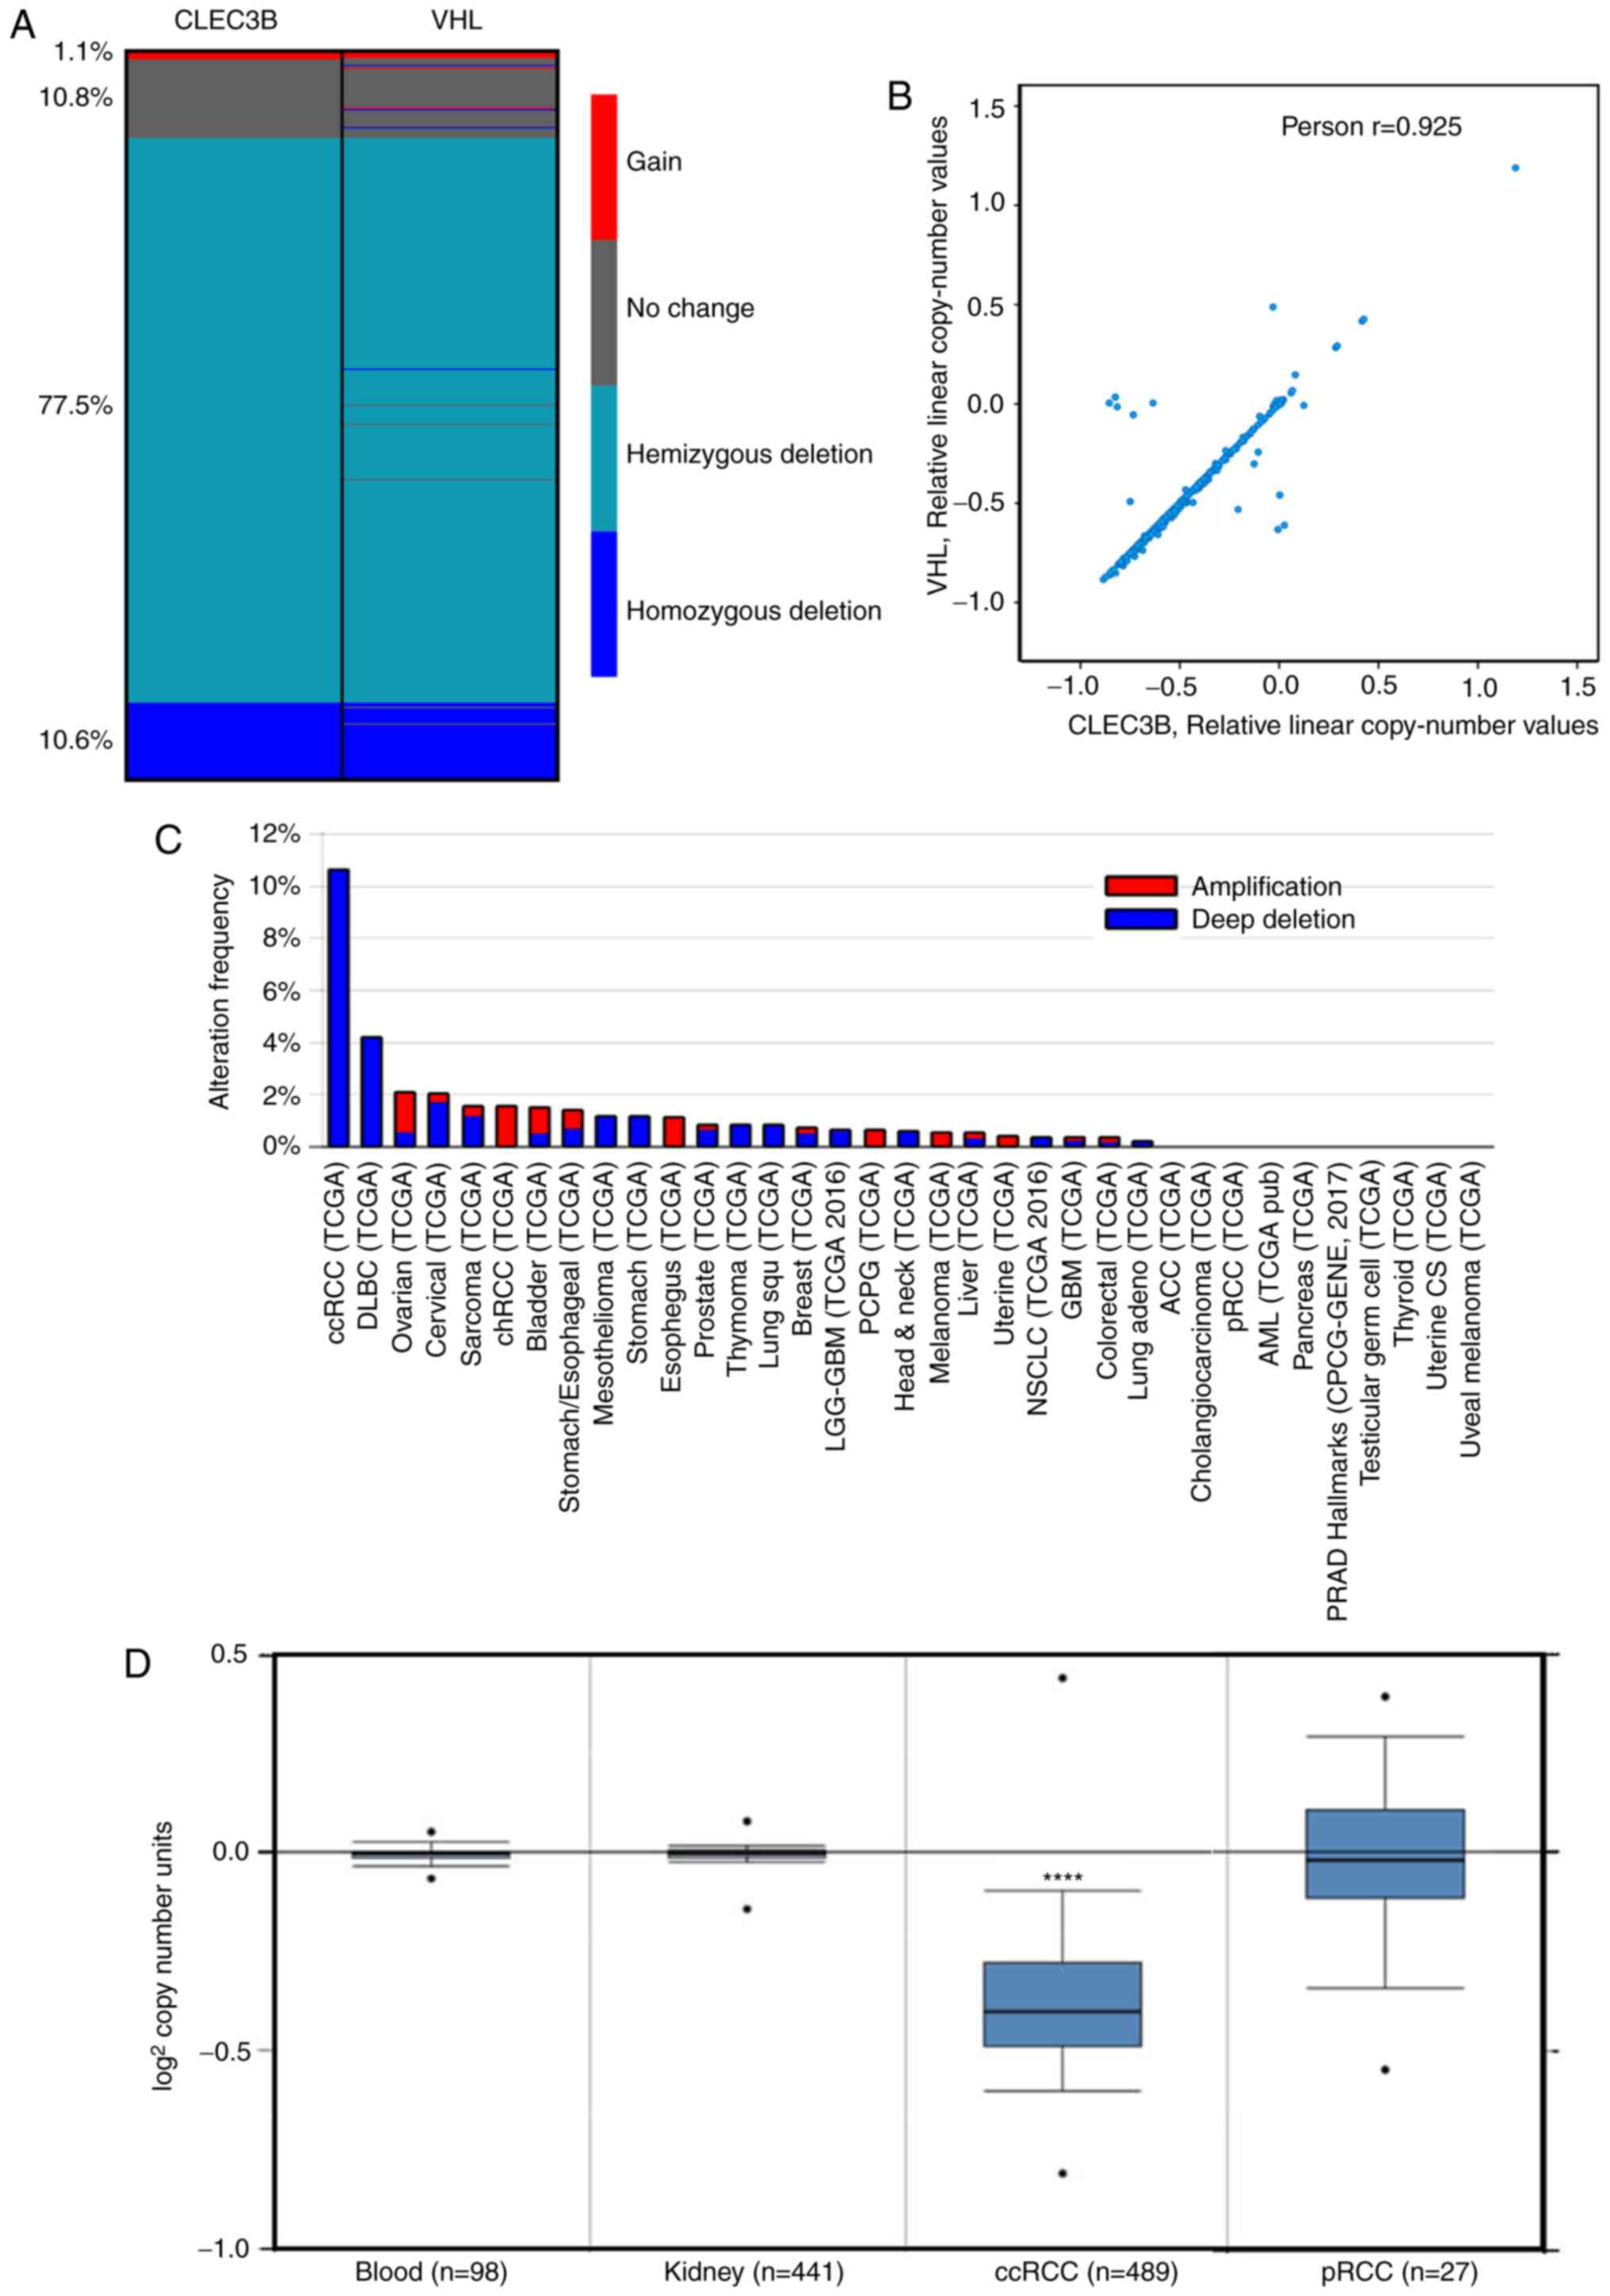
Copy number loss of CLEC3B is
prevalent and specific in ccRCC
DNA CNVs are common in cancer and are responsible
for the dysregulation of gene expression (35). To decipher the underlying mechanism
resulting in CLEC3B downregulation in ccRCC, copy number alteration
analysis was performed using the TCGA KIRC dataset. The results
demonstrated that the copy number loss of CLEC3B was detected in up
to 88.1% of patients with ccRCC, including 10.6% homozygous
deletions (deep deletion) and 77.5% hemizygous deletions. Only a
small proportion of patients (11.9%) were detected to have no
change (10.8%) or a gain of copy number (1.1%) (Fig. 2A).
Previous studies revealed that ~90% of ccRCC were
associated with the bi-allelic somatic mutation in the VHL tumor
suppressor gene (34,36). Therefore, considering the genetic
alterations between CLEC3B and VHL, it was revealed that the CNVs
of these two genes shared a similar deletion pattern in ccRCC
(Fig. 2A), and that the residual
copy numbers of the two genes were significantly correlated
(Pearson's; r=0.925, P<0.0001; Fig.
2B). Further inspection revealed that these two genes are
closely distributed in the genome, CLEC3B in 3p21.31 and VHL in
3p25.3, by Ensembl. Together, these data indicate that the copy
number loss events of CLEC3B and VHL are potentially coupled during
ccRCC tumorigenesis.
It was additionally observed that the copy number
loss of the CLEC3B gene appeared to be specific to ccRCC, as the
deep deletion frequency was substantially higher in ccRCC compared
with all other cancer types in the TCGA project (Fig. 2C). To delineate the potential role
of copy number loss in ccRCC development, the CNVs of the CLEC3B
gene in 489 ccRCC samples, 441 paired normal kidney tissue samples
and 98 paired normal blood specimen samples from TCGA dataset were
assessed. The results revealed that the CLEC3B gene copy number in
ccRCC was significantly lower compared with that in normal tissues
(P=1.07×10−163; Student's t-test; Fig. 2D); however, no significant change
was detected in another RCC subtype, pRCC (P=0.384; Student's
t-test; Fig. 2D). These results
indicate that the copy number loss is a ccRCC-specific oncogenic
driving event during tumorigenesis.
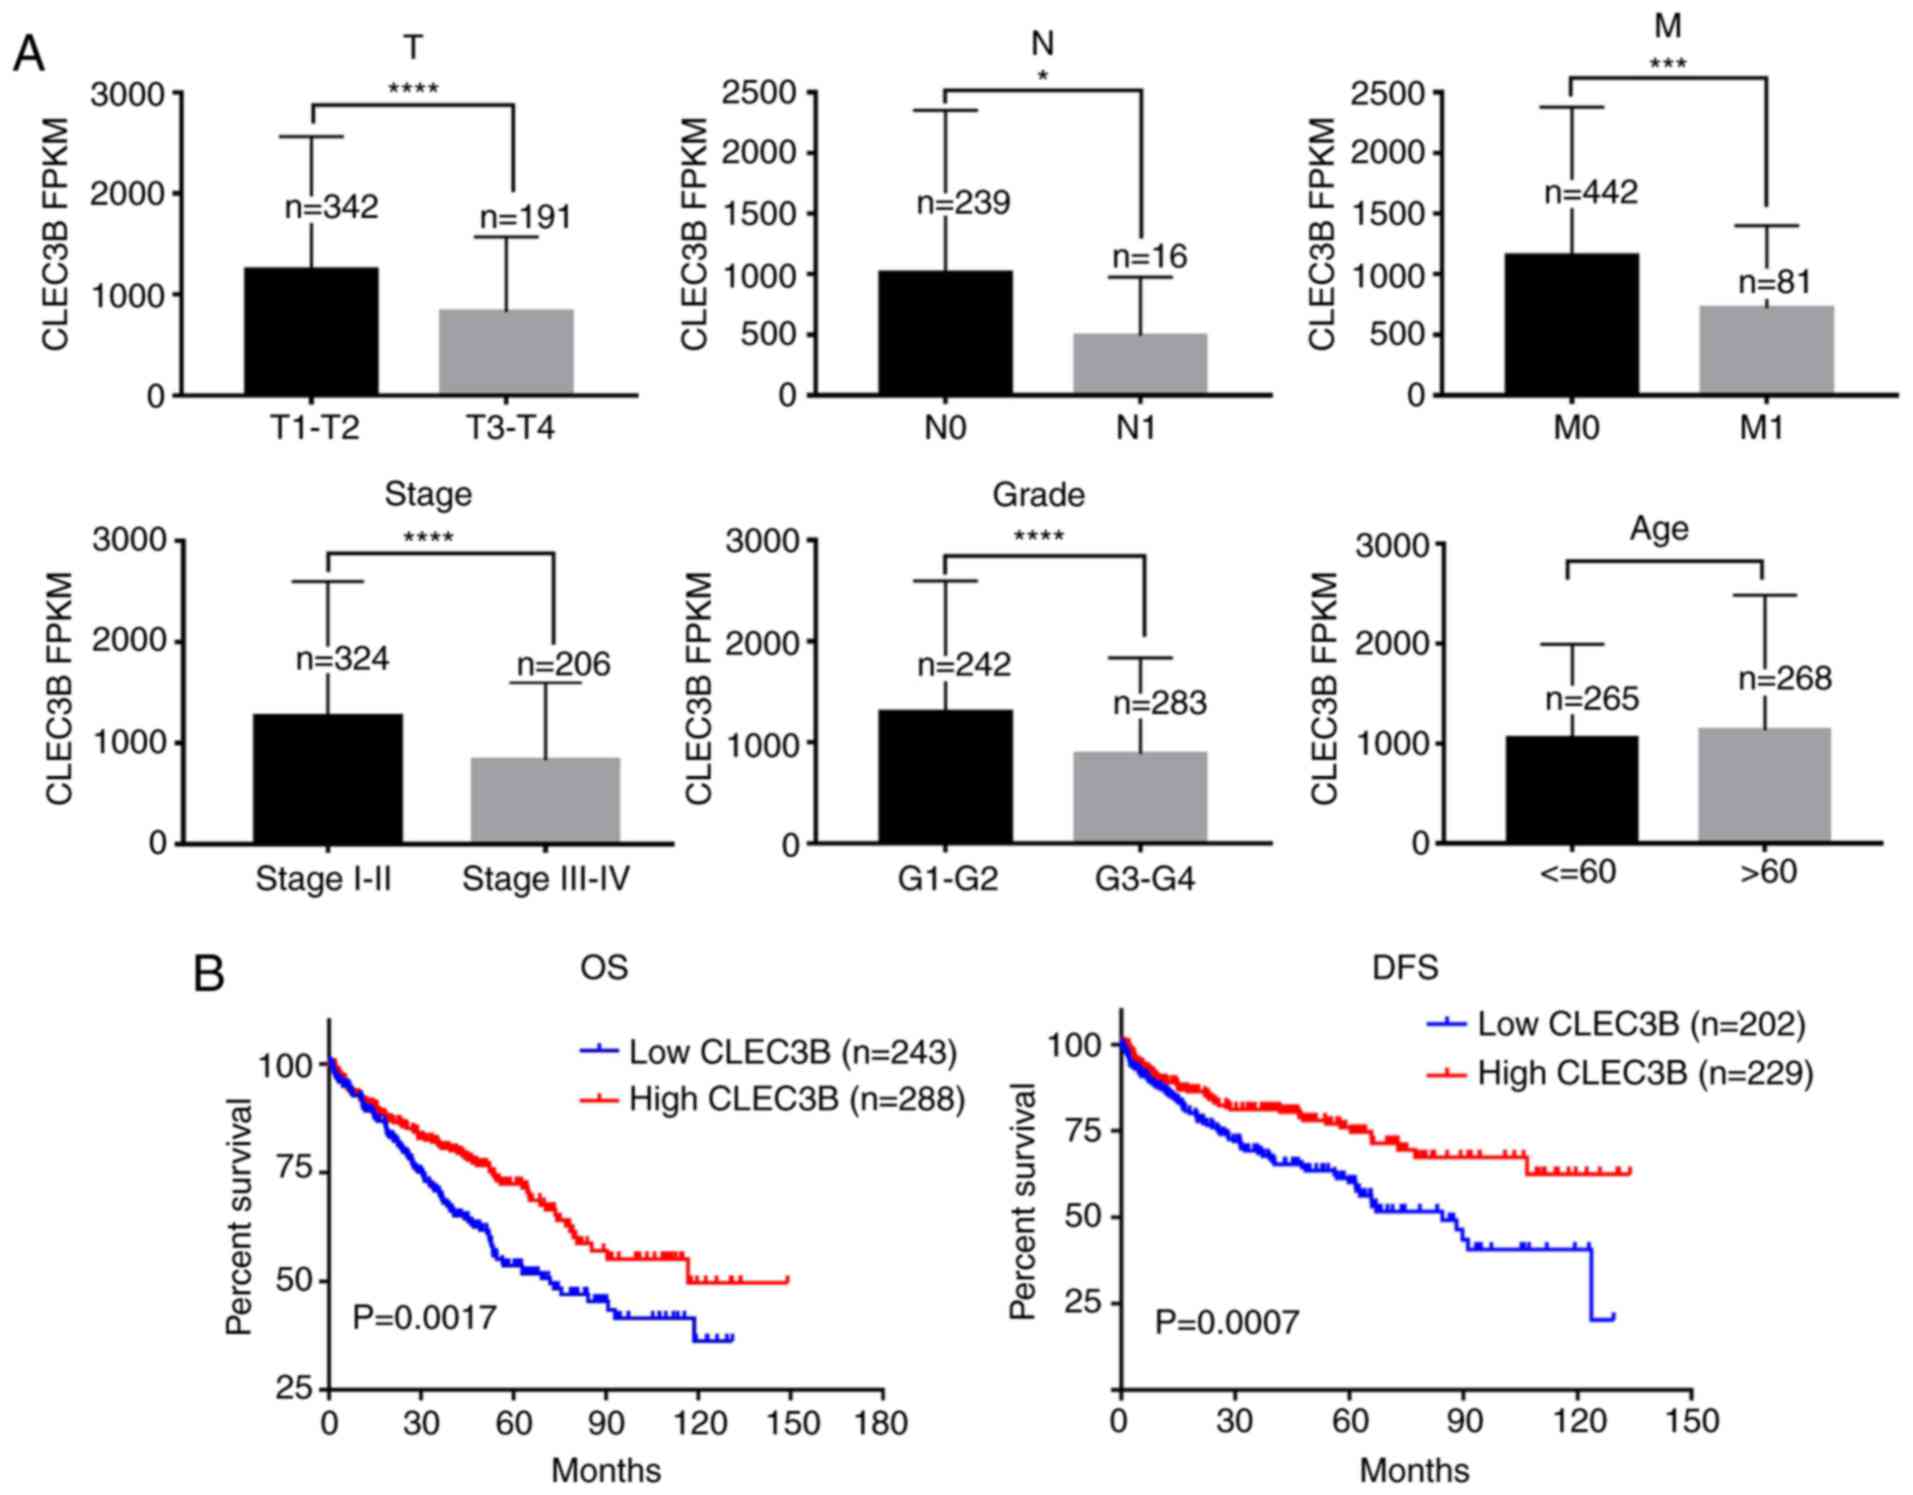
CLEC3B downregulation is associated
with ccRCC progression and prognosis
The association of CLEC3B downregulation with the
clinicopathologic features of the TCGA KIRC cohort were then
evaluated. The results revealed that the downregulated expression
of CLEC3B was significantly associated with a higher size or direct
extent of the primary tumor status of the tumor (P<0.0001),
higher lymph node metastasis (P=0.0107), higher distant metastasis
(P=0.0001), more advanced clinical stage (P<0.0001) and lower
differentiation (P<0.0001) but not with sex (P=0.0624) or age
(P=0.9971) (Table I, Fig. 3A).
 | Table I.Association between CLEC3B and the
clinicopathological features of clear cell renal cell
carcinoma. |
Table I.
Association between CLEC3B and the
clinicopathological features of clear cell renal cell
carcinoma.
|
|
| CLEC3B
expression |
|
|---|
|
|
|
|
|
|---|
| Clinicopathological
features | All cases | Mean | 95% confidence
interval | P-value |
|---|
| Sex |
|
| | 0.0624 |
|
Female | 188 | 1,120 | 994.5–1,246 |
|
|
Male | 345 | 1,080 | 943.2–1,218 |
|
| Age |
|
|
| 0.9971 |
|
≤60 | 265 | 1,056 | 942.3–1,169 |
|
|
>60 | 268 | 1,133 | 970.3–1,296 |
|
| T |
|
|
| <0.0001 |
|
T1-T2 | 342 | 1,243 | 1,102–1,383 |
|
|
T3-T4 | 191 | 829.5 | 723.5–935.4 |
|
| N |
|
|
| 0.0107 |
| N0 | 239 | 1,014 | 843.3–1,184 |
|
| N1 | 16 | 492.6 | 235.5–749.8 |
|
| M |
|
|
| 0.0001 |
| M0 | 442 | 1,154 | 1,039–1,268 |
|
| M1 | 81 | 722 | 571.8–872.2 |
|
| Stage |
|
|
| <0.0001 |
| Stage
I–II | 324 | 1,266 | 1,121–1,412 |
|
| Stage
III–IV | 206 | 831.9 | 726.1–937.7 |
|
| Grade |
|
|
| <0.0001 |
|
G1-G2 | 242 | 1,302 | 1,138–1,466 |
|
|
G3-G4 | 283 | 886.5 | 775.4–997.6 |
|
Kaplan-Meier survival analysis revealed that
patients with ccRCC with lower CLEC3B demonstrated a significantly
poorer OS and DFS rates compared with those with a high expression
of CLEC3B (P<0.05; Fig. 3B).
Further multivariate Cox regression analysis demonstrated that
CLEC3B downregulation was an independent prognostic factor for poor
OS rate [hazard ratio (HR) 0.722; 95% confidence interval (CI),
0.528 to 0.987; P=0.041; Table II)
and DFS rate (HR, 0.408; 95% CI, 0.587 to 0.845; P=0.004, Table III). In conclusion, these results
suggested that the downregulation of CLEC3B was frequently detected
in ccRCC and that its downregulation was associated with a higher
aggressiveness and poorer prognosis in patients with ccRCC.
| Table II.Univariate and multivariate Cox
regression analyses of overall survival rate in patients with clear
cell renal cell carcinoma from The Cancer Genome Atlas dataset. |
Table II.
Univariate and multivariate Cox
regression analyses of overall survival rate in patients with clear
cell renal cell carcinoma from The Cancer Genome Atlas dataset.
|
|
| Univariate Cox
regression |
|
|---|
|
|
|
|
|
|---|
| Variables | Classification | Overall survival
[hazard ratio (95% CI)] | P-value |
|---|
| Sex | Female vs.
male |  | 1.036
(0.754,1.425) | 0.826 |
| Age | ≤60 vs. >60 | 1.406
(1.039,1.902) | 0.027 |
| T | T1-T2 vs.
T3-T4 | 3.079
(2.269,4.179) | <0.001 |
| M | M0 vs. M1 | 0.719
(0.451,1.146) | 0.166 |
| Stage | Stage I–II vs.
Stage III–IV | 0.822
(0.603,1.122) | 0.218 |
| Grade | G1-G2 vs.
G3-G4 | 0.718
(0.532,0.969) | 0.030 |
| CLEC3B | Low vs. High | 0.604
(0.446,0.818) | 0.001 |
|
|
|
| Multivariate Cox
regression |
|
|
|
|
|
|
|
Variables |
Classification | Overall survival
[hazard ratio (95% CI)] | P-value |
|
| Sex | Female vs.
male |  |
|
|
| Age | ≤60 vs. >60 | 1.428
(1.046,1.949) | 0.025 |
| T | T1-T2 vs.
T3-T4 | 2.930
(2.124,4.044) | <0.001 |
| M | M0 vs. M1 | 0.826
(0.482,1.416) | 0.487 |
| Stage | Stage I–II vs.
Stage III–IV | 0.994
(0.685,1.443) | 0.976 |
| Grade | G1-G2 vs.
G3-G4 | 0.977
(0.702,1.359) | 0.889 |
| CLEC3B | Low vs. High | 0.722
(0.528,0.987) | 0.041 |
| Table III.Univariate and multivariate Cox
regression analyses of DFS rate in patients with clear cell renal
cell carcinoma from The Cancer Genome Atlas dataset. |
Table III.
Univariate and multivariate Cox
regression analyses of DFS rate in patients with clear cell renal
cell carcinoma from The Cancer Genome Atlas dataset.
|
|
| Univariate Cox
regression |
|
|---|
|
|
|
|
|
|---|
| Variables | Classification | DFS [hazard ratio
(95% CI)] | P-value |
|---|
| Sex | Female vs.
male |  | 1.186
(0.809,1.739) | 0.382 |
| M | M0 vs. M1 | 0.920
(0.527,1.606) | 0.770 |
| Age | ≤60 vs. >60 | 0.761
(0.528,1.096) | 0.142 |
| T | T1-T2 vs.
T3-T4 | 1.807
(1.265,2.581) | 0.001 |
| Stage | Stage I–II vs.
Stage III–IV | 0.591
(0.395,0.884) | 0.010 |
| Grade | G1-G2 vs.
G3-G4 | 0.773
(0.543,1.101) | 0.154 |
| CLEC3B | Low vs. High | 0.562
(0.392,0.805) | 0.002 |
|
|
|
| Multivariate Cox
regression |
|
|
|
|
|
|
|
|
| DFS [hazard
ratio (95% CI)] | P-value |
|
| Sex | Female vs.
male |
|
|
|
| M | M0 vs. M1 |  |
|
|
| Age | ≤60 vs. >60 | 1.411
(0.815,2.433) | 0.218 |
| T | T1-T2 vs.
T3-T4 | 1.820
(1.265,2.618) | 0.001 |
| Stage | Stage I–II vs.
Stage III–IV | 0.405
(0.219,0.794) | 0.004 |
| Grade | G1-G2 vs.
G3-G4 | 0.881
(0.608,1.275) | 0.500 |
| CLEC3B | Low vs. High | 0.408
(0.587,0.845) | 0.004 |
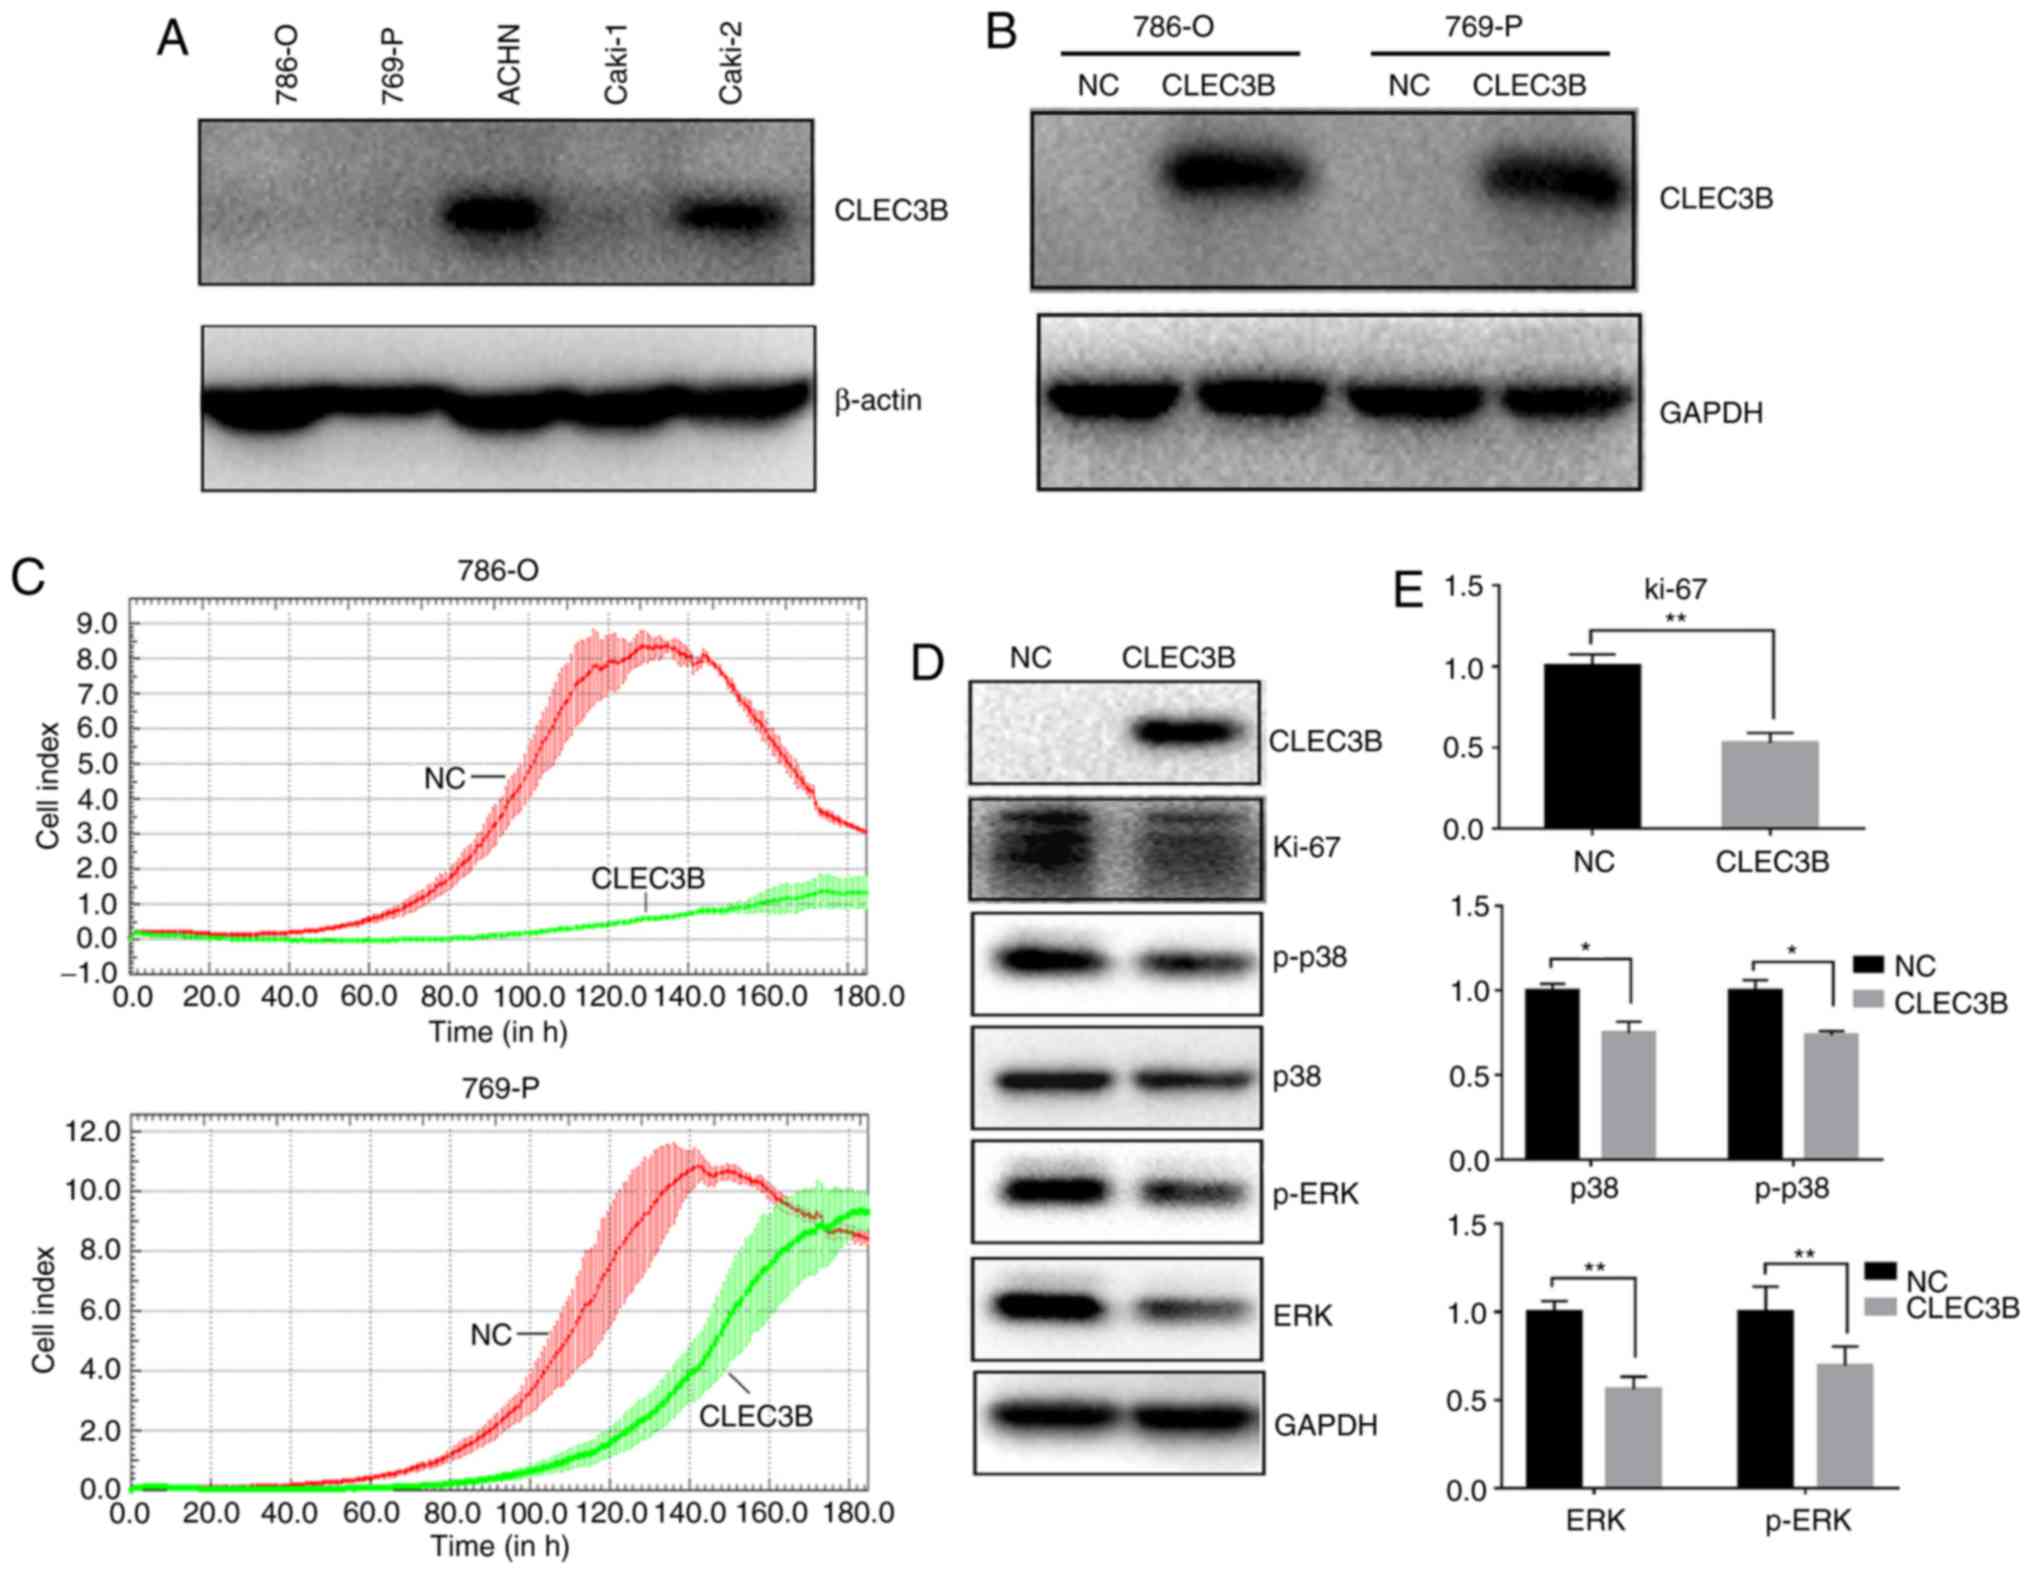
Induced CLEC3B expression decreases
the proliferation of ccRCC cell lines in vitro
To investigate the impact of CLEC3B on ccRCC in
vitro, the baseline levels of endogenous CLEC3B in a panel of 4
ccRCC cell lines (786-O,769-P, ACHN and Caki-1) were measured using
western blot analysis (Fig. 4A). It
was revealed that the 786-O,769-P and Caki-1 cell lines produced
substantially lower levels of endogenous CLEC3B expression compared
with the ACHN cell line, and 786-O and 769-P were selected for a
transient overexpression study. A total of 48 h after transfection,
the cells were collected and the successful overexpression of
CLEC3B in these two cell lines was confirmed by western blot
analysis (Fig. 4B). The transfected
cells were then subjected to a cell growth assay using a RTCA. The
results demonstrated that the forced expression of CLEC3B notably
reduced proliferation in the two cell lines compared with the
negative control (Fig. 4C).
Repression of proliferation was also indicated by the significantly
decreased level of the proliferative cellular marker Ki-67 in 786-O
cells transfected with CLEC3B compared with the negative control
(P<0.01; Fig. 4D and E). The
mitogen-activated protein kinase (MAPK) signaling pathway serves a
key role in the regulation of cancer cell proliferation (37). To decipher the potential underlying
mechanism, the effect of CLEC3B on the MAPK pathway in 786-O cells
was investigated and it was revealed that CLEC3B overexpression
resulted in a significant decrease of p38, p-p38, ERK and p-ERK
compared with the negative control (P<0.05; Fig. 4D and E), suggesting that the MAPK
pathway may contribute to the CLEC3B-mediated ccRCC proliferation
inhibition.
CLEC3B identifies ccRCCs with lower
proliferation
The gene co-expression network is crucial to
elucidate gene function, identify groups of genes that respond in a
coordinated manner to environmental or disease conditions, and
highlight regulatory associations (38). To address the function of CLEC3B in
patients with ccRCC, co-expression analysis using the TCGA KIRC
dataset was performed. As presented in Fig. 5A, CLEC3B exhibited an inverse
association with known proliferation inducers [MET proto-oncogene,
receptor tyrosine kinase (39),
epithelial cell transforming 2 (40) and enhancer of zeste 2 polycomb
repressive complex 2 subunit (41)], proliferative markers (marker of
proliferation Ki-67 and proliferating cell nuclear antigen) and
Minichromosome Maintenance genes (42), and revealed a positive association
with a spectrum of proliferation inhibitors, including frizzled
related protein (43), cadherin 13
(44), sprouty RTK signaling
antagonist 1 (45), SRY-box 7
(46), cyclin dependent kinase
inhibitor 2B (47), adenosine
deaminase, RNA specific B1 (48),
DLC1 RhO GTPase activating protein (49), SH3 domain binding protein 4
(50) and DAB2 interacting protein
(51), indicating a negative
function of CLEC3B in controlling proliferation in the TCGA cohort.
To validate this result, verification analysis was performed using
another ccRCC cohort (GSE2109, n=193) from the GEO database, and
revealed similar association trends for CLECB with all the above
proliferative factors (Fig. 5B).
This consistency indicates towards the anti-proliferation function
of CLEC3B in ccRCC tissues, in accordance with the in vitro
functional results. Furthermore, a significant negative correlation
between CLEC3B and p38 in the TCGA dataset was identified
(Pearson's, r=−0.284, P=2.4×10⁻¹¹; data not shown). To
provide a deeper understanding of the potential mechanism that
CLEC3B employs to modulate proliferation, GO analysis with CLEC3B
co-expressing genes in the TCGA and GSE2109 ccRCC cohorts was
performed. A total of 3,260 associated genes (1,912 positives and
1,348 negatives) were selected from the TCGA dataset according to a
screening criterion of P<0.00000001, and 1,947 associated genes
(1,282 positives and 665 negatives) were selected from GSE2109
using a screening criterion of P<0.001. The results revealed
that in the two large ccRCC cohorts, the co-expressing genes were
most highly enriched in the cell cycle (data not shown), a
regulatory event that is directly associated with the control of
cell proliferation. The other two most common highly enriched
functional items were development and kinase.
The 500 most positive and 500 most negative
co-expressers for CLEC3B were extracted from the two cohorts
according to the R-value. Significant overlaps were identified for
positive co-expressers (247; 49.4%; Fig. 5C) and negative co-expressers (158;
31.6%; Fig. 5D) in these two
groups, indicating the high reliability and sensitivity of the
co-expression analysis. To gain a more reliable interpretation, GO
analyses were conducted on the overlapped positive and negative
co-expressers in DAVID. The results revealed that the overlapped
positive co-expressers were enriched in development processes
(Fig. 5E), while the negative
co-expressers notably focused on the cell cycle process (Fig. 5F).
Discussion
Although the dysregulation of CLEC3B in various
cancer types has been observed for decades, its expression and
function remain obscure. Decreased levels of plasma CLEC3B are
consistent in the majority cancer types, but the expression and
prognostic significance of CLEC3B in cancer tissues remain
controversial (15,16,24,52,53).
To evaluate the expression of CLEC3B in ccRCC, which had not yet
been reported, the present study conducted a computational
profiling of the TCGA KIRC dataset and revealed a significant
downregulation of the CLEC3B transcript in tumor tissues. Decreased
CLEC3B protein expression in ccRCC was further validated by IHC
staining with a specific antibody against tetranectin, suggesting
that CLEC3B is downregulated in ccRCC at the mRNA and protein
levels.
Genetic alterations, including CNVs, serve an
essential role in the dysregulation of cancer genes (54). In the present study, by analyzing
CNV data from the TCGA database, it was revealed that CLEC3B loss
was notably prevalent in up to 88.1% of ccRCCs, including a
homozygous deletion in 10.6% of cases. The present study revealed
that the copy number loss of CLEC3B is high in ccRCC, but is not
notable in other cancer types, suggesting that CLEC3B loss is a
ccRCC-specific event. The chromosomal loss in the VHL gene locus is
the characteristic genetic alteration of ccRCC and is believed to
increase the risk of developing ccRCC (5,7). In
the present study it was revealed that the CLEC3B gene is lost in a
similar way to VHL, suggesting that they are two tightly coupled
events in ccRCC. Given that VHL loss is an early oncogenic driving
event in ccRCC tumorigenesis (5),
it was hypothesized that CLEC3B genetic loss is also a
characteristic signature in the ccRCC carcinogenic process, which
has not yet been revealed.
The present study also demonstrated that CLEC3B
downregulation in ccRCC correlates with more aggressive features
and predicts unfavorable prognostic outcomes for OS and DFS rates
in the TCGA cohort. The in vitro cell line experiments
indicate that CLEC3B functions to inhibit the proliferation of
ccRCC cell lines, and that the mechanism may involve the MAPK
pathway.
The co-expression network is a useful method to
identify genes that are coordinated under a similar functional
framework or disease conditions (38,55).
The present study verified that CLEC3B was positively associated
with proliferation inhibitors and inversely associated with
proliferation inducers or markers from two large independent ccRCC
cohorts, strongly indicating the anti-proliferation function of
CLEC3B in ccRCC, which was concurrent with the in vitro cell
line results. The co-expressing genes from the two cohorts were the
most functionally enriched in the cell cycle according to GO
analysis, an underlying mechanism that directly affects cell
proliferation, and additionally in development. Functional
clustering analysis using DAVID with the most highly associated and
common co-expressers from the two cohorts revealed that the
regulation of development (particularly in the cardiovascular and
renal system) may occur via CLEC3B and its positive co-expressers,
while cooperation between CLEC3B and its negative co-expressers may
be responsible for cell cycle regulation. The role of CLEC3B in
muscle development in addition to cardiovascular disease has
already been described (11–13),
but its role in cell cycle regulation remains unexplored and
requires future study.
Acknowledgments
Not applicable.
Funding
The present study was supported by the National
Natural Science Foundation of China (grant no. 81502384 to Dr Jian
Liu, grant no. 81572825 to Professor Guangyu An and grant no.
81672338 to Professor Tao Wen) and the Beijing Natural Science
Foundation (grant no. 7172083 to Professor Guangyu An).
Availability of data and materials
The datasets used and/or analyzed during the current
study are available from the corresponding author on reasonable
request.
Authors' contributions
GA and TW designed the study. JL, ZL and QL
generated the majority of the data. LL performed the western blot
analysis. XF constructed the plasmids and performed the
transfection. JL was a major contributor in writing the manuscript.
All authors read and approved the final manuscript.
Ethics approval and consent to
participate
The present study was approved by the Ethics
Committee of Beijing Chao-Yang Hospital, Capital Medical University
(approval no. 2017-8-23-17).
Patient consent for publication
Written informed consent was obtained from all
patients prior to the study.
Competing interests
The authors declare that they have no competing
interests.
Glossary
Abbreviations
Abbreviations:
|
CLEC3B
|
C-Type Lectin Domain Family 3 Member
B
|
|
CNV
|
copy number variation
|
|
TCGA
|
the Cancer Genome Atlas
|
|
KIRC
|
kidney renal clear cell carcinoma
|
|
GEO
|
Gene Expression Omnibus
|
|
ccRCC
|
clear cell renal cell carcinoma
|
|
VHL
|
von Hippel-Lindau Tumor Suppressor
|
|
pRCC
|
papillary renal cell carcinoma
|
|
OS
|
overall survival
|
|
DFS
|
disease-free survival
|
|
HR
|
hazard ratio
|
|
CI
|
confidence interval
|
|
RTCA
|
real-time cell analyzer system
|
References
|
1
|
Siegel RL, Miller KD and Jemal A: Cancer
statistics, 2017. CA Cancer J Clin. 67:7–30. 2017. View Article : Google Scholar : PubMed/NCBI
|
|
2
|
Rini BI, Campbell SC and Escudier B: Renal
cell carcinoma. Lancet. 373:1119–1132. 2009. View Article : Google Scholar : PubMed/NCBI
|
|
3
|
Wolff I, May M, Hoschke B, Zigeuner R,
Cindolo L, Hutterer G, Schips L, De Cobelli O, Rocco B, De Nunzio
C, et al: Do we need new high-risk criteria for surgically treated
renal cancer patients to improve the outcome of future clinical
trials in the adjuvant setting? Results of a comprehensive analysis
based on the multicenter CORONA database. Eur J Surg Oncol.
42:744–750. 2016. View Article : Google Scholar : PubMed/NCBI
|
|
4
|
Chen F, Zhang Y, Şenbabaoğlu Y, Ciriello
G, Yang L, Reznik E, Shuch B, Micevic G, De Velasco G, Shinbrot E,
et al: Multilevel genomics-based taxonomy of renal cell carcinoma.
Cell Rep. 14:2476–2489. 2016. View Article : Google Scholar : PubMed/NCBI
|
|
5
|
Kaelin WG Jr: The von Hippel-Lindau tumor
suppressor gene and kidney cancer. Clin Cancer Res. 10:6290S–5S.
2004. View Article : Google Scholar : PubMed/NCBI
|
|
6
|
Hsieh JJ, Purdue MP, Signoretti S, Swanton
C, Albiges L, Schmidinger M, Heng DY, Larkin J and Ficarra V: Renal
cell carcinoma. Nat Rev Dis Primers. 3:170092017. View Article : Google Scholar : PubMed/NCBI
|
|
7
|
Iliopoulos O, Kibel A, Gray S and Kaelin
WG Jr: Tumour suppression by the human von Hippel-Lindau gene
product. Nat Med. 1:822–826. 1995. View Article : Google Scholar : PubMed/NCBI
|
|
8
|
Tanisawa K, Arai Y, Hirose N, Shimokata H,
Yamada Y, Kawai H, Kojima M, Obuchi S, Hirano H, Yoshida H, et al:
Exome-wide association study identifies CLEC3B missense variant
p.S106G as being associated with extreme longevity in east asian
populations. J Gerontol A Biol Sci Med Sci. 72:309–318.
2017.PubMed/NCBI
|
|
9
|
Clemmensen I, Petersen LC and Kluft C:
Purification and characterization of a novel, oligomeric,
plasminogen kringle 4 binding protein from human plasma:
Tetranectin. Eur J Biochem. 156:327–333. 1986. View Article : Google Scholar : PubMed/NCBI
|
|
10
|
Wewer UM, Ibaraki K, Schjørring P, Durkin
ME, Young MF and Albrechtsen R: A potential role for tetranectin in
mineralization during osteogenesis. J Cell Biol. 127:1767–1775.
1994. View Article : Google Scholar : PubMed/NCBI
|
|
11
|
Wewer UM, Iba K, Durkin ME, Nielsen FC,
Loechel F, Gilpin BJ, Kuang W, Engvall E and Albrechtsen R:
Tetranectin is a novel marker for myogenesis during embryonic
development, muscle regeneration, and muscle cell differentiation
in vitro. Dev Biol. 200:247–259. 1998. View Article : Google Scholar : PubMed/NCBI
|
|
12
|
Yin X, Subramanian S, Hwang SJ, O'Donnell
CJ, Fox CS, Courchesne P, Muntendam P, Gordon N, Adourian A, Juhasz
P, et al: Protein biomarkers of new-onset cardiovascular disease:
Prospective study from the systems approach to biomarker research
in cardiovascular disease initiative. Arterioscler Thromb Vasc
Biol. 34:939–945. 2014. View Article : Google Scholar : PubMed/NCBI
|
|
13
|
Chen Y, Han H, Yan X, Ding F, Su X, Wang
H, Chen Q, Lu L, Zhang R and Jin W: Tetranectin as a potential
biomarker for stable coronary artery disease. Sci Rep. 5:176322015.
View Article : Google Scholar : PubMed/NCBI
|
|
14
|
Chen Z, Wang E, Hu R, Sun Y, Zhang L,
Jiang J, Zhang Y and Jiang H: Tetranectin gene deletion induces
Parkinson's disease by enhancing neuronal apoptosis. Biochem
Biophys Res Commun. 468:400–407. 2015. View Article : Google Scholar : PubMed/NCBI
|
|
15
|
Jensen BA and Clemmensen I: Plasma
tetranectin is reduced in cancer and related to metastasia. Cancer.
62:869–872. 1988. View Article : Google Scholar : PubMed/NCBI
|
|
16
|
Nielsen H, Clemmensen I, Nielsen HJ and
Drivsholm A: Decreased tetranectin in multiple myeloma. Am J
Hematol. 33:142–144. 1990. View Article : Google Scholar : PubMed/NCBI
|
|
17
|
Høgdall CK, Høgdall EV, Hørding U,
Daugaard S, Clemmensen I, Nørgaard-Pedersen B and Toftager-Larsen
K: Plasma tetranectin and ovarian neoplasms. Gynecol Oncol.
43:103–107. 1991. View Article : Google Scholar : PubMed/NCBI
|
|
18
|
Høgdall CK, Christiansen M,
Nørgaard-Pedersen B, Bentzen SM, Kronborg O and Clemmensen I:
Plasma tetranectin and colorectal cancer. Eur J Cancer.
31A:888–894. 1995. View Article : Google Scholar : PubMed/NCBI
|
|
19
|
Felix K, Hauck O, Fritz S, Hinz U,
Schnölzer M, Kempf T, Warnken U, Michel A, Pawlita M and Werner J:
Serum protein signatures differentiating autoimmune pancreatitis
versus pancreatic cancer. PLoS One. 8:e827552013. View Article : Google Scholar : PubMed/NCBI
|
|
20
|
Lundstrøm MS, Høgdall CK, Nielsen AL and
Nyholm HC: Serum tetranectin and CA125 in endometrial
adenocarcinoma. Anticancer Res. 20:3903–3906. 2000.PubMed/NCBI
|
|
21
|
Arellano-Garcia ME, Li R, Liu X, Xie Y,
Yan X, Loo JA and Hu S: Identification of tetranectin as a
potential biomarker for metastatic oral cancer. Int J Mol Sci.
11:3106–3121. 2010. View Article : Google Scholar : PubMed/NCBI
|
|
22
|
Høgdall CK, Hørding U, Nørgaard-Pedersen
B, Toftager-Larsen K and Clemmensen I: Serum tetranectin and CA-125
used to monitor the course of treatment in ovarian cancer patients.
Eur J Obstet Gynecol Reprod Biol. 57:175–178. 1994. View Article : Google Scholar : PubMed/NCBI
|
|
23
|
Chen H, Li H, Zhao J, Peng P, Shao M, Wu
H, Wang X, Chen L, Zhang Q, Ruan Y, et al: High intratumoral
expression of tetranectin associates with poor prognosis of
patients with gastric cancer after gastrectomy. J Cancer.
8:3623–3630. 2017. View Article : Google Scholar : PubMed/NCBI
|
|
24
|
Obrist P, Spizzo G, Ensinger C, Fong D,
Brunhuber T, Schäfer G, Varga M, Margreiter R, Amberger A, Gastl G
and Christiansen M: Aberrant tetranectin expression in human breast
carcinomas as a predictor of survival. J Clin Pathol. 57:417–421.
2004. View Article : Google Scholar : PubMed/NCBI
|
|
25
|
Heeran MC, Rask L, Høgdall CK, Kjaer SK,
Christensen L, Jensen A, Blaakaer J, Christensen Jarle IB and
Høgdall EV: Tetranectin positive expression in tumour tissue leads
to longer survival in Danish women with ovarian cancer. Results
from the ‘Malova’ ovarian cancer study. APMIS. 123:401–409. 2015.
View Article : Google Scholar : PubMed/NCBI
|
|
26
|
Mermel CH, Schumacher SE, Hill B, Meyerson
ML, Beroukhim R and Getz G: GISTIC2.0 facilitates sensitive and
confident localization of the targets of focal somatic copy-number
alteration in human cancers. Genome Biol. 12:R412011. View Article : Google Scholar : PubMed/NCBI
|
|
27
|
Gao J, Aksoy BA, Dogrusoz U, Dresdner G,
Gross B, Sumer SO, Sun Y, Jacobsen A, Sinha R, Larsson E, et al:
Integrative analysis of complex cancer genomics and clinical
profiles using the cBioPortal. Sci Signal. 6:pl12013. View Article : Google Scholar : PubMed/NCBI
|
|
28
|
Rhodes DR, Yu J, Shanker K, Deshpande N,
Varambally R, Ghosh D, Barrette T, Pandey A and Chinnaiyan AM:
ONCOMINE: A cancer microarray database and integrated data-mining
platform. Neoplasia. 6:1–6. 2004. View Article : Google Scholar : PubMed/NCBI
|
|
29
|
Song Y, Li L, Ou Y, Gao Z, Li E, Li X,
Zhang W, Wang J, Xu L, Zhou Y, et al: Identification of genomic
alterations in oesophageal squamous cell cancer. Nature. 509:91–95.
2014. View Article : Google Scholar : PubMed/NCBI
|
|
30
|
Ashburner M, Ball CA, Blake JA, Botstein
D, Butler H, Cherry JM, Davis AP, Dolinski K, Dwight SS, Eppig JT,
et al: Gene ontology: tool for the unification of biology. The Gene
Ontology Consortium. Nat Genet. 25:25–29. 2000. View Article : Google Scholar : PubMed/NCBI
|
|
31
|
Huang dW, Sherman BT and Lempicki RA:
Systematic and integrative analysis of large gene lists using DAVID
bioinformatics resources. Nat Protoc. 4:44–57. 2009. View Article : Google Scholar : PubMed/NCBI
|
|
32
|
Lam JS, Klatte T and Breda A: Staging of
renal cell carcinoma: Current concepts. Indian J Urol. 25:446–454.
2009. View Article : Google Scholar : PubMed/NCBI
|
|
33
|
Moch H: The WHO/ISUP grading system for
renal carcinoma. Pathologe. 37:355–360. 2016.(In German).
View Article : Google Scholar : PubMed/NCBI
|
|
34
|
Beroukhim R, Brunet JP, Di Napoli A, Mertz
KD, Seeley A, Pires MM, Linhart D, Worrell RA, Moch H, Rubin MA, et
al: Patterns of gene expression and copy-number alterations in
von-hippel lindau disease-associated and sporadic clear cell
carcinoma of the kidney. Cancer Res. 69:4674–4681. 2009. View Article : Google Scholar : PubMed/NCBI
|
|
35
|
Macé A, Kutalik Z and Valsesia A: Copy
number variation. Methods Mol Biol. 1793:231–258. 2018. View Article : Google Scholar : PubMed/NCBI
|
|
36
|
Nickerson ML, Jaeger E, Shi Y, Durocher
JA, Mahurkar S, Zaridze D, Matveev V, Janout V, Kollarova H, Bencko
V, et al: Improved identification of von Hippel-Lindau gene
alterations in clear cell renal tumors. Clin Cancer Res.
14:4726–4734. 2008. View Article : Google Scholar : PubMed/NCBI
|
|
37
|
Zhang W and Liu HT: MAPK signal pathways
in the regulation of cell proliferation in mammalian cells. Cell
Res. 12:9–18. 2002. View Article : Google Scholar : PubMed/NCBI
|
|
38
|
van Dam S, Võsa U, van der Graaf A, Franke
L and de Magalhães J: Gene co-expression analysis for functional
classification and gene-disease predictions. Brief Bioinform. 2017.
View Article : Google Scholar :
|
|
39
|
Cecchi F, Rabe DC and Bottaro DP:
Targeting the HGF/Met signalling pathway in cancer. Eur J Cancer.
46:1260–1270. 2010. View Article : Google Scholar : PubMed/NCBI
|
|
40
|
Justilien V, Ali SA, Jamieson L, Yin N,
Cox AD, Der CJ, Murray NR and Fields AP: Ect2-dependent rRNA
synthesis is required for KRAS-TRP53-driven lung adenocarcinoma.
Cancer Cell. 31:256–269. 2017. View Article : Google Scholar : PubMed/NCBI
|
|
41
|
Bracken AP, Pasini D, Capra M, Prosperini
E, Colli E and Helin K: EZH2 is downstream of the pRB-E2F pathway,
essential for proliferation and amplified in cancer. EMBO J.
22:5323–5335. 2003. View Article : Google Scholar : PubMed/NCBI
|
|
42
|
Ryu S and Driever W: Minichromosome
maintenance proteins as markers for proliferation zones during
embryogenesis. Cell Cycle. 5:1140–1142. 2006. View Article : Google Scholar : PubMed/NCBI
|
|
43
|
Guo Y, Xie J, Rubin E, Tang YX, Lin F, Zi
X and Hoang BH: Frzb, a secreted Wnt antagonist, decreases growth
and invasiveness of fibrosarcoma cells associated with inhibition
of Met signaling. Cancer Res. 68:3350–3360. 2008. View Article : Google Scholar : PubMed/NCBI
|
|
44
|
Andreeva AV and Kutuzov MA: Cadherin 13 in
cancer. Genes Chromosomes Cancer. 49:775–790. 2010.PubMed/NCBI
|
|
45
|
Liu X, Lan Y, Zhang D, Wang K, Wang Y and
Hua ZC: SPRY1 promotes the degradation of uPAR and inhibits
uPAR-mediated cell adhesion and proliferation. Am J Cancer Res.
4:683–697. 2014.PubMed/NCBI
|
|
46
|
Oh KY, Hong KO, Huh YS, Lee JI and Hong
SD: Decreased expression of SOX7 induces cell proliferation and
invasion and correlates with poor prognosis in oral squamous cell
carcinoma. J Oral Pathol Med. 46:752–758. 2017. View Article : Google Scholar : PubMed/NCBI
|
|
47
|
Jafri M, Wake NC, Ascher DB, Pires DE,
Gentle D, Morris MR, Rattenberry E, Simpson MA, Trembath RC, Weber
A, et al: Germline Mutations in the CDKN2B tumor suppressor gene
predispose to renal cell carcinoma. Cancer Discov. 5:723–729. 2015.
View Article : Google Scholar : PubMed/NCBI
|
|
48
|
Paz N, Levanon EY, Amariglio N, Heimberger
AB, Ram Z, Constantini S, Barbash ZS, Adamsky K, Safran M,
Hirschberg A, et al: Altered adenosine-to-inosine RNA editing in
human cancer. Genome Res. 17:1586–1595. 2007. View Article : Google Scholar : PubMed/NCBI
|
|
49
|
Sánchez-Martín D, Otsuka A, Kabashima K,
Ha T, Wang D, Qian X, Lowy DR and Tosato G: Effects of DLC1
deficiency on endothelial cell contact growth inhibition and
angiosarcoma progression. J Natl Cancer Inst. 110:390–399. 2017.
View Article : Google Scholar :
|
|
50
|
Kim YM, Stone M, Hwang TH, Kim YG, Dunlevy
JR, Griffin TJ and Kim DH: SH3BP4 is a negative regulator of amino
acid-Rag GTPase-mTORC1 signaling. Mol Cell. 46:833–846. 2012.
View Article : Google Scholar : PubMed/NCBI
|
|
51
|
Shen YJ, Kong ZL, Wan FN, Wang HK, Bian
XJ, Gan HL, Wang CF and Ye DW: Downregulation of DAB2IP results in
cell proliferation and invasion and contributes to unfavorable
outcomes in bladder cancer. Cancer Sci. 105:704–712. 2014.
View Article : Google Scholar : PubMed/NCBI
|
|
52
|
Høgdall CK, Christensen L and Clemmensen
I: The prognostic value of tetranectin immunoreactivity and plasma
tetranectin in patients with ovarian cancer. Cancer. 72:2415–2422.
1993. View Article : Google Scholar : PubMed/NCBI
|
|
53
|
Høgdall CK, Sölétormos G, Nielsen D,
Nørgaard-Pedersen B, Dombernowsky P and Clemmensen I: Prognostic
value of serum tetranectin in patients with metastatic breast
cancer. Acta Oncol. 32:631–636. 1993. View Article : Google Scholar : PubMed/NCBI
|
|
54
|
Bamborough P, Chung CW, Demont EH, Furze
RC, Bannister AJ, Che KH, Diallo H, Douault C, Grandi P, Kouzarides
T, et al: A Chemical probe for the ATAD2 bromodomain. Angew Chem
Int Ed Engl. 55:11382–11386. 2016. View Article : Google Scholar : PubMed/NCBI
|
|
55
|
Saha A, Kim Y, Gewirtz ADH, Jo B, Gao C
and McDowell IC: GTEx Consortium, Engelhardt BE and Battle A:
Co-expression networks reveal the tissue-specific regulation of
transcription and splicing. Genome Res. 27:1843–1858. 2017.
View Article : Google Scholar : PubMed/NCBI
|