Introduction
Gastric cancer is currently the fourth most common
cancer, after lung cancer, breast cancer and colon cancer, and the
third leading cause of cancer-associated mortality worldwide
(1,2). A previous study identified various
biomarkers for gastric cancer, including cancer antigen 19-9,
erb-b2 receptor tyrosine kinase 2 and vascular endothelial growth
factor, certain of which may predict clinical prognosis and
therapeutic effect or serve as a hallmark of diagnosis (3). However, biomarkers of gastric cancer
are rarely used clinically due to a lack of specificity or
sensitivity. Thus, it is imperative to identify novel molecular
biomarkers that are able to predict the clinical outcome of gastric
cancer, which may help to further the study of gastric cancer
pathogenesis and facilitate personalised treatment.
With the development and maturation of
third-generation sequencing technology, network approaches have
been used to study the progression of various diseases, bridging
the gaps between individual genes and the occurrence and
development of disease (4,5). However, identification of key
biomarkers remains a challenge. At present, although there are
numerous studies based on bioinformatics approaches, including
screening for differentially expressed genes (DEGs), similar
expression patterns between genes have not been a focus (6). Weighted gene co-expression network
analysis (WGCNA), an unbiased algorithm, elucidates the
higher-order associations between genes or between gene sets and
clinical features based on their co-expression relationships and
delineates modules of biologically-associated genes (7). WGCNA has been widely applied to screen
key biomarkers associated with clinical characteristics, including
tumour grade, metastasis and prognosis, among different tumour
types and even among different diseases or species (8–11). The
present study utilized the unbiased strategy of WGCNA to study a
module of genes significantly associated with chemotherapy
resistance and prognosis in gastric cancer, and GLIS family zinc
finger 2 (GLIS2) was identified as a previously unreported
biomarker of gastric cancer by integrating the data analysis with
cellular verification in vitro.
Materials and methods
Dataset acquisition and
pre-processing
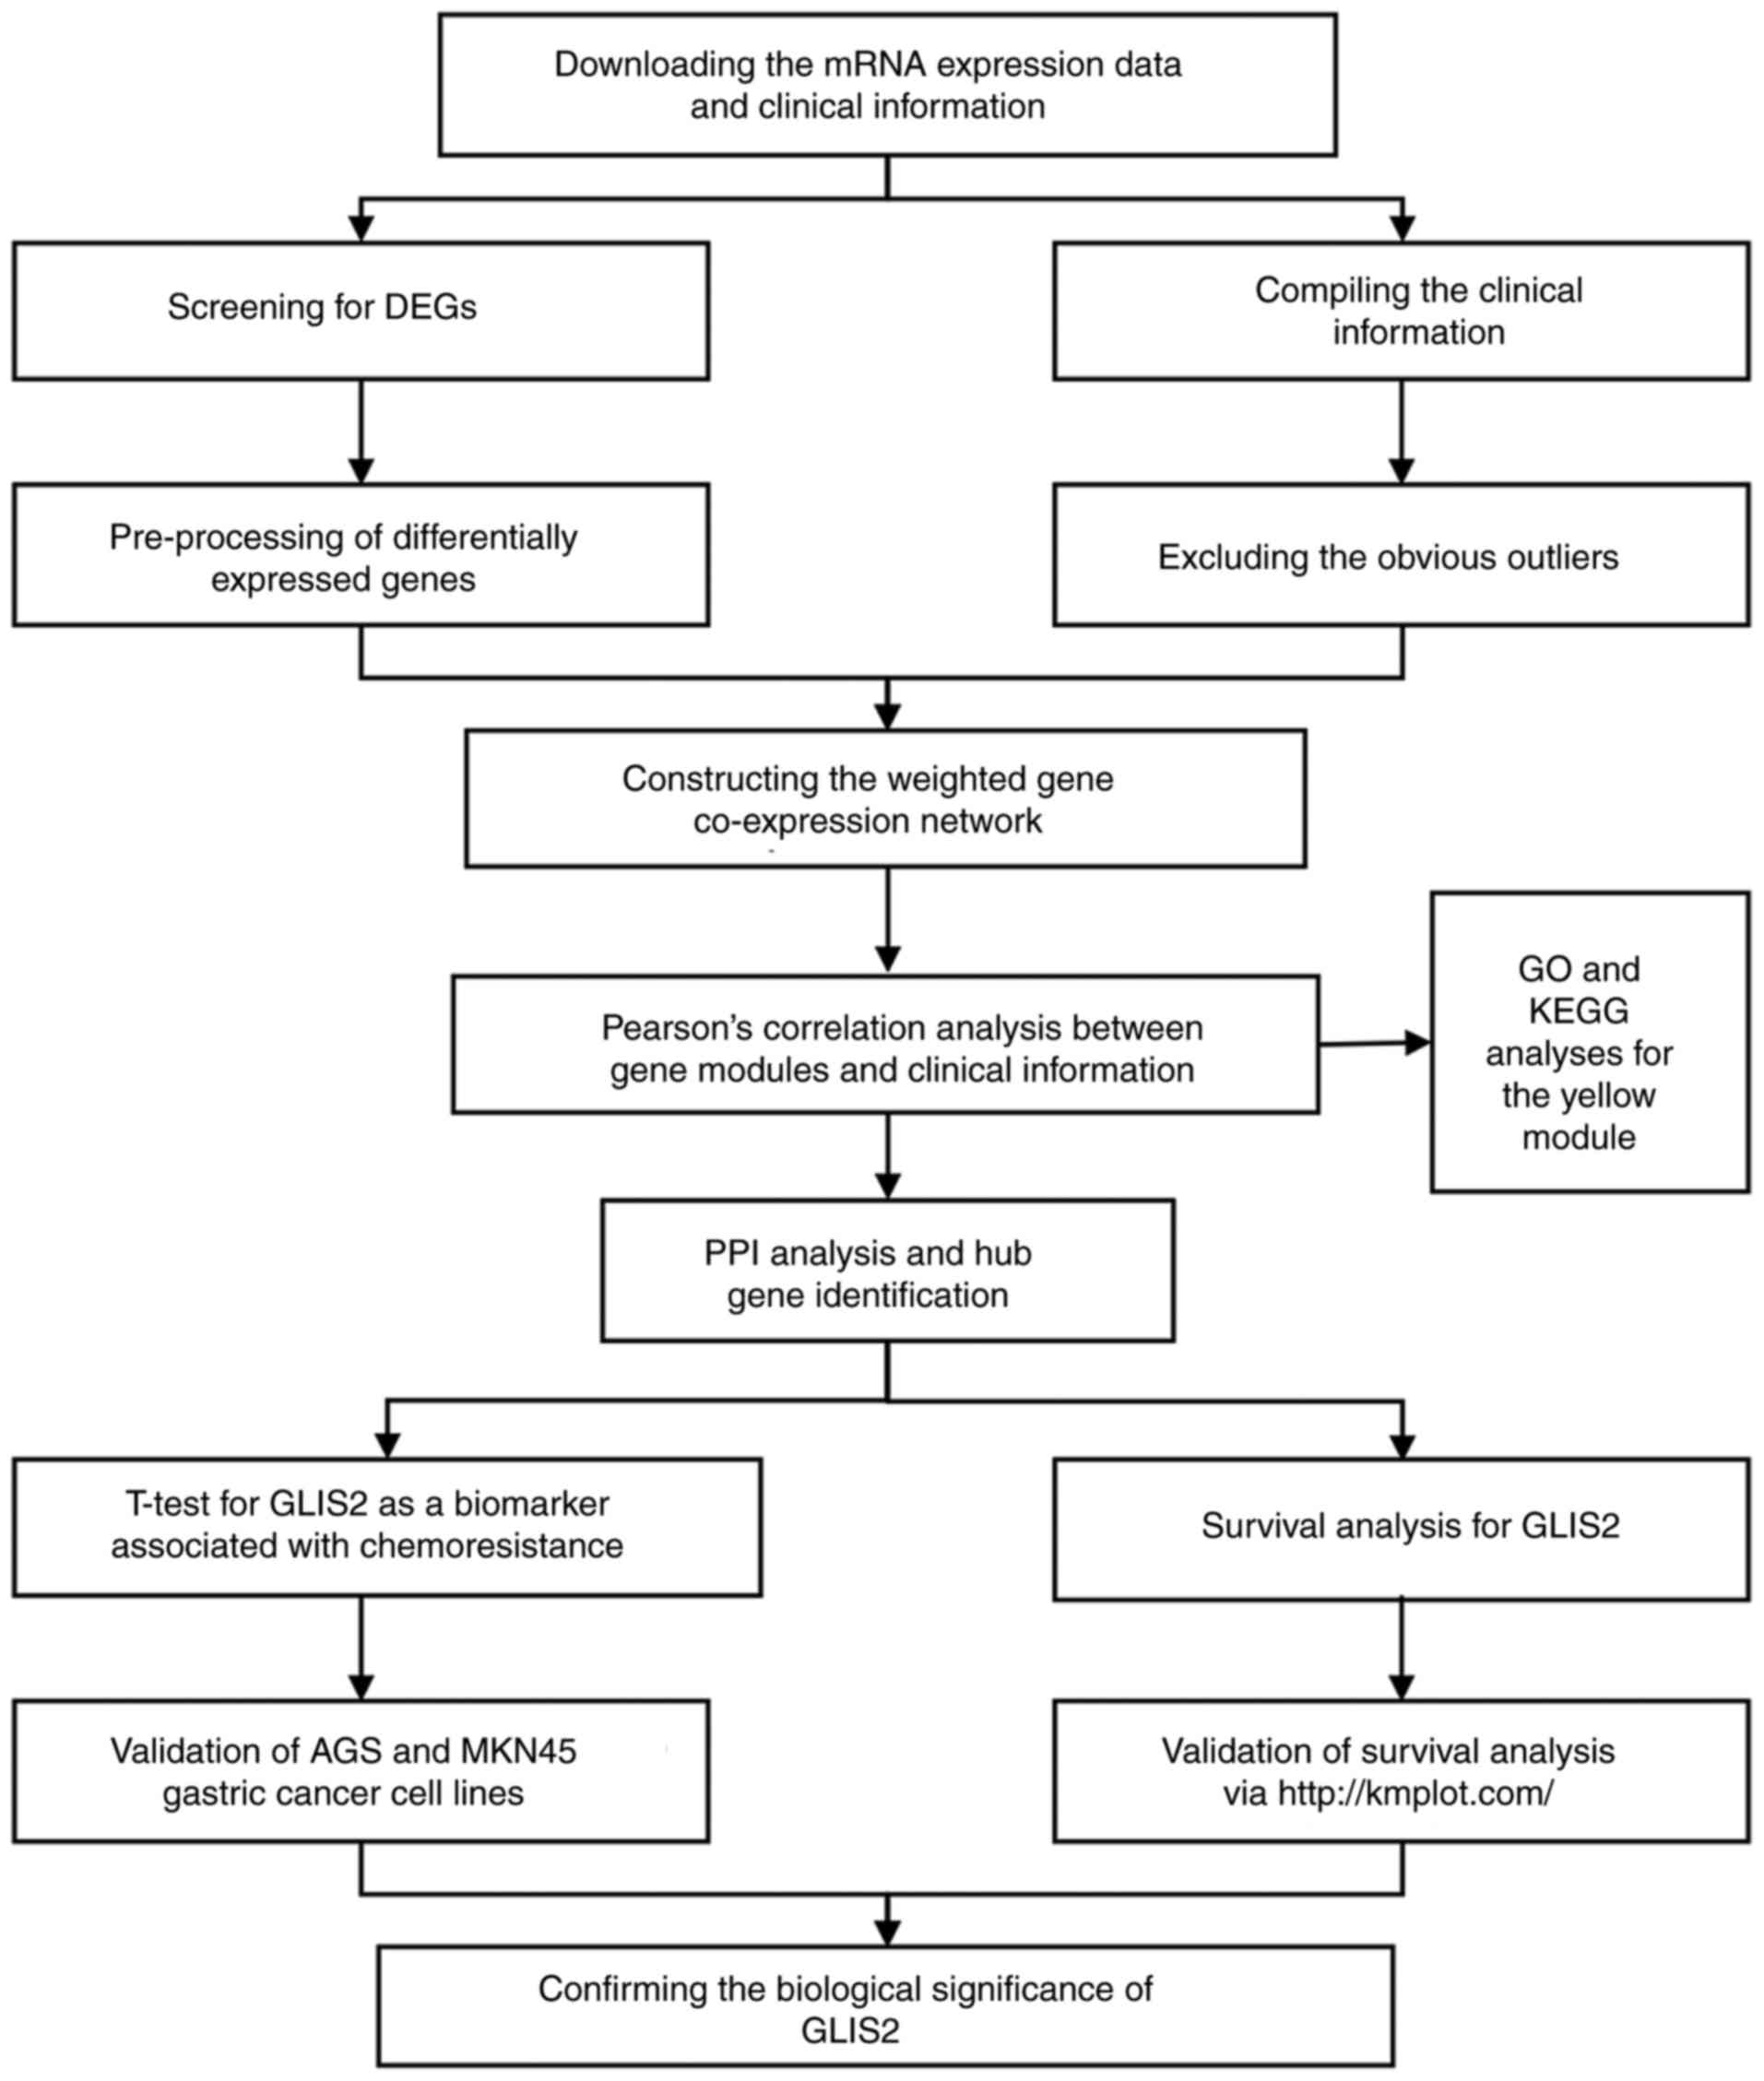
A flow diagram of the study is presented in Fig. 1. The raw data on patients with
gastric cancer containing RNA sequencing (RNA_seq) and clinical
information were obtained from The Cancer Genome Atlas (TCGA)
repository website (https://cancergenome.nih.gov/). The R ‘limma’
Bioconductor package (12) was
adopted to screen the DEGs between normal gastric and tumour
tissues based on the following criteria: Fold change (FC),
|log2(FC)|>1; and false discovery rate (FDR)
<0.05. To minimize noise in the DEG dataset, in strict
accordance with the analysis method on the WGCNA official website
(https://labs.genetics.ucla.edu/horvath/htdocs/CoexpressionNetwork/Rpackages/WGCNA/),
genes with too many missing values and unknown names were checked
for and excluded, and genes for which the names corresponded to
multiple probes were deleted. The samples were clustered to exclude
the obvious outliers (7,13). The microarray dataset of filtered
probe sets was constructed using the remaining genes and samples.
In addition, clinical variables, including age and gender,
pathological variables [including drug response, tumour (T) stage
and tumour grade] and survival information were compiled for the
WGCNA analysis. The DEGs were normalized by log2 transformation
prior to the subsequent analyses. A total of two investigators
separately collated and analysed the data, and a joint decision was
reached in cases of disagreement.
WGCNA construction
Construction of a weighted co-expression network
represents an effective method for identifying modules and for
defining the intra-module connectivity. In the current study, WGCNA
was performed on the microarray data of filtered probe sets using
the R ‘wgcna’ Bioconductor package (13). Each paired gene-gene association was
correlated utilizing the absolute value of the Pearson product
moment correlation (a gene co-expression similarity measure); the
absolute value represents the co-expression similarity. An
adjacency matrix was constructed utilizing a ‘soft’ power adjacency
function, where the ‘soft’ power indicates that the resulting
adjacency measures the connection strength. Clusters of
co-expressed genes were designated by hierarchical cluster analysis
following subtraction of the topological overlap measure of
similarity of 1 (7,10).
The modules of WGCNA are groups of highly correlated
genes. In network terminology, modules are sets of genes with high
topological overlap. To obtain the potential associations between
the co-expressed gene clusters and clinical variables, a single
column of vectors termed the module eigengenes (MEs) (7) was used. The MEs were generated by
reserving the first principal component of a given module and were
representative of the gene expression profiles in a module. Since
each ME contains the majority of the variance in the original data,
it represents a summary measure for the overall co-expression
network. The consistency between the expression of a particular
gene and the ME expression is termed the module membership. This
measure of co-expression network centrality is decided by
calculating the Pearson correlation coefficient between each
individual gene and the ME. Further details on WGCNA theory and
algorithm have been previously published (7,10).
Key module identification and
analysis
To define the pivotal module, the correlations
between the MEs and clinical features were calculated. Furthermore,
functional enrichment analysis and protein-protein interaction
(PPI) analysis was conducted on the genes in the yellow module to
examine the probable mechanism underlying the impact of the genes
on chemotherapy resistance and the prognosis of gastric cancer. The
Database for Annotation, Visualization and Integrated Discovery
(DAVID; http://david-d.ncifcrf.gov/) was used
to analyse the enriched biological process (BP) terms and pathways
(14). The top 15 most significant
BP terms (P≤0.05) are presented. Only those KEGG pathways with
P≤0.05 and ≥10 enriched genes were considered to be significant. In
addition, the PPI networks were constructed using STRING
(https://string-db.org/).
Cell culture and plasmid
transfection
The human gastric cancer cell lines AGS and MKN45
were purchased from the American Type Culture Collection (Manassas,
VA, USA). All the cell lines were maintained in RPMI 1640 medium
(Gibco; Thermo Fisher Scientific, Inc., Waltham, MA, USA)
supplemented with 10% foetal bovine serum (ScienCell Research
Laboratories, Inc., San Diego, CA, USA) and 2 mM penicillin and
streptomycin, and were cultured in a humidified 37°C incubator at
5% CO2.
The GLIS2 overexpression plasmids were constructed
and cloned into the CV061 vector (Shanghai GeneChem Co., Ltd.,
Shanghai, China) between the EcoRI and HindIII sites.
The primer sequence used for GLIS2 was:
5′-ACGGGCCCTCTAGACTCGAGATGCACTCCCTGGACGAGCCGCTCG-3′. AGS and MKN45
cells were transfected with GLIS2 overexpression plasmids using
Lipofectamine® 3000 (Invitrogen; Thermo Fisher
Scientific, Inc.). According to the manufacturer's instructions,
1×10⁵ gastric cancer cells were inoculated onto a
24-well plate and 1 µg/ml of the plasmid was added, and the
transfected cells were incubated in a 5% CO2 incubator
at 37°C for 48 h. Subsequent treatments were performed when the
cells had grown to 80–90% confluence.
Western blotting
For the western blotting assay, cells were lysed
using radioimmunoprecipitation assay and phenylmethylsulfonyl
fluoride buffers (100:1; Sigma-Aldrich; Merck KGaA, Darmstadt,
Germany), and the lysates were collected by centrifugation at
12,000 × g for 12 min at 4°C. The protein concentration was
determined using a bicinchoninic acid protein assay kit
(Sigma-Aldrich; Merck KGaA). Equal amounts of protein lysates (30
µg) were electrophoresed on 10% SDS-polyacrylamide gels and
transferred to methanol-activated polyvinylidene fluoride (PVDF)
membranes. The PVDF membranes were blocked with 5% non-fat dried
milk in Tris-buffered saline (pH 7.4) containing 0.1% Tween-20
(TBST) for 1 h, and incubated with the primary GLIS2 (Abcam,
Cambridge, UK; cat. no. ab28462; diluted 1:750) and GAPDH
antibodies (Abcam; cat. no. ab8245; diluted 1:750) in TBST at 4°C
overnight. The membranes were subsequently washed three times with
TBST and incubated with a secondary Alexa Fluor-conjugated
anti-rabbit antibody (Abcam; cat. no. ab150077; goat anti-rabbit
IgG H&L; diluted 1:5,000) for 1 h at room temperature. Signal
detection was performed for 5 min using an enhanced
chemiluminescence reaction (Dalian Meilun Biotechnology Co., Ltd.,
Dalian, China). The GAPDH antibody was used to normalize protein
expression.
Reverse transcription-quantitative
polymerase chain reaction (RT-qPCR)
Total RNA was isolated from cells using
TRIzol® reagent (Invitrogen; Thermo Fisher Scientific,
Inc.). RT was performed (on 500 ng of RNA) using the PrimeScript RT
Reagent kit (Takara Biotechnology Co., Ltd., Dalian, China), and
the RT-qPCRs were performed using SYBR Premix Ex Taq (Takara
Biotechnology Co., Ltd.), according to the manufacturer's protocol.
The following primers were used: GLIS2 forward,
5′-CTTCGGGGAGGCTGGATT-3′ and reverse, 5′-GGTGATACTCAGCTTCAGGTCG-3′;
and GAPDH forward, 5′-AATCCCATCACCATCTTCCAG-3′ and reverse,
5′-GAGCCCCAGCCTTCTCCAT-3′. The relative expression of the genes
(GLIS2 and GAPDH) was calculated using the 2−ΔΔCq method
(15).
MTT assay
Fluorouracil (5-FU), cisplatin and doxorubicin were
purchased from Selleck Chemicals (Houston, TX, USA). Cells
(6×10³ per well) were seeded in 96-well plates and
incubated for 48 h. 5-FU, cisplatin and doxorubicin were added at
final concentrations of 0, 2, 4, 8, 16 and 32 µmol/l with dimethyl
sulfoxide (DMSO) alone serving as a control. The cells were
incubated in a 5% CO2 incubator at 37°C for 24 h. The
medium was removed, and the cells were cultured in fresh growth
medium containing 0.5 mg/ml MTT for 4 h under the above conditions.
The supernatant was removed, and 100 µl DMSO was added to dissolve
the formazan crystals. The absorption was measured at 490 nm, and
the results were expressed as the half-maximal inhibitory
concentration (IC50), the concentration of chemotherapeutic drug
required for 50% inhibition in vitro.
Statistical analysis and
visualization
The majority of the visualizations were generated
using R version 3.3.1 (https://www.r-project.org/) except for the KEGG
network and PPI visualizations, for which the ClueGO (16) and STRING online tools were used.
Survival analysis and clinical correlation analysis was performed
using TCGA expression and clinical data on gastric cancer, setting
the median expression value of GLIS2 as a cut-off value between
high and low expression. The Kaplan-Meier method was used to
estimate survival, and a log-rank test was used to assess
differences between the survival curves. Furthermore, the
prognostic role of GLIS2, including its role in predicting overall
survival and disease-free survival, was validated using online
tools (http://kmplot.com/analysis/)
(17). Statistical analyses were
implemented using GraphPad Prism 6.0 (GraphPad Software, Inc., La
Jolla, CA, USA). All data are presented as the mean ± standard
deviation. Student's t-tests were used for comparisons between
groups, except for the analysis of clinicopathological features,
for which the two-sample t-test was used. P<0.05 was considered
to indicate a statistically significant difference.
Results
DEG screening and pre-processing
As presented in the flow chart (Fig. 1), public RNA_seq datasets were
downloaded from TCGA repository website, containing 238 gastric
cancer samples and 33 normal tissue samples. Based on the criteria
of |log2(FC)|>1 and FDR<0.05, a total of 5,630
DEGs were screened out. Prior to constructing the microarray
dataset of filtered probe sets, 204 low-quality DEGs and 26 cancer
samples were excluded (data not shown). To facilitate the
subsequent WGCNA analysis, the clinical information was compiled
and converted. To obtain an overview of the clinical information,
hierarchical cluster analysis was performed (data not shown).
Co-expression network
construction
The remaining 5,426 most varying and most connected
genes from 212 gastric cancer samples were obtained for
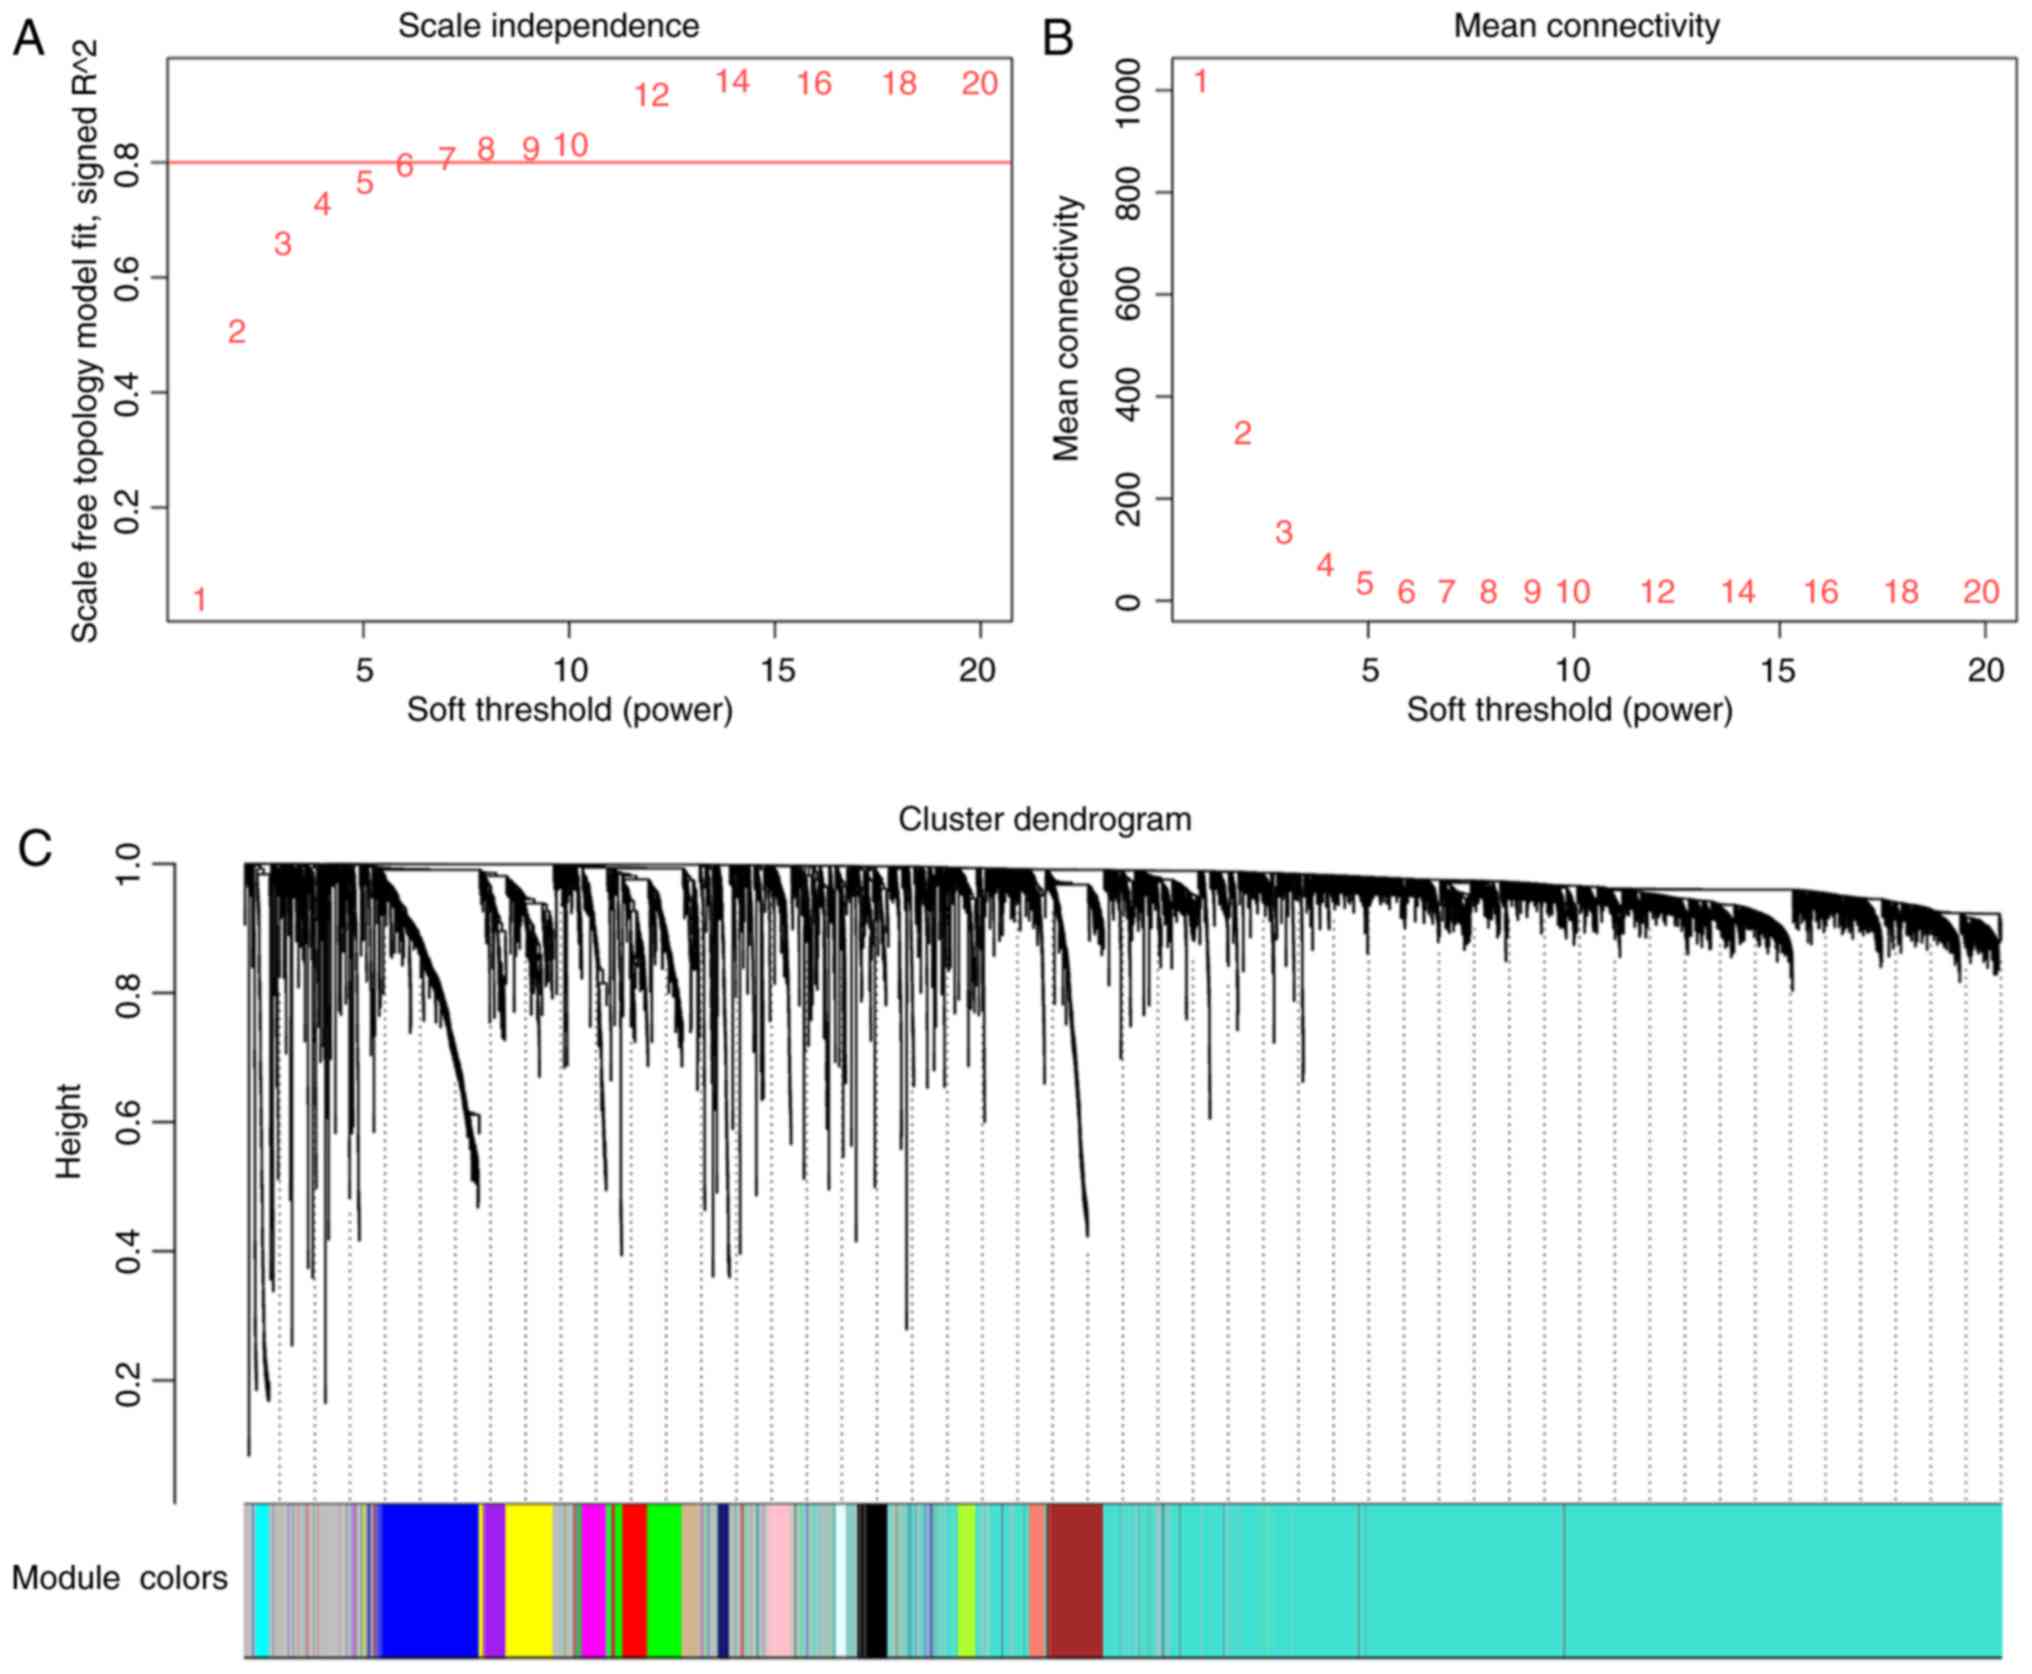
construction of the co-expression network. As presented in Fig. 2, 16 distinct gene modules with high
topological overlap were identified when the soft threshold power β
was set to 6. The number of genes included in the modules ranged
between 36 (light cyan) and 3,068 (turquoise). Each module was
assigned a different colour to distinguish between them, and the
grey module was reserved for genes that were identified as not
being co-expressed.
Key module identification
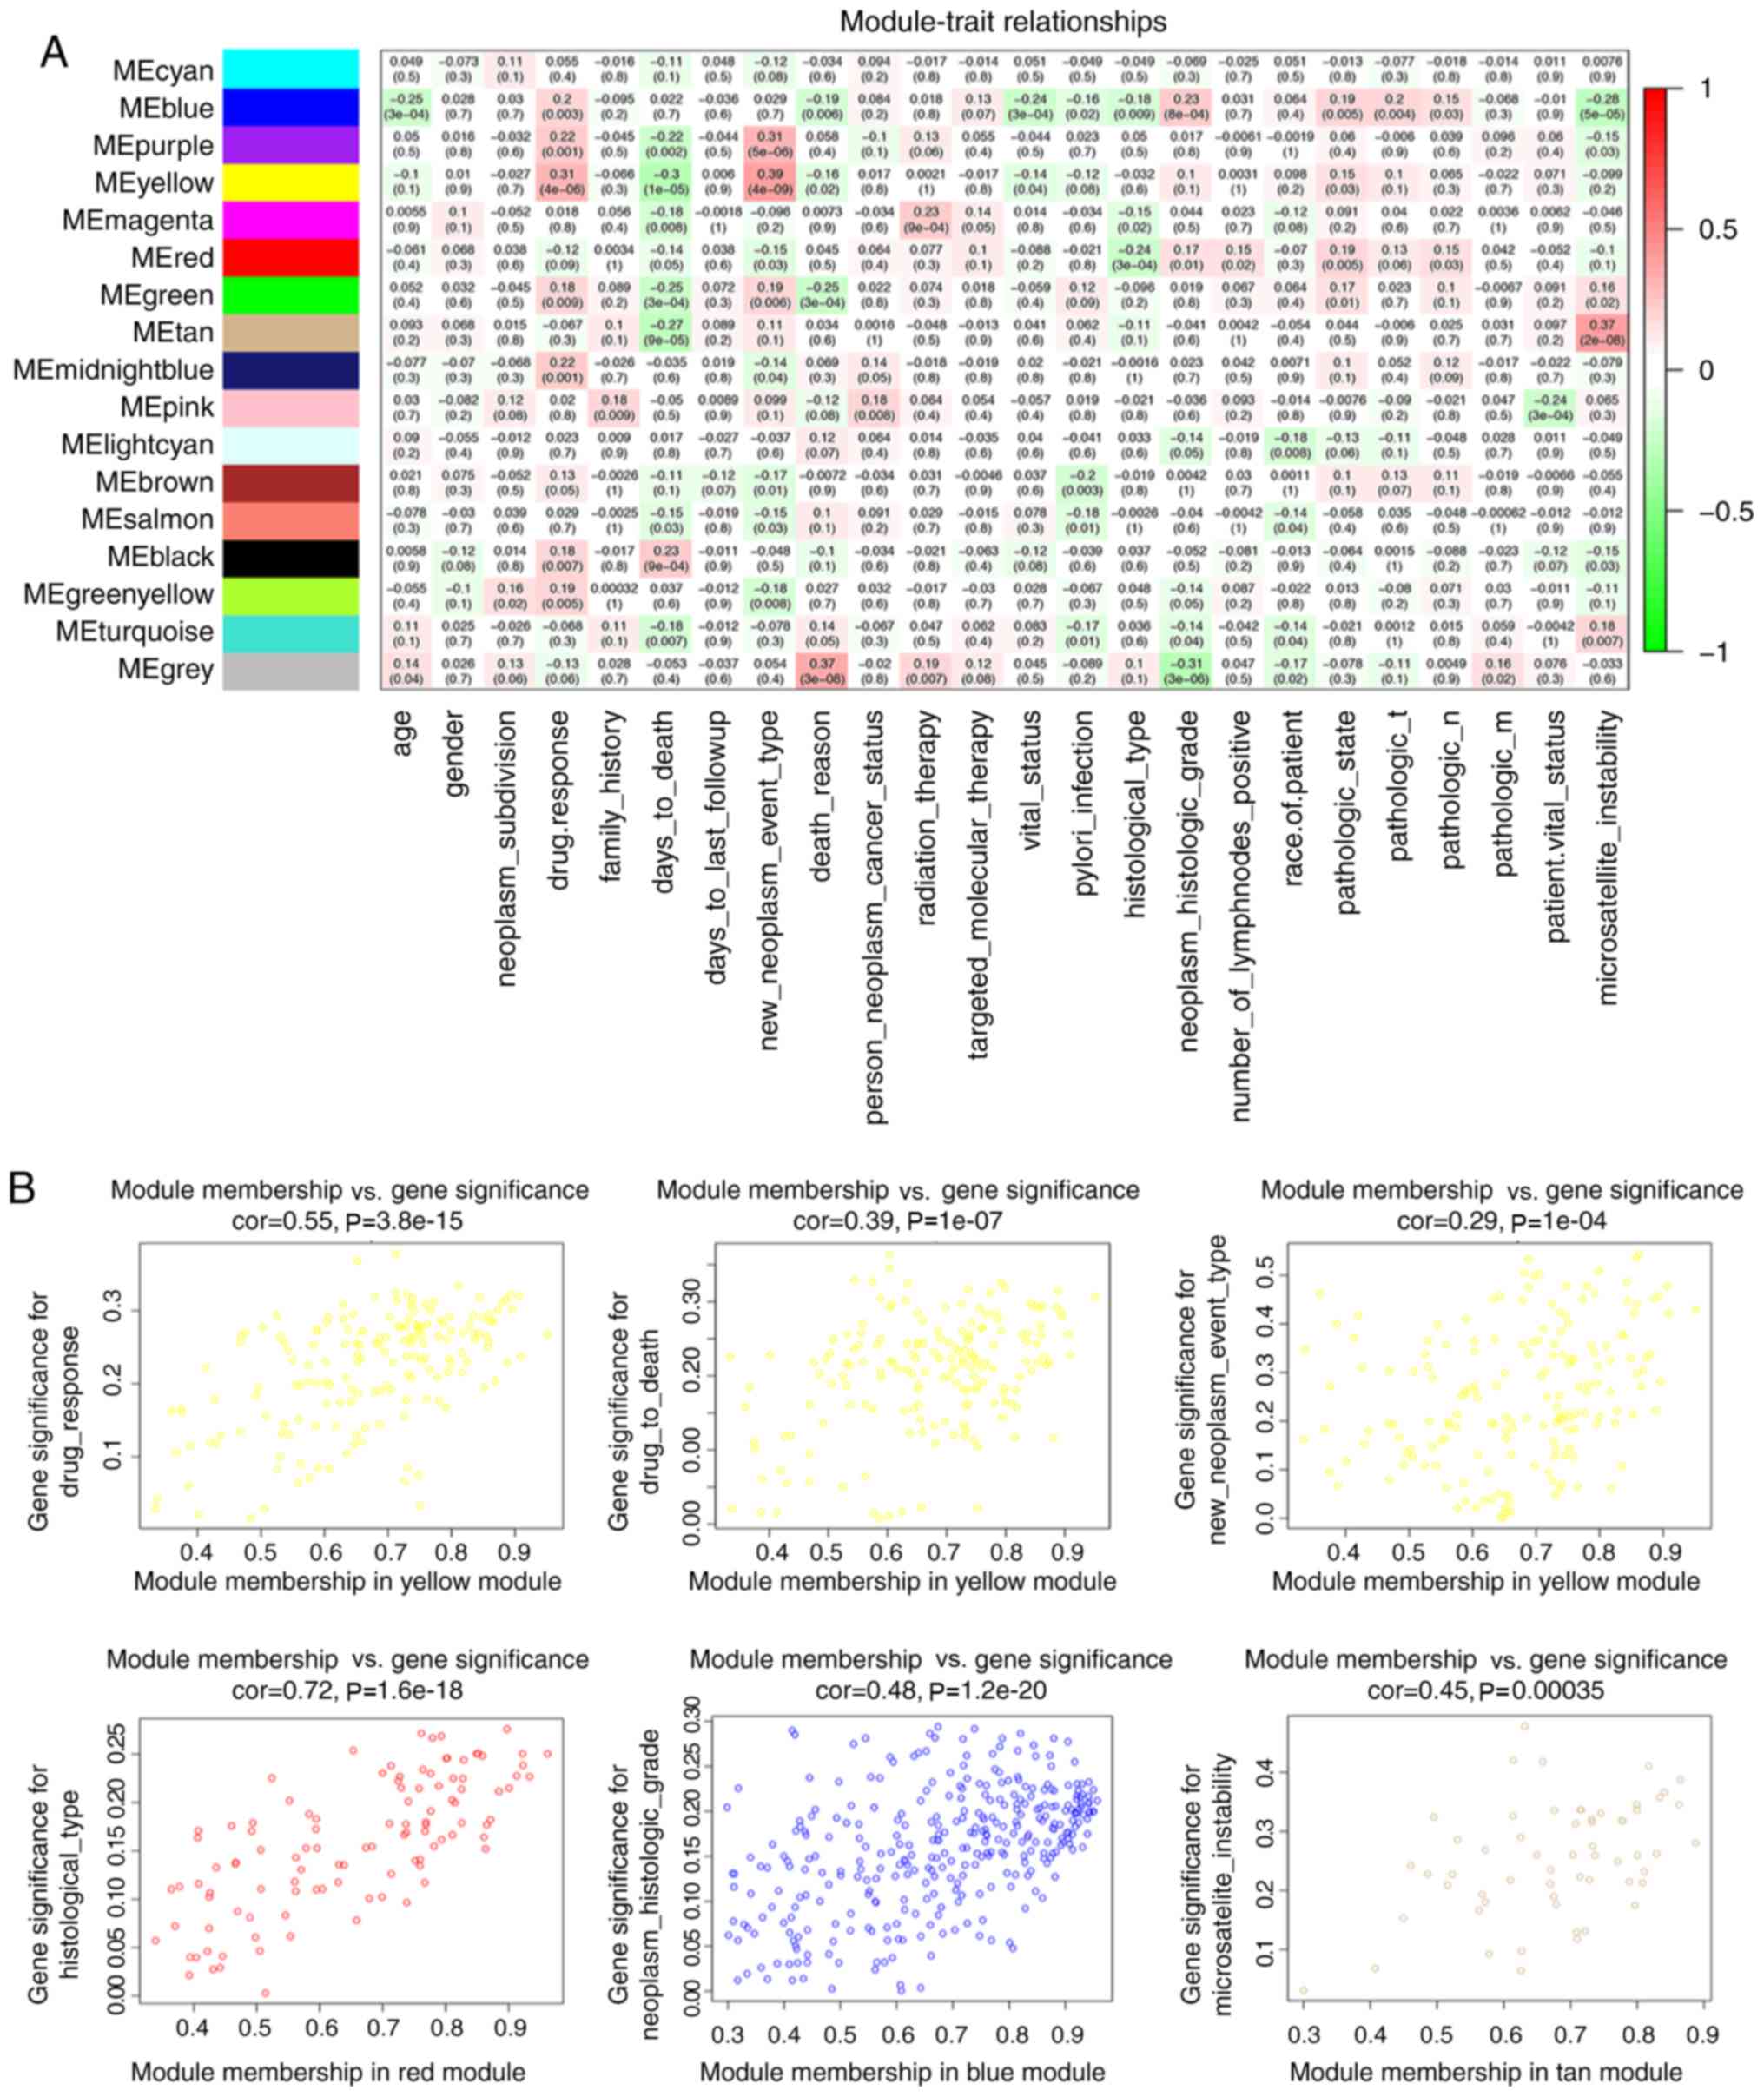
The yellow module had the highest correlation with
drug response (r=0.31; P<0.001) and days to mortality (r=−0.3;
P<0.001) among the module-trait relationships (Fig. 3A), and was selected for study in the
subsequent analyses due to its clinical importance. The yellow
module was also associated with new tumour type (including
locoregional recurrence, distant metastasis and new primary tumour;
r=0.39; P<0.001). It was additionally identified that the red
module was associated with histological type (r=−0.24; P<0.001),
the blue module was associated with tumour histological grade
(r=0.23; P<0.001), and the tan module was associated with
microsatellite instability (r=0.37; P<0.001). In addition, the
intra-modular connectivity was calculated for each gene based on
its Pearson correlation with all other genes in the module
(Fig. 3B), to help prove the
importance of these modules.
Biological importance of the
modules
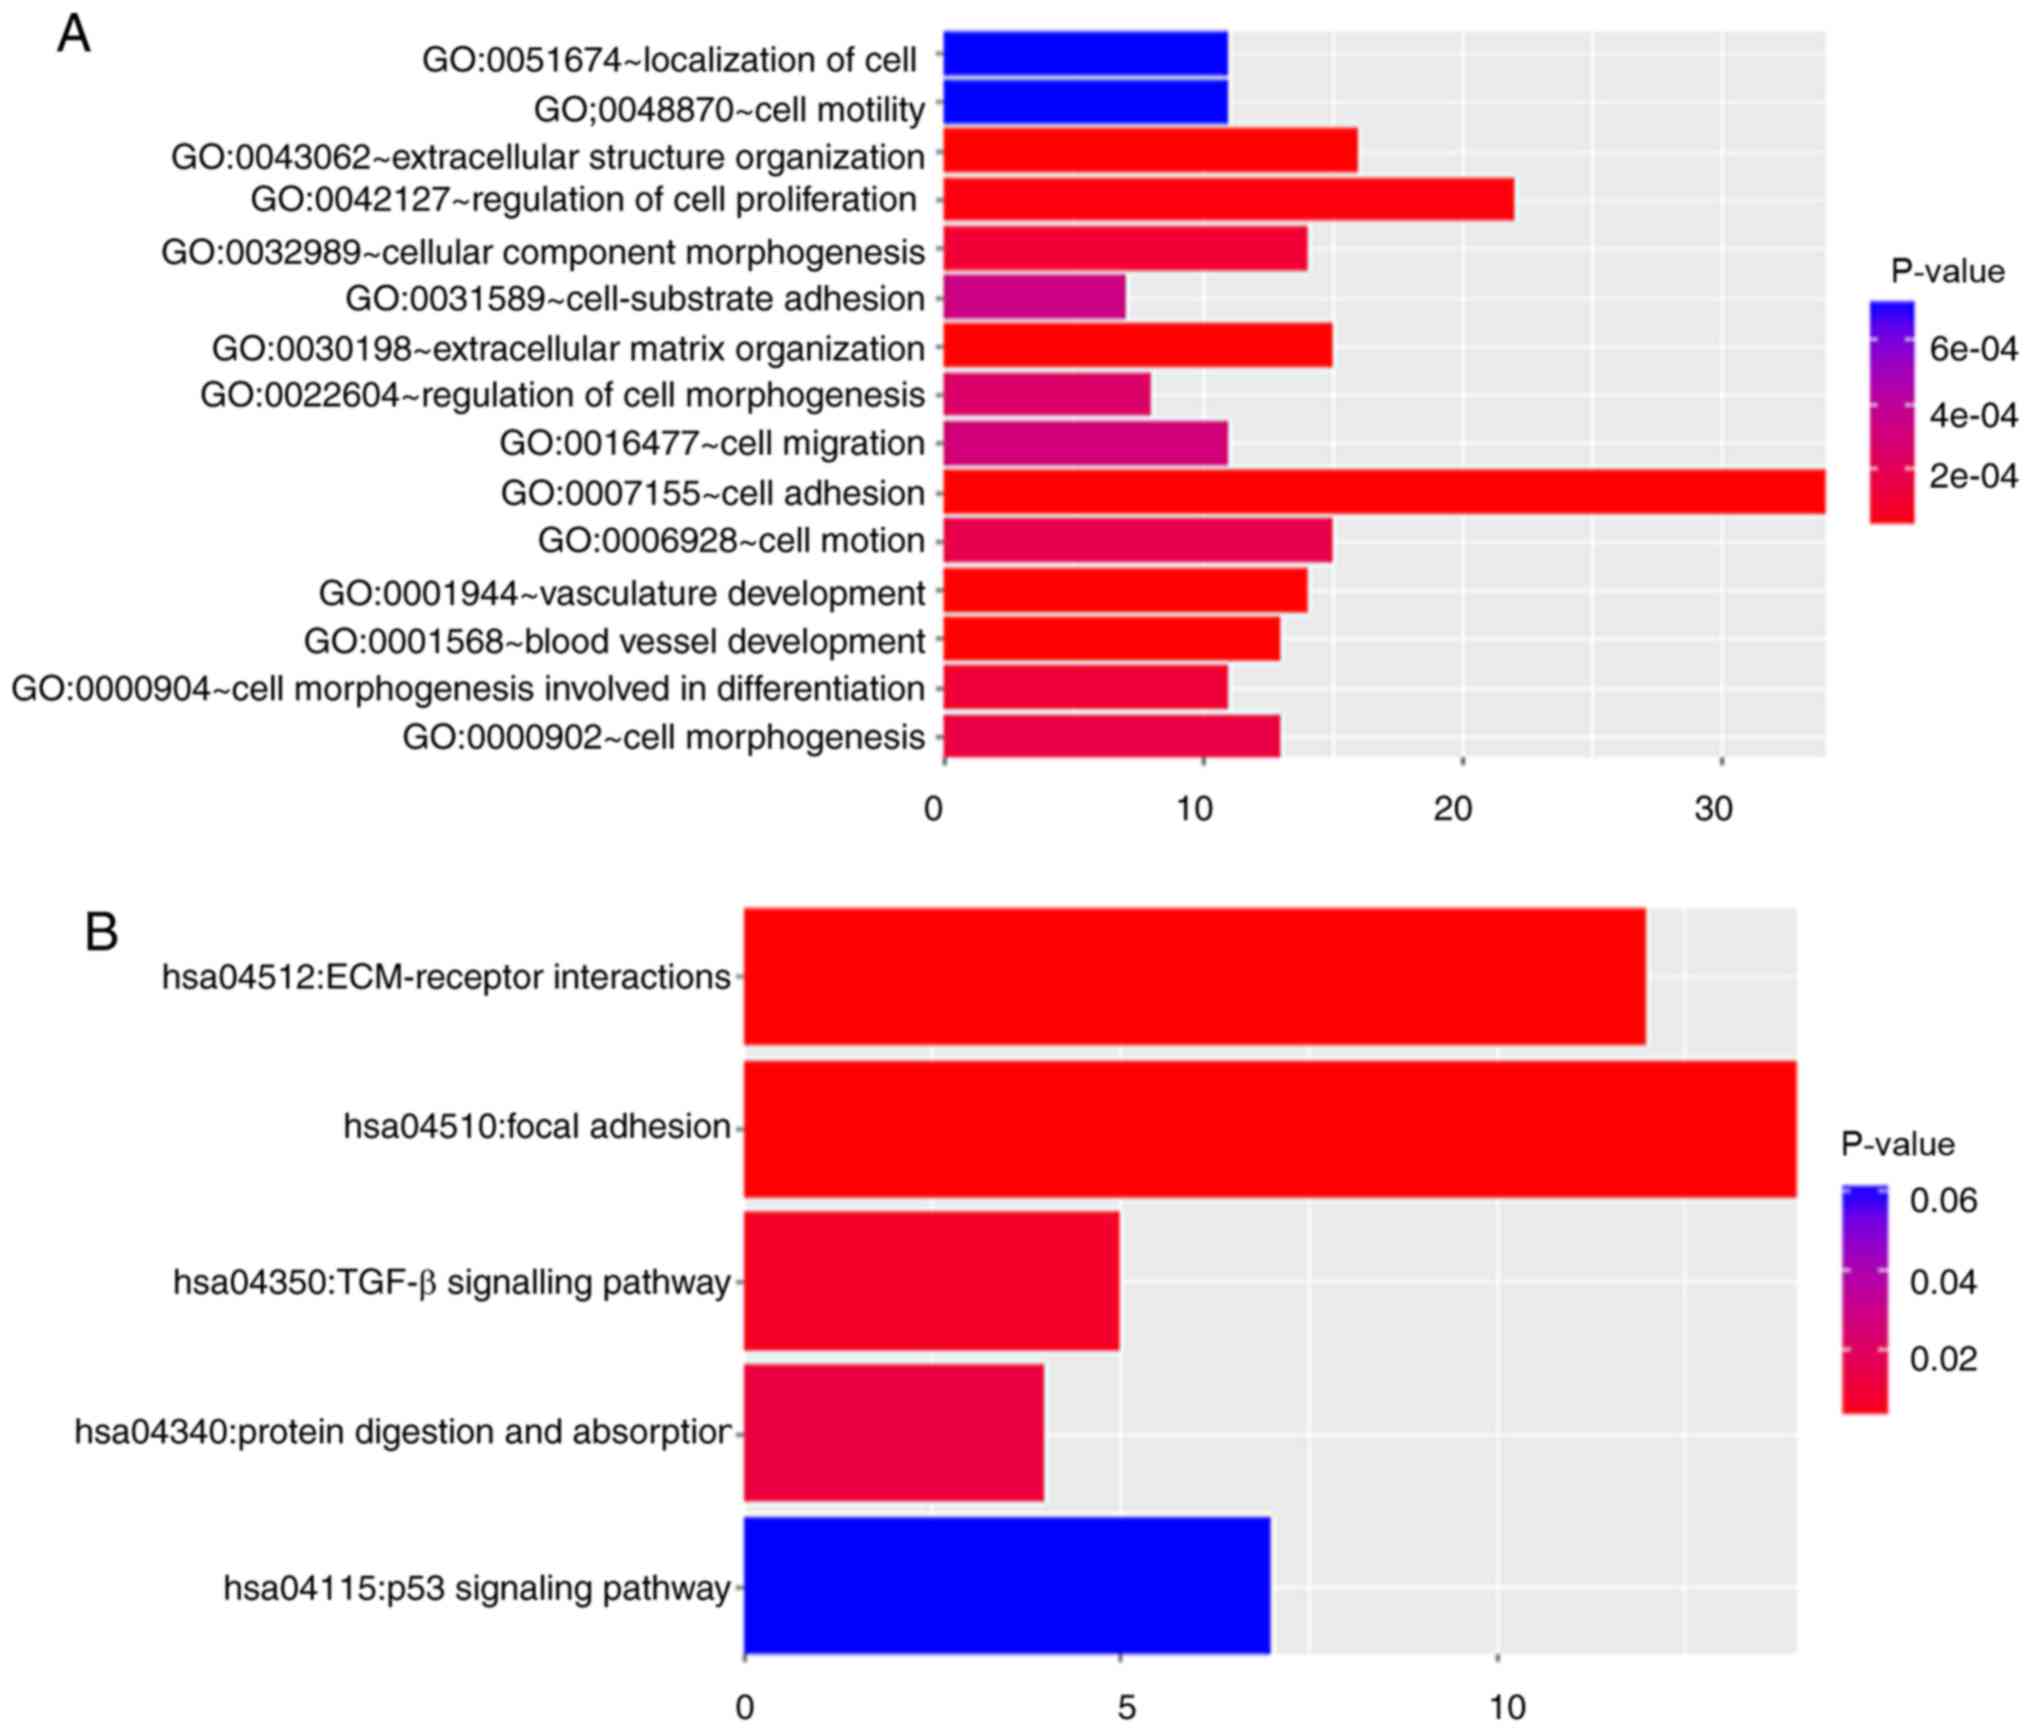
To investigate the biological importance of the
yellow module, 174 genes in the yellow module were functionally
enriched using DAVID for BP analysis and KEGG pathways analyses.
The BPs of the yellow module were primarily enriched in a number of
aspects, including ‘cell adhesion’ (P<0.001), ‘vasculature
development’ (P<0.001), and ‘regulation of cell proliferation’
(P<0.001. Fig. 4A). In addition,
the DAVID-based enrichment analysis identified KEGG pathways for
the 174 genes in the yellow module (Fig. 4B and C). Among them, certain
tumorigenesis-associated signalling pathways were present,
including the TGF-β (P=0.006) and p53 (P=0.036) signalling
pathways. In particular, cell adhesion-associated signalling
pathways, including extracellular matrix (ECM)-receptor
interactions (P<0.001) and focal adhesion (P<0.0001), were
observed to serve a key role in the regulation of drug resistance
in gastric cancer.
Hub gene identification
The present study proceeded to develop the PPI
network and investigate the hub genes of the yellow module
(Table I). To identify novel
proteins and pathways modulated by the pivotal genes, GLIS2 was
selected as a candidate gene for further analysis and verification
subsequent to comparing the data and reviewing the literature.
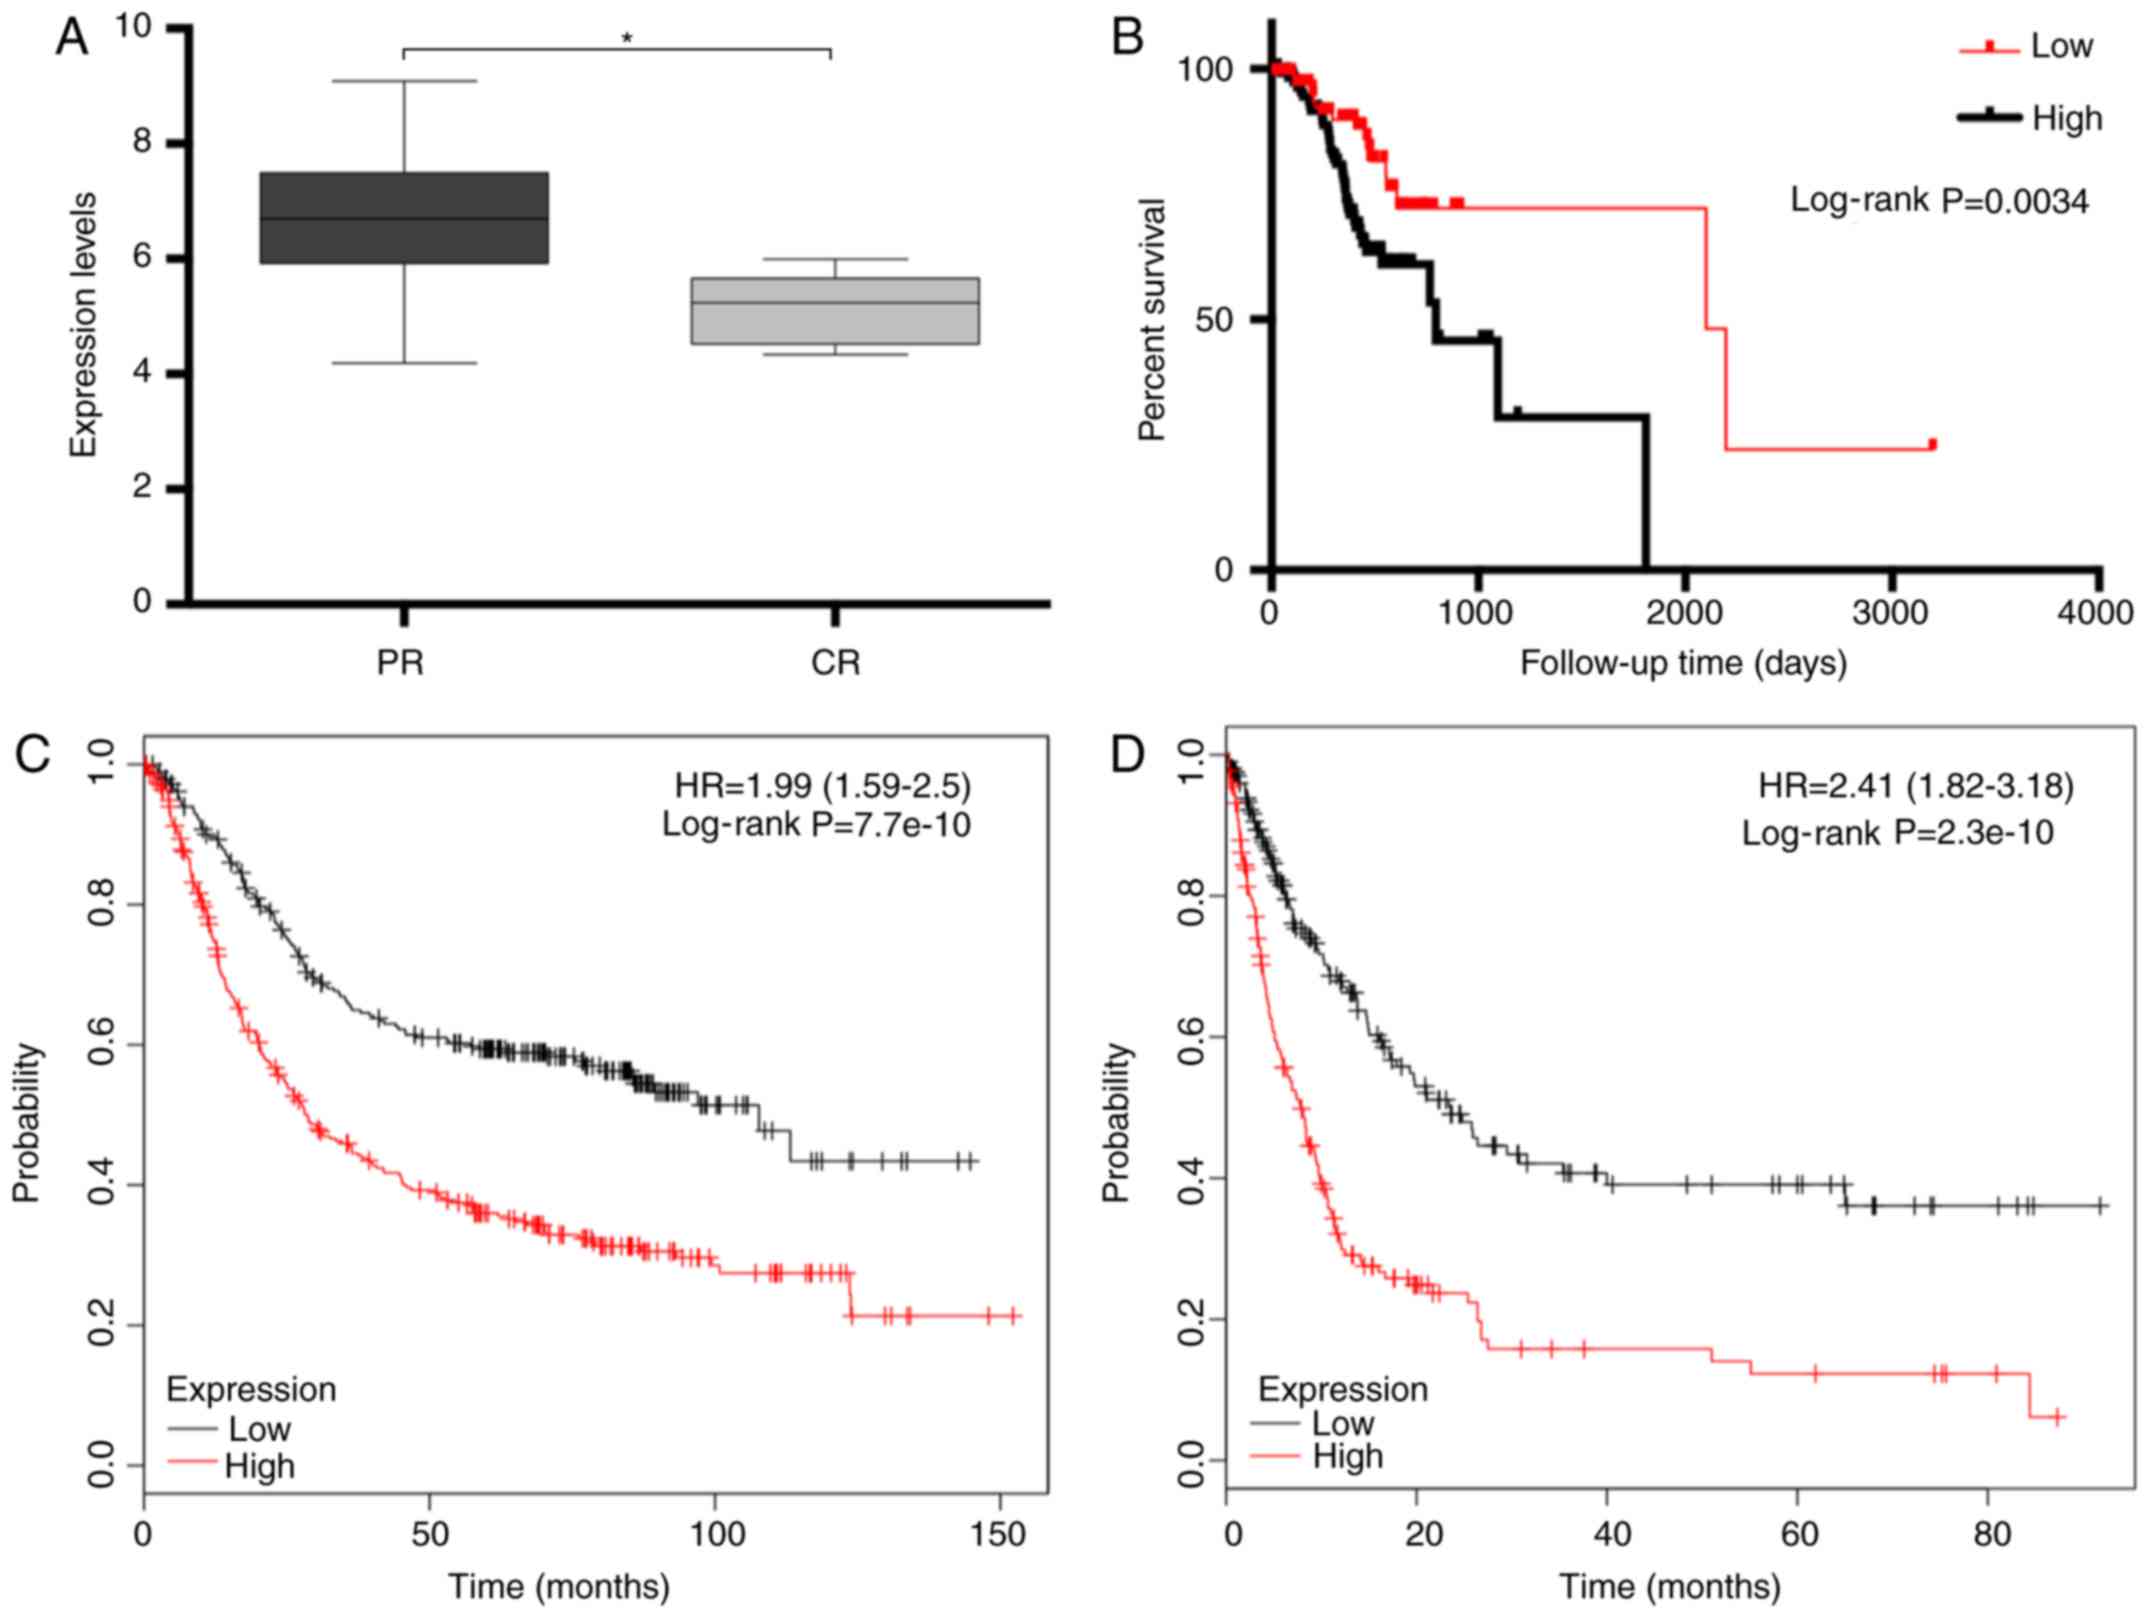
Analysis of the TCGA dataset demonstrated that high expression of
GLIS2 was significantly associated with tumour chemotherapeutic
resistance (P=0.031; Fig. 5A).
Furthermore, high GLIS2 positivity in gastric cancer samples
corresponded to a significantly worse prognosis (P=0.003; Fig. 5B). Similar results were obtained
using the online tools to verify the prognostic role of GLIS2.
Patients with higher GLIS2 positivity had significantly shorter
overall survival (P<0.001; Fig.
5C) and disease-free survival (P<0.001; Fig. 5D) times. In addition, the
association between GLIS2 and other clinicopathological
characteristics was evaluated in patients with gastric cancer
(Table II). The expression of
GLIS2 was significantly associated with histological type
(P=0.039), histological grade (P=0.02), pathological stage
(P=0.013), T stage (P=0.002) and microsatellite instability
(P<0.001).
 | Table I.Hub genes (n=30) contained in the
yellow module. |
Table I.
Hub genes (n=30) contained in the
yellow module.
| Gene symbol | Gene name |
|---|
| COL1A1a | Collagen type I α1
chain |
| COL5A1a | Collagen type V α1
chain |
| COL1A2a | Collagen type I α2
chain |
| FN1a | Fibronectin 1 |
| COL3A1a | Collagen type III
α1 chain |
| COL6A3a | Collagen type VI α3
chain |
| COL5A2a | Collagen type V α2
chain |
| THBS1a | Thrombospondin
1 |
| SPARCa | Secreted protein
acidic and cysteine rich |
|
COL11A1a | Collagen type XI α1
chain |
| ABCA1 | ATP binding
cassette subfamily A member 1 |
| ADAMTSL1 | ADAMTS like 1 |
| BET3L | Trafficking protein
particle complex 3 like |
| BTBD19 | BTB domain
containing 19 |
| ADAM12 | ADAM
metallopeptidase domain 12 |
| AEBP1 | AE binding protein
1 |
| BGN | Biglycan |
| C1QTNF5 | C1q and TNF related
5 |
| ADAMTS12 | ADAM
metallopeptidase with thrombospondin type 1 motif 12 |
| ANTXR1 | ANTXR cell adhesion
molecule 1 |
| BICC1 | BicC family RNA
binding protein 1 |
| C1QTNF6 | C1q and TNF related
6 |
| ADAMTS2 | ADAM
metallopeptidase with thrombospondin type 1 motif 2 |
| ARHGAP22 | Rho GTPase
activating protein 22 |
| BMP1 | Bone morphogenetic
protein 1 |
| CCDC71L | Coiled-coil domain
containing 71 like |
| ADAMTS3 | ADAM
metallopeptidase with thrombospondin type 1 motif 3 |
| ATP10A | ATPase phospholipid
transporting 10A (putative) |
| BMP8A | Bone morphogenetic
protein 8a |
| CD248 | CD248 molecule |
| Table II.Clinicopathological characteristics
of patients according to GLIS2 expression. |
Table II.
Clinicopathological characteristics
of patients according to GLIS2 expression.
| Variable | No. patients | GLIS2 relative of
expression (mean ± standard deviation) | P-value |
|---|
| Age at diagnosis,
years |
|
|
|
|
<60 | 76 | 6.613±0.1318 | 0.053 |
|
≥60 | 157 | 6.299±0.0926 | – |
| Histological
type |
|
|
|
|
Adenocarcinoma | 159 | 6.506±0.0864 | 0.039 |
|
Intestinal adenocarcinoma | 78 | 6.174±0.1460 | <0.05 |
| Pathological
stage |
|
|
|
|
I+II | 125 | 6.231±0.1074 | 0.013 |
|
III+IV | 104 | 6.617±0.1087 | <0.05 |
| Lymph node
status |
|
|
|
| N0 | 84 | 6.234±0.1349 | 0.109 |
|
N1-3 | 154 | 6.487±0.0899 | – |
| Microsatellite
instability |
|
|
|
|
MSS | 157 | 6.604±0.0801 | 0.000 |
| MSI-L+
MSI-H | 81 | 5.998±0.1494 | <0.05 |
| Family history |
|
|
|
| No | 195 | 6.416±0.0859 | 0.682 |
|
Yes | 6 | 6.618±0.3467 | – |
| Sex |
|
|
|
|
Male | 151 | 6.434±0.0910 | 0.523 |
|
Female | 87 | 6.334±0.1333 | – |
| Histological
grade |
|
|
|
|
G1+G2 | 81 | 6.154±0.1378 | 0.020 |
|
G3+GX | 157 | 6.523±0.0882 | <0.05 |
| T stage |
|
|
|
|
T1+T2 | 70 | 6.035±0.1581 | 0.002 |
|
T3+T4 | 165 | 6.551±0.0828 | <0.05 |
| Metastasis |
|
|
|
| M0 | 216 | 6.400±0.0798 | 0.613 |
| M1 | 11 | 6.584±0.3607 | – |
| Drug response |
|
|
|
| Partial
response | 48 | 6.638±0.1598 | 0.002 |
|
Complete response | 6 | 5.158±0.2595 | <0.05 |
| Helicobacter
pylori infection |
|
|
|
| No | 58 | 5.893±0.1588 | 0.680 |
|
Yes | 4 | 6.153±0.6512 | – |
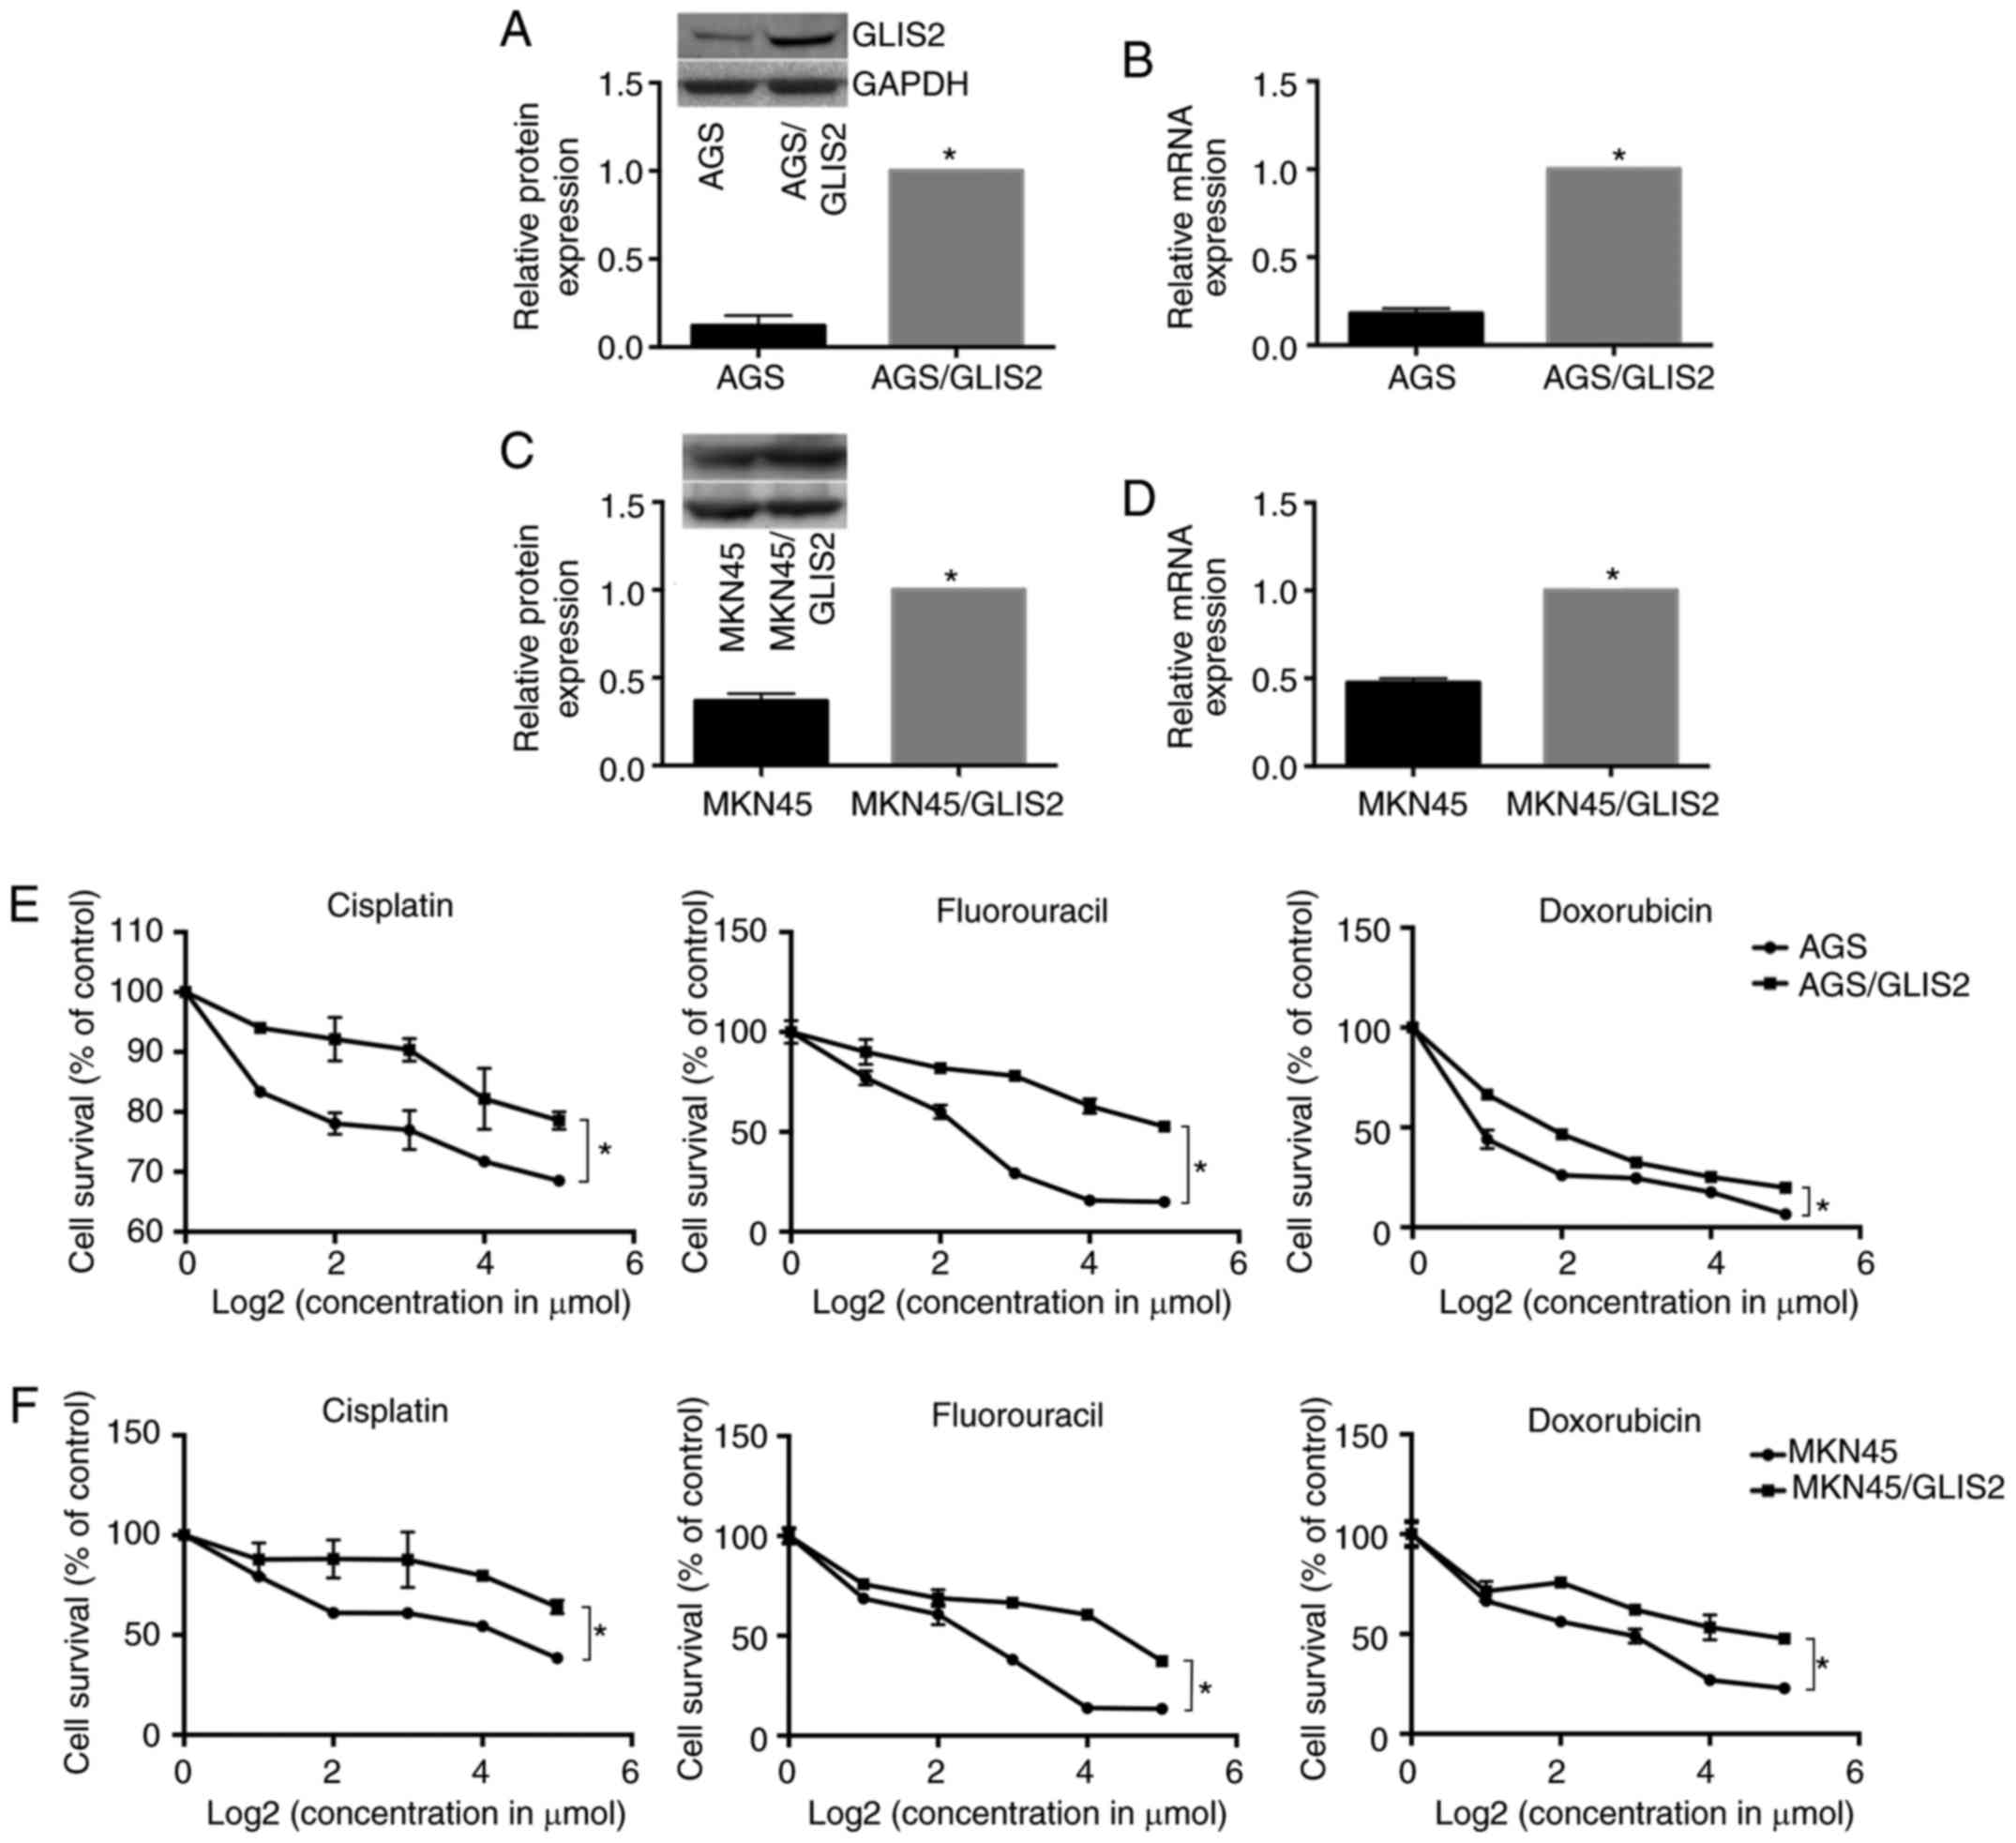
GLIS2 functional verification
To examine whether the overexpression of GLIS2
enhanced chemotherapy tolerance in gastric cancer, MTT assays were
performed. Fig. 6A-D demonstrates
that the relative mRNA and protein expression levels of GLIS2 were
markedly increased following transfection of GLIS2 plasmids in the
AGS and MKN45 cell lines, respectively (P<0.05). Following
treatment with different concentrations of three chemotherapeutic
agents for 24 h, the results indicated that gastric cancer cells
that overexpressed GLIS2 had increased survival in response to
cisplatin, fluorouracil and doxorubicin compared with parental
cells with lower GLIS2 expression. Specifically, the growth
activity of the AGS experimental groups were higher compared with
the control group (Fig. 6E;
P<0.05), and consistent results were also obtained in the MKN45
cell line (Fig. 6F; P<0.05).
Discussion
WGCNA provides an efficient algorithm to reveal the
associations between genes and BP among different diseases and
species (10,11). Modules, or groups of highly
correlated genes, may be a consequence of transcriptional
co-activation, which results in the coordinated operation of
associated gene networks to accomplish a group of biological
functions (13,18). Therefore, a highly connected hub
node may be established to control the entire network and the
associated biological functions, and the hub node may be used for
guiding further study and the clinical treatment of cancer.
Following this approach, raw data for patients with
gastric cancer were downloaded from TCGA database and identified 16
gene co-expression modules using WGCNA. Modules that are
significantly associated with clinical features have important
biological and clinical implications (19). The results of the present study
demonstrated that the yellow module was correlated with drug
response and days to mortality, the red module was associated with
histological type, the blue module was associated with tumour
histological grade, and the tan module was associated with
microsatellite instability. The yellow module, containing 174
genes, was further functionally enriched, and the PPI network was
analysed, as it was apparently associated with chemotherapy
resistance and tumour prognosis. Cell adhesion serves an important
role in the chemotherapy resistance of gastric cancer, and
associated signalling pathways include ECM-receptor interactions
and focal adhesion. Previous studies have illustrated that
ECM-receptor interactions lead to growth arrest at the G1 phase of
the cell cycle and resistance to chemotherapy-induced apoptosis,
and the inhibition of focal adhesion may impair DNA repair,
resulting in increased residual DNA damage and treatment
sensitivity in malignant tumours (20,21).
In addition, the present study demonstrated that the TGF-β and p53
signalling pathways are involved in the chemotherapy resistance of
gastric cancer. The mechanisms of the TGF-β and p53 signalling
pathways in chemoresistance have also been reported and are
involved in the induction of cytoskeletal molecular remodelling,
cell growth regulation and cytokinesis (22–24).
Relevant hub genes are hypothesized to serve an
important role in the biological processes of tissues, and central
hub genes in the network are likely to be key drivers of aberrant
regulatory mechanisms (25). The
hub genes from the yellow module were screened, and it was
identified by reviewing the literature that the roles of the
majority of the genes in chemoresistance have been revealed. GLIS2
was further validated as a candidate hub gene that has an essential
association with the biological behaviour of gastric cancer. GLIS2,
a member of the sub-family of Krüppel-like zinc finger proteins,
has been linked to the development of nephronophthisis, while few
studies have been conducted on the connection between tumorigenesis
and GLIS2 (26). In the TCGA
dataset, GLIS2 was highly correlated with chemotherapy effects and
the prognosis of gastric cancer. To verify this result, a survival
analysis online tool was used to demonstrate that low expression of
GLIS2 is associated with an improved gastric cancer prognosis. In
addition, through gastric cancer cell line culture and MTT assays,
it was demonstrated in vitro that high expression of GLIS2
may increase the chemotherapy resistance of gastric cancer cells.
Furthermore, the analyses indicated that the expression of GLIS2
was significantly associated with histological type, histological
grade, pathological stage, clinical T stage and microsatellite
instability. All these results suggested that GLIS2 may serve an
important role in the development of gastric cancer. However,
whether GLIS2 is an independent prognostic factor requires further
study.
The role and mechanism of GLIS2 in tumorigenesis and
chemoresistance have rarely been reported. Thirant et al
(27,28) reported that the CBFA2/RUNX1
translocation partner 3 (ETO2)-GLIS2 fusion protein controls the
transcription of GATA binding proteins 1 and 2 and ERG by directly
binding to DNA and upregulating the expression of enhancer
elements, and ETO2-GLIS2 is closely associated with a poor
prognosis in leukaemia. Guerra et al (29) reported that activation of GLIS2 is
associated with the overexpression of trophoblast antigen 2,
subsequently driving the transcription factor AP-1, NF-κB and
G1/S-specific cyclin-D1 (CCND1) pathways and leading to
tumorigenesis. NF-κB signalling activates anti-apoptotic genes and
overexpression of drug transporters, and further promotes drug
resistance (30). CCND1 is involved
in chemoresistance, primarily by increasing the expression of
multidrug resistance proteins and regulating the cell cycle
(31).
In conclusion, a molecular network was constructed
based on gene expression and biological characteristics using the
WGCNA approach. Numerous modules and molecular networks associated
with clinical manifestations of gastric cancer have been
demonstrated. Furthermore, GLIS2 was significantly associated with
chemotherapy resistance and the prognosis of gastric cancer. GLIS2
expression is likely to be an important biomarker that is able to
guide clinical treatments and prognostic evaluation. However, the
present study had certain limitations. First, to determine the
validity of this bioinformatics analysis, the expression level of
GLIS2 requires further confirmation in different cell types and
gastric tissue samples. Second, the mechanisms by which GLIS2
causes chemoresistance require further study. Third, whether GLIS2
overexpression in vivo is an important cause of
chemoresistance remains to be confirmed.
Acknowledgements
Not applicable.
Funding
This work was supported by the National Natural
Science Foundation of China (grant no. 81572411).
Availability of data and materials
The datasets used in the present study are available
from The Cancer Genome Atlas database (https://cancergenome.nih.gov/).
Authors' contributions
JG and WS conceived and designed the study. JY was
also involved in the design of the study and conducted the data
analysis. LT and ZY performed the cell line verifications. KT and
GW revised and improved the design of the study and participated in
drafting the manuscript. All authors read and approved the final
manuscript.
Ethics approval and consent to
participate
Not applicable.
Patient consent for publication
Not applicable.
Competing interests
The authors declare that they have no competing
interests.
Glossary
Abbreviations
Abbreviations:
|
DEGs
|
differentially expressed genes
|
|
WGCNA
|
weighted gene co-expression network
analysis
|
|
RNA_seq
|
RNA sequencing
|
|
TCGA
|
The Cancer Genome Atlas
|
|
FC
|
fold change
|
|
FDR
|
false discovery rate
|
|
ME
|
module eigengene
|
|
PPI
|
protein-protein interaction
|
|
DAVID
|
Database for Annotation, Visualization
and Integrated Discovery
|
|
BP
|
biological processes
|
|
KEGG
|
Kyoto Encyclopaedia of Genes and
Genomes
|
|
RT-qPCR
|
reverse transcription-quantitative
polymerase chain reaction
|
|
5-FU
|
fluorouracil
|
|
ECM
|
extracellular matrix
|
|
TGF-β
|
transforming growth factor-β
|
|
ETO2-GLIS2
|
CBFA2/RUNX1 translocation partner
3-GLIS family zinc finger 2 fusion protein
|
|
NF-κB
|
nuclear factor κB
|
|
CCND1
|
G1/S-specific cyclin-D1
|
References
|
1
|
Torre LA, Bray F, Siegel RL, Ferlay J,
Lortet-Tieulent J and Jemal A: Global cancer statistics, 2012. CA
Cancer J Clin. 65:87–108. 2015. View Article : Google Scholar : PubMed/NCBI
|
|
2
|
Ferlay J, Soerjomataram I, Dikshit R, Eser
S, Mathers C, Rebelo M, Parkin DM, Forman D and Bray F: Cancer
incidence and mortality worldwide: Sources, methods and major
patterns in GLOBOCAN 2012. Int J Cancer. 136:E359–E386. 2015.
View Article : Google Scholar : PubMed/NCBI
|
|
3
|
Karimi P, Islami F, Anandasabapathy S,
Freedman ND and Kamangar F: Gastric cancer: Descriptive
epidemiology, risk factors, screening, and prevention. Cancer
Epidemiol Biomarkers Prev. 23:700–713. 2014. View Article : Google Scholar : PubMed/NCBI
|
|
4
|
Yook SH, Oltvai ZN and Barabási AL:
Functional and topological characterization of protein interaction
networks. Proteomics. 4:928–942. 2004. View Article : Google Scholar : PubMed/NCBI
|
|
5
|
Barabási AL and Oltvai ZN: Network
biology: Understanding the cell's functional organization. Nat Rev
Genet. 5:101–113. 2004. View
Article : Google Scholar : PubMed/NCBI
|
|
6
|
Røsok Ø and Sioud M: Discovery of
differentially expressed genes: Technical considerations. Methods
Mol Biol. 360:115–129. 2007.PubMed/NCBI
|
|
7
|
Zhang B and Horvath S: A general framework
for weighted gene co-expression network analysis. Stat Appl Genet
Mol Biol. 4:Article172005. View Article : Google Scholar : PubMed/NCBI
|
|
8
|
Tian F, Zhao J, Fan X and Kang Z: Weighted
gene co-expression network analysis in identification of
metastasis-related genes of lung squamous cell carcinoma based on
the Cancer Genome Atlas database. J Thorac Dis. 9:42–53. 2017.
View Article : Google Scholar : PubMed/NCBI
|
|
9
|
Sun Q, Zhao H, Zhang C, Hu T, Wu J, Lin X,
Luo D, Wang C, Meng L, Xi L, et al: Gene co-expression network
reveals shared modules predictive of stage and grade in serous
ovarian cancers. Oncotarget. 8:42983–42996. 2017.PubMed/NCBI
|
|
10
|
Oldham MC, Horvath S and Geschwind DH:
Conservation and evolution of gene coexpression networks in human
and chimpanzee brains. Proc Natl Acad Sci USA. 103:17973–17978.
2006. View Article : Google Scholar : PubMed/NCBI
|
|
11
|
Miller JA, Horvath S and Geschwind DH:
Divergence of human and mouse brain transcriptome highlights
Alzheimer disease pathways. Proc Natl Acad Sci USA.
107:12698–12703. 2010. View Article : Google Scholar : PubMed/NCBI
|
|
12
|
Ritchie ME, Phipson B, Wu D, Hu Y, Law CW,
Shi W and Smyth GK: limma powers differential expression analyses
for RNA-sequencing and microarray studies. Nucleic Acids Res.
43:e472015. View Article : Google Scholar : PubMed/NCBI
|
|
13
|
Langfelder P and Horvath S: WGC NA An R
package for weighted correlation network analysis. BMC
Bioinformatics. 9:5592008. View Article : Google Scholar : PubMed/NCBI
|
|
14
|
Huang da W, Sherman BT and Lempicki RA:
Systematic and integrative analysis of large gene lists using DAVID
bioinformatics resources. Nat Protoc. 4:44–57. 2009. View Article : Google Scholar : PubMed/NCBI
|
|
15
|
Livak KJ and Schmittgen TD: Analysis of
relative gene expression data using real-time quantitative PCR and
the 2 (-Delta Delta C(T)) method. Methods. 25:402–408. 2001.
View Article : Google Scholar : PubMed/NCBI
|
|
16
|
Bindea G, Mlecnik B, Hackl H, Charoentong
P, Tosolini M, Kirilovsky A, Fridman WH, Pagès F, Trajanoski Z and
Galon J: ClueGO: A Cytoscape plug-in to decipher functionally
grouped gene ontology and pathway annotation networks.
Bioinformatics. 25:1091–1093. 2009. View Article : Google Scholar : PubMed/NCBI
|
|
17
|
Szász AM, Lánczky A, Nagy Á, Förster S,
Hark K, Green JE, Boussioutas A, Busuttil R, Szabó A and Győrffy B:
Cross-validation of survival associated biomarkers in gastric
cancer using transcriptomic data of 1,065 patients. Oncotarget.
7:49322–49333. 2016. View Article : Google Scholar : PubMed/NCBI
|
|
18
|
Han L, Diao L, Yu S, Xu X, Li J, Zhang R,
Yang Y, Werner HMJ, Eterovic AK, Yuan Y, et al: The genomic
landscape and clinical relevance of A-to-I RNA editing in human
cancers. Cancer Cell. 28:515–528. 2015. View Article : Google Scholar : PubMed/NCBI
|
|
19
|
Chen Y, Zhu J, Lum PY, Yang X, Pinto S,
MacNeil DJ, Zhang C, Lamb J, Edwards S, Sieberts SK, et al:
Variations in DNA elucidate molecular networks that cause disease.
Nature. 452:429–435. 2008. View Article : Google Scholar : PubMed/NCBI
|
|
20
|
Eke I and Cordes N: Focal adhesion
signaling and therapy resistance in cancer. Semin Cancer Biol.
31:65–75. 2015. View Article : Google Scholar : PubMed/NCBI
|
|
21
|
Cortesio CL, Boateng LR, Piazza TM, Bennin
DA and Huttenlocher A: Calpain-mediated proteolysis of paxillin
negatively regulates focal adhesion dynamics and cell migration. J
Biol Chem. 286:9998–10006. 2011. View Article : Google Scholar : PubMed/NCBI
|
|
22
|
Cichon MA and Radisky DC: Extracellular
matrix as a contextual determinant of transforming growth factor-β
signaling in epithelial-mesenchymal transition and in cancer. Cell
Adh Migr. 8:588–594. 2014. View Article : Google Scholar : PubMed/NCBI
|
|
23
|
Park J, Lee J, Kang W, Chang S, Shin EC
and Choi C: TG F-β1 and hypoxia-dependent expression of MKP-1 leads
tumor resistance to death receptor-mediated cell death. Cell Death
Dis. 4:e5212013. View Article : Google Scholar : PubMed/NCBI
|
|
24
|
Knappskog S and Lønning PE: P53 and its
molecular basis to chemoresistance in breast cancer. Expert Opin
Ther Targets. 16((Suppl 1)): S23–S30. 2012. View Article : Google Scholar : PubMed/NCBI
|
|
25
|
Yang Y, Han L, Yuan Y, Li J, Hei N and
Liang H: Gene co-expression network analysis reveals common
system-level properties of prognostic genes across cancer types.
Nat Commun. 5:32312014. View Article : Google Scholar : PubMed/NCBI
|
|
26
|
Lichti-Kaiser K, ZeRuth G, Kang HS,
Vasanth S and Jetten AM: Gli-similar proteins: Their mechanisms of
action, physiological functions, and roles in disease. Vitam Horm.
88:141–171. 2012. View Article : Google Scholar : PubMed/NCBI
|
|
27
|
Thirant C, Ignacimouttou C, Lopez CK, Diop
M, Le Mouël L, Thiollier C, Siret A, Dessen P, Aid Z, Rivière J, et
al: ETO2-GLIS2 hijacks transcriptional complexes to drive cellular
identity and self-renewal in pediatric acute megakaryoblastic
leukemia. Cancer Cell. 31:452–465. 2017. View Article : Google Scholar : PubMed/NCBI
|
|
28
|
Thirant C, Lopez C, Malinge S and Mercher
T: Molecular pathways driven by ETO2-GLIS2 in aggressive pediatric
leukemia. Mol Cell Oncol. 4:e13453512017. View Article : Google Scholar : PubMed/NCBI
|
|
29
|
Guerra E, Trerotola M, Aloisi AL, Tripaldi
R, Vacca G, La Sorda R, Lattanzio R, Piantelli M and Alberti S: The
Trop-2 signalling network in cancer growth. Oncogene. 32:1594–1600.
2013. View Article : Google Scholar : PubMed/NCBI
|
|
30
|
Li F, Zhang J, Arfuso F, Chinnathambi A,
Zayed ME, Alharbi SA, Kumar AP, Ahn KS and Sethi G: NF-κB in cancer
therapy. Arch Toxicol. 89:711–731. 2015. View Article : Google Scholar : PubMed/NCBI
|
|
31
|
Sewify EM, Afifi OA, Mosad E, Zaki AH and
El Gammal SA: Cyclin D1 amplification in multiple myeloma is
associated with multidrug resistance expression. Clin Lymphoma
Myeloma Leuk. 14:215–222. 2014. View Article : Google Scholar : PubMed/NCBI
|