Introduction
Colorectal cancer (CRC) is one of the most common
types of cancers and the second leading cause of cancer-associated
mortalities among men and women combined (1). The prevalence of CRC has been
gradually increasing over the last decade, and although the causes
are not fully understood, certain factors such as
lifestyle-associated stress, an unhealthy diet and environmental
pollution are known to increase the risk of developing this disease
(2).
Comparative studies between primary and metastatic
tumour cells are preferentially performed using specific animal
metastasis models, as Fidler (3)
first employed to study melanoma. In this investigation, murine
melanoma B16 cells were inoculated systemically into mice and, upon
animal sacrifice, metastasized lung cells were collected. The
metastatic cells collected in the lungs were injected into other
mice 10 times. Consequently, during the repetition of the
experiment, the cells obtained all of the molecular and phenotypic
changes required to become metastatic cells. The same strategy has
also been applied to study distinct metastatic processes, including
breast to liver metastasis (4),
melanoma to brain metastasis (5)
and colorectal cancer to liver metastasis, using an orthotopic
mouse model of the metastasis of human colon cancer to liver
(6). As aforementioned, many of
these investigations focused on deciphering the molecular events
driving metastasis, generating the metastatic cell line by
repeatedly inoculating the same cells into the animals until they
completed all of the transformations required to be metastatic.
However, it is important to consider that the intermediate steps
that primary cancer cells undergo prior to the completion of the
metastatic transformation may be essential to obtain a better
understanding of the cellular, molecular and biological processes
that result in metastasis. Thus, in order to elucidate the
incipient transformations of the primary cells during their
metastatic transition, the present study used a murine liver
metastasis model in which liver metastasis was induced by
intrasplenic injection of CRC cells. Fifteen days following the
inoculation, cancer cells that remained in the spleen were
considered to be non-metastatic, whereas cancer cells that had
colonized the liver were considered to be metastatic cells. Unlike
the Fidler experiment where the cells were collected following 10
inoculations to ensure that the collected cells were completely
transformed, the present study performed a single cell inoculation
and therefore collected cancer cells that exhibited marks of
incipient transformations.
In the last few years, a number of large-scale
comparative studies have been performed to identify discrete
molecular patterns within primary and metastatic cancer cells by
comparing their metabolism, DNA methylation, gene expression and
microRNA expression pattern, among other characteristics (7–11).
Considering the pivotal role of proteins in orchestrating the
majority of all cellular functions, it is not surprising that the
proteomes of primary and metastatic cancer cells have been
extensively studied as well (10).
Specifically, with the aim to elucidate the key factors involved in
CRC malignancy, Tan et al (12) investigated the differences in
protein expression observed between a primary and metastatic CRC
cell line using 2-dimensional (2D) gel electrophoresis in
combination with mass spectrometry (MS). This study identified 148
differentially expressed protein spots involved in a wide range of
cellular functions (12).
Due to the numerous inherent drawbacks of 2D
gel-based proteomic approaches for protein identification and
quantification, various gel-free alternatives have been developed
in the last decade. One of the most widely applied MS-based methods
to simultaneously quantify changes in thousands of proteins with
high accuracy and sensitivity is the so-called, stable isotope
labelling of amino acids in cell culture (SILAC) method (13). SILAC is a metabolic labelling
technique that consists of growing cells that are going to be
compared in the presence of isotopically distinct versions of
lysine and arginine. Upon complete labelling of their corresponding
proteomes, differentially labelled cells are lysed, and the
resulting protein extracts are equitably combined and processed in
a single workflow. The greatest advantage of SILAC over other
chemical-labelling methods, including isobaric tags for relative
and absolute quantitation, tandem mass tags or isotope-coded
affinity tag, is that samples are mixed at early stages of the
sample process, and so sample loss and variability are
significantly diminished, which leads to high reproducibility and
precision (14). SILAC pairs are
identical and only differ in their mass; consequently, they
co-elute in high performance liquid chromatography but are
distinguished using a mass spectrometer. The relative
quantification of the peptides results from comparisons between the
intensities of the neighbouring SILAC pairs, and the identification
results from the fragmentation of either the light or heavy version
of the same SILAC peptide (13).
In the present study, incipient CRC metastatic cells
were compared with non-metastatic CRC cells using the SILAC method
and an MS-based analysis in order to identify and quantify the
early proteomic changes that occur in the metastatic cells. Among
all of the proteins that were detected as deregulated in metastatic
cancer cells with respect to primary cancer cells, those belonging
to nicotinamide adenine dinucleotide hydride (NADH) dehydrogenase
complex I were studied in detail. A major energy requirement for
metastatic cells was associated with the overexpression of NADH
dehydrogenase complex I proteins, as postulated by the Warburg
effect (15). However, during the
analysis of functionality, it was observed that it was a vestige of
the cell transformation that was not functional at all.
Materials and methods
Animals
A total of 24 syngeneic BALB/c mice (male; 6–8 weeks
old; weight, ~25 g) were obtained from Charles River (Barcelona,
Spain). Animal housing, care and experimental conditions were
conducted in conformity with institutional guidelines and
international laws following the criteria outlined in the ‘Guide
for the Care and Use of Laboratory Animals’ prepared by the
National Academy of Sciences and published by the National
Institutes of Health (16). The
animals were fed with standard chow and water ad libitum and
were housed at 20–21°C and 55–65% humidity with a 12-h light/dark
cycles. The animal experiments performed in the present study were
approved by the Ethical Committee for Animal Experiments of the
University of the Basque Country (Leioa, Spain; no.
CEBA/237/2012/BADIOLA ETXABURU).
Cell culture
Murine colon carcinoma C26.WT cells (American Type
Culture Collection, Manassas, VA, USA) were maintained at 37°C and
5% CO2 in RPMI-1640 medium (Sigma-Aldrich; Merck KGaA,
Darmstadt, Germany) supplemented with 10% foetal bovine serum (FBS;
Gibco; Thermo Fisher Scientific Inc., MA, USA), and 1%
penicillin/streptomycin (p/s; Sigma-Aldrich; Merck KGaA).
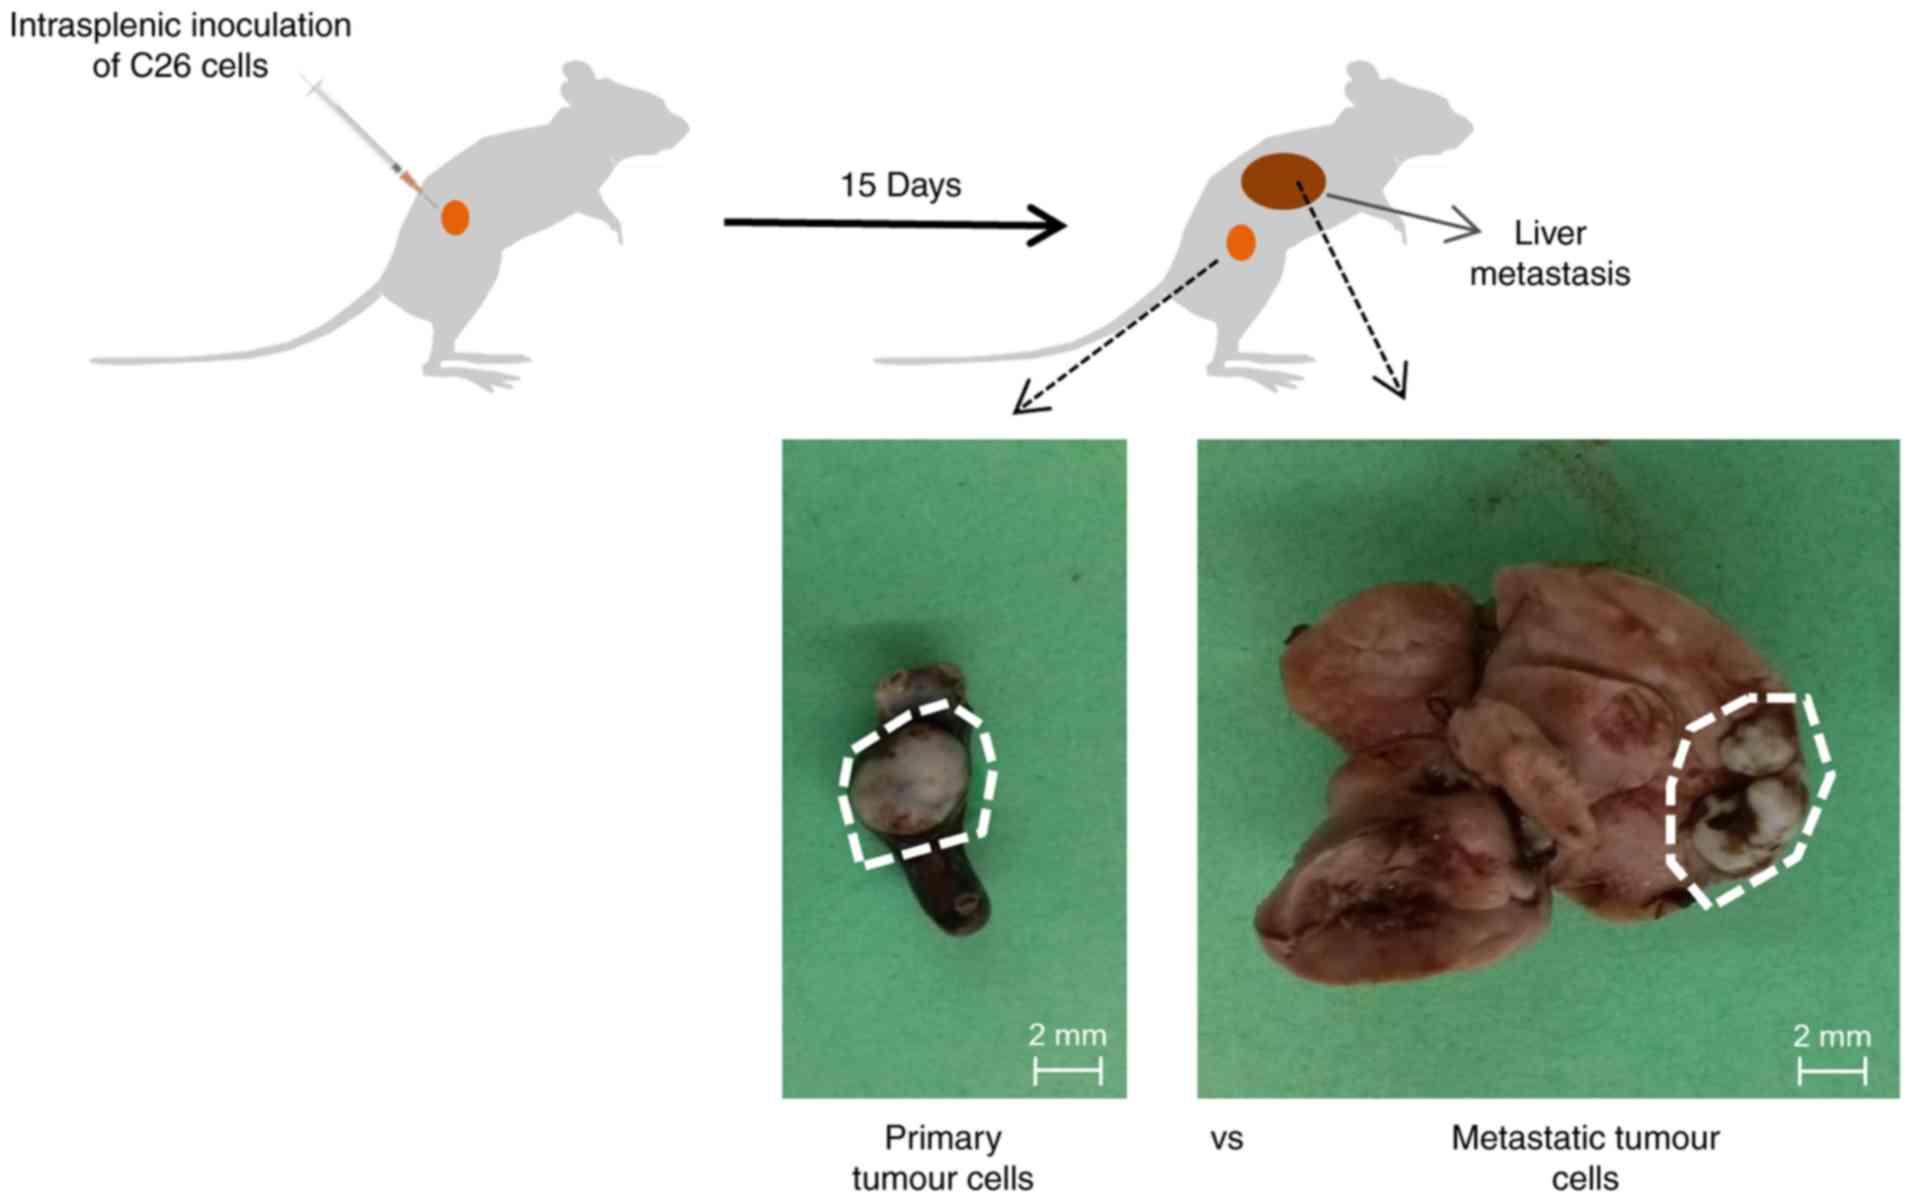
Experimental liver metastasis
Hepatic metastases were produced by intrasplenic
inoculation of 1.5×10⁶ colorectal carcinoma C26.WT cells
into anaesthetized syngeneic BALB/c mice, as previously reported
(17). Mice were sacrificed 15 days
following tumour development and two different types of tumours
(the spleen primary tumour and liver metastatic tumour) were
carefully dissected and extracted from each organ (Fig. 1). The dissected tumours were
cultured on a petri dishes with 0.25% trypsin-EDTA for 5 min at
37°C and 5% CO2, and following extensive washing with
PBS, disaggregated viable cells were maintained in RPMI-1640 medium
supplemented with 10% FBS and gentamicin (10 µl/ml; Sigma-Aldrich;
Merck KGaA).
SILAC labelling and protein
extraction
For SILAC experiments, the RPMI media was
custom-made and deficient for L-Arg and L-Lys (Thermo Fisher
Scientific, Inc., Waltham, MA, USA). The media was supplemented
with 10% dialyzed serum (Thermo Fisher Scientific, Inc.), 1% p/s
(Merck KGaA), 10 µl/ml gentamicin (Merck KGaA) and different
isotopes of lysine and arginine (Lys0/Arg0 or Lys4/Arg6).
Cells were lysed with ice-cold
co-immunoprecipitation buffer (25 mM Tris-HCl pH 7.5, 100 mM NaCl,
1% NP-40, 1 mM sodium pervanadate, 5 mM β-glycerophosphate and 5 mM
NaF) and complete protease inhibitor cocktail (complete tablets;
Roche Diagnostics, Basel, Switzerland), and protein concentrations
were estimated using a BCA protein assay (Thermo Fisher Scientific,
Inc.). Protein lysates corresponding to differentially labelled
primary and metastatic C26.WT cells were combined in a protein
concentration ratio of 1:1 (primary Lys0/Arg0:metastatic Lys4/Arg6
in two of the replicates and primary Lys4/Arg6:metastatic Lys0/Arg0
in one additional replicate).
SDS-PAGE and in-gel digestion
Protein lysates were run in two parallel lanes of a
precast NuPAGE 4–12% Bis-Tris gel (Thermo Fisher Scientific, Inc.)
and visualized with colloidal blue (Thermo Fisher Scientific,
Inc.). Both gel lanes were separately cut into slices and subjected
to in-gel reduction, alkylation and 5 ng/µl trypsin digestion as
previously described (18). Derived
peptides were concentrated and desalted using C18 STAGE Tips and
further analysed by liquid chromatography (LC)-MS/MS. Experiments
were performed in duplicate, with the biological conditions
reversed between light and heavy SILAC labels.
In-solution digestion and pISep
fractionation
Protein lysates derived from primary (Lys0/Arg0) and
metastatic (Lys4/Arg6) cancer cells were combined and digested in
solution using 5 ng/µl LysC and 5 ng/µl trypsin, as previously
described (19). Tryptic peptides
were then acidified with trifluoroacetic acid (TFA) to a final
concentration of 0.3% and concentrated using a C18
Sep-Pak cartridge (Waters Corporation, Milford, MA, USA), according
to the manufacturer's instructions. The organic solvent was
evaporated using SpeedVAC, and then peptides were subjected to pH
gradient fractionation (pISep; CryoBioPhysica, Rockville, MD, USA).
Briefly, the peptide mixture was diluted twice with buffer A [pISep
concentrate A (CryoBioPhysica), 25% acetonitrile (ACN), 1% acetic
acid, pH 2.8] and loaded onto a small column containing a mixture
of strong-cation and weak-cation exchange material (PolySULFOETHYL
A™ and PolyCAT A™; PolyLC Inc., Columbia, MD, USA). Peptides were
eluted by a stepwise increase in the pH of the elution buffer from
pH 3.5 to 10.0 that was achieved by mixing buffers A and B [pISep
concentrate B (CryoBioPhysica), 25% acetonitrile, 0.5% ammonium
hydrochloride, pH 10.8] in different volumes. The flow-through and
11 elution fractions were collected for each technical replicate.
Each fraction was dried down in a SpeedVAC and adjusted to a final
concentration of 1.7% ACN/0.33% TFA. Then, the peptides were
concentrated and desalted using C18 STAGE tips and
further analysed by LC-MS/MS.
LC-MS/MS analysis
LC-MS/MS analysis of peptides that had previously
been concentrated and desalted was performed using a reversed-phase
liquid chromatography system (EASY-nLC 1000 ultra-high pressure;
Thermo Fisher Scientific, Inc.) interfaced with a Q Exactive mass
spectrometer (Thermo Fischer Scientific, Inc.) via a
nanoelectrospray source (Thermo Fisher Scientific, Inc.). Acidified
peptides were loaded on an analytical in-house packed column (20 cm
×75 µm; ReproSil-Pur C18-AQ 3 µm resin; Dr. Maisch HPLC
GmbH, Ammerbuch, Germany) in solvent A (0.5% acetic acid) and
eluted by a nonlinear 120 min solvent B gradient (0.5% acetic acid,
80% ACN) at a flow rate of 250 nl/min. Q Exactive was operated in a
top 10 data-dependent mode. Survey scans were acquired at a
resolution of 70,000 (m/z 400) and fragmentation spectra at 35,000
(m/z 400). MS/MS data were acquired in negative ion mode.
Precursors were fragmented by higher energy C-trap dissociation
(HCD) with a normalized collision energy of 25 eV. The maximum
injection time was 120 msec for the survey and 124 msec for the
MS/MS scan, where the AGC target values of 1e6 and 1e4 were used
for survey scans and for MS/MS scans, respectively. In the Velos
Orbitrap MS system survey, full-scan MS spectra (m/z range,
300–1,750; resolution 30,000 at m/z 400) were acquired and the 8
most intense multiple charged ions were fragmented by HCD
(resolution 15,000 at m/z 400). Repeat sequencing of the peptide
was minimized by excluding the selected peptide candidates for 45
sec. All raw data files acquired were searched against the UniProt
(www.uniprot.org/) mouse database version 2014.01
(with 88,479 sequence entries) with a MaxQuant proteomics
computational platform version 1.3.0.5 and using the Andromeda
search engine (Cox and Mann ref). In the SILAC experiments, light
and heavy labels were set as Arg0/Lys0 and Arg6/Lys4. Precursor and
fragment mass tolerances were set to 7 and 20 ppm, respectively.
Enzyme specificity was set to trypsin, allowing for cleavage of the
N-terminal to proline and between aspartic acid and proline (with a
maximum of 2 missed cleavages). Carbamidomethylation of C was set
as a fixed modification, whereas oxidation of M, protein N-terminal
acetylation and NQ deamidation were selected as variable
modifications for database searching. For peptide and protein
identification a minimal peptide length of 7 amino acids was
required, and the false discovery rate was set at 0.01.
Additionally, for protein identification at least two peptides were
required, of which at least one was unique to the protein group.
The razor and unique peptides were considered for protein
quantification.
Migration assay
Metastatic and primary C26.WT cells were seeded on
three collagen (Sigma-Aldrich; Merck KGaA) precoated transwell cell
culture inserts (Greiner Bio-One North America Inc., Monroe, NC,
USA) in 24-well culture plates with RPMI-1640 without serum in the
upper chamber at a concentration of 2×10⁵ cells/ml, and
RPMI-1640 with 0.5% FBS (Gibco; Thermo Fisher Scientific Inc.) was
plated in the lower chamber. Following 18 h of incubation, the
migration levels were assessed by staining the chambers with eosin
at room temperature for 10 min. The number of migrated cells was
estimated under a light microscope (magnification, ×20) using
ImageJ 1.48v software (National Institutes of Health, Bethesda, MD,
USA). The experiment was repeated three times.
Western blotting
Western blot analysis was performed with cell
lysates from primary and metastatic tumour cells. Cell lysates were
obtained with Radioimmunoprecipitation Assay lysis buffer
(Sigma-Aldrich; Merck KGaA) and the protein concentration was
determined by a Pierce BCA Protein Assay kit (Thermo Fisher
Scientific, Inc.). A total of 25 µg of each cell lysate was
separated by 10% SDS-PAGE, and blotted onto a polyvinylidene
difluoride (PVDF) membrane (Bio-Rad Laboratories, Hercules, CA,
USA). Then, the membrane was blocked for 1 h at room temperature
with TBS-T (Tween 0.5%) in 5% milk and incubated overnight at 4°C
with the following primary antibodies: H3K4me3 (1:300; Abcam,
Cambridge, MA, USA; cat. no. ab12209), H3K9me3 (1:1,000; Abcam;
cat. no. ab8898) and histone 3 lysine 27 trimethylated (H3K27me3;
1:500; Abcam; cat. no. ab6002). Histone 3 (1:1,000; Sigma-Aldrich;
Merck KGaA; cat. no. H0164) was used as the control. Following
extensive washing with 1% TBS-T, membranes were incubated for 1 h
at room temperature with the corresponding secondary antibody:
Horseradish peroxidase-conjugated goat anti-mouse (1:1,000;
Sigma-Aldrich Merck KGaA; cat. no. AP308P) or goat anti-rabbit
(1:3,000; Abcam; cat. no. ab6721). The membranes were developed
with an enhanced chemiluminescence (ECL) system (GE Healthcare,
Chicago, IL, USA), and the images were analysed using the
transluminator Gel Doc 2000 (Bio-Rad Laboratories) and Gel
Documentation System (with Image Lab™ software 5.0; Bio-Rad
Laboratories).
NADH assay
The NADH colorimetric assay was performed according
to the manufacturer's instructions (ScienCell Research
Laboratories, Inc., San Diego, CA, USA; cat. no. 8368). Briefly, a
standard curve was prepared using the provided material.
Independently, the working reagent was prepared by mixing 76 µl
assay buffer, 10 µl lactate solution, 2 µl
2-(4-iodophenyl)-3-(4-nitrophenyl)-5-phenyl-2H-tetrazolium and 2 µl
enzyme mix. Next, 90 µl of the working reagent was mixed into each
well of the 96-well plate containing the NAD standard, test samples
and blank. Plates were incubated for 20 min at room temperature and
were protected from light; the absorbance was read at a wavelength
of 490 nm on an ELISA plate reader.
Intracellular reactive oxygen species
(ROS) measurement
C26.WT cells were cultured in a 24-well plate at a
concentration of 100,000 cells/well. Then, the accumulation of ROS
within cells was measured by labelling cells for 1 h at 37°C and 5%
CO2 with 10 µM
5,6-chloromethyl-20,70-dichlorodihydrofluoresceindiacetate
(CM-DCFDA; Molecular Probes; Thermo Fisher Scientific, Inc.; cat.
no. C6827). The total cell number was determined by staining cells
with 5 µl/ml Hoechst (Molecular Probes; Thermo Fisher Scientific,
Inc.; cat. no. H1398) for 1 h at 37°C and 5% CO2.
Finally, fluorescence was measured using a Fluoroskan Ascent plate
fluorimeter (Thermo Labsystems, Santa Rosa, CA, USA), and data are
expressed as a normalized percentage of CM-DCFDA/Hoechst
fluorescence.
Mitochondrial potential
measurement
Primary and metastatic tumour cells were cultured in
24-well plates, loaded with 100 nM tetramethylrhodamine ethyl ester
(TMRE; Molecular Probes; Thermo Fisher Scientific, Inc.; cat. no.
T669) and maintained for 1 h at 37°C and 5% CO2. TMRE is
a highly membrane-permeant cationic fluorophore that accumulates in
negatively charged subcellular compartments, notably mitochondria.
Under non-quenching conditions, quantifying the retention of the
dye by whole cells provides an estimate of their average
mitochondrial potential. As aforementioned, Hoechst fluorescence
was used to quantify the number of cells present within the reading
field. Fluorescence was measured using a Fluoroskan Ascent plate
fluorimeter (Thermo Labsystems), and the data were expressed as a
normalized percentage of TMRE/Hoechst fluorescence.
Statistical analysis
Statistical analysis was performed with Student's
two-tailed unpaired t-tests using Excel 2016 (Microsoft
Corporation, Redmond, WA, USA). All experiments were carried out in
triplicate, and data were expressed as the mean ± standard
deviation. P<0.05 was considered to indicate a statistically
significant difference.
Results
C26.WT murine colon cancer cells
extracted from the liver exhibit metastatic characteristics
Metastatic and non-metastatic colon cancer cells
were obtained using a murine liver metastasis model. The in
vivo experiments were performed in duplicate with 6
animals/group (total n=24 animals). Animals were injected with the
C26.WT murine colon cancer cell line intrasplenically. Following 15
days, the cancer cells remaining in the spleen, as well as those in
the liver, were collected (Fig. 1).
All of the animals injected with cancer cells directly into the
spleen following inoculation exhibited primary tumours in the
spleen and metastatic liver tumours.
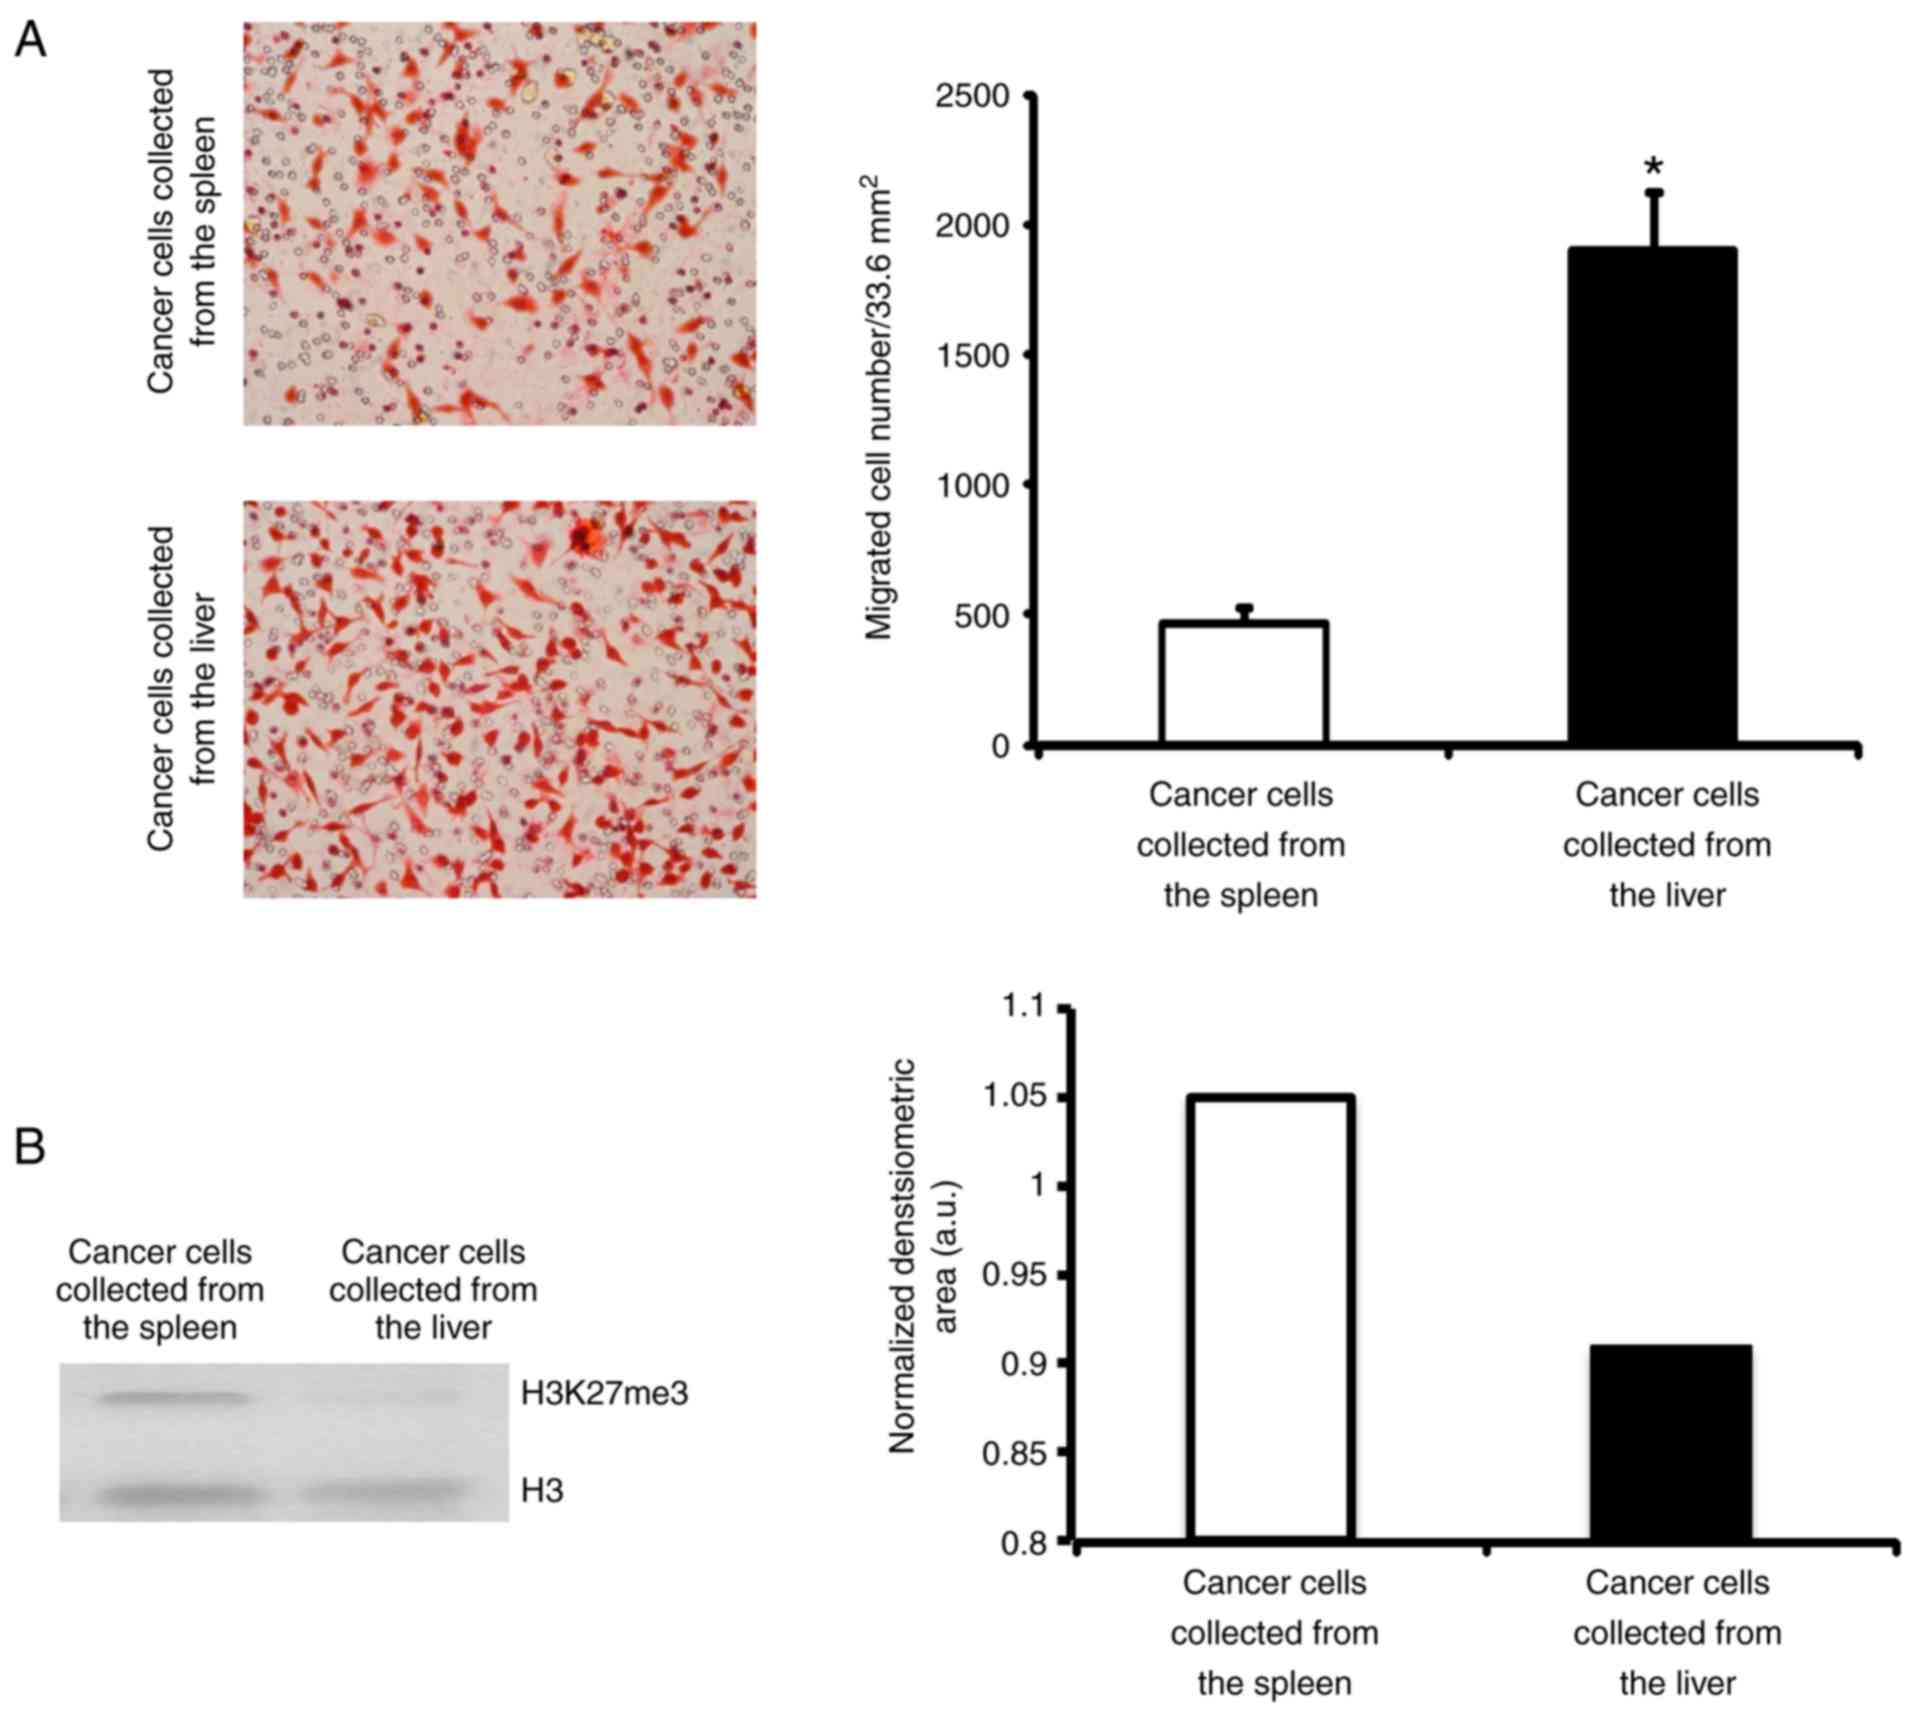
A general characteristic of metastatic cells is
their capacity to migrate (20). To
confirm that the cancer cells extracted from the liver were
metastatic, the present study measured their capacity to migrate.
Primary as well as metastatic cancer cells extracted from the
spleen and liver, respectively, were incubated on a collagen type
I-covered 8 µm-diameter pore membrane. Following 18 h, the number
of cells that had crossed over the pores were quantified. It was
revealed that liver tumour cells migrated 4 times more than primary
tumour cells, which was in agreement with their increased invasive
capacity (Fig. 2).
Additionally, epigenetic changes are widely
associated with cancer (21) and
specifically the demethylation of histone 3 at lysine 27 has been
described to influence colorectal liver metastatic capacity
(22). Therefore, to validate the
metastatic capacity of cancer cells, the present study detected and
compared the presence of H3K27me3 in colorectal cancer cells
isolated from the spleen, and colorectal cancer cell growth in the
liver by western blotting. As shown in Fig. 2B, the cancer cells isolated from the
liver had reduced levels of H3K27me3 when in comparison with those
of cells extracted from the spleen. These results indicated that
the cancer cells growing in the liver were metastatic cancer
cells.
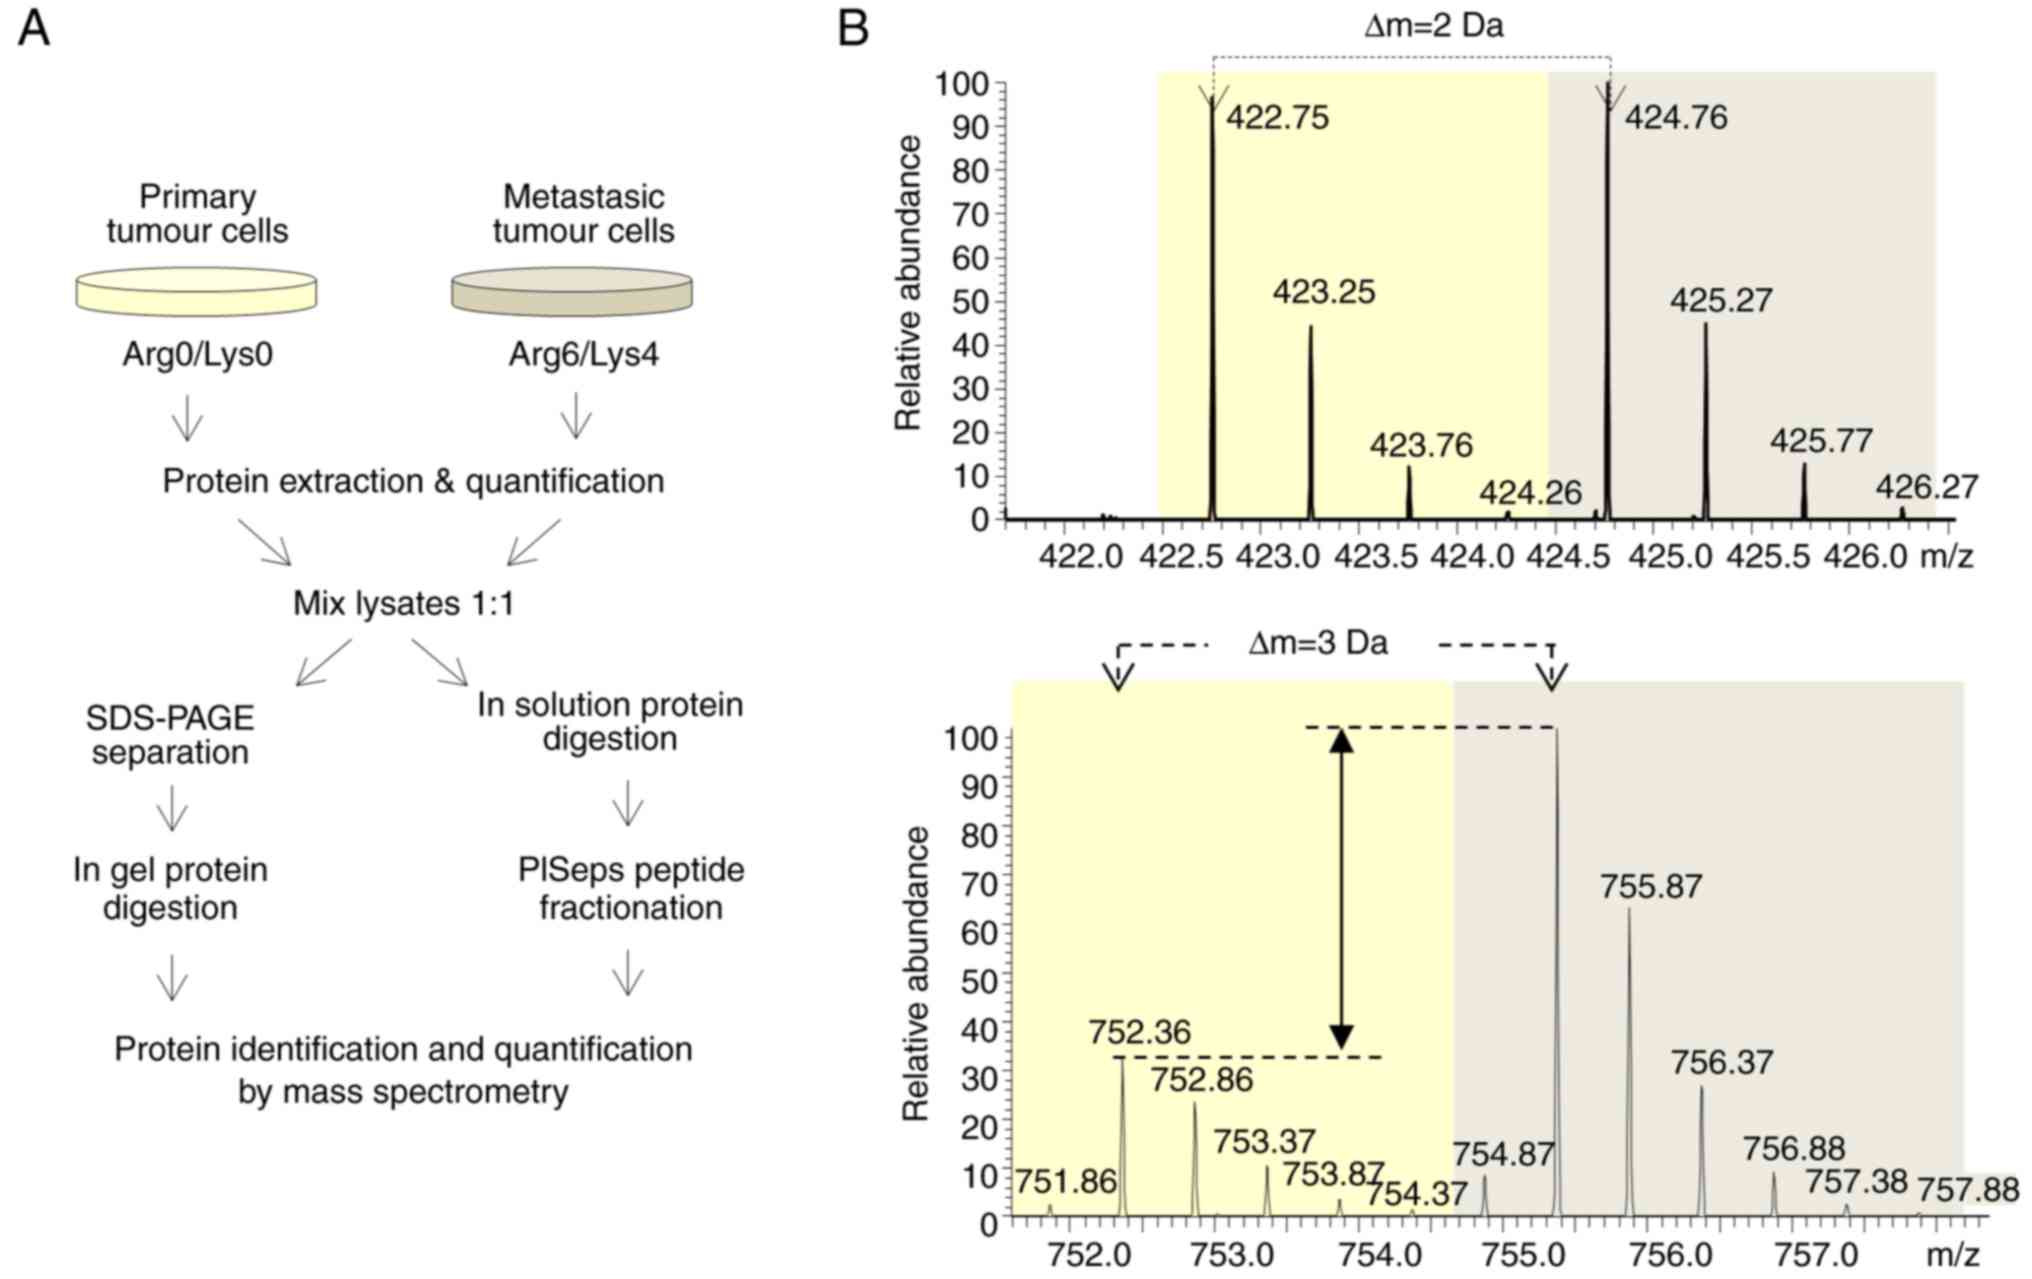
Differential proteomics of metastatic
and non-metastatic colon cancer cells
To understand the molecular events that trigger the
metastatic capacity of the colon cancer cells observed in the
liver, the present study performed SILAC-based quantitative
proteomics analysis and compared the proteome of metastatic and
non-metastatic colon cancer cells extracted from the spleen and
liver. Briefly, extracted primary and metastatic cancer cells were
grown in the presence of either light or heavy Lys and Arg amino
acids. Once their proteomes were labelled, proteins were extracted,
quantified and equivalently combined. Half of the mixed sample was
fractionated by SDS-PAGE, the proteins were in-gel digested, and
the resultant peptides were analysed by LC-MS/MS. The other half of
the mixed sample was in-solution digested, and the resultant
peptides were fractionated using the PISep procedure prior to MS
analysis (Fig. 3A).
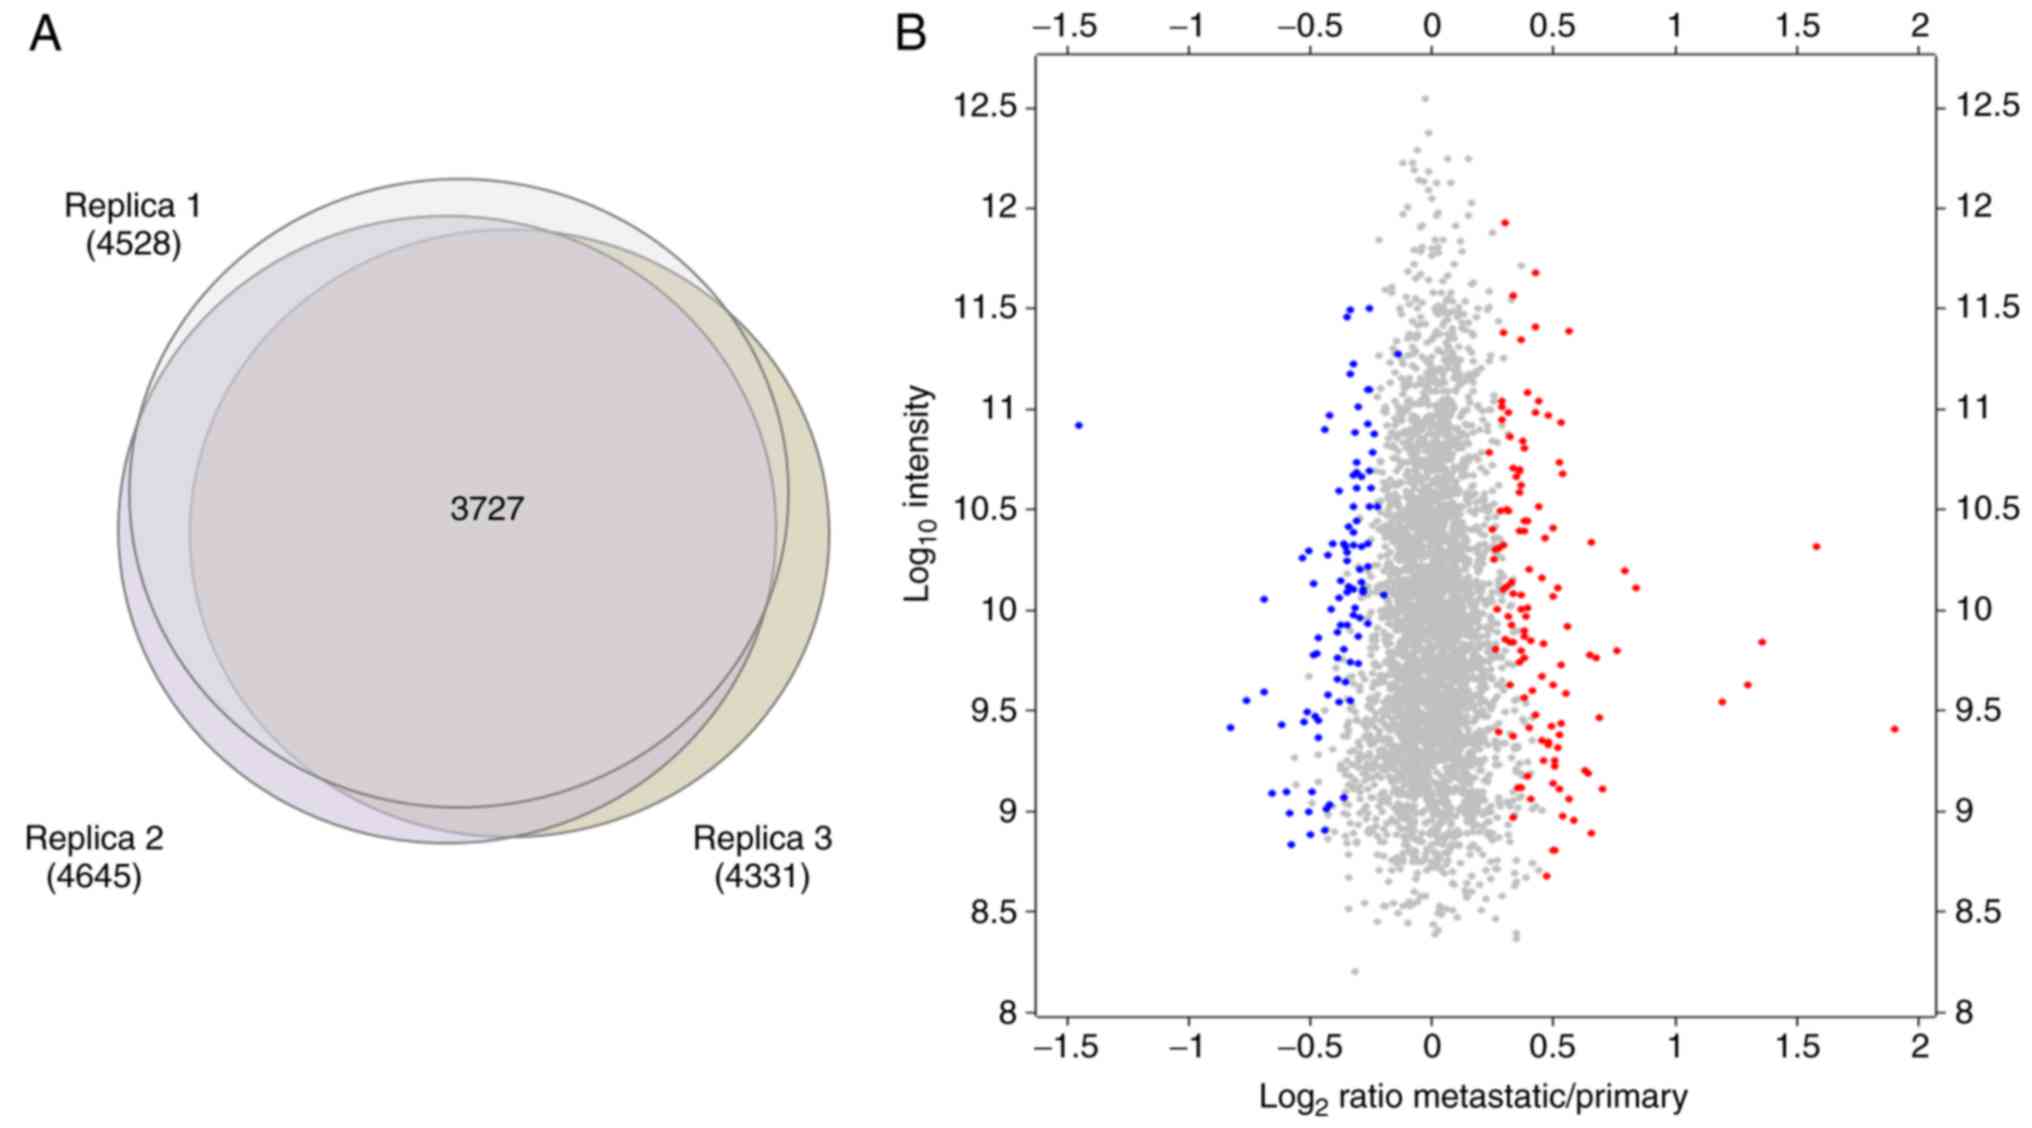
The present study performed three independent SILAC
experiments following two complementary strategies, resulting in
the identification and quantification of 5,257 proteins in total
(Fig. 3B). The identification was
based on strict criteria, using a false discovery rate of 0.01 for
peptides and proteins, and at least 2 peptides including 1 unique
peptide for positive identification, whereas razor and unique
peptides were subjected to quantitation. From these 5,257 proteins,
3,727 were commonly quantified in the three replicates performed
(Fig. 4A).
To detect the proteins that were differentially
expressed in primary and metastatic cancer cells, the significance
of each protein quantified in each independent replicate was
calculated using Perseus from MaxQuant software. The present study
focused on the proteins that were significantly (P<0.05) changed
in abundance between primary and metastatic cells in at least 2 out
of the 3 replicates performed. In total, 120 and 95 proteins were
observed to be consistently upregulated and downregulated,
respectively, in metastatic cancer cells with respect to primary
cancer cells (Fig. 4B).
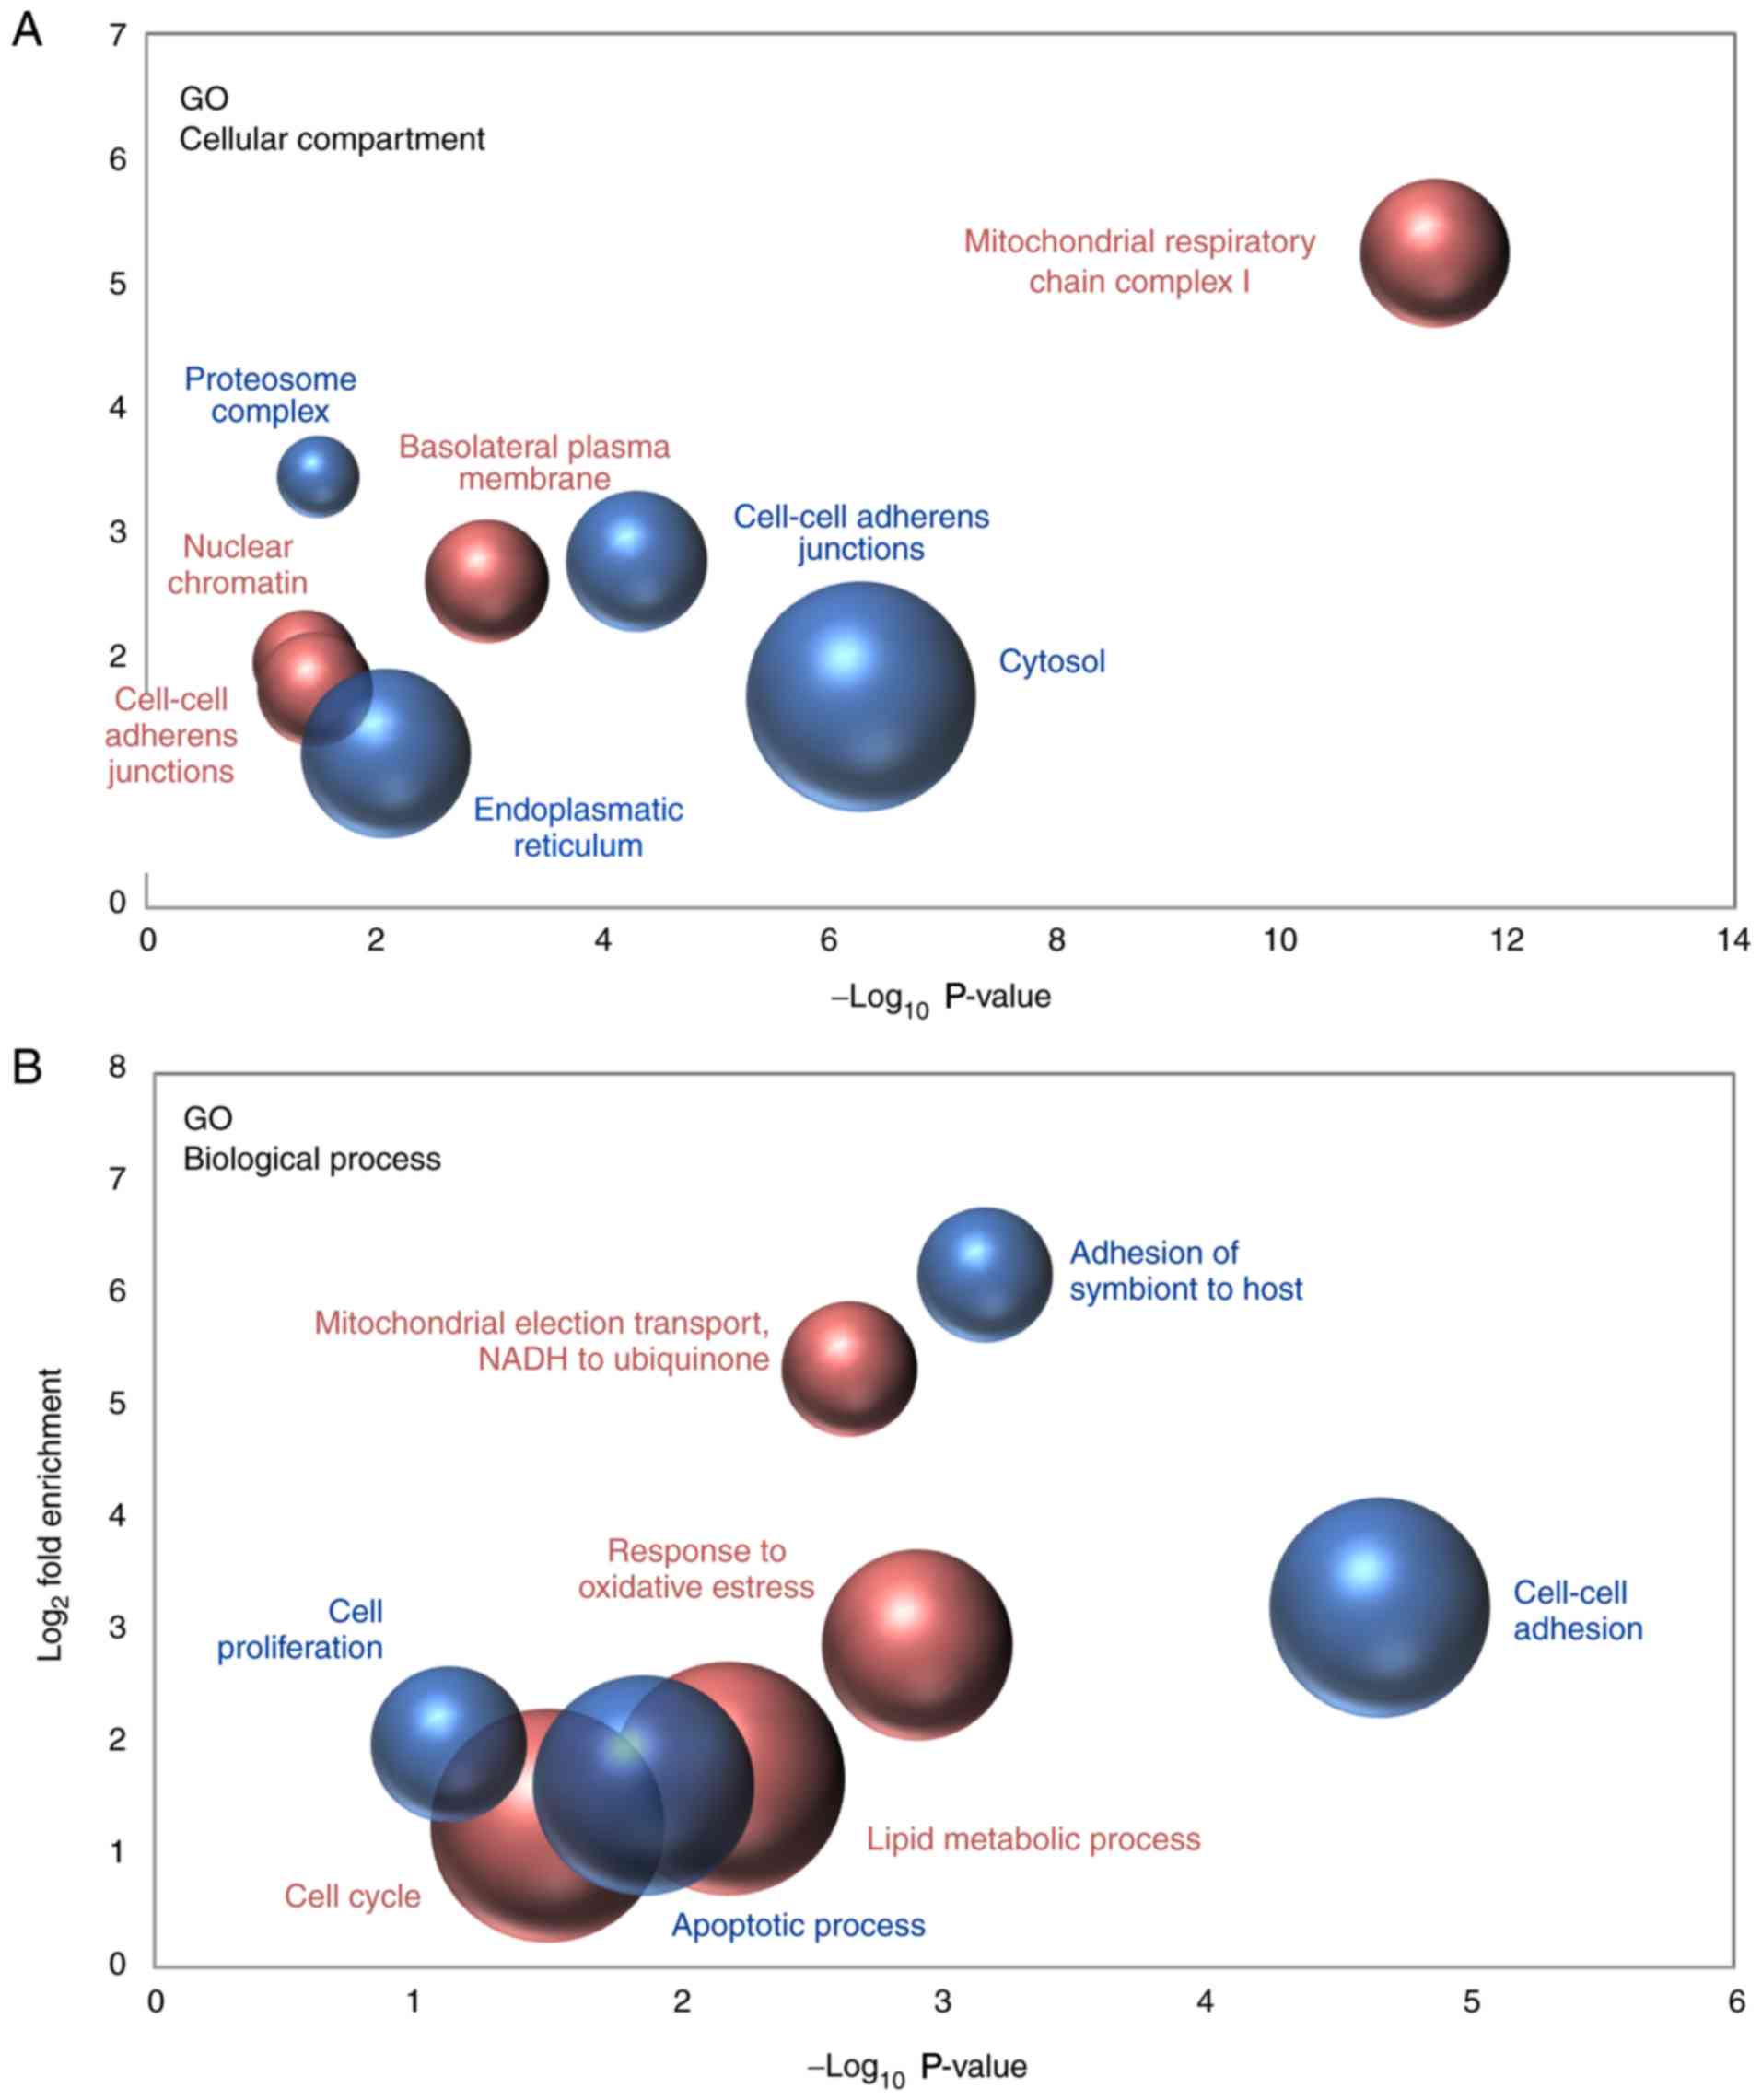
The proteins that were detected to be differentially
expressed in metastatic and primary cancer cells were functionally
classified by Gene Ontology (GO) analysis, with the aim to detect
the most significantly enriched terms within the ‘Cellular
Compartment’ and ‘Biological Process’ categories. Regarding the
‘Cellular Compartment’ category, the results indicated that the
nature of the proteins observed to be upregulated and downregulated
in metastatic cells when compared with non-metastatic cancer cells
was quite different. Downregulated proteins were primarily proteins
that were localized in cell-to-cell adherens junctions, the
cytosol, the endoplasmic reticulum and the proteasomal complex;
however, proteins that were upregulated in metastatic cancer cells
mainly belonged to mitochondrial respiratory chain complex I and,
to a lesser extent, to nuclear chromatin and the basolateral plasma
membrane (Fig. 5A). In line with
these results, various biological processes associated with cell
adhesion were significantly overrepresented among the downregulated
proteins. By contrast, the analysis demonstrated that the
mitochondrial electron transport from NADH to ubiquinone was the
most enriched biological process among the proteins observed to be
upregulated in metastatic cancer cells (Fig. 5B).
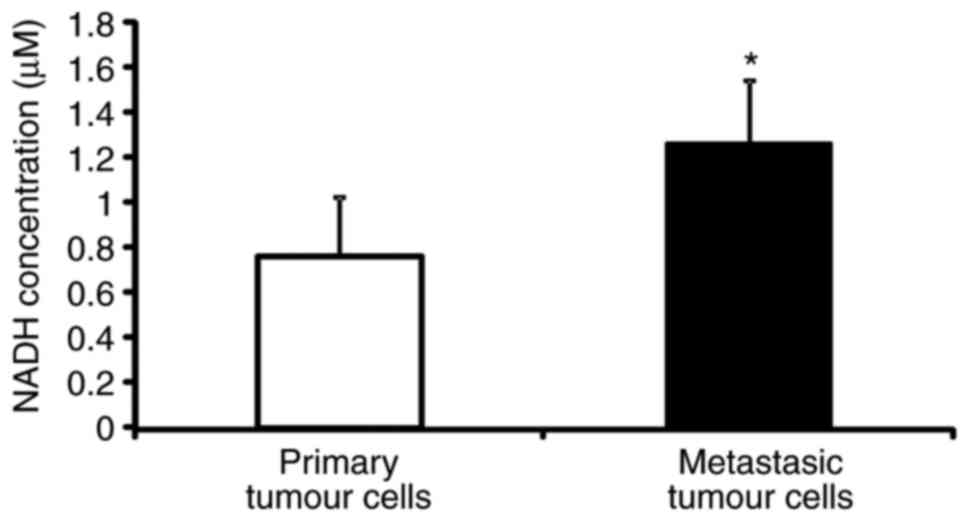
NADH concentration is higher in
metastatic C26.WT tumour cells than in non-metastatic cells
The SILAC-based differential proteomics study
presented above uncovered that the NADH dehydrogenase complex, or
respiratory complex I, which is a key component of the cell, is
expressed to a greater extent in metastatic cells than in
non-metastatic C26.WT cancer cells. Thus, the present study then
set out to verify if the difference in quantity that was detected
was associated with a functional difference in the activity of the
complex. NAD (the oxidized and reduced forms abbreviated as
NAD+ and NADH, respectively) is a key enzymatic cofactor
involved in a number of redox reactions that acts as a soluble
electron carrier. As NADH deposits electrons at the respiratory
complex I, and thereby becoming NAD+, the present study
measured the concentration of NADH in metastatic and non-metastatic
cancer cells as an indicator of the activity of the NADH
dehydrogenase complex. The NADH colorimetric assay performed
revealed that the concentration of NADH was almost twice as high in
metastatic cancer cells with respect to primary tumour cells,
indicating a possible dysfunction of respiratory complex I between
the two cancer cell types (Fig.
6).
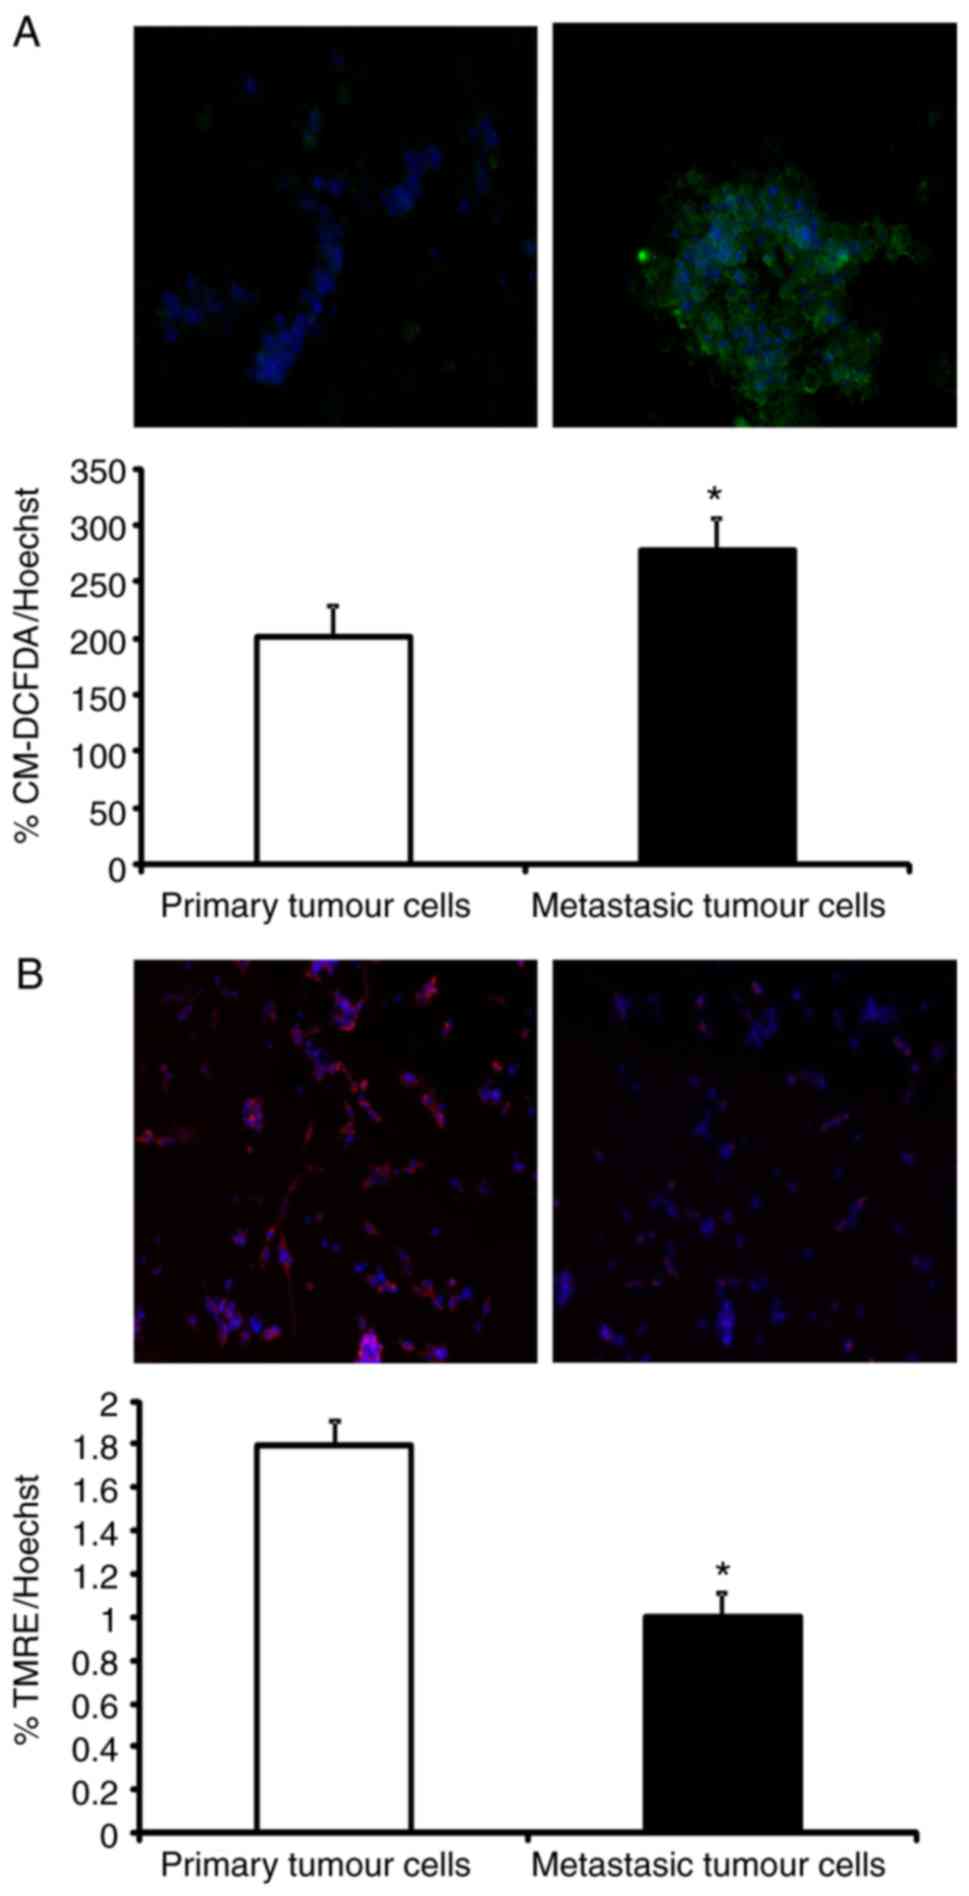
Production of ROS is higher in
metastatic than in non-metastatic C26.WT tumour cells
Mitochondrial NADH dehydrogenase complex dysfunction
is associated with the production of ROS (23). ROS are known mutagens whose
production accelerates cellular conversion to a metastatic
phenotype (24–26). Since an increased NADH concentration
in metastatic tumour cells was observed, it was postulated whether
the higher rate of ROS generation was due to a dysfunction in
mitochondrial NADH dehydrogenase activity. To investigate this
idea, ROS levels were quantified in primary and metastatic tumour
cells. Briefly, C26.WT cells were cultured with the CM-DCFDA probe.
This probe is non-fluorescent, but in the presence of ROS following
oxidation, it becomes fluorescent inside ROS-accumulating cells. As
shown in Fig. 7A, a significant
increase in CM-DCFDA fluorescence in ~25% of liver metastatic cells
was observed, which confirmed that basal ROS generation was
enhanced in these metastatic cells with respect to primary tumour
cells.
Mitochondrial membrane potential is
lower in C26.WT metastatic tumour cells than in non-metastatic
C26.WT tumour cells
The generation of ROS is closely associated with
alterations in the mitochondria. Due to an increase in ROS
generation, NADH accumulation and the increased expression of NADH
dehydrogenase complex subunits in metastatic tumour cells, the
functionality of mitochondria in these cells was analysed. Damaged
or low-efficiency mitochondria decrease their oxidative
phosphorylation rate and instead generate more ROS (27). To test this hypothesis, the
mitochondrial membrane potential was measured using the fluorescent
probe TMRE. TMRE is a cell-permeant, positively charged probe that
accumulates in active mitochondria due to their relatively negative
charge. When mitochondria are depolarized or inactive, they
decrease their membrane potential and fail to sequester TMRE
(28). As shown in Fig. 7B, metastatic tumour cells decreased
by 45% of the uptake of TMRE when in comparison with primary tumour
cells. This confirmed that mitochondria in metastatic tumour cells
were more depolarized (and thus, less efficient) than those of
primary tumour cells, despite their increased expression of
mitochondrial NADH dehydrogenase complex I subunits.
Discussion
In the present study, a murine experimental CRC
liver metastasis model was generated to study the molecular
mechanism implicated in cell transformation. The aim was to
investigate the early stages of the metastatic transformation in
order to better understand the transformation process.
First, the metastatic phenotype of tumour cells was
verified by analysing the invasiveness of the cells. It is known
that one of the most important characteristics of cancer metastatic
cells is motility (29). Metastatic
cells have the capacity to move from the primary organ where they
are growing as a primary tumour, to invade the blood vessels and
then to colonize in distant organs as metastatic tumour cells. In
accordance with this, the liver metastatic C26.WT cells exhibited a
higher motility than the primary C26.WT tumour cells. Furthermore,
the characterization of the two populations (primary and metastatic
tumour cells) was verified by analysing their histone methylation
profiles. Histone methylation is an epigenetic mechanism that
reprogrammes the cells and has been implicated in tumourigenesis
and metastasis (21). Different
histone modifications alter the charge distribution of these
proteins, leading to spatial changes with consequent rearrangement
of the chromatin. This chromatin reorganization influences gene
expression, either allowing or repressing the expression of
different genes (21). It has been
previously observed that the malignancy of certain cancer cells is
a consequence of chromatin remodelling, with the subsequent
activation or inactivation of oncogenes and tumour suppressor
genes, respectively (30). Histone
3 has been well studied within this field, and more specifically,
lysine 27 of this protein has also been investigated extensively.
Low trimethylation status of the aforementioned amino acid of
histone 3 is associated with poor prognosis and metastatic
phenotype In many types of cancer (22,31,32).
In addition, the enhancer of zeste 2, a methyltransferase and a
component of the polycomb repressive complex 2, serves an essential
role in the epigenetic maintenance of H3K277me3. This modification
produces chromatin condensation and converts the involved
DNA-region into heterochromatin, thereby decreasing gene
transcription (33). As described
previously, the metastatic potential of many types of cancer is
associated with the low expression of H3K27 me3, which is due to
the expression of prometastatic genes, that are normally repressed
when lysine 27 of histone 3 is trimethylated. Liver metastatic
colon cancer cells have decreased trimethylation of lysine 27 of
histone 3 with respect to primary tumour cells purified from the
spleen (32). This is in agreement
with previous cases of pancreatic, ovarian and breast cancer, in
which decreased trimethylation of lysine 27 of histone 3 was
associated with higher invasiveness and more metastatic
characteristics (22,31,32).
Oxidative phosphorylation (OXPHOS) chain NADH
dehydrogenase complex I overexpression is associated with a higher
energy requirement and a more active, transforming cell phenotype
(25). Thus, the SILAC analysis
results support this hypothesis; however, when the functionality of
the complex was analysed, non-functional complex I was detected by
NAD accumulation and decreased TMRE values in metastatic cells.
This loss of functionality led to the present study investigating
the redox status in the two cell populations. According to Warburg
et al (34), cancer cells
have higher energy requirements than healthy cells; however, they
utilize glycolysis instead of a more effective process such as
oxidative phosphorylation. One explanation for the Warburg effect
is that mitochondria accumulate defects during the process of cell
transformation, rendering them less efficient. Thus, only cells
that can switch to an enhanced glycolytic metabolism are able to
survive within the tumour mass, which presents a compromised oxygen
supply to the cells. This natural selection mechanism would favour
the acquisition of more aggressive traits, such as an increased
rate of glycolysis, decreased mitochondrial OXPHOS, increased
production of ROS and an increased rate of DNA mutation. When the
metabolisms of metastatic and primary tumour non-metastatic cancer
cells were compared in the present study, the Warburg effect was
aggravated in the metastatic cells. This was reflected by an
increased accumulation of NADt, which was concurrent with a
decrease in the mitochondrial membrane potential, as assessed by
TMRE fluorescence. Cells that transform into more malignant and
metastatic cells utilize glycolysis more and OXPHOS less in order
to satisfy their energy demands, producing more ROS and reducing
their mitochondrial membrane potential (15). This is notable as OXPHOS is a far
more efficient energy generating mechanism than glycolysis. There
are many hypotheses that explain why the Warburg effect benefits
cancer cells. A previous study has suggested that cancer cells may
inactivate their mitochondria in order to avoid apoptosis (35). Mitochondria are key organelles that
serve an active role in some apoptotic pathways; thus, when they
are inactivated tumour survival is facilitated. Another hypothesis
was that tumour cells grow in anaerobic conditions, and therefore,
they may evolve by switching their metabolism to anaerobic
pathways. In addition, even when they grow in aerobic conditions
this characteristic is irreversible (26). In the present study, an upregulation
of OXPHOS complex I subunit expression in the metastatic phenotype
cells was observed when compared with the non-metastatic phenotype
cells. However, the results of the ROS generation and mitochondrial
potential assays revealed that the mitochondrial respiratory chain
in metastatic cells was dysfunctional; despite their elements being
produced in higher amounts than in primary tumour cells, the
mitochondrial potential was reduced, and ROS production was
increased in these cells. As initially described by Warburg
(34), the upregulation of
anaerobic pathways would be more marked in cells that have a
greater impairment of OXPHOS, which, while attempting to replace
this lost energy source, evolve to become more aggressive and
metastatic phenotypes.
The Warburg effect suggests that a primary tumour
cell transforms into a metastatic tumour cell in two phases. In the
first phase, primary tumour cells are not in completely anaerobic
conditions, and thus, they are required to fulfil their energy
requirement in order to grow. Therefore, they are forced to utilize
the respiratory chain, upregulating the expression of the subunits
of that chain, in order to acquire a more energetic phenotype. Then
as the tumour mass reaches a critical level, the tumour
microenvironment becomes anaerobic, and tumour cells enter the next
phase. In this second phase, the cells are in an anaerobic
microenvironment, and stop using the respiratory chain mechanism to
produce energy and instead adopt anaerobic pathways as their
primary energy sources. In this way, under hypoxic conditions
tumour cells secrete hypoxic inducible factor-1 (HIF-1) and block
the phosphatase and tensin homologue, activating the cell
survival-associated protein kinase B signalling pathway (36). Furthermore, HIF-1 increases the gene
expression of the glycolysis transporters glucose transporter 1
(GLUT1) and GLUT3, and blocks oxidative phosphorylation by
inhibiting pyruvate entry into the tricarboxylic acid cycle
(37). HIF-1 also regulates the
tumour microenvironment via VEGF secretion, which induces
endothelial cell transformation and angiogenic tumour support
(37).
In conclusion, the upregulation of dysfunctional
respiratory chain complex I may be a part of the preliminary phase
of cell transformation, in which a high energy requirement and
aerobic conditions were still present. Nevertheless, the
characteristics observed in the metastatic C26.WT cell phenotype In
the present study were in agreement with the Warburg effect, and
this phenomenon could be explored in greater depth to develop novel
therapeutic strategies. However, it should also be considered that
these transforming cells upregulated ORPHOX elements during the
first phase of malignancy.
Acknowledgements
The authors would like to thank the University of
The Basque Country (Leioa, Spain) and University of Southern
Denmark (Odense M, Denmark) for their support during the present
study.
Funding
The present study was supported by grants from the
Basque Government, Department of Health (grant no. 2011111023).
Availability of data and materials
The datasets used and/or analyzed during the current
study are available from the corresponding author on reasonable
request.
Authors' contributions
IB performed the cell biology and animal
experiments, wrote the manuscript and managed the project. NO
performed the SILAC experiments, wrote the manuscript and managed
the project. JM conducted the cell biology and animal experiments,
and contributed to writing the manuscript. VA performed the MS
sample preparation experiments. IK contributed to the management of
the project and performed the SILAC experiments. FU contributed to
the project management, wrote the manuscript and performed the
animal experiments. ASC conducted the cell biology and animal
experiments, and wrote the manuscript. GI performed the cell
biology experiments and wrote the manuscript. All authors read and
approved the final manuscript and agree to be accountable for all
aspects of the work in ensuring that questions related to the
accuracy or integrity of any part of the work are appropriately
investigated and resolved.
Ethics approval and consent to
participate
The animal experiments in the present study were
approved by the Ethical Committee for Animal Experiments of the
University of Basque Country (no. CEBA/237/2012/BADIOLA
ETXABURU).
Patient consent for publication
Not applicable.
Competing interests
The authors declare that they have no competing
interests.
References
|
1
|
Trabulo D, Ribeiro S, Martins C, Teixeira
C, Cardoso C, Mangualde J, Freire R, Gamito É, Alves AL, Augusto F,
et al: Metabolic syndrome and colorectal neoplasms: An ominous
association. World J Gastroenterol. 21:5320–5327. 2015. View Article : Google Scholar : PubMed/NCBI
|
|
2
|
Fancher TT, Palesty JA, Rashidi L and
Dudrick SJ: Is gender related to the stage of colorectal cancer at
initial presentation in young patients? J Surg Res. 165:15–18.
2011. View Article : Google Scholar : PubMed/NCBI
|
|
3
|
Fidler IJ: Selection of successive tumour
lines for metastasis. Nat New Biol. 242:148–149. 1973. View Article : Google Scholar : PubMed/NCBI
|
|
4
|
Gravekamp C, Sypniewska R, Gauntt S,
Tarango M, Price P and Reddick R: Behavior of metastatic and
nonmetastatic breast tumors in old mice. Exp Biol Med. 229:665–675.
2004. View Article : Google Scholar
|
|
5
|
Raz A, Hanna N and Fidler IJ: In vivo
isolation of a metastatic tumor cell variant involving selective
and nonadaptive processes. J Natl Cancer Inst. 66:183–189.
1981.PubMed/NCBI
|
|
6
|
Rashidi B, Gamagami R, Sasson A, Sun FX,
Geller J, Moossa AR and Hoffman RM: An orthotopic mouse model of
remetastasis of human colon cancer liver metastasis. Clin Cancer
Res. 6:2556–2561. 2000.PubMed/NCBI
|
|
7
|
Vakiani E, Janakiraman M, Shen R, Sinha R,
Zeng Z, Shia J, Cercek A, Kemeny N, D'Angelica M, Viale A, et al:
Comparative genomic analysis of primary versus metastatic
colorectal carcinomas. J Clin Oncol. 30:2956–2962. 2012. View Article : Google Scholar : PubMed/NCBI
|
|
8
|
Rapti SM, Kontos CK, Papadopoulos IN and
Scorilas A: High miR-96 levels in colorectal adenocarcinoma predict
poor prognosis, particularly in patients without distant metastasis
at the time of initial diagnosis. Tumour Biol. 37:11815–11824.
2016. View Article : Google Scholar : PubMed/NCBI
|
|
9
|
Hinoue T, Weisenberger DJ, Lange CP, Shen
H, Byun HM, Van Den Berg D, Malik S, Pan F, Noushmehr H, van Dijk
CM, et al: Genome-scale analysis of aberrant DNA methylation in
colorectal cancer. Genome Res. 22:271–282. 2012. View Article : Google Scholar : PubMed/NCBI
|
|
10
|
Tan HT, Wu W, Ng YZ, Zhang X, Yan B, Ong
CW, Tan S, Salto-Tellez M, Hooi SC and Chung MC: Proteomic analysis
of colorectal cancer metastasis: Stathmin-1 revealed as a player in
cancer cell migration and prognostic marker. J Proteome Res.
11:1433–1445. 2012. View Article : Google Scholar : PubMed/NCBI
|
|
11
|
Li G, Wang Z, Xu J, Wu H, Cai S and He Y:
The prognostic value of lactate dehydrogenase levels in colorectal
cancer: A meta-analysis. BMC Cancer. 16:2492016. View Article : Google Scholar : PubMed/NCBI
|
|
12
|
Tan GS, Lim KH, Tan HT, Khoo ML, Tan SH,
Toh HC and Ching Ming Chung M: Novel proteomic biomarker panel for
prediction of aggressive metastatic hepatocellular carcinoma
relapse in surgically resectable patients. J Proteome Res.
13:4833–4846. 2014. View Article : Google Scholar : PubMed/NCBI
|
|
13
|
Ong SE, Blagoev B, Kratchmarova I,
Kristensen DB, Steen H, Pandey A and Mann M: Stable isotope
labeling by amino acids in cell culture, SILAC, as a simple and
accurate approach to expression proteomics. Mol Cell Proteomics.
1:376–386. 2002. View Article : Google Scholar : PubMed/NCBI
|
|
14
|
Chahrour O, Cobice D and Malone J: Stable
isotope labelling methods in mass spectrometry-based quantitative
proteomics. J Pharm Biomed Anal. 113:2–20. 2015. View Article : Google Scholar : PubMed/NCBI
|
|
15
|
Lu J, Tan M and Cai Q: The warburg effect
in tumor progression: Mitochondrial oxidative metabolism as an
anti-metastasis mechanism. Cancer Lett. 356:156–164. 2015.
View Article : Google Scholar : PubMed/NCBI
|
|
16
|
National Research Council (US) Committee
for the Update of the Guide for the Care and Use of Laboratory
Animals. 8th. National Academies Press (US); Washington (DC):
2011
|
|
17
|
Solaun MS, Mendoza L, De Luca M, Gutierrez
V, López MP, Olaso E, Lee Sim BK and Vidal-Vanaclocha F: Endostatin
inhibits murine colon carcinoma sinusoidal-type metastases by
preferential targeting of hepatic sinusoidal endothelium.
Hepatology. 35:1104–1116. 2002. View Article : Google Scholar : PubMed/NCBI
|
|
18
|
Osinalde N, Sánchez-Quiles V, Akimov V,
Blagoev B and Kratchmarova I: SILAC-based quantification of changes
in protein tyrosine phosphorylation induced by interleukin-2 (IL-2)
and IL-15 in T-lymphocytes. Data Brief. 5:53–58. 2015. View Article : Google Scholar : PubMed/NCBI
|
|
19
|
Osinalde N, Mitxelena J, Sánchez-Quiles V,
Akimov V, Aloria K, Arizmendi JM, Zubiaga AM, Blagoev B and
Kratchmarova I: Nuclear phosphoproteomic screen uncovers ACLY as
mediator of IL-2-induced proliferation of CD4+ T
lymphocytes. Mol Cell Proteomics. 15:2076–2092. 2016. View Article : Google Scholar : PubMed/NCBI
|
|
20
|
Liu X, Qiao B, Zhao T, Hu F, Lam AK and
Tao Q: Sox2 promotes tumor aggressiveness and epithelialmesenchymal
transition in tongue squamous cell carcinoma. Int J Mol Med.
42:1418–1426. 2018.PubMed/NCBI
|
|
21
|
Hieda M, Matsuura N and Kimura H: Histone
modifications associated with cancer cell migration and invasion.
Methods Mol Biol. 1238:301–317. 2015. View Article : Google Scholar : PubMed/NCBI
|
|
22
|
Worley MJ Jr, Liu S, Hua Y, Kwok JS,
Samuel A, Hou L, Shoni M, Lu S, Sandberg EM, Keryan A, et al:
Molecular changes in endometriosis-associated ovarian clear cell
carcinoma. Eur J Cancer. 51:1831–1842. 2015. View Article : Google Scholar : PubMed/NCBI
|
|
23
|
Lim W, Ryu S, Bazer FW, Kim SM and Song G:
Chrysin attenuates progression of ovarian cancer cells by
regulating signaling cascades and mitochondrial dysfunction. J Cell
Physiol. 233:3129–3140. 2018. View Article : Google Scholar : PubMed/NCBI
|
|
24
|
Boland ML, Chourasia AH and Macleod KF:
Mitochondrial dysfunction in cancer. Front Oncol. 3:2922013.
View Article : Google Scholar : PubMed/NCBI
|
|
25
|
Ishikawa K, Takenaga K, Akimoto M,
Koshikawa N, Yamaguchi A, Imanishi H, Nakada K, Honma Y and Hayashi
J: ROS-generating mitochondrial DNA mutations can regulate tumor
cell metastasis. Science. 320:661–664. 2008. View Article : Google Scholar : PubMed/NCBI
|
|
26
|
Ishikawa K, Koshikawa N, Takenaga K,
Nakada K and Hayashi J: Reversible regulation of metastasis by
ROS-generating mtDNA mutations. Mitochondrion. 8:339–344. 2008.
View Article : Google Scholar : PubMed/NCBI
|
|
27
|
Esposito LA, Melov S, Panov A, Cottrell BA
and Wallace DC: Mitochondrial disease in mouse results in increased
oxidative stress. Proc Natl Acad Sci USA. 96:4820–4825. 1999.
View Article : Google Scholar : PubMed/NCBI
|
|
28
|
Chazotte B: Labeling mitochondria with
TMRM or TMRE. Cold Spring Harb Protoc. 2011:895–897. 2011.
View Article : Google Scholar : PubMed/NCBI
|
|
29
|
Wood S Jr: Mechanisms of establishment of
tumor metastases. Pathobiol Annu. 1:281–308. 1971.PubMed/NCBI
|
|
30
|
Vaiopoulos AG, Athanasoula KCh and
Papavassiliou AG: Epigenetic modifications in colorectal cancer:
Molecular insights and therapeutic challenges. Biochim Biophys
Acta. 1842:971–980. 2014. View Article : Google Scholar : PubMed/NCBI
|
|
31
|
Chen S and Chiu SK: AP4 activates cell
migration and EMT mediated by p53 in MDA-MB-231 breast carcinoma
cells. Mol Cell Biochem. 407:57–68. 2015. View Article : Google Scholar : PubMed/NCBI
|
|
32
|
Bae WK, Yoo KH, Lee JS, Kim Y, Chung IJ,
Park MH, Yoon JH, Furth PA and Hennighausen L: The
methyltransferase EZH2 is not required for mammary cancer
development, although high EZH2 and low H3K27me3 correlate with
poor prognosis of ER-positive breast cancers. Mol Carcinog.
54:1172–1180. 2015. View
Article : Google Scholar : PubMed/NCBI
|
|
33
|
Yoo KH and Hennighausen L: EZH2
methyltransferase and H3K27 methylation in breast cancer. Int J
Biol Sci. 8:59–65. 2012. View Article : Google Scholar : PubMed/NCBI
|
|
34
|
Warburg O: On the origin of cancer cells.
Science. 123:309–314. 1956. View Article : Google Scholar : PubMed/NCBI
|
|
35
|
Ngo DC, Ververis K, Tortorella SM and
Karagiannis TC: Introduction to the molecular basis of cancer
metabolism and the warburg effect. Mol Biol Rep. 42:819–823. 2015.
View Article : Google Scholar : PubMed/NCBI
|
|
36
|
Pelicano H, Xu RH, Du M, Feng L, Sasaki R,
Carew JS, Hu Y, Ramdas L, Hu L, Keating MJ, et al: Mitochondrial
respiration defects in cancer cells cause activation of akt
survival pathway through a redox-mediated mechanism. J Cell Biol.
175:913–923. 2006. View Article : Google Scholar : PubMed/NCBI
|
|
37
|
Justus CR, Sanderlin EJ and Yang LV:
Molecular connections between cancer cell metabolism and the tumor
microenvironment. Int J Mol Sci. 16:11055–11086. 2015. View Article : Google Scholar : PubMed/NCBI
|