Introduction
Pancreatic cancer (PC) originates from the pancreas,
and the cancerous cells have the ability to invade other parts of
the body (1). PC patients in early
stages often do not have obvious signs or symptoms that are
specific enough to suggest pancreatic cancer, and most patients are
diagnosed with late stage disease or metastasis to other organs
(2). Most cases of PC occur in
individuals over the age of 70 years, and PC can be induced by
diabetes, tobacco smoking, obesity, and genetic conditions
(3,4). PC usually has a poor prognosis, and
was responsible for 411,600 deaths globally in 2015 (5). The most common type of PC is
pancreatic adenocarcinoma (PAC), which consists of ~85% of all PC
cases (6). Therefore, it is
important to determine new biological or pathological indicators
related to the prognosis of PAC in addition to conventional
prognostic approaches such as clinicopathologic staging, tumor
biology and molecular genetics, perioperative factors and the use
of postoperative adjuvant therapy (7).
In the past decade, research has uncovered the genes
affecting the survival of PC patients. For example, genetic
alterations and accumulation of cyclin-dependent kinase inhibitor
2A (CDKN2A)/p16, tumor protein p53 (TP53), and
SMAD family member 4 (SMAD4)/DPC4 are highly
correlated with the malignant potential of PAC, and their
expression levels may predict the prognosis of PAC patients
(8). B-cell-specific Moloney murine
leukemia virus insertion site 1 (BMI1) is reported to be
significantly upregulated in PC, and its expression has a positive
association with lymph node metastases and a negative correlation
with the survival rates of PC patients (9,10). The
expression levels of aldehyde dehydrogenase 1 family, member A1
(ALDH1A1) (11,12) and insulin-like growth factor 2 mRNA
binding protein 3 (IGF2BP3) could be used to predict the
prognosis of PAC (13).
Overexpression of homeo box B7 (HOXB7) contributes to the
invasive behavior of PAC (14,15).
Nevertheless, the prognostic mechanisms of PAC warrant further
investigation.
Bioinformatic analysis is a new way for revealing
the pathogenesis of diseases and identifying novel therapeutic
targets (16). To screen the key
genes correlated with the prognosis of PAC and develop novel
prognostic prediction strategies, we downloaded and analyzed the
public datasets of PAC. Through a series of bioinformatic analyses,
a risk score system of PAC was constructed and assessed in the
present study. The present study may provide a novel means for
predicting the outcome of PAC patients and helping in selecting
appropriate therapeutic methods.
Materials and methods
Data source
The mRNA sequencing data of PAC (the training
dataset; platform: Illumina HiSeq 2000 RNA Sequencing; downloaded
in March 30, 2017; including 178 PAC samples) and correlative
clinical information were extracted from The Cancer Genome Atlas
(TCGA, http://cancergenome.nih.gov/)
database. Meanwhile, ‘PAC’ was used as the search words for
selecting relevant datasets from the Gene Expression Omnibus (GEO,
http://www.ncbi.nlm.nih.gov/geo/)
database. The inclusive criteria were as follows: i) the samples
were human tissues (not cell lines); ii) the samples were provided
with prognostic information. Finally, GSE79668 (17) [platform: GPL11154 Illumina HiSeq
2000 (Homo sapiens); 51 samples] and GSE62452 (18) [platform: GPL6244 (HuGene-1_0-st)
Affymetrix Human Gene 1.0 ST Array (transcript (gene) version); 69
samples] were selected and considered as the validation datasets.
The clinical information of the training dataset and the validation
datasets are presented in Table
I.
 | Table I.Clinical information of The Cancer
Genome Atlas (TCGA) dataset and the validation datasets (GSE79668
and GSE62452). |
Table I.
Clinical information of The Cancer
Genome Atlas (TCGA) dataset and the validation datasets (GSE79668
and GSE62452).
| Clinical
factors | TCGA (n=178) | GSE79668
(n=51) | GSE62452
(n=69) |
|---|
| Age, years (mean ±
SD) | 64.69±11.09 | 64.04±11.57 | – |
| Sex
(male/female/-) | 91/74/13 | 32/19 | – |
| Chronic
pancreatitis history (yes/no/-) | 13/117/48 | – | – |
| Diabetes history
(yes/no/-) | 36/99/43 | 22/29 | – |
| Alcohol
(yes/no/-) | 97/57/24 | – | – |
| Tobacco
(never/reform/current/-) | 59/56/19/44 | – | – |
| New tumor
(yes/no/-) | 55/101/22 | – | – |
| Pathologic_M
(M0/M1/-) | 75/3/100 | 48/1/2 | – |
| Pathologic_N
(N0/N1/-) | 44/117/17 | 14/37 | – |
| Pathologic_T
(T1/T2/T3/T4/-) | 8/19/134/3/14 | 3/12/31/5 | – |
| Pathologic_stage
(I/II/III/IV/-) | 20/137/4/3/ | – | 4/46/13/6 |
| Radiation therapy
(yes/no/-) | 38/107/33 |
| – |
| Targeted molecular
therapy (yes/no/-) | 102/48/28 |
| – |
| Deceased
(death/alive/-) | 83/8213 | 45/6 | 49/16/4 |
| Overall survival
months (mean ± SD) | 17.11±15.35 | 26.78±26.12 | 20.21±16.69 |
Differential expression analysis
Among the 178 PAC samples in the training dataset,
163 PAC samples had prognostic information. The 17 PAC samples with
follow-up time <6 months whose status was still alive at the
last follow-up were considered as ineligible samples since the
actual survival time was unknown (data not available) due to loss
of follow-up. Then, these 17 ineligible samples were removed for
analysis in our study. Afterwards, the remained 146 PAC samples
were divided into good prognosis and poor prognosis groups. The PAC
samples obtained from living patients with a survival time >24
months were classified into a good prognosis group, and the PAC
samples obtained from deceased patients with a survival time <6
months were classified into the poor prognosis group. Under the
thresholds of false discovery rate (FDR) <0.05 and |logfold
change (FC)| >0.585, the differentially expressed genes (DEGs)
between the good and poor prognosis groups were analyzed using the
R package limma (http://www.bioconductor.org/packages/release/bioc/html/limma.html)
(19).
Identification of prognosis-associated
gene
The 146 PAC samples were applied for identifying
prognosis-associated genes. Using univariate and multivariate Cox
regression analyses in R package survival (20), prognosis-associated genes were
selected from the DEGs. Then, significant P-values were obtained by
log-rank test (21), and P-value
<0.05 was taken as the threshold for screening
prognosis-associated genes.
Construction and assessment of risk
score system
Based on the prognosis-associated genes, a risk
score system was constructed for the PAC patients. Firstly, the
identified prognostic-associated genes were sorted by their
individual P-value of the Cox regression analysis. Each gene was
added one at a time in the risk score system, and the risk scores
of the included gene were summed. This procedure was repeated until
all the prognostic-associated genes were included. Finally, a set
of minimum number of genes having the smallest P-value were
selected for constructing the risk score system. Risk scores were
obtained based on the linear combination of the gene expression
values experiencing regression coefficient weighting. The risk
score for each patient was calculated as the sum of each genes
score, which was obtained by multiplying the expression level of a
gene by its corresponding coefficient (β)s using the following
formula:
Risk score = βgene1 × Exp gene1 + βgene2 × Exp
gene2+ ··· + βgene(n) × Exp gene(n)
Subsequently, the risk of the PAC patients in the
validation datasets were assessed using the β value acquired from
the training dataset. Meanwhile, the differences in survival ratio
were analyzed between high- and low-risk groups which were divided
using the median cut-off of the risk scores as the threshold with
log-rank test in Kaplan-Meier (KM) survival analysis. The
differences between the low-risk and high-risk groups for
expressions of the 6 genes were compared with t-test.
Correlation analysis between risk
score system and clinical factors
Using the risk score system, risk scores were
calculated for the samples in the training and validation datasets.
According to the median of the risk scores, the samples were
divided into high- and low-risk groups. Based on the clinical
information corresponding to the samples, COX regression analysis
(22) was used to perform
correlation analysis for screening the survival associated-clinical
factors.
Stratified analysis
Furthermore, stratified analysis was performed for
the survival associated-clinical factors based on the following
strategies: i) under the same clinical condition, the correlation
between survival prognosis and high-/low-risk groups was analyzed;
and ii) under the same risk condition, the correlation between
survival prognosis and different clinical conditions was
analyzed.
Enrichment analysis
According to the risk scores, the samples were
classified into high- and low-risk groups. For the training
dataset, the DEGs between high and low risk groups were identified
using limma package (19). The DEGs
were defined as genes with FDR <0.05. Afterwards, correlation
analysis for the DEGs and risk scores were conducted. To screen
significantly enriched biological processes and pathways, the DEGs
positively and negatively related to risk scores were conducted
with enrichment analysis using DAVID tool (https://david.ncifcrf.gov/) (23).
Results
Differential expression analysis
Among the 146 PAC samples, 18 and 19 PAC samples
separately were divided into poor and good prognosis groups. Under
the screening thresholds, 242 DEGs between the two groups were
selected.
Construction and assessment of risk
score system
Based on univariate Cox regression analysis, 165
prognosis-associated genes were selected. Moreover, the 165
prognosis-associated genes were conducted with multivariate Cox
regression analysis and 8 prognosis-associated genes were further
screened. Finally, 6 prognosis-associated genes [chemokine (C-X-C
motif) ligand 11], CXCL11; follistatin-like 4, FSTL4;
seizure related 6 homolog (mouse)-like, SEZ6L; small
proline-rich protein 1B, SPRR1B; somatostatin receptor 2,
SSTR2; and tubulointerstitial nephritis antigen,
TINAG) were selected for constructing the risk score system
(Table II). The formula was as
follows:
| Table II.The 6 prognosis-associated genes to
establish the risk score system. |
Table II.
The 6 prognosis-associated genes to
establish the risk score system.
| Genes | coef | HR | P-value |
|---|
| CXCL11 | 0.451453 | 0.6367 | 0.0031 |
| FSTL4 | 0.54981 | 0.5771 | 0.0025 |
| SEZ6L | −1.18976 | 3.2863 | <0.0001 |
| SPRR1B | 0.37643 | 0.6863 | 0.0004 |
| SSTR2 | 1.17541 | 0.3087 | 0.0035 |
| TINAG | 0.26515 | 0.7671 | 0.0163 |
Risk score = 0.451 × Exp CXCL11 + 0.5498 × Exp FSTL4
+ (−1.1897) × Exp SEZ6L + 0.376 × Exp SPRR1B + 1.175 × Exp SSTR2 +
0.265 × Exp TINAG
The risk scores were calculated for the samples
using the risk score system. Afterwards, the 6 prognosis-associated
genes were utilized for performing risk evaluation for the PAC
patients. According to the median risk scores, the patients in the
training dataset were classified into high-(83 patients) and
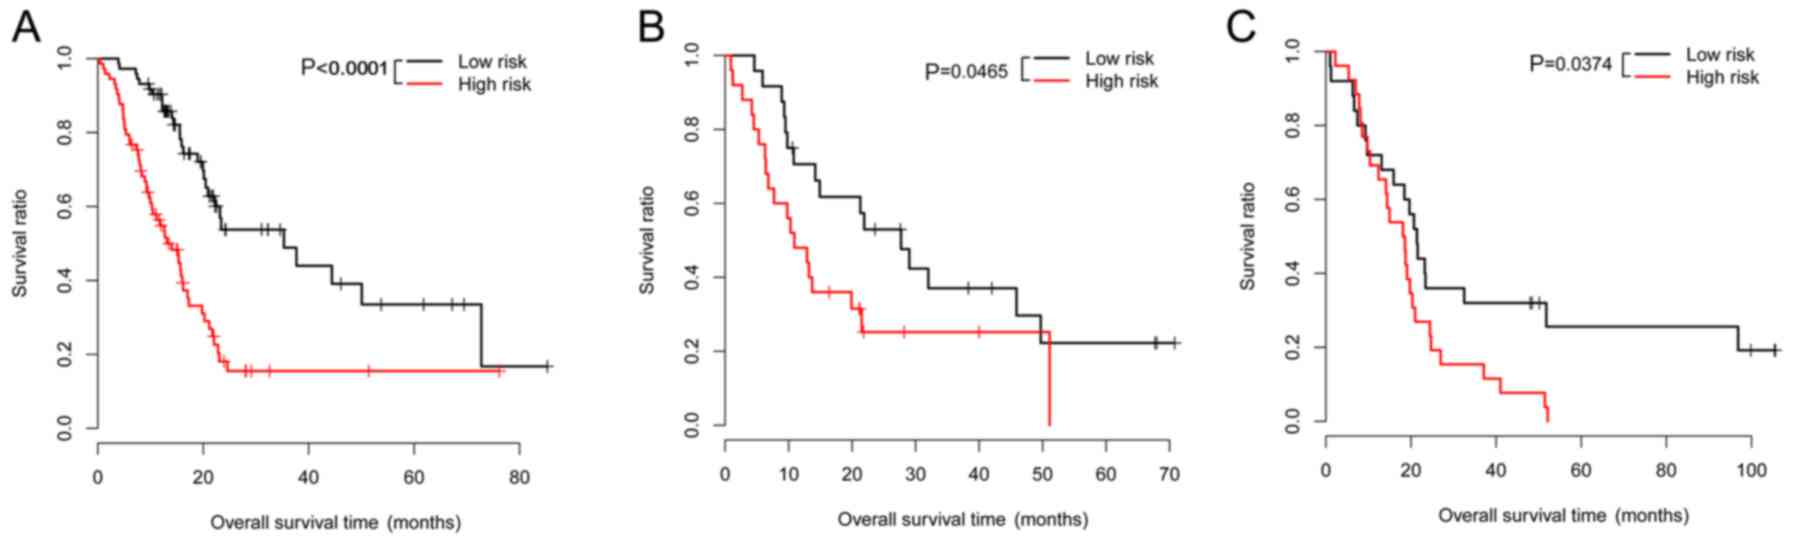
low-(83 patients) risk groups. In relation to the high-risk group
with the average overall survival (OS) time of 16.88±14.92 months,
the low-risk group with the average OS time of 18.84±13.91 months
had a higher survival ratio (P<0.0001; Fig. 1A). For the validation dataset
GSE62452, the low-risk group (24 patients; average OS
time=25.1±18.79 months) also had a higher survival ratio (P=0.0465)
in comparison with the high-risk group (25 patients; average OS
time=16.78±16.21 months) (Fig. 1B).
For the validation dataset GSE79668, the low-risk group (25
patients; average OS time=37.07±32.15 months) had a higher survival
ratio (P=0.0374) compared with the high-risk group (26 patients;
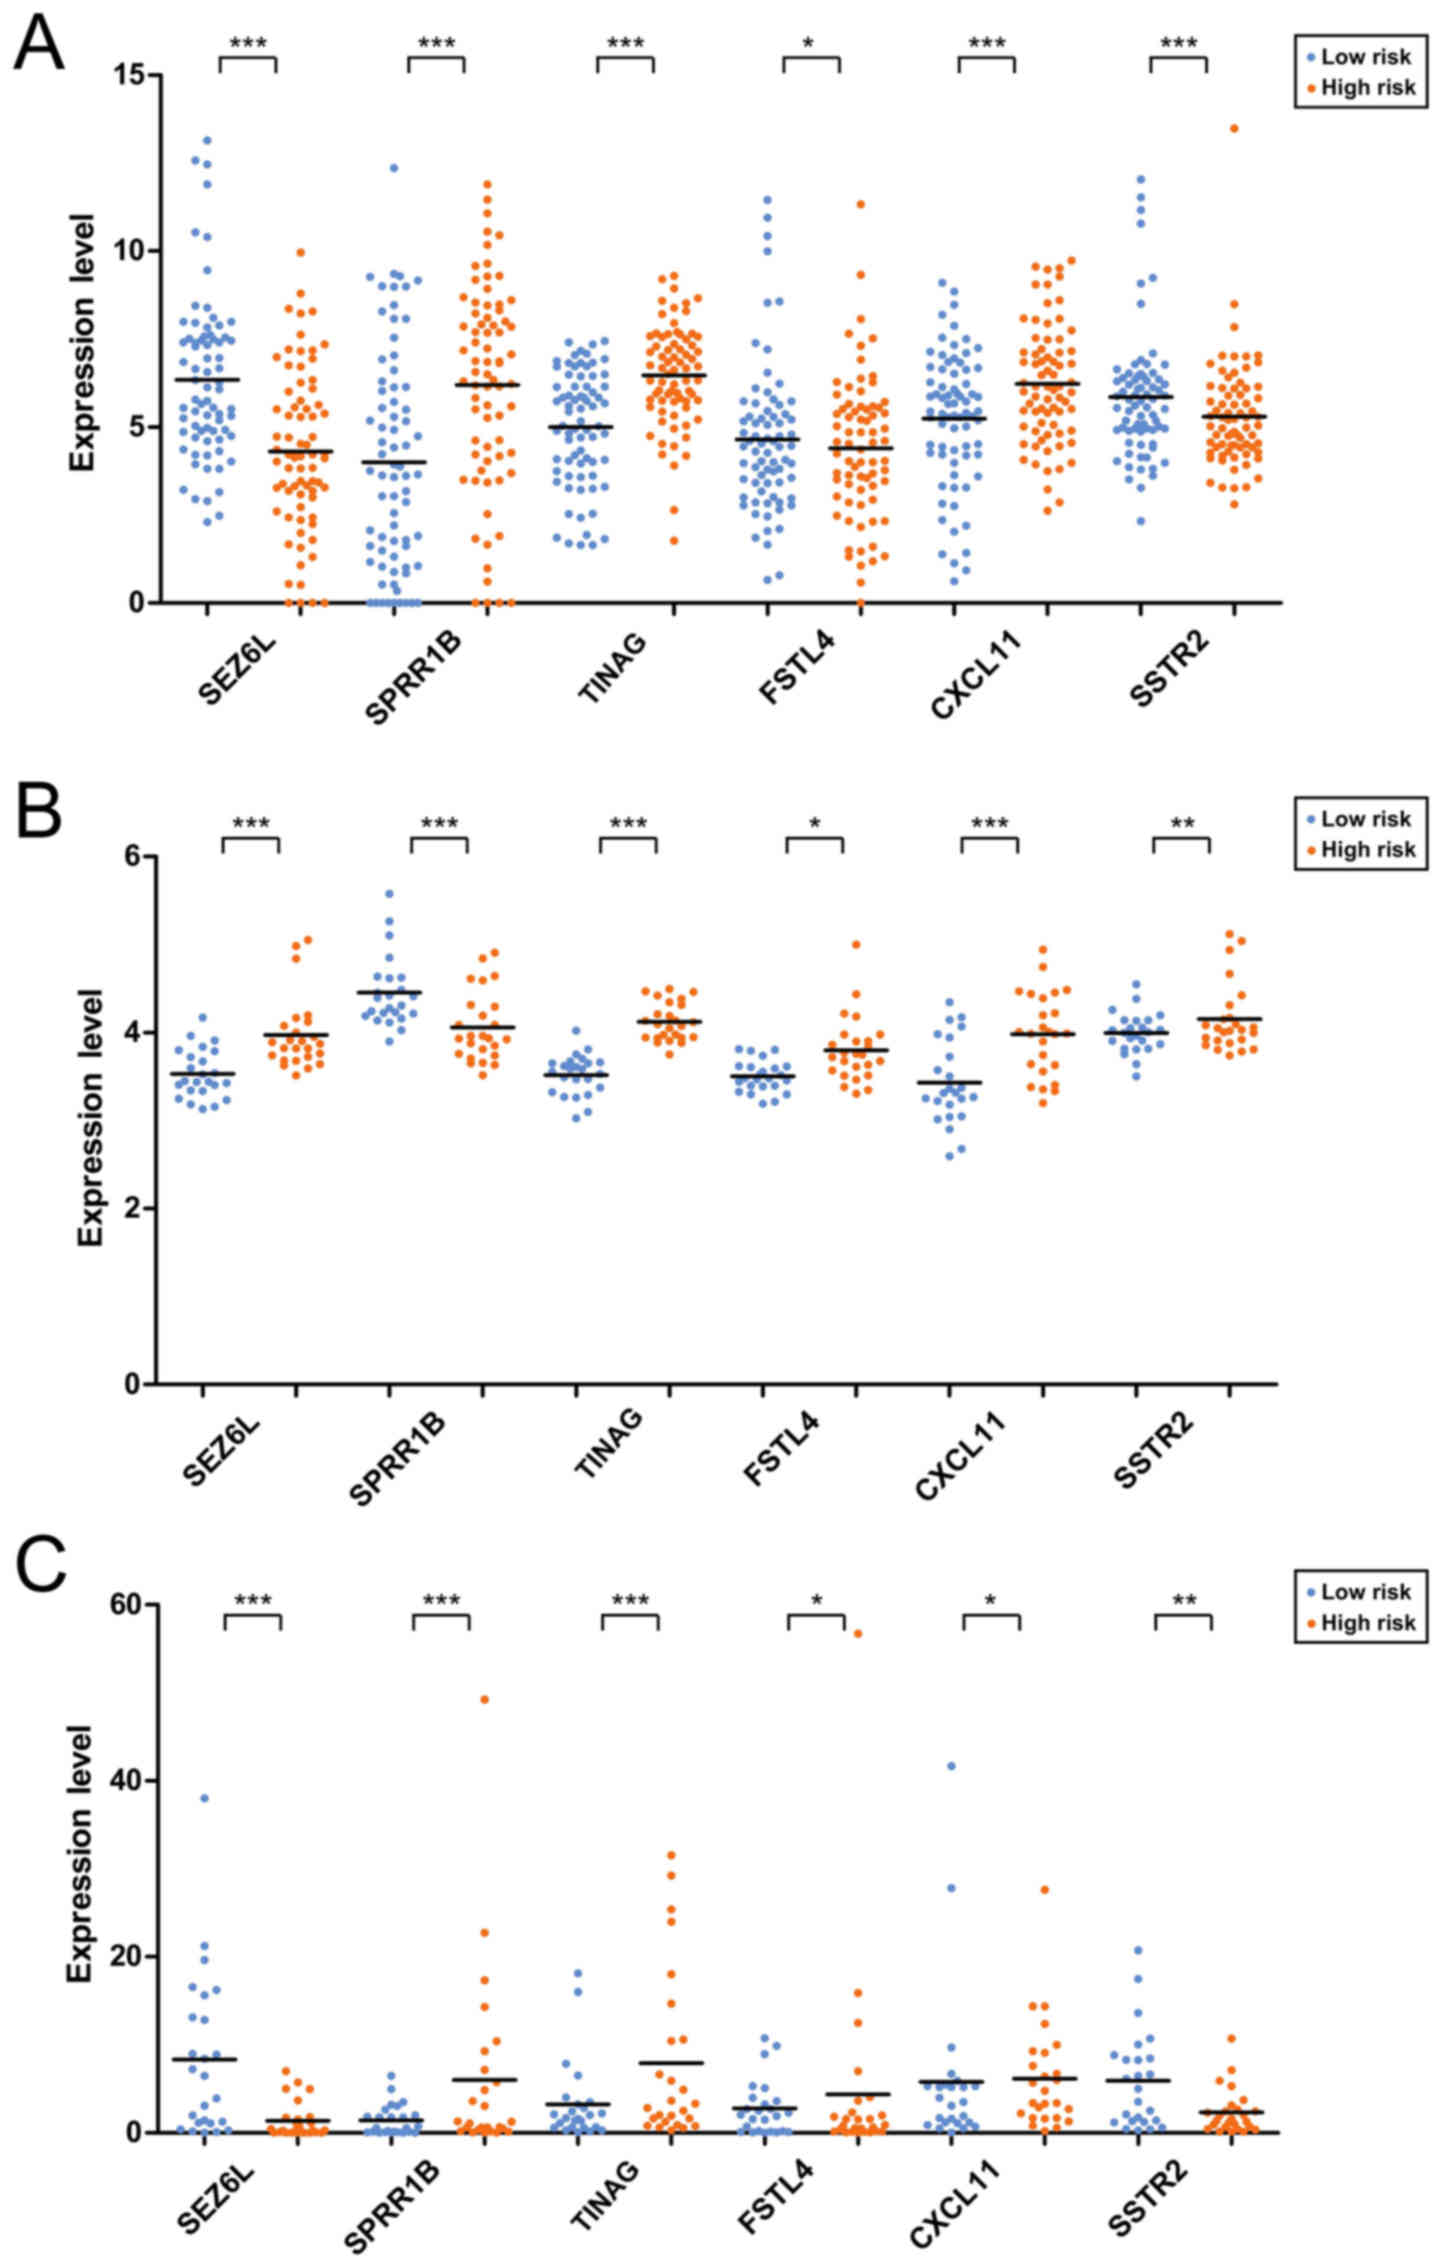
average OS time=17.55±15.50 months) (Fig. 1C). The expression distributions of
the 6 prognosis-associated genes in the high- and low-risk groups
of the 3 datasets are exhibited in Fig.
2. The expression levels of SPRR1B, TINAG and
CXCL11 were significantly lower, those of SEZ6L and
SSTR2 were higher in the low-risk group of The Cancer Genome
Atlas (TCGA) dataset (Fig. 2A).
However, an obviously decreased expression level of SSTR2 was
observed in the low-risk group of GSE62452 (Fig. 2B) which may be due to the fact that
the gene expression model in the validation datasets could not be
exactly the same as those in the training dataset.
Correlation analysis between risk
score system and clinical factors
The clinical factors significantly related to
prognosis were selected by Cox regression analysis. Our results
showed that risk score, targeted molecular therapy, and new tumor
(event days) were significantly correlated with survival time
(Table III). According to
different clinical factors, the samples were divided into groups
and then differential expression analysis was conducted (Table IV).
| Table III.Cox regression analysis for selecting
the clinical factors significantly related to prognosis. |
Table III.
Cox regression analysis for selecting
the clinical factors significantly related to prognosis.
| Clinical
characteristics | Univariable Cox
P-value | Multivariable Cox
P-value |
|---|
| Age in years
(above/below median) | 0.0781 |
|
| Sex
(male/female) | 0.5630 |
|
| Pathologic_M
(M0/M1) | 0.3020 |
|
| Alcohol
(yes/no) | 0.8190 |
|
| Tobacco
(never/reform/current) | 0.1490 |
|
| Chronic
pancreatitis history (yes/no) | 0.6990 |
|
| Diabetes history
(yes/no) | 0.6830 |
|
| Pathologic_N
(N0/N1) | 0.0128 | 0.2683 |
| Pathologic_T
(T1/T2/T3/T4) | 0.0338 | 0.2258 |
| Radiation therapy
(yes/no) | 0.0371 | 0.5174 |
| New tumor
(yes/no) | 0.0107 | 0.0269 |
| Targeted molecular
therapy (yes/no) | 0.0010 |
<0.0001 |
| Risk score |
<0.0001 |
<0.0001 |
| Table IV.Results of differential expression
analysis after dividing the samples into groups according to
different clinical factors. |
Table IV.
Results of differential expression
analysis after dividing the samples into groups according to
different clinical factors.
| Clinical
factors | Downregulated
genes | Upregulated
genes |
|---|
| Age in years (above
vs. below median) | WBSCR26, TRIM54,
ARX, SERPINA4, MT1H, AQP5, PRSS21, MSLN, APOBEC1, CALHM3 | NTSR1, SPRR3,
KLK10, SPRR1A, ALDH3A1, SERPINB3, CXCL17, SPRR1B, KLK1, SYCN, TRY6,
CELA2B, PNLIPRP2, CLPS, CELA3A, REG1A, CELA3B, PNLIP,
CELA2A |
| Sex (male vs.
female) | NLRP2 | HOXA13,
UPK1B |
| Chronic
pancreatitis history | PNLIP, PNLIPRP1,
CPA1, CELA2A, CLPS, CELA2B, TRY6, | PLEKHN1, POU2F3,
CATSPER1, ABCA12, GPR110, WBSCR26, UGT1A6, |
| (yes vs. no) | REG3G, CELA3B,
SYCN, TDRD9, ARX, KCNJ3, KIAA1409, ST18, TMEM132D, KCNMB2,
SYT4 | HOXB9, MYEOV,
S100P, GJB5, GJB4, GJB3, SFTPA2, NMU |
| Diabetes history
(yes vs. no) | ABCA13 | NMUR2 |
| Alcohol (yes vs.
no) | S100A2 | C5orf49 |
| Tobacco (never vs.
reform) | – | – |
| Tobacco (never vs.
current) | PPP1R1A, CRYBA2,
SEZ6L, RIMBP2, LHFPL4, VWA5B2, PCSK1N, HMGCLL1, GRM4, ARX, TMEM63C,
ASTN1, TCEAL2, LRRC10B, SSTR2, DUSP26, C1QL1, GCK, SNAP91, CACNA1A,
JPH3, MSI1 | GPR110, DKK1,
MUC4, SERPINB4, SERPINB3, MUC16 |
| Pathologic_M (M0
vs. M1) | – | – |
| Pathologic_T (T1+
T2 vs. T3+T4) | SYT4GPR98,
SPTBN4, CELF4, ASTN1, CHD5, UNC13A, HAP1, HMGCLL1, FBLL1, PTPRT,
LRRC24, ATP1A3, APOH, MSI1, PIPOX, LRRC4B, HPCA, | KPNA7, HOXA13,
DSG3, UPK1B, AKR1B10 |
| Pathologic_N (N0
vs. N1) | LOC389332, GRM4,
LRRC16B | MMP3, AIM2,
HOXA13, ABCA13, CXCL11, EGF, GJB4, PIK3C2G, AKR1B10, ITGB6,
C12orf36, KRT5, NMUR2, SERPINA4, UPK1B, GABRP, CXCL5, REG3G, CTRC,
PNLIPRP1 |
| Radiation therapy
(yes vs. no) | LOC554202,
TNS4 | AIM2 |
| Targeted molecular
therapy (yes vs. no) | ZNF683, KPNA7,
RASEF, MT1H, GPR110, SERPINA4, EGF, UPK1B, KLK1, TRY6, CELA2B,
SYCN | PNLIPRP2,
PNLIPRP1, REG1A, CLPS, REG3G, CELA3B, CELA2A, REG1B, PNLIP, CTRC,
CPA1, CELA3A, CTRB2 |
| New tumor (yes vs.
no) | LOC389332,
LRRC16B, FFAR2, PIPOX, RAB3C, JPH3 | CDSN, PLEKHN1,
ABCA13, WBSCR26, TMEM105, GPR1, FAM83B, GJB4, CYP27C1, GJB5,
LOC554202, FGFBP1, ABCA12 |
Stratified analysis
Correlation analysis under the same clinical
condition showed that 6 clinical factors (age, chronic pancreatitis
history, alcohol consumption, radiation therapy, targeted molecular
therapy, and new tumor) under different groups were significantly
correlated with survival time (Table
V). Moreover, these 6 clinical factors were used to perform
Kaplan-Meier (KM) survival analysis in the different groups
(Fig. 3).
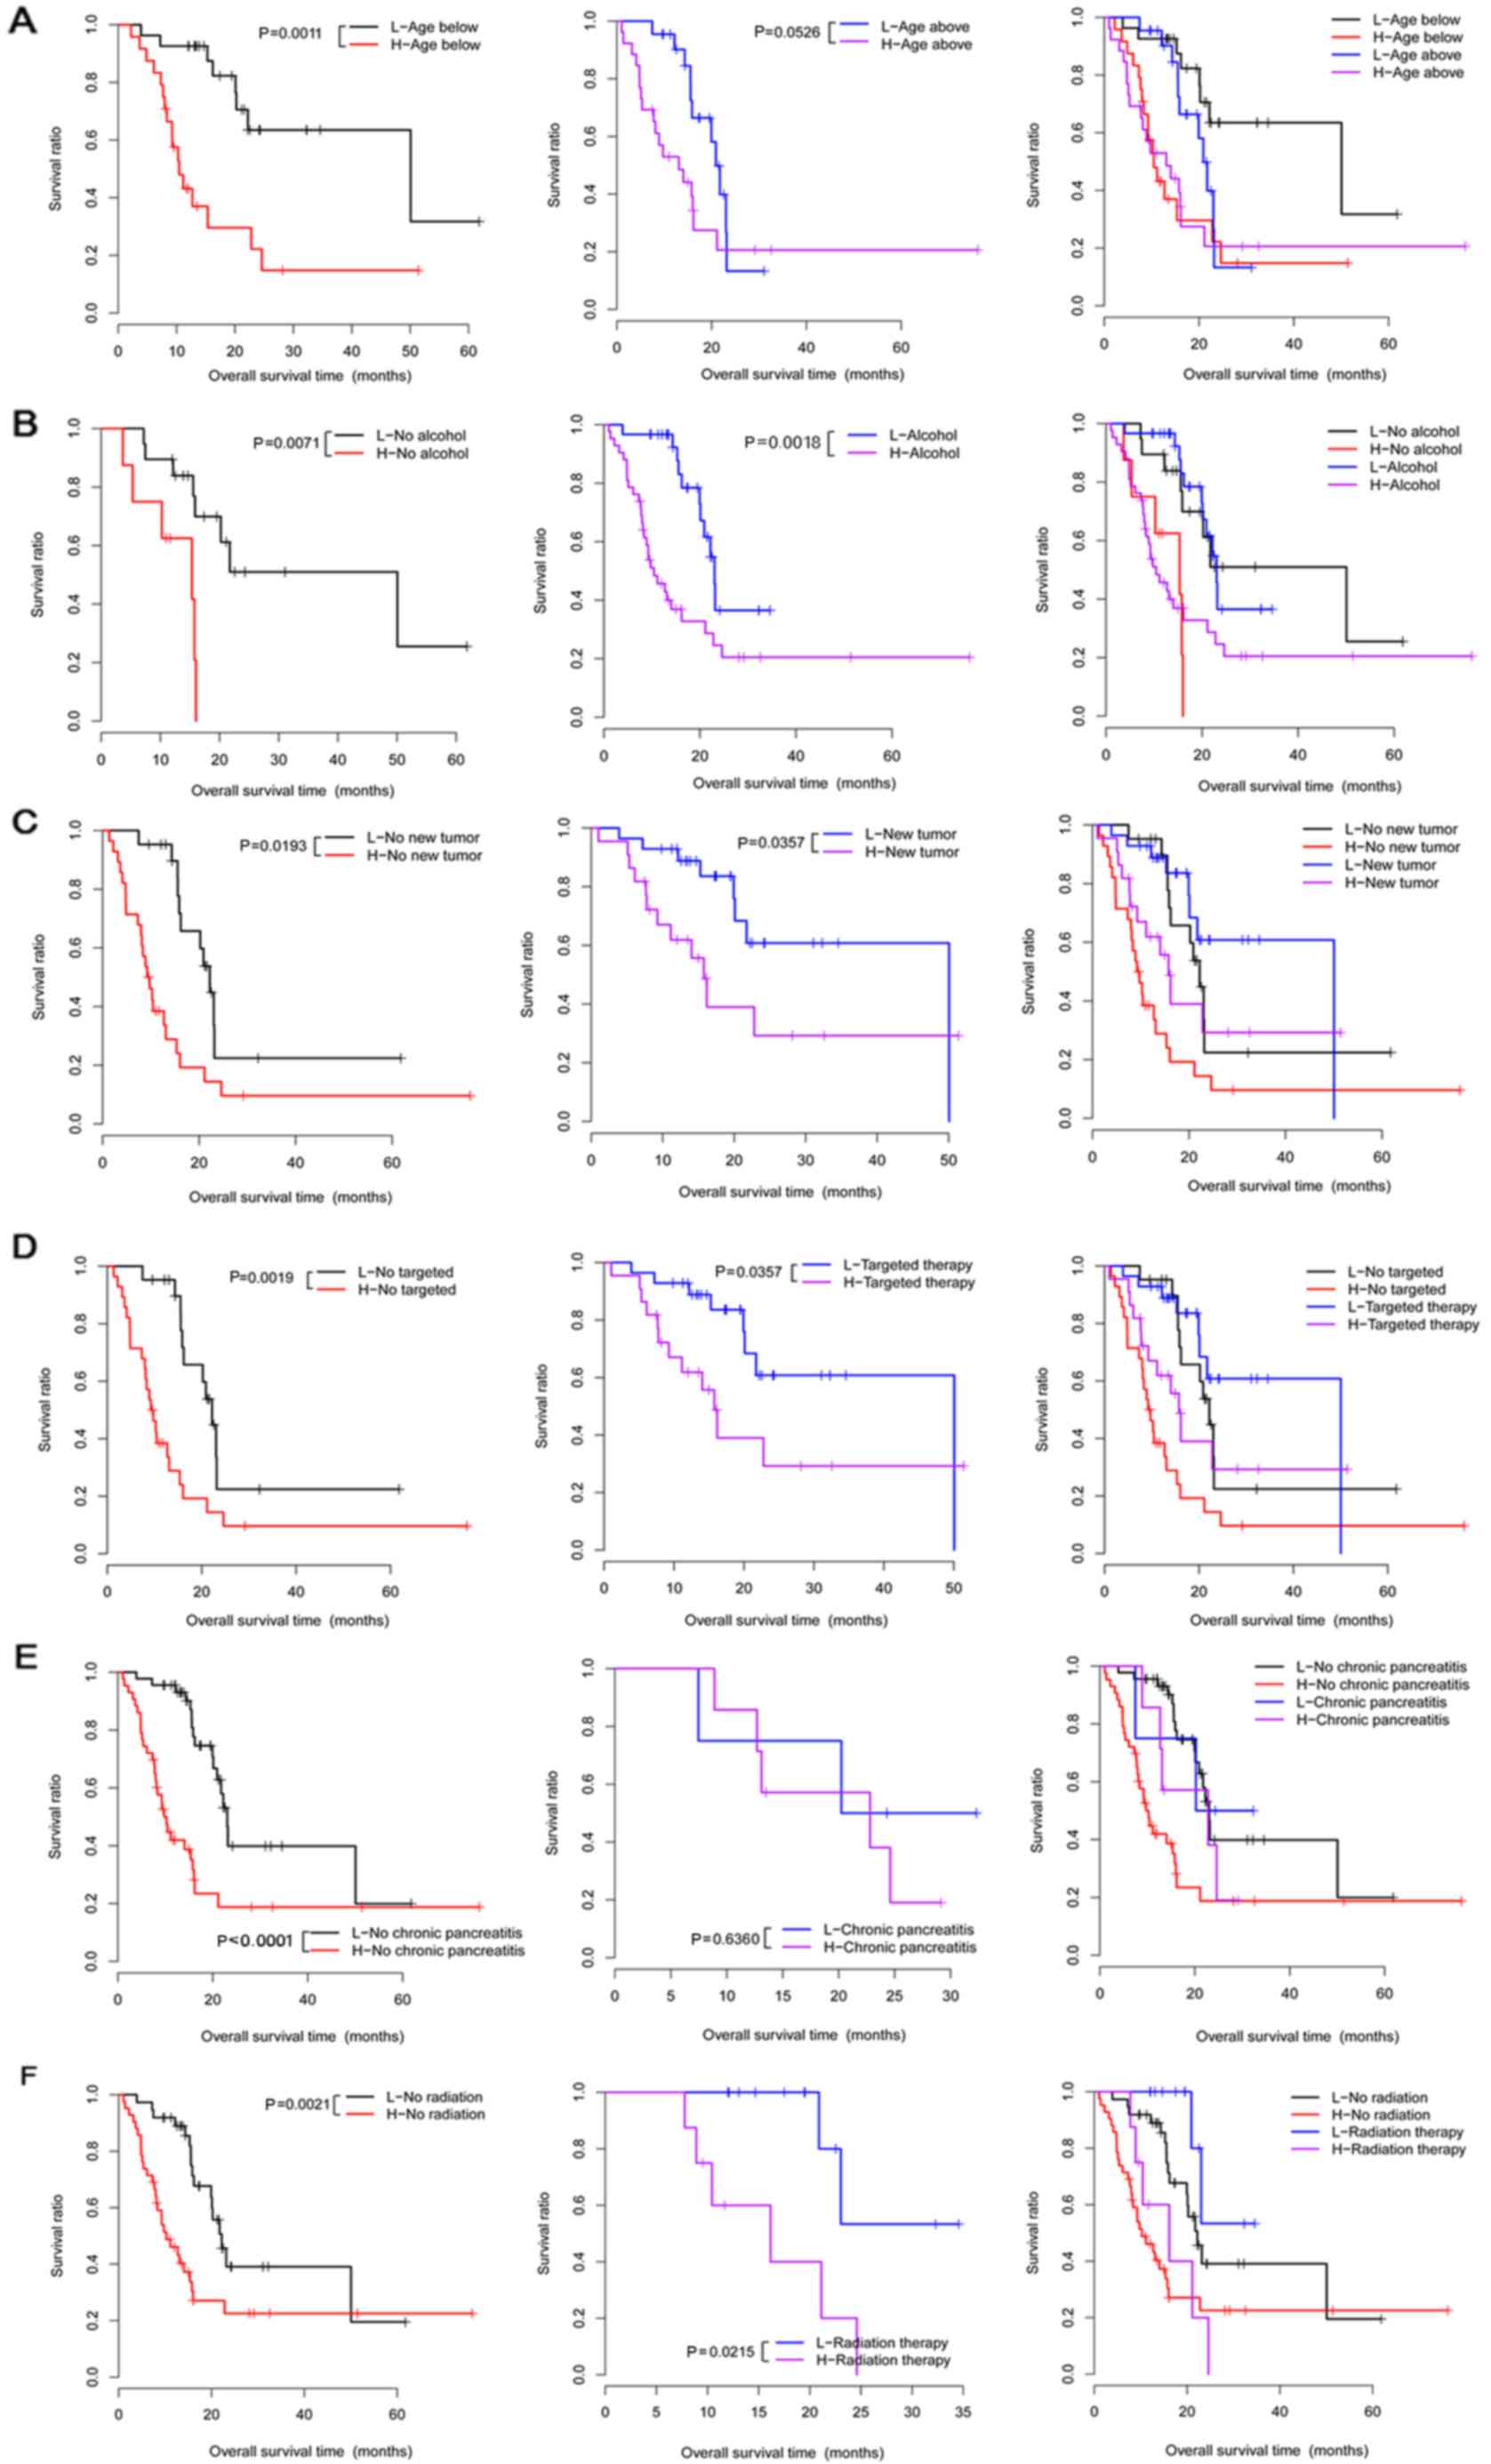 | Figure 3.The Kaplan-Meier (KM) survival curves
for the 6 clinical factors (age, alcohol use, new tumor, targeted
molecular therapy, chronic pancreatitis history and radiation
therapy) in high- and low-risk groups under the same clinical
condition. (A) Survival curves for patients below the age of 65
(left), patients above the age of 65 (middle), and patients below
or above the age of 65 years (right). (B) The survival curves for
no-alcohol group (left), alcohol group (middle), and no-alcohol or
alcohol groups (right). (C) Survival curves for no new tumor group
(left), new tumor group (middle), and no new tumor or new tumor
groups (right). (D) Survival curves for no targeted therapy group
(left), targeted therapy group (middle), and no targeted therapy or
targeted therapy groups (right). (E) Survival curves for no chronic
pancreatitis group (left), chronic pancreatitis group (middle), and
no chronic pancreatitis or chronic pancreatitis groups (right). (F)
Survival curves for no radiation therapy group (left), radiation
therapy group (middle), and no radiation therapy or radiation
therapy groups (right). Red and black separately represent high-
and low-risk groups. |
| Table V.Results of the stratified analysis
under the same clinical condition. |
Table V.
Results of the stratified analysis
under the same clinical condition.
| Clinical
factors | P-value |
|---|
| Age (≥65 years,
n=75) | 0.0526 |
| Age (<65 years,
n=76) | 0.0011 |
| Sex (male,
n=85) | 0.2520 |
| Sex (female,
n=64) | 0.7210 |
| Chronic
pancreatitis history (yes, n=13) | 0.6360 |
| Chronic
pancreatitis history (no, n=109) | <0.0001 |
| Diabetes history
(yes, n=32) | 0.1200 |
| Diabetes history
(no, n=94) | 0.0936 |
| Alcohol (yes,
n=90) | 0.0018 |
| Alcohol (no,
n=51) | 0.0071 |
| Tobacco (never,
n=54) | 0.3370 |
| Tobacco (reform,
n=53) | 0.0502 |
| Tobacco (current,
n=17) | 0.1180 |
| Pathologic_M (M0,
N=68) | 0.6310 |
| Pathologic_M (M1,
n=2) | – |
| Pathologic_N (N0,
n=40) | 0.1930 |
| Pathologic_N (N1,
n=105) | 0.0537 |
| Pathologic_T
(T1+T2, n=24) | 0.1540 |
| Pathologic_T
(T3+T4, n=124) | 0.0567 |
| Radiation therapy
(yes, n=37) | 0.0215 |
| Radiation therapy
(no, n=102) | 0.0021 |
| Targeted molecular
therapy (yes, n=98) | 0.0357 |
| Targeted molecular
therapy (no, n=45) | 0.0019 |
| New tumor (yes,
n=54) | 0.0357 |
| New tumor (no,
n=87) | 0.0193 |
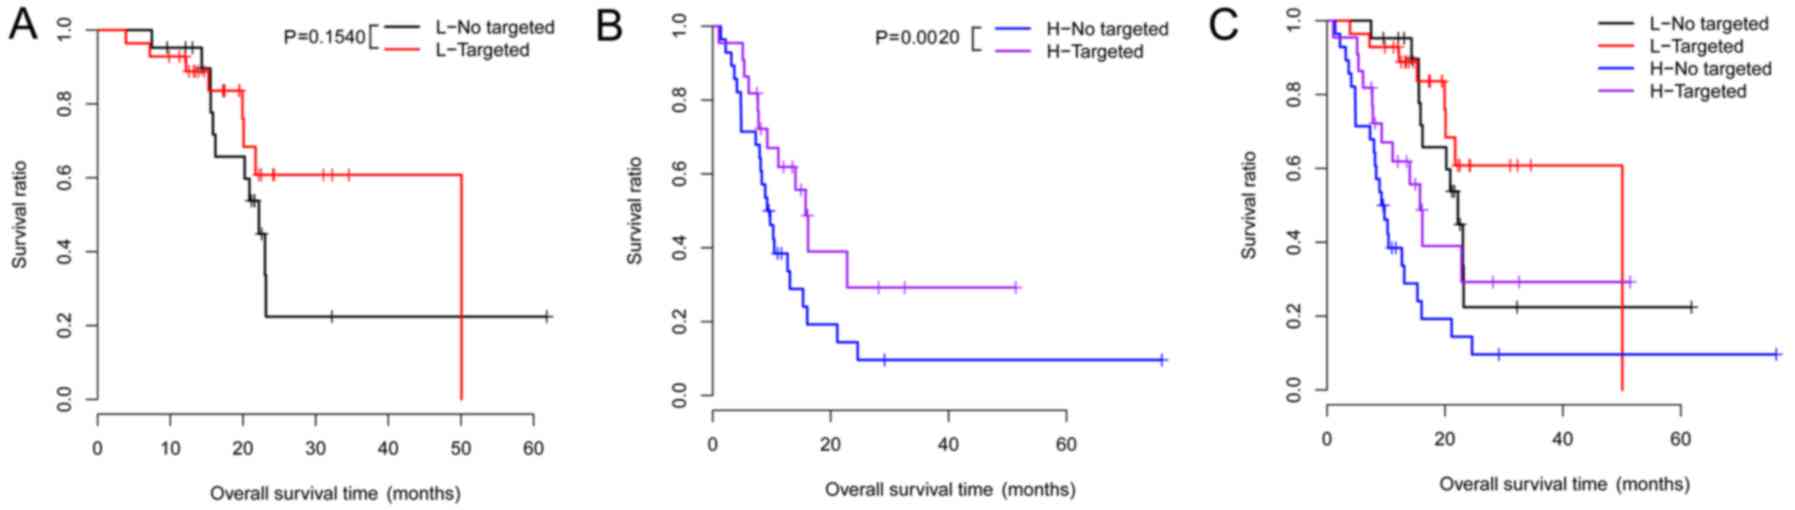
Under the same risk condition, the correlation
analysis suggested that targeted molecular therapy had significant
association with clinical prognosis (Table VI). KM survival analysis was also
performed for targeted molecular therapy under different groups
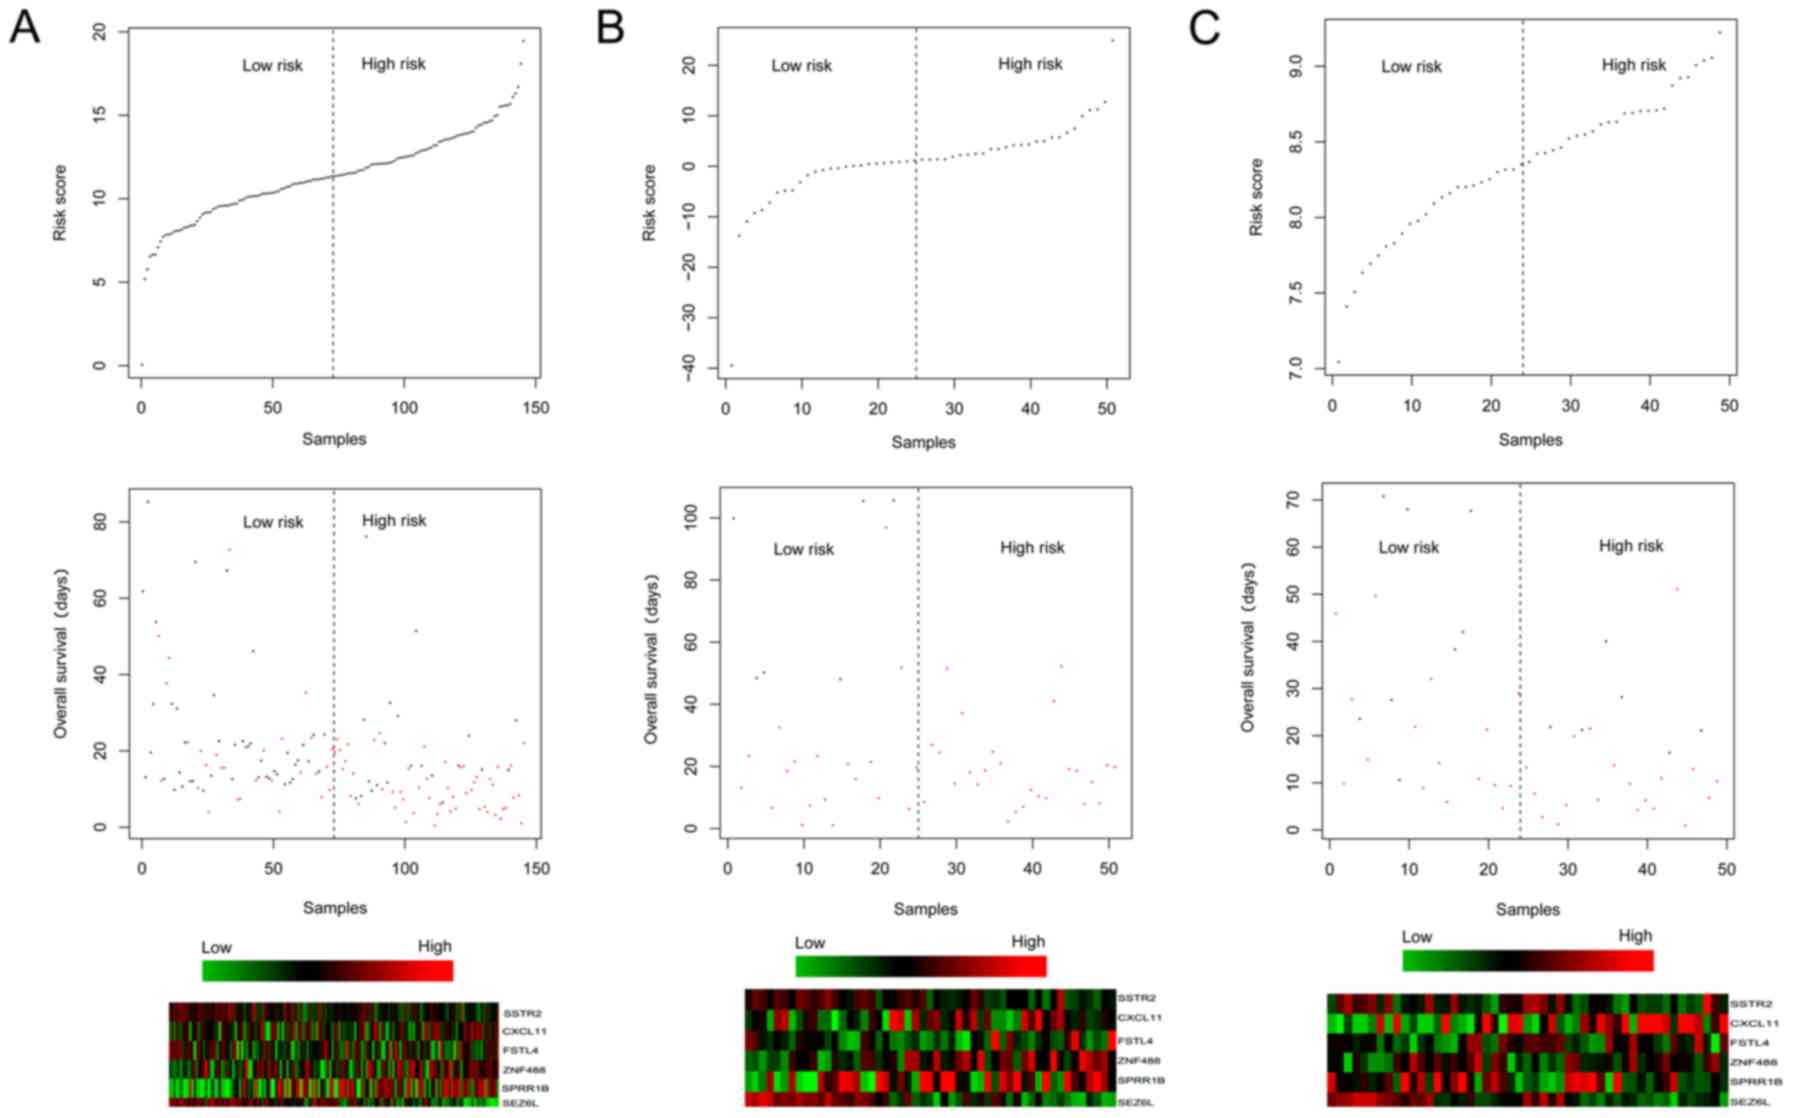
(Fig. 4). Meanwhile, the risk
scores and survival time of the patients, and the expression
heatmaps of the 6 prognosis-associated genes are presented in
Fig. 5.
| Table VI.Results of the stratified analysis
under the same risk condition. |
Table VI.
Results of the stratified analysis
under the same risk condition.
| Clinical
factors | High risk | Low risk |
|---|
| Age in years (above
vs. below median) | 0.888 | 0.056 |
| Sex (male vs.
female) | 0.622 | 0.939 |
| Pathologic_M
(M0/M1) | 0.869 | 0.368 |
| Pathologic_N (N0
vs. N1) | 0.332 | 0.906 |
| Pathologic_T (T1
vs. T2 vs. T3) | 0.308 | 0.098 |
| Chronic
pancreatitis history (yes vs. no) | 0.267 | 0.917 |
| Diabetes history
(yes vs. no) | 0.643 | 0.997 |
| Alcohol (yes vs.
no) | 0.803 | 0.977 |
| Tobacco (never vs.
reform vs. current) | 0.210 | 0.534 |
| Radiation therapy
(yes vs. no) | 0.668 | 0.173 |
| Targeted molecular
therapy (yes vs. no) | 0.002 | 0.154 |
| New tumor (yes vs.
no) | 0.389 | 0.997 |
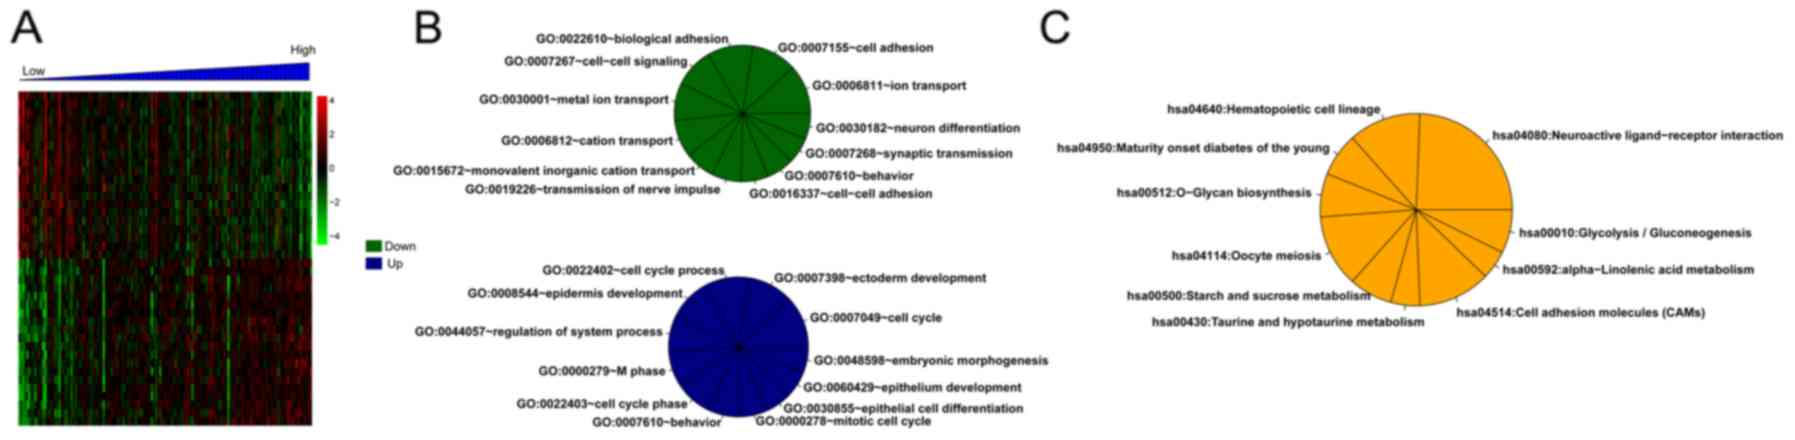
Enrichment analysis
For the training set, there were 373 DEGs between
the high- and low-risk groups. Correlation analysis showed that 179
and 194 DEGs separately were positively and negatively related to
risk scores. Then, the top 20 DEGs were selected and conducted with
clustering analysis (Fig. 6A).
Additionally, multiple significantly enriched biological processes
(Fig. 6B) and pathways (Fig. 6C) were obtained for these DEGs.
Discussion
In the present study, a total of 242 DEGs between
the poor and good prognosis groups were selected. Then, 6
prognosis-associated genes (CXCL11, FSTL4, SEZ6L, SPRR1B,
SSTR2 and TINAG) were selected for constructing a risk
score system. The expression levels of SSTR2 were higher in the
low-risk group of the TCGA dataset and GSE79668, while an obviously
decreased expression level of SSTR2 was observed in the low-risk
group of GSE62452. This discrepancy may be due to the fact that the
gene expression model in the validation datasets could not be
exactly the same as those in the training dataset. The patients in
the TCGA training dataset and validation datasets (GSE62452 and
GSE79668) were classified into high- and low-risk groups according
to the median of risk scores which were calculated according to not
only the expression levels of the 6 genes but also their regression
coefficients. Moreover, the risk score system was confirmed in both
the training and the two validation (GSE62452 and GSE79668)
datasets, suggesting that the constructed 6-gene risk score system
has prognostic prediction value. Therefore, it is necessary to
select SSTR2 to build the 6-gene risk score system. Cox regression
analysis showed that risk score and new tumor were significantly
correlated with survival time. Under the same clinical condition, 6
clinical factors were significantly correlated with survival time.
Although only targeted molecular therapy had a significant
association with clinical prognosis under the same risk condition,
the clinical impact was still unexplainable when various types of
molecular-targeted agents were mixed. However, this association
analysis was not performed since the specific method of
targeted-therapy for each patient is unavailable from The Cancer
Genome Atlas. In addition, multiple significantly enriched
biological processes and pathways for the genes positively or
negatively related to risk scores were obtained.
Angiogenesis is a typical feature of tumor cell
growth, and the CXC chemokines have pleiotropic abilities in
mediating tumor-correlated angiogenesis and tumor metastasis
(24,25). Chemokine receptors chemokine (C-X-C
motif) receptor 4 (CXCR4) and CXCR7 are co-expressed
in PC samples (26). CXCL14
is highly expressed in PC tissues suggesting its correlation with
the pathogenesis of PC (27).
FSTL1 was found to have a low expression in PC, and inhibits
the cell growth and proliferation in PC patients (28,29).
The expression of SSTR2 is lost in the process of PAC
development, which contributes to tumor cell growth via the
activation of phosphatidylinositol-4,5-bisphosphate 3-kinase (PI3K)
signaling and the overexpression of CXCL16 (30). SSTR2 plays antitumor roles in
PC, and its re-expression via gene transfer may be a promising gene
therapy approach for the disease (31,32).
Therefore, CXCL11, FSTL4 and SSTR2 may be related to
the mechanisms of PAC.
However, little research has reported the
involvement of SEZ6L, SPRR1B and TINAG in PAC. As a
transmembrane protein with multiple domains, SEZ6L protein plays
roles in signal transduction and protein-protein interaction
(33). SEZ6L expression is
elevated in lung cancer tissues, and SEZ6L variants are
correlated with the progression of lung cancer and can increase the
risk of the disease (34,35). The mRNA expression of SPRR1
is caused before the formation of Chinese hamster ovary (CHO) cells
in G0 phase, and thus SPRR1 expression is
responsive to growth-arresting signals (36). As a basement membrane glycoprotein,
TINAG can be recognized by autoantibodies in some types of
human tubulointerstitial nephritis (37). The TINAG-related protein
(TINAG-RP) was found to have higher expression levels in a
colorectal adenocarcinoma cell line (38). SEZ6L, SPRR1B and TINAG
play roles in other types of malignant tumors, indicating that they
may also function in the development and progression of PAC.
Furthermore, the following limitations should be
mentioned in this study. On the one hand, the prognostic prediction
model based on the expression levels of these 6
prognosis-associated genes should be validated in an independent
patient cohort by clinical experiments. Whether our model is
superior to conventional prognostic factors still needs to be
explored based on more research. On the other hand, the prediction
accuracy of the risk score system may be influenced by data
heterogeneity, platform differences and sample size differences of
the training and validation datasets. Thus, further experiments are
still needed to confirm these results.
In conclusion, 242 DEGs between the poor and good
prognosis groups were screened, and 6 prognosis-associated genes
(CXCL11, FSTL4, SEZ6L, SPRR1B, SSTR2 and TINAG) were
selected for constructing a risk score system. Moreover, the 6-gene
risk score system may be utilized for predicting the clinical
prognosis of PAC patients. However, further research is still
needed to validate the prognostic prediction value based on the
expression levels of these 6 prognosis-associated genes in an
independent patient cohort with PAC.
Acknowledgements
Not applicable.
Funding
No funding was received.
Availability of data and materials
The datasets used during the present study are
available from the corresponding author upon reasonable
request.
Authors' contributions
YL performed the data analyses and wrote the
manuscript. DZ, HX and YH contributed significantly in data
analyses and manuscript revision. YS conceived and designed the
study. All authors read and approved the manuscript and agree to be
accountable for all aspects of the research in ensuring that the
accuracy or integrity of any part of the work are appropriately
investigated and resolved.
Ethics approval and consent to
participate
In the original article of the datasets, the trials
were approved by the local institutional review boards of all
participating centers, and informed consent was obtained from all
patients.
Patient consent for publication
Not applicable.
Competing interests
The authors declare that they have no competing
interests.
References
|
1
|
Husain K: Pancreatic cancer treatment.
Cancer Sci. 5:1100. 2014.
|
|
2
|
Hidalgo M: Pancreatic cancer. N Engl J
Med. 362:1605–1617. 2010. View Article : Google Scholar : PubMed/NCBI
|
|
3
|
Maisonneuve P and Lowenfels AB: Risk
factors for pancreatic cancer: A summary review of meta-analytical
studies. Int J Epidemiol. 44:186–198. 2015. View Article : Google Scholar : PubMed/NCBI
|
|
4
|
Lowenfels AB and Maisonneuve P:
Epidemiology and risk factors for pancreatic cancer. Best Pract Res
Clin Gastroenterol. 20:197–209. 2006. View Article : Google Scholar : PubMed/NCBI
|
|
5
|
McGuire S: World cancer report 2014.
Geneva, Switzerland: World health organization, international
agency for research on cancer, WHO Press, 2015. Adv Nutr.
7:418–419. 2016. View Article : Google Scholar : PubMed/NCBI
|
|
6
|
Bond-Smith G, Banga N, Hammond TM and
Imber CJ: Pancreatic adenocarcinoma. BMJ. 344:e24762012. View Article : Google Scholar : PubMed/NCBI
|
|
7
|
Yeo CJ and Cameron JL: Prognostic factors
in ductal pancreatic cancer. Langenbecks Arch Surg. 383:129–133.
1998. View Article : Google Scholar : PubMed/NCBI
|
|
8
|
Oshima M, Okano K, Muraki S, Haba R, Maeba
T, Suzuki Y and Yachida S: Immunohistochemically detected
expression of 3 major genes (CDKN2A/p16, TP53, and
SMAD4/DPC4) strongly predicts survival in patients with
resectable pancreatic cancer. Ann Surg. 258:336–346. 2013.
View Article : Google Scholar : PubMed/NCBI
|
|
9
|
Song W, Tao K, Li H, Jin C, Song Z, Li J,
Shi H, Li X, Dang Z and Dou K: Bmi-1 is related to proliferation,
survival and poor prognosis in pancreatic cancer. Cancer Sci.
101:1754–1760. 2010. View Article : Google Scholar : PubMed/NCBI
|
|
10
|
Proctor E, Waghray M, Lee CJ, Heidt DG,
Yalamanchili M, Li C, Bednar F and Simeone DM: Bmi1 enhances
tumorigenicity and cancer stem cell function in pancreatic
adenocarcinoma. PLoS One. 8:e558202013. View Article : Google Scholar : PubMed/NCBI
|
|
11
|
Kahlert C, Bergmann F, Beck J, Welsch T,
Mogler C, Herpel E, Dutta S, Niemietz T, Koch M and Weitz J: Low
expression of aldehyde deyhdrogenase 1A1 (ALDH1A1) is a prognostic
marker for poor survival in pancreatic cancer. BMC Cancer.
11:2752011. View Article : Google Scholar : PubMed/NCBI
|
|
12
|
Hoshino Y, Nishida J, Katsuno Y, Koinuma
D, Aoki T, Kokudo N, Miyazono K and Ehata S: Smad4 decreases the
population of pancreatic cancer-initiating cells through
transcriptional repression of ALDH1A1. Am J Pathol.
185:1457–1470. 2015. View Article : Google Scholar : PubMed/NCBI
|
|
13
|
Schaeffer DF, Owen DR, Lim HJ, Buczkowski
AK, Chung SW, Scudamore CH, Huntsman DG, Ng SS and Owen DA:
Insulin-like growth factor 2 mRNA binding protein 3 (IGF2BP3)
overexpression in pancreatic ductal adenocarcinoma correlates with
poor survival. BMC Cancer. 10:592010. View Article : Google Scholar : PubMed/NCBI
|
|
14
|
Nguyen Kovochich A, Arensman M, Lay AR,
Rao NP, Donahue T, Li X, French SW and Dawson DW: HOXB7 promotes
invasion and predicts survival in pancreatic adenocarcinoma.
Cancer. 119:529–539. 2013. View Article : Google Scholar : PubMed/NCBI
|
|
15
|
Chile T, Fortes MA, Corrêa-Giannella ML,
Brentani HP, Maria DA, Puga RD, de Paula Vde J, Kubrusly MS, Novak
EM, Bacchella T, et al: HOXB7 mRNA is overexpressed in pancreatic
ductal adenocarcinomas and its knockdown induces cell cycle arrest
and apoptosis. BMC Cancer. 13:4512013. View Article : Google Scholar : PubMed/NCBI
|
|
16
|
Zhang Y, Szustakowski J and Schinke M:
Bioinformatics analysis of microarray data. Methods Mol Biol.
573:259–284. 2009. View Article : Google Scholar : PubMed/NCBI
|
|
17
|
Kirby MK, Ramaker RC, Gertz J, Davis NS,
Johnston BE, Oliver PG, Sexton KC, Greeno EW, Christein JD, Heslin
MJ, et al: RNA sequencing of pancreatic adenocarcinoma tumors
yields novel expression patterns associated with long-term survival
and reveals a role for ANGPTL4. Mol Oncol. 10:1169–1182.
2016. View Article : Google Scholar : PubMed/NCBI
|
|
18
|
Yang S, He P, Wang J, Schetter A, Tang W,
Funamizu N, Yanaga K, Uwagawa T, Satoskar AR, Gaedcke J, et al: A
novel MIF signaling pathway drives the malignant character of
pancreatic cancer by targeting NR3C2. Cancer Res. 76:3838–3850.
2016. View Article : Google Scholar : PubMed/NCBI
|
|
19
|
Smyth GK: Limma: Linear models for
microarray data. Bioinformatics Comput Biol Solutions Using R and
Bioconductor. 397–420. 2005. View Article : Google Scholar
|
|
20
|
Therneau T: A package for survival
analysis. R package. 2.37–2. 2012.
|
|
21
|
Kleinbaum DG and Klein M: Kaplan-meier
survival curves and the log-rank test. Statistics Biol Health.
45–82. 2012.
|
|
22
|
Gui J and Li H: Penalized Cox regression
analysis in the high-dimensional and low-sample size settings, with
applications to microarray gene expression data. Bioinformatics.
21:3001–3008. 2005. View Article : Google Scholar : PubMed/NCBI
|
|
23
|
Huang DW, Sherman BT, Tan Q, Collins JR,
Alvord WG, Roayaei J, Stephens R, Baseler MW, Lane HC and Lempicki
RA: The DAVID gene functional classification tool: A novel
biological module-centric algorithm to functionally analyze large
gene lists. Genome Biol. 8:R1832007. View Article : Google Scholar : PubMed/NCBI
|
|
24
|
Keeley EC, Mehrad B and Strieter RM: CXC
chemokines in cancer angiogenesis and metastases. Adv Cancer Res.
106:91–111. 2010. View Article : Google Scholar : PubMed/NCBI
|
|
25
|
Keeley EC, Mehrad B and Strieter RM:
Chemokines as mediators of tumor angiogenesis and
neovascularization. Exp Cell Res. 317:685–690. 2011. View Article : Google Scholar : PubMed/NCBI
|
|
26
|
Heinrich EL, Lee W, Lu J, Lowy AM and Kim
J: Chemokine CXCL12 activates dual CXCR4 and CXCR7-mediated
signaling pathways in pancreatic cancer cells. J Transl Med.
10:682012. View Article : Google Scholar : PubMed/NCBI
|
|
27
|
Wente MN, Mayer C, Gaida MM, Michalski CW,
Giese T, Bergmann F, Giese NA, Büchler MW and Friess H: CXCL14
expression and potential function in pancreatic cancer. Cancer
Lett. 259:209–217. 2008. View Article : Google Scholar : PubMed/NCBI
|
|
28
|
Viloria K, Munasinghe A, Asher S, Bogyere
R, Jones L and Hill NJ: A holistic approach to dissecting SPARC
family protein complexity reveals FSTL-1 as an inhibitor of
pancreatic cancer cell growth. Sci Rep. 6:378392016. View Article : Google Scholar : PubMed/NCBI
|
|
29
|
Trojan L, Schaaf A, Steidler A, Haak M,
Thalmann G, Knoll T, Gretz N, Alken P and Michel MS: Identification
of metastasis-associated genes in prostate cancer by genetic
profiling of human prostate cancer cell lines. Anticancer Res.
25:183–191. 2005.PubMed/NCBI
|
|
30
|
Chalabidchar M, Cassantsourdy S, Duluc C,
Fanjul M, Lulka H, Samain R, Roche C, Breibach F, Delisle MB,
Poupot M, et al: Loss of somatostatin receptor subtype 2 promotes
growth of KRAS-induced pancreatic tumors in mice by activating PI3K
signaling and overexpression of CXCL16. Gastroenterology.
148:1452–1465. 2015. View Article : Google Scholar : PubMed/NCBI
|
|
31
|
Du ZY, Qin RY, Xia W, Tian R and Kumar M:
Gene transfer of somatostatin receptor type 2 by intratumoral
injection inhibits established pancreatic carcinoma xenografts.
World J Gastroenterol. 11:516–520. 2005. View Article : Google Scholar : PubMed/NCBI
|
|
32
|
Carrere N, Vernejoul F, Souque A, Asnacios
A, Vaysse N, Pradayrol L, Susini C, Buscail L and Cordelier P:
Characterization of the bystander effect of somatostatin receptor
sst2 after in vivo gene transfer into human pancreatic cancer
cells. Human Gene Ther. 16:1175–1193. 2005. View Article : Google Scholar
|
|
33
|
Pigoni M, Wanngren J, Kuhn PH, Munro KM,
Gunnersen JM, Takeshima H, Feederle R, Voytyuk I, De Strooper B,
Levasseur MD, et al: Seizure protein 6 and its homolog seizure
6-like protein are physiological substrates of BACE1 in neurons.
Mol Neurodegener. 11:672016. View Article : Google Scholar : PubMed/NCBI
|
|
34
|
Nishioka M, Kohno T, Takahashi M, Niki T,
Yamada T, Sone S and Yokota J: Identification of a 428-kb
homozygously deleted region disrupting the SEZ6L gene at
22q12.1 in a lung cancer cell line. Oncogene. 19:6251–6260. 2000.
View Article : Google Scholar : PubMed/NCBI
|
|
35
|
Gorlov IP, Meyer P, Liloglou T, Myles J,
Boettger MB, Cassidy A, Girard L, Minna JD, Fischer R, Duffy S, et
al: Seizure 6-like, SEZ6L) gene and risk for lung cancer.
Cancer Res. 67:8406–8411. 2007. View Article : Google Scholar : PubMed/NCBI
|
|
36
|
Tesfaigzi Y, Wright PS and Belinsky SA:
SPRR1B overexpression enhances entry of cells into the
G0 phase of the cell cycle. Am J Physiol Lung Cell Mol
Physiol. 285:L889–L898. 2003. View Article : Google Scholar : PubMed/NCBI
|
|
37
|
Yoshioka K, Takemura T and Hattori S:
Tubulointerstitial nephritis antigen: Primary structure, expression
and role in health and disease. Nephron. 90:1–7. 2002. View Article : Google Scholar : PubMed/NCBI
|
|
38
|
Wex T, Lipyansky A, Brömme NC, Wex H, Guan
XQ and Brömme D: TIN-ag-RP, a novel catalytically inactive
cathepsin B-related protein with EGF domains, is predominantly
expressed in vascular smooth muscle cells. Biochemistry.
40:1350–1357. 2001. View Article : Google Scholar : PubMed/NCBI
|