Introduction
Liver cancer is the fifth most prevalent cancer and
the second most frequent cause of cancer-related mortality
worldwide (1). Hepatocellular
carcinoma (HCC) is the most frequent type of primary liver tumour.
The majority of patients are diagnosed at an advanced stage, which
explains the poor prognosis of this cancer. Sorafenib is the
standard of care for the treatment of advanced HCC. Sorafenib is a
multikinase inhibitor directed against the RAF kinases and several
receptor tyrosine kinases, such as vascular endothelial growth
factor receptor (VEGFR) (2). The
efficacy of sorafenib was demonstrated a decade ago in two
comparative placebo-controlled trials that showed a benefit in
terms of overall survival (OS) (3,4).
Recently, lenvatinib demonstrated a survival advantage that was
non-inferior to that of sorafenib in an open-label, multicentre,
non-inferiority, randomised trial (5). However, sorafenib currently remains
the only first-line treatment approved by the Food and Drug
Administration for patients with advanced HCC.
There is currently a lack of biomarkers able to
predict the efficacy of sorafenib in HCC patients. α-Fetoprotein
(AFP) is the biomarker most widely used by clinicians for the
follow-up of HCC patients treated by sorafenib. However, AFP is
secreted in only ~50% of HCC patients due to high intratumoural
variability (6,7). Among these patients, only 37% exhibit
a significant decrease in their AFP levels following sorafenib
treatment (8). Recently, the latest
recommendations of the European Association for the Study of the
Liver have underlined the suboptimal performance of AFP as a
serological test in the surveillance of HCC patients (1). Identifying a biomarker secreted in all
patients with HCC that is directly regulated by sorafenib remains a
challenge. In a recent study exploring the impact of sorafenib on
proteostasis, we reported that sorafenib inhibits global protein
biosynthesis and initiation of translation (9). Proteostasis may be defined as the
process regulating the production, folding, trafficking and
degradation of proteins within the cell, in order to maintain its
homeostasis. In HCC cells exposed to sorafenib, this inhibition of
translation is expected to largely prevent the synthesis of several
biologically active peptides and proteins. Although this putative
effect has not been formally examined, a likely consequence of
protein synthesis inhibition would be interruption of autocrine
loops (10).
Proliferation of HCC cells is dependent on two
well-documented autocrine loops composed of VEGF/VEGFR and
amphiregulin (AREG)/epidermal growth factor receptor (EGFR) ligands
and receptors. VEGFR is a direct target of sorafenib and is known
to be an important factor in HCC growth (11). VEGF is a potent angiogenic factor
and is upregulated in several human tumours (12). This autocrine loop plays a crucial
role in tumour invasion and aggressiveness (12). Activation of EGFR during
hepatocarcinogenesis is not dependent on activating mutations, but
rather on autocrine loops involving natural ligands of EGFR, such
as AREG (13). AREG is upregulated
in HCC and acts as a pro-oncogenic factor (14). This autocrine loop was recently
identified as a key determinant of resistance to sorafenib
(15,16). The aim of the present study was to
evaluate the effect of sorafenib on AREG and VEGF production in two
HCC cell lines. In order to study a potential link between AREG and
VEGF production and the efficacy of sorafenib, the prognostic
impact of each of these factors was investigated in HCC
patients.
Materials and methods
Cell culture and reagents
The human HCC cell lines used in this study (Huh7
and Hep3B, passages between 6 and 8) were obtained from Dr
Wychowski (Institut de Biologie de Lille, Lille, France) and were
authenticated by profiling short tandem repeats at 16 loci (LGC
Standards, Strasbourg, France). The cells were cultured in
Dulbecco's modified Eagle's medium supplemented with 10% fetal calf
serum (Jacques Boy Institute S.A., Reims, France), 2 mM glutamine,
penicillin and streptomycin. Brefeldin A was purchased from
Sigma-Aldrich; Merck KGaA (Darmstadt, Germany). Sorafenib was
purchased from Selleck Chemicals (Houston, TX, USA) and stored as
10 mM stock in dimethyl sulfoxide at −20°C.
Determination of AFP
concentrations
AFP concentrations were measured in serum samples
using the Vista Dimension 500 analyser (Siemens AG, Munich,
Germany) and the corresponding kit recommended for routine clinical
practice. Only decreases of >20% in the serum level of AFP were
taken into consideration. This cut-off was based on the study of
Personeni et al (8).
Determination of AREG and VEGF
concentrations
AREG or VEGF concentrations in cell supernatant or
serum samples were determined using a sandwich-based ELISA kit
(R&D Systems, Inc., Minneapolis, MN, USA) according to the
manufacturer's instructions. Only >5% decreases in the serum
level of AREG or VEGF were taken into consideration This cut-off
was selected as it corresponded to the smallest variation observed
in our cohort.
Reverse transcription-quantitative
polymerase chain reaction (RT-qPCR) analysis
Total RNA was extracted using RNeasy Mini kit (ref
74104; Qiagen, Courtaboeuf, France) and reverse-transcribed to cDNA
using High Capacity cDNA Reverse Transcription kit (ref 4368814;
Applied Biosystems; Thermo Fisher Scientific, Inc., Waltham, MA,
USA) according to the manufacturer's instructions. Amplification
was performed with the TaqMan Universal PCR master Mix (ref
4304437; Applied Biosystems; Thermo Fisher Scientific, Inc.) on an
ABI 7900HT Sequence Detection System (Applied Biosystems; Thermo
Fisher Scientific, Inc.) using primers and probe sets for AREG (ref
Hs00950669_m1, cat. no. 433182; Applied Biosystems; Thermo Fisher
Scientific, Inc.) and glyceraldehyde phosphate dehydrogenase
(GAPDH; ref Hs99999905_m1, cat. no. 4333764; Applied
Biosystems; Thermo Fisher Scientific, Inc.). The cycling conditions
were initial denaturation at 95°C for 10 min, followed by 45 cycles
of denaturation at 95°C for 15 sec and annealing at 60°C for 1 min.
Data were normalized to the endogenous control GAPDH to
obtain ΔCq. The fold change in genes of interest relative to
untreated samples was determined using the 2−ΔΔCq method
(17).
Western blotting
For each experimental condition, complete cell
extracts were prepared in RIPA buffer. Following protein
concentration determination with a BCA kit (Thermo Fisher
Scientific, Inc.), a total of 50 µg protein was precipitated with
methanol and chloroform. The samples were then denatured in Laemmli
sample buffer, loaded on 10% SDS-PAGE, and transferred to
nitrocellulose membranes using standard procedures. The membranes
were saturated for 1 h in 5% milk in TTBS [Tween 0.05%, NaCl 200
mM, Tris-HCl (pH 8.0)], then rinsed and incubated overnight with
each primary antibody at a 1:1,000 dilution (AREG, mouse, Santa
Cruz Biotechnology, Inc., Dallas, TX, USA; ref 74501; and β-actin,
mouse, Sigma-Aldrich; Merck KGaA; ref A544R). Later, secondary
antibodies coupled with horseradish peroxidase (HRP) were incubated
for 1 h at a 1:5,000 dilution (anti-mouse IgG HRP-conjugated,
sheep, GE Healthcare, Chicago, IL, USA; ref NA931V). The
electrochemiluminescence reaction was used for detection.
Cytokine array
The Proteome Profiler ‘Human Cytokine Array Panel A’
kit was purchased from R&D Systems (ref ARY005) and used
according to the manufacturer's instructions. Briefly, this kit
utilizes capture antibodies spotted onto a nitrocellulose membrane
to allow high-throughput multi-analyte profiling of 36 cytokines,
chemokines and acute phase proteins in a single sample. Cell
culture supernatants were diluted and mixed with a cocktail of
biotinylated detection antibodies. The sample/antibody mixture was
then incubated with the array. Any cytokine/antibody complex
present was bound by its cognate immobilized capture antibody on
the membrane. Streptavidin-HRP and chemiluminescent detection
reagents were added, and a signal was produced in proportion to the
amount of cytokine bound. Chemiluminescence was detected in the
same manner as a western blot.
Serum samples
Frozen serum samples from a cohort of 55 patients
with advanced HCC receiving sorafenib were used in this study.
Patients were recruited from Cochin Hospital (Paris, France). Of
the 55 patients, 50 had cancer associated with cirrhosis. The
patients were treated with sorafenib at the validated dose of 400
mg twice daily until evidence of disease progression. In 12 of the
55 patients, the dose was reduced to 50% of the planned dose due to
severe drug-related adverse events (grade 3/4 hand-foot skin
reaction, n=5; grade 3 fatigue, n=4; and grade 3 hypertension,
n=3). Tumour evaluation was performed every 3 months during
treatment according to the modified Response Evaluation Criteria In
Solid Tumours (18).
Progression-free survival (PFS) was measured from the date of
diagnosis to the date of evidence of disease progression or death.
OS was measured from the date of diagnosis to the date of death or
the last follow-up. Serum samples were collected from each patient
7 days before and 14 days after initiating sorafenib therapy.
Ethics approval and consent to
participate
The present study was conducted in compliance with
the French legislation and the Declaration of Helsinki regarding
ethical principles for medical research involving human subjects.
The ‘Comité de Protection des Personnes d'Ile de France’
Institutional Review Board approved the study protocol (NuAT140)
and all patients provided their written informed consent. No
samples were obtained from patients who were minors or physically
or mentally unable to understand and provide their consent to the
use of their serum samples.
Statistical analysis
Student's t-test was used for statistical analyses
of the experiments performed on cells. Wilcoxon's test, Fisher's
exact test, Chi-squared test, receiver operating characteristic
(ROC) curve analysis and Kaplan-Meier analysis were used as
indicated for analyses performed on the patient cohort. Univariate
and multivariate analyses were performed using a Cox proportional
hazard regression model. P<0.05 was considered to indicate a
statistically significant difference. All analyses were performed
with R, v.3.4.2 software (https://www.r-project.org).
Results
Sorafenib inhibits the production of
AREG, VEGF and inflammatory cytokines by HCC cells
In order to analyse the impact of sorafenib on AREG
and VEGF, two cell lines with different sensitivities to sorafenib
were exposed to a clinically relevant concentration of the drug (10
µM) for 18 h. The concentration of 10 µM was selected as it was
close to the median concentrations measured in the serum of HCC
patients by Abou-Alfa et al (19). The Huh7 cell line has been
previously shown to be sensitive to sorafenib, while Hep3B cells
were found to be resistant to sorafenib in terms of clonogenic
growth (15). Recently, the Huh7
and Hep3B cell lines were exposed to increasing concentrations of
sorafenib (0–20 µM) for 18 h, and a decrease in cell viability of
~10% was measured using the Trypan blue exclusion assay (9). This modest cytotoxic effect is
essentially accounted for by ferroptosis, a form of necrotic cell
death (20).
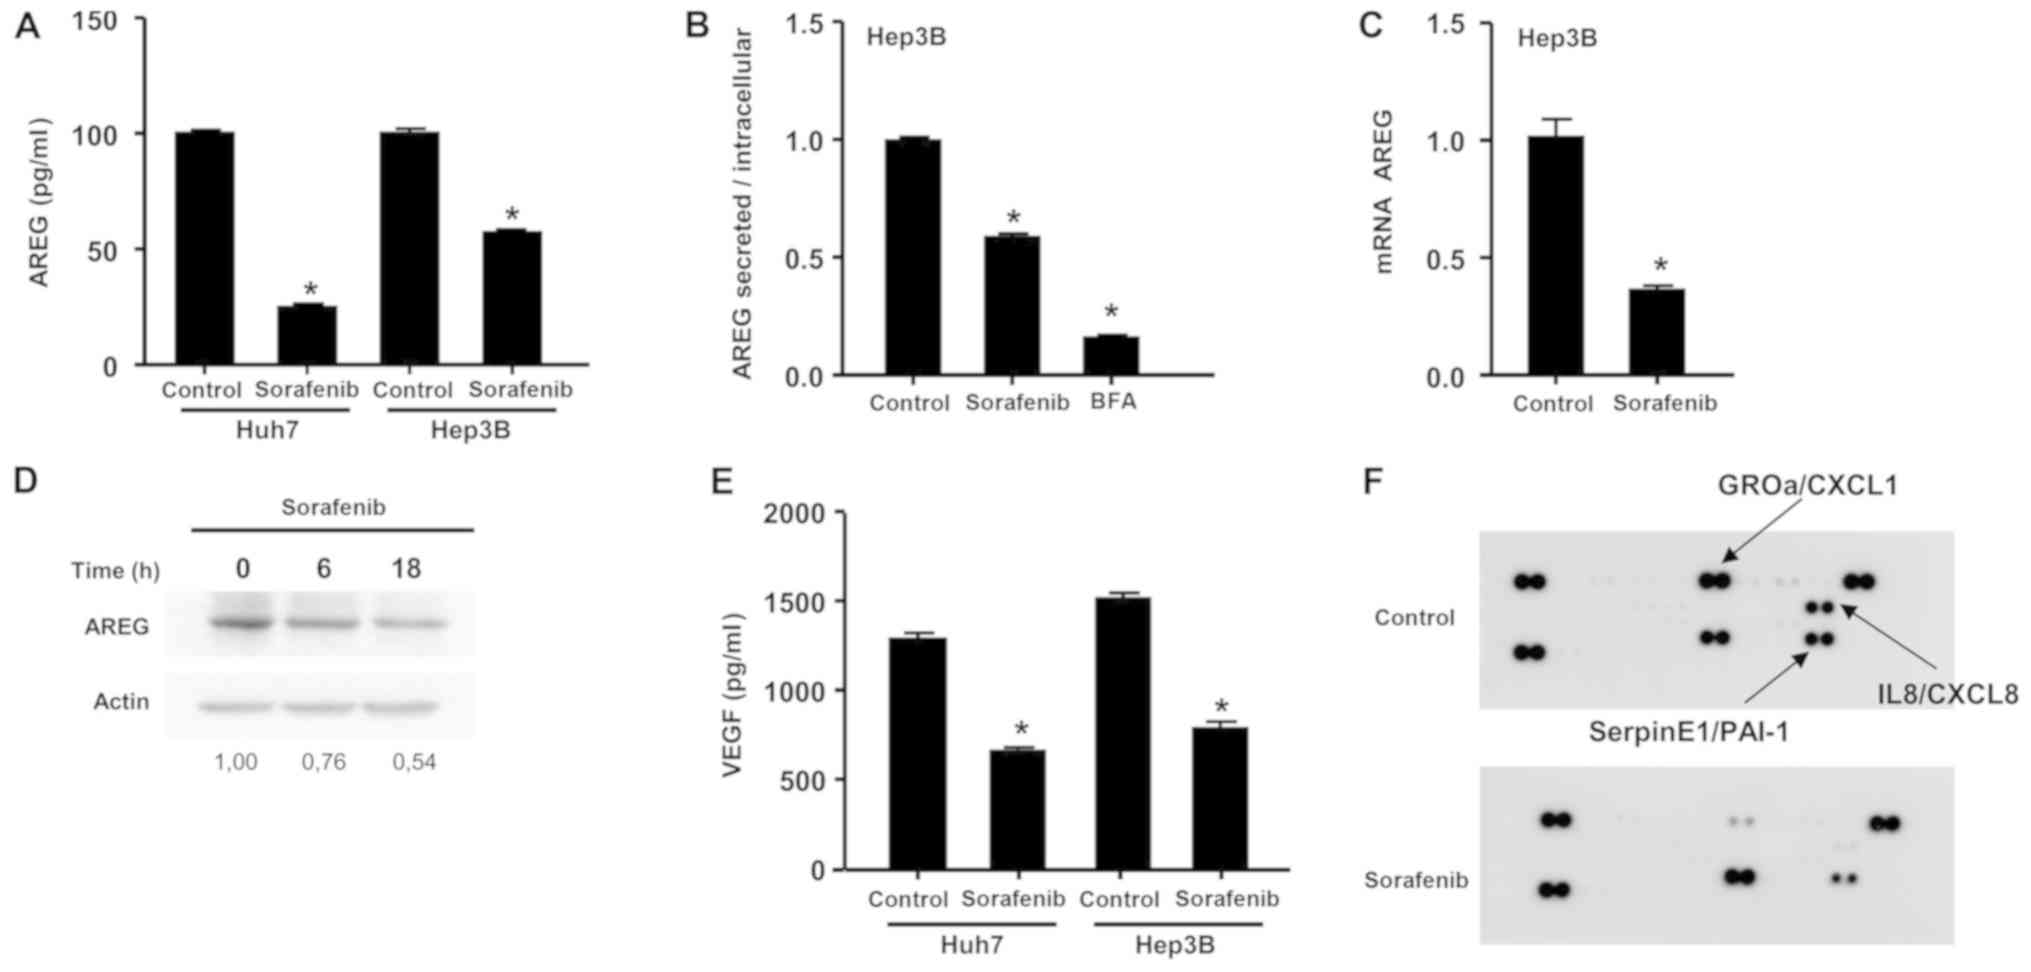
A significant decrease in AREG concentrations in the
cell supernatant was observed following sorafenib exposure in both
cell lines (Fig. 1A). In order to
examine the relative contribution of defective production vs.
secretion of AREG, the concentration of this protein was measured
in cell supernatants and cell lysates following exposure of Hep3B
cells to sorafenib. The secretion blocker brefeldin A was used as
positive control. The ratio of secreted to intracellular AREG was
calculated under control conditions or after exposure to sorafenib
or brefeldin A. Following sorafenib exposure, this ratio was
calculated to be 0.60, suggesting that the inhibitory effect of
sorafenib on AREG resulted from both inhibition of AREG production
(60%) and inhibition of AREG secretion (40%) (Fig. 1B). In order to confirm the effect of
sorafenib on AREG production, the effect of sorafenib on
AREG mRNA levels was examined and AREG protein levels were
determined by western blot analysis using Hep3B cells. An
inhibition of 65% in AREG mRNA expression was observed
following exposure to sorafenib (Fig.
1C). A decrease of ~50% in AREG protein levels was measured by
western blot analysis (Fig. 1D). A
significant decrease of VEGF levels in the cell supernatant was
also observed following sorafenib exposure in both cell lines
(Fig. 1E). Finally, in order to
explore the effect of sorafenib on several cytokines, a cytokine
array was performed. Inhibition of three cytokines, namely CXCL1,
IL8 and SERPIN E1, was observed (Fig.
1F). Sorafenib exerted an inhibitory effect on AREG, VEGF and
cytokine expression in vitro at the transcriptional and
post-transcriptional level, suggesting that sorafenib induced a
broad inhibition of bioactive protein production.
Prognostic role of AFP, AREG and VEGF
in HCC patients prior to sorafenib treatment
The clinical characteristics of the patients are
summarized in Table I and are also
detailed in a previous study (21).
The median OS assessed by the Kaplan-Meier method was 23.6 months
for all 55 patients enrolled in this study. AFP concentrations were
determined in the serum samples of 38 patients among the cohort of
55 patients, and the concentrations in 19 patients were
undetectable (<10 ng/ml). By contrast, detectable concentrations
of AREG and VEGF were measured in the 55 patients of our cohort. In
order to evaluate the prognostic value of AFP, AREG and VEGF prior
to treatment, patients were separated according to their baseline
AFP, AREG and VEGF concentrations as below or above the median.
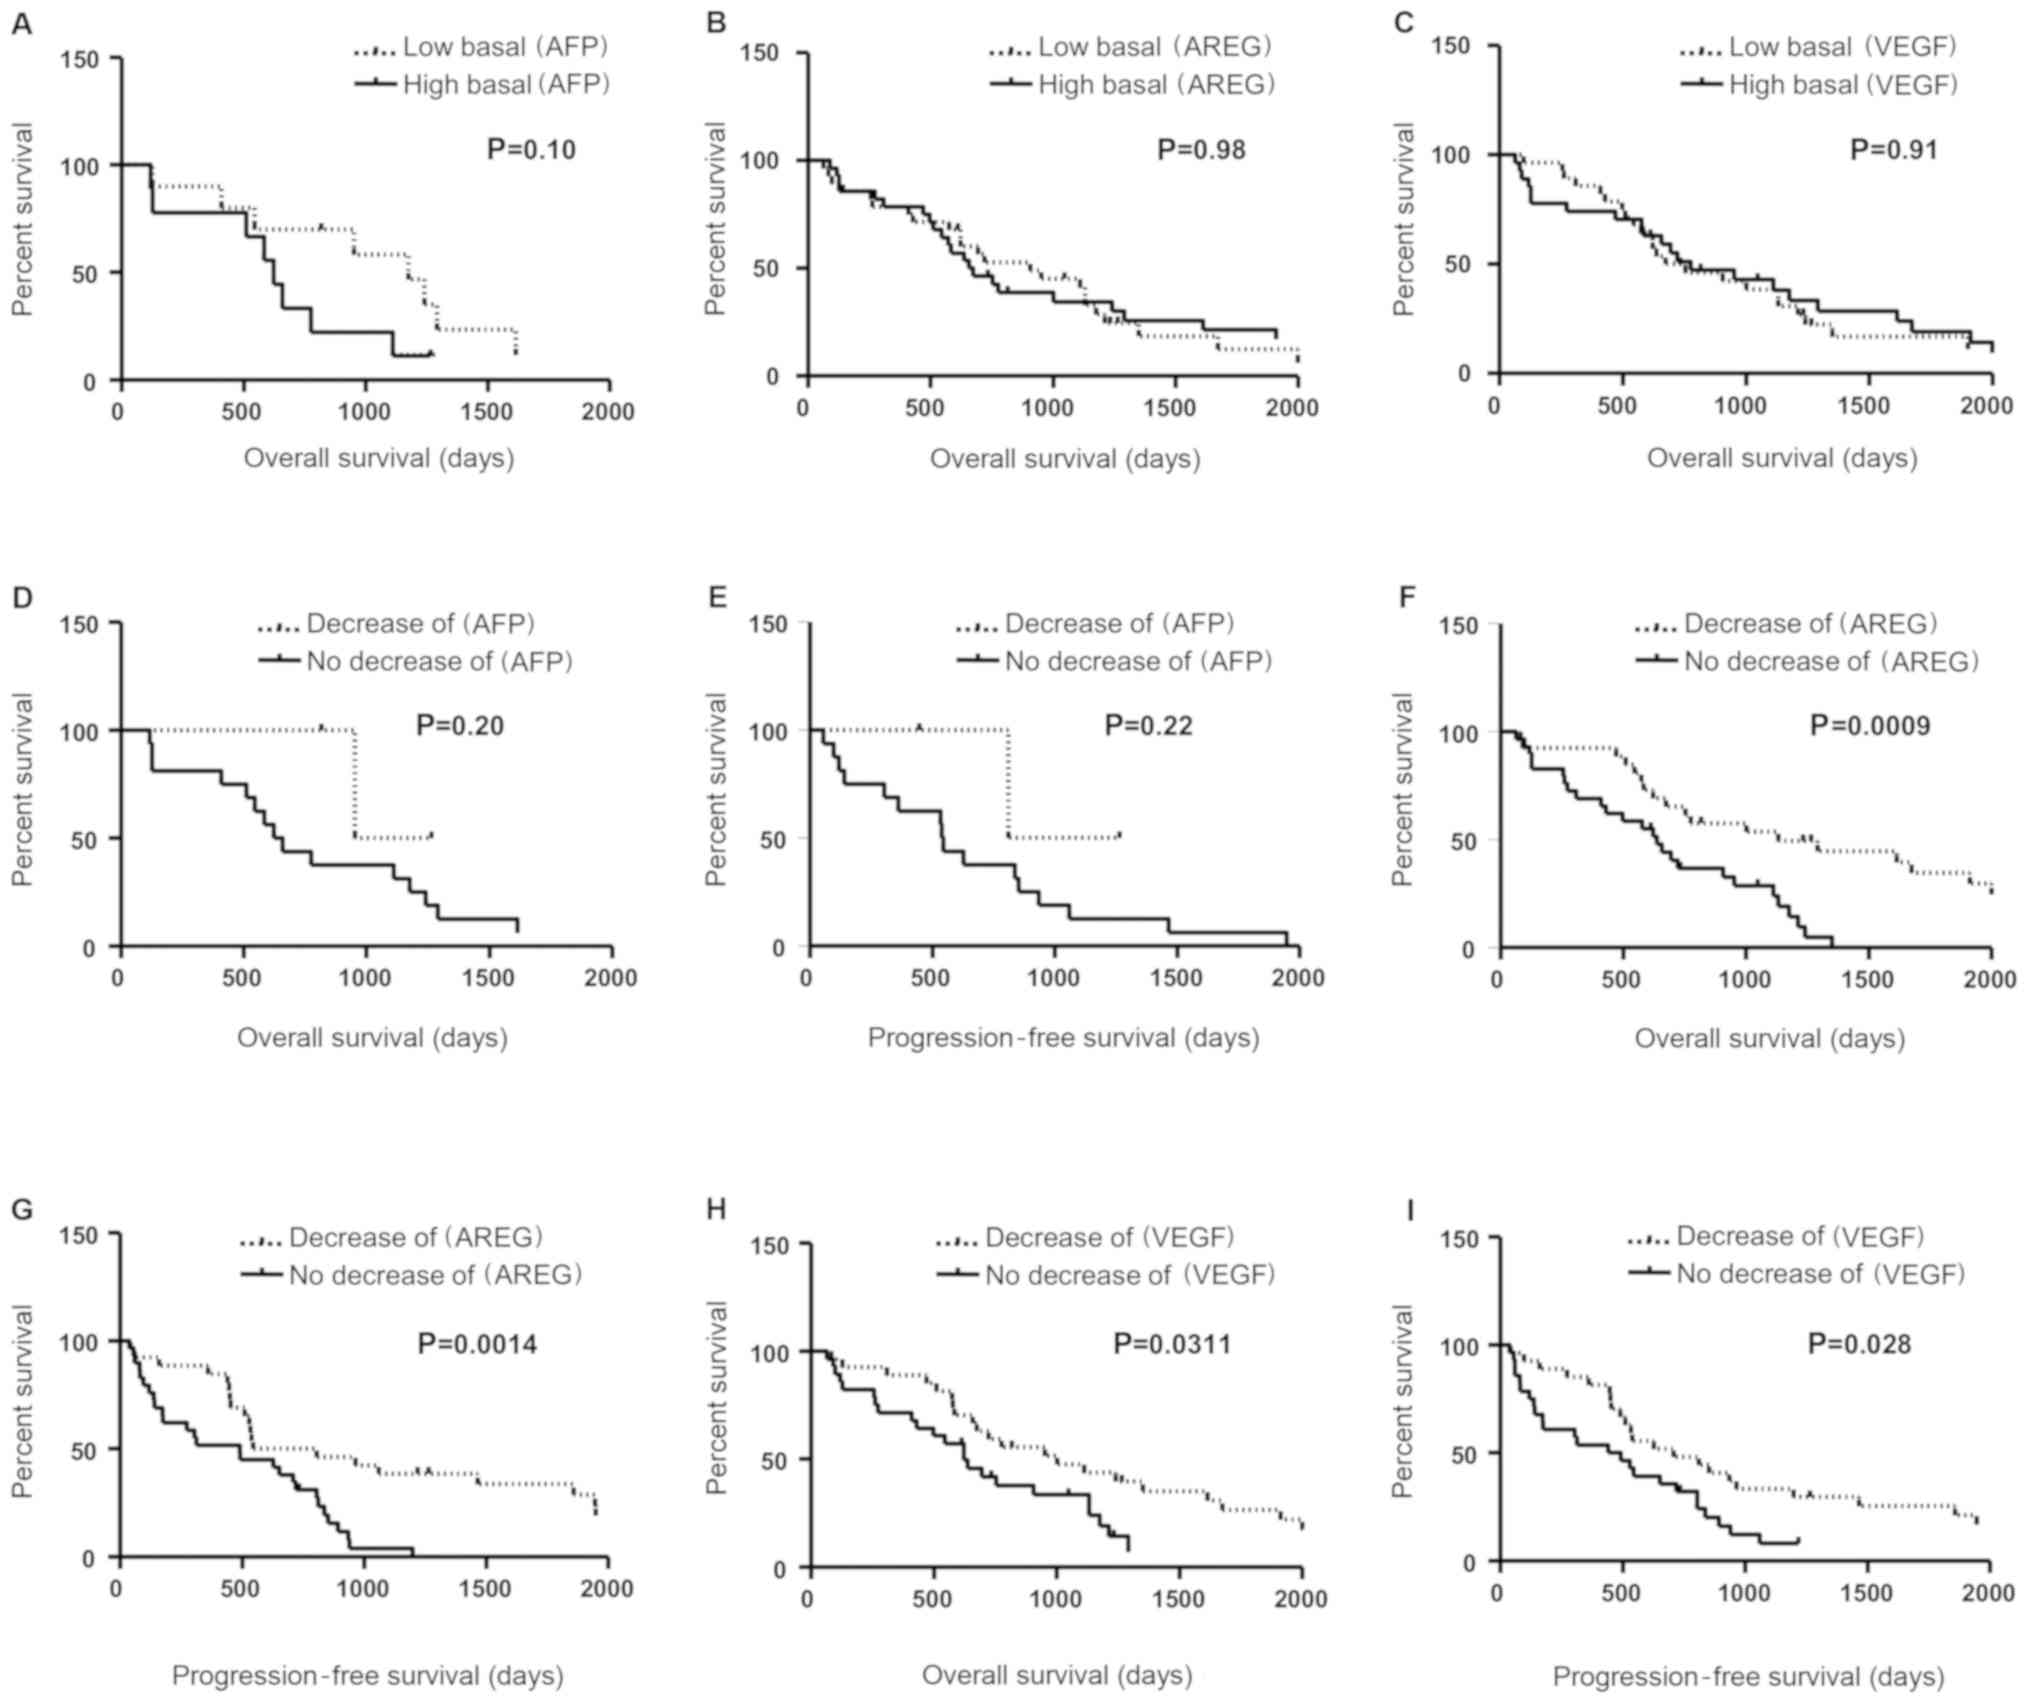
Kaplan-Meier analysis of OS demonstrated that baseline AFP, AREG or
VEGF concentrations prior to sorafenib therapy did not constitute a
discriminant prognostic biomarker (Fig.
2A-C; P=0.10, P=0.98 and P=0.91, respectively). A marked inter-
and intra-individual heterogeneity was observed between AFP, AREG
and VEGF levels before and after sorafenib treatment (data not
shown). Among the 19 patients with detectable concentrations of
AFP, pretreatment AFP concentrations were not significantly
different from the concentrations obtained after 2 weeks of
sorafenib therapy (2,581±1,053 vs. 1,935±740 ng/ml; P=0.62).
Similarly, among the 55 patients of the cohort, pretreatment AREG
and VEGF concentrations were not significantly different from the
concentrations obtained after 2 weeks of sorafenib therapy
(60.6±103 vs. 59.6±105 pg/ml, P=0.91 for AREG; and 516.6±51 vs.
495.0±43 pg/ml, P=0.75 for VEGF).
 | Table I.Summary of the clinical
characteristics of the patients. |
Table I.
Summary of the clinical
characteristics of the patients.
|
Characteristics | HCC patients
(n=55) |
|---|
| Age (years,
median) | 61 |
| Sex
(male/female) | 40/15 |
| Child-Pugh
class |
|
| 0 | 12 |
| A | 41 |
| B | 2 |
| Main aetiology of
cirrhosis |
|
|
Alcohol | 4 |
|
NASH | 11 |
|
Virus | 21 |
|
Mixed | 4 |
|
Unknown | 10 |
Prognostic role of a decrease in serum
AFP levels
Among the 19 patients with detectable concentrations
of AFP, we observed a significant decrease in AFP (>20%) after
sorafenib treatment in only 3 patients. OS and PFS were evaluated
in patients with a decrease in AFP levels vs. patients with no
decrease after 2 weeks of sorafenib therapy. The median survival
was 31.7 months in patients with a decrease in AFP (n=3) vs. 21.3
months in the group with no decrease in AFP levels (n=16). The
difference between these two groups was not significant (Fig. 2D, P=0.20). The PFS in patients with
a decrease in AFP was not significantly different from that in
patients with no decrease in AFP levels (Fig 2E, median 27 vs. 18 months;
P=0.22).
A decrease in serum AREG or VEGF
levels predicts sorafenib efficacy
In order to evaluate the prognostic value of
intra-individual variations of AREG and VEGF, patients were
classified according to their VEGF or AREG variations following
sorafenib therapy. No significant difference was observed between
these groups (presented in Table
II for AREG and Table III for
VEGF). OS and PFS were evaluated in patients with a decrease in one
of these biomarkers (>5%) vs. patients with no decrease, after 2
weeks of sorafenib therapy. The median survival was 38.9 months in
patients with a decrease in AREG (n=26) vs. 15.8 months in the
group with no decrease in AREG (n=29). The difference between these
two groups was statistically significant (Fig. 2F; P=0.0009). A statistically
significant difference in PFS was also observed between these two
groups (Fig. 2G, median 46.9 vs.
21.1 months; P=0.0014). Interestingly, the group of patients with
no decrease in AREG was composed of 1 patient with a stable level
of AREG and 28 patients with an increase in AREG levels of at least
20% after 15 days of sorafenib treatment. Therefore, as shown in
Fig. 2F and G, an increase in AREG
levels was correlated with a poor prognosis.
| Table II.Summary of the clinical
characteristics of the patients categorized according to their
variation in serum levels of AREG after 14 days of sorafenib
treatment. |
Table II.
Summary of the clinical
characteristics of the patients categorized according to their
variation in serum levels of AREG after 14 days of sorafenib
treatment.
|
Characteristics | Decrease of AREG
(n=29) | Decrease of AREG
(n=26) | P-value |
|---|
| Age (years,
median) | 61 | 61 | 0.97a |
| Sex
(male/female) | 20/9 | 20/6 | 0.72b |
| Child-Pugh
class |
|
| 0.35c |
| 0 | 6 | 6 |
|
| A | 23 | 18 |
|
| B | 0 | 2 |
|
| Main aetiology of
cirrhosis |
|
| 0.16c |
|
Alcohol | 0 | 4 |
|
|
NASH | 6 | 5 |
|
|
Virus | 11 | 10 |
|
|
Mixed | 3 | 1 |
|
|
Unknown | 6 | 4 |
|
| Table III.Summary of the clinical
characteristics of patients categorized according to their
variation in serum levels of VEGF after 14 days of sorafenib
treatment. |
Table III.
Summary of the clinical
characteristics of patients categorized according to their
variation in serum levels of VEGF after 14 days of sorafenib
treatment.
|
Characteristics | No decrease of VEGF
(n=32) | Decrease of VEGF
(n=23) | P-value |
|---|
| Age (years,
median) | 61 | 62 | 0.76a |
| Sex
(male/female) | 21/11 | 19/4 | 0.22b |
| Child-Pugh
class |
|
| 0.77c |
| 0 | 6 | 6 |
|
| A | 25 | 16 |
|
| B | 1 | 1 |
|
| Main aetiology of
cirrhosis |
|
| 0.73c |
|
Alcohol | 2 | 2 |
|
|
NASH | 6 | 5 |
|
|
Virus | 13 | 8 |
|
|
Mixed | 1 | 3 |
|
|
Unknown | 7 | 3 |
|
For VEGF, the median survival was 27.2 months in
patients with a decrease in VEGF (n=23) vs. 22.2 months in the
group with no decrease in VEGF (n=32). A significant difference in
OS was observed between these two groups (Fig. 2H; P=0.0311). A significant
difference was also observed in PFS (Fig. 2I, median 20.9 vs. 16.9 months;
P=0.028). The prognostic value of each clinicopathological factor,
including AREG decrease, VEGF decrease, age, sex, Child-Pugh score
and cirrhosis aetiology, was evaluated by univariate and
multivariate analysis for OS (Table
IV). Univariate analysis indicated that a decrease in AREG
levels was significantly associated with OS (HR=0.341; P=0.002).
Further multivariate analysis demonstrated that a decrease in AREG
levels could be considered as an independent prognostic biomarker
for OS (HR=0.208; P=0.00034; 95% CI: 0.173–0.673).
| Table IV.Univariate and multivariate analyses
of overall survival in HCC patients. |
Table IV.
Univariate and multivariate analyses
of overall survival in HCC patients.
|
| Univariate
analysis | Multivariate
analysis |
|---|
|
|
|
|
|---|
| Variables | HR 95% | CI | P-value | HR | 95% CI | P-value |
|---|
| Age (years) | 1.013 | 0.989–1.038 | 0.291 | 1.006 | 0.978–1.035 | 0.683 |
| Sex (male) | 1.323 | 0.690–2.538 | 0.399 | 1.342 | 0.642–2.807 | 0.434 |
| Child-Pugh A | 1.162 | 0.556–2.427 | 0.690 | 0.423 | 0.061–2.938 | 0.384 |
| Child-Pugh B | 7.968 | 1.565–40.560 | 0.012 | 6.681 | 0.494–90.398 | 0.153 |
| Cirrhosis | 1.170 | 0.453–3.017 | 0.746 | 1.295 | 0.109–15.351 | 0.838 |
| Aetiology of
cirrhosis |
|
Alcohol | 3.287 | 0.834–12.948 | 0.089 | 8.405 | 1.606–43.997 | 0.012 |
|
Virus | 1.318 | 0.481–3.610 | 0.592 | 1.583 | 0.478–5.239 | 0.452 |
|
NASH | 0.700 | 0.231–2.124 | 0.529 | 1.008 | 0.255–3.990 | 0.991 |
|
Mixed | 1.913 | 0.507–7.223 | 0.339 | NA | NA | NA |
| AREG decrease | 0.341 | 0.173–0.673 | 0.002 | 0.208 | 0.088–0.491 |
0.0003 |
| VEGF decrease | 0.583 | 0.312–1.092 | 0.092 | 0.720 | 0.360–1.438 | 0.352 |
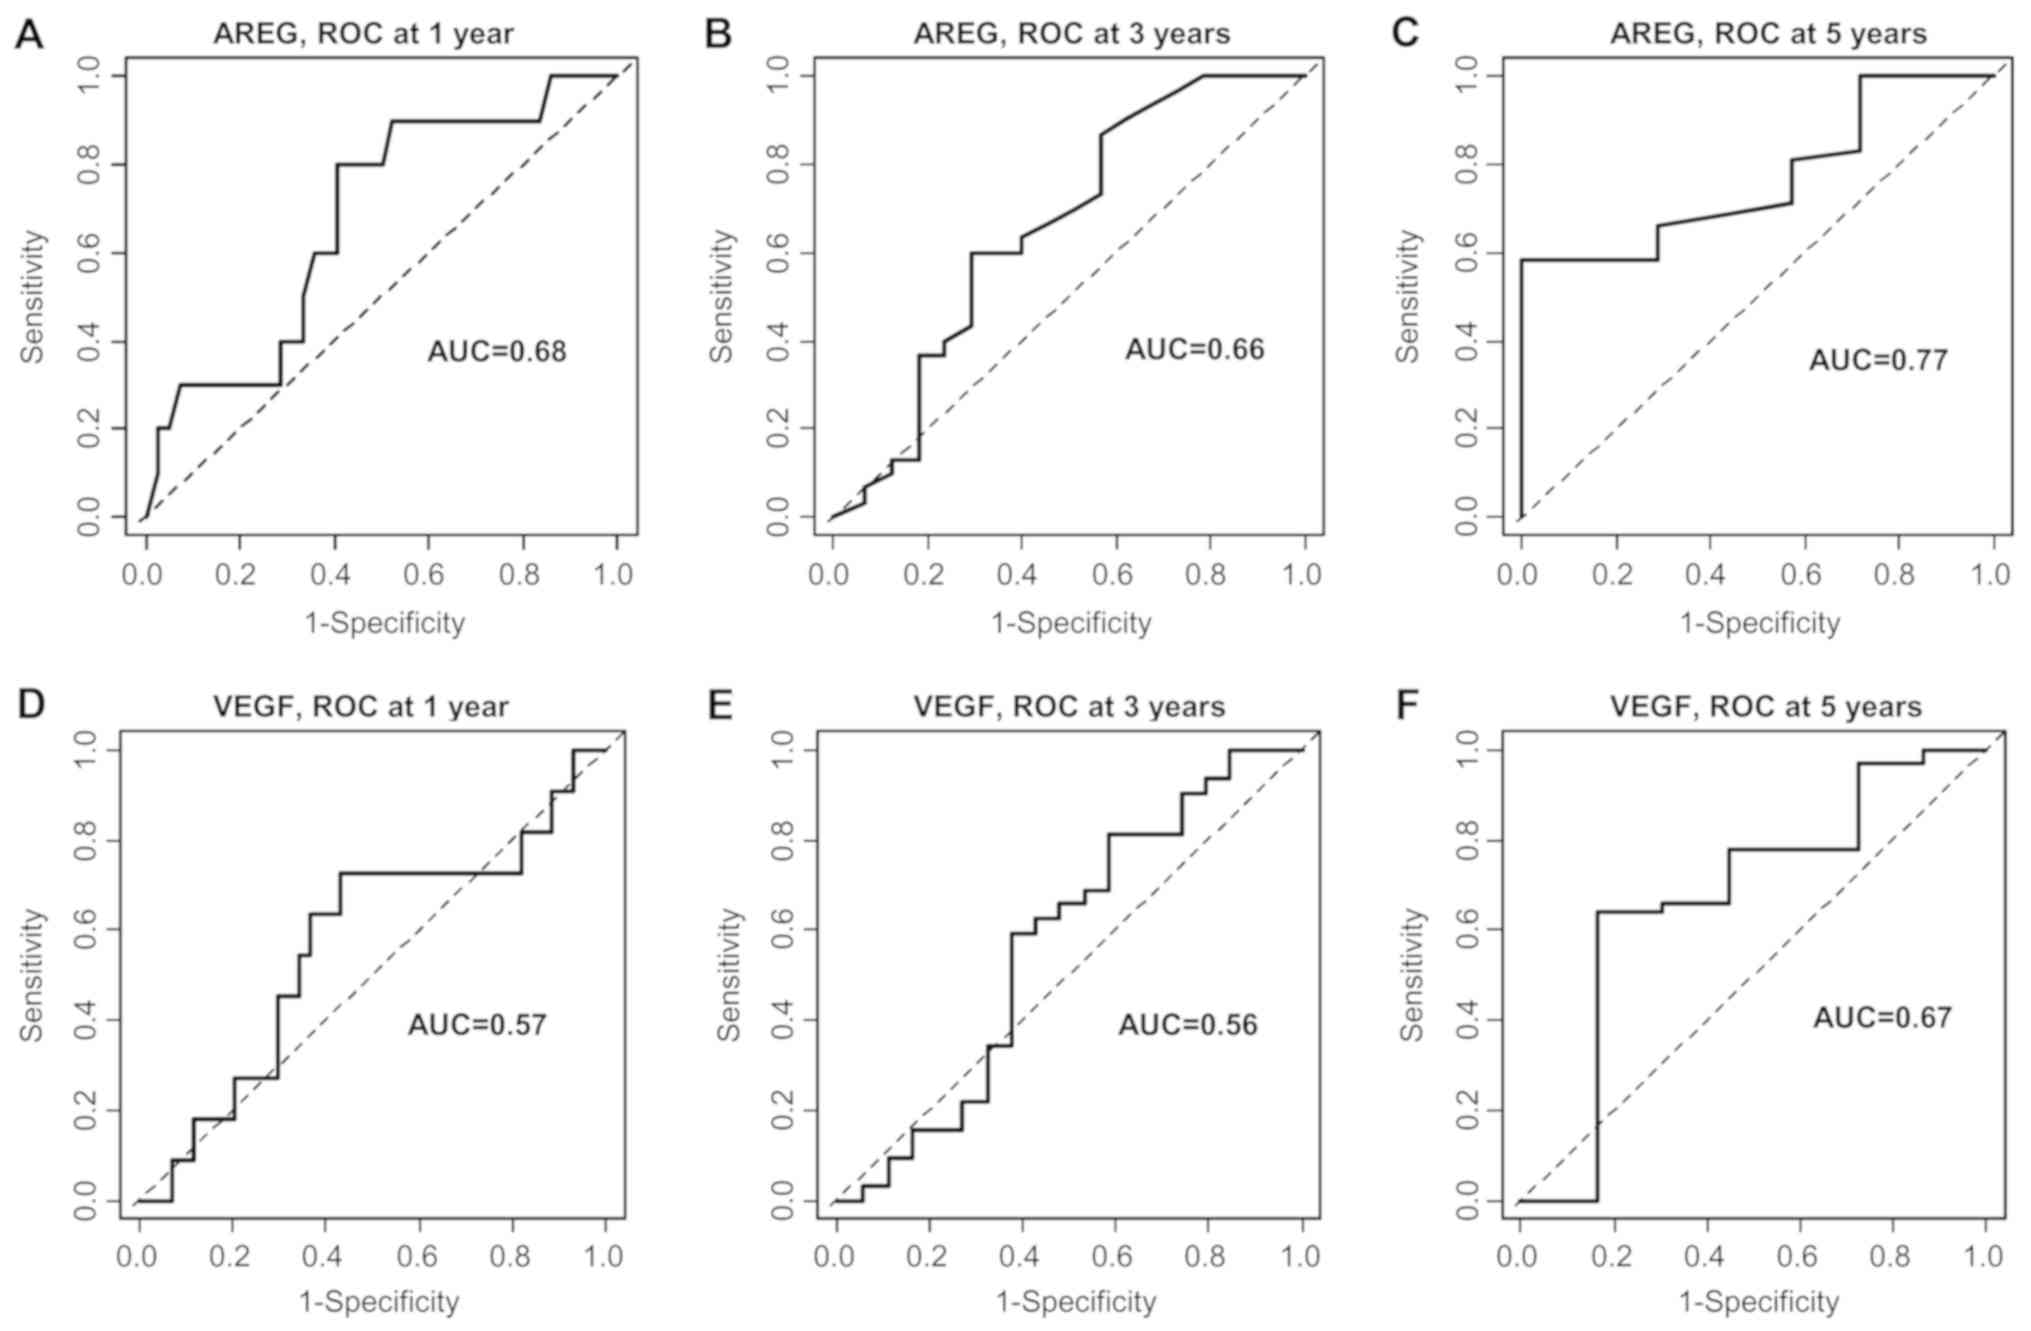
In order to confirm these results, the clinical
usefulness of a decrease in AREG or VEGF for prediction of OS
status at 1, 3 and 5 years was evaluated by time-dependent ROC
curve analyses. A decrease in AREG was predictive for OS at 5
years, with an area under the curve (AUC) of 0.77. The AUC was 0.68
at 1 year. For VEGF, AUCs of 0.67 and 0.57 were obtained for OS at
5 years and at 1 year, respectively (Fig. 3).
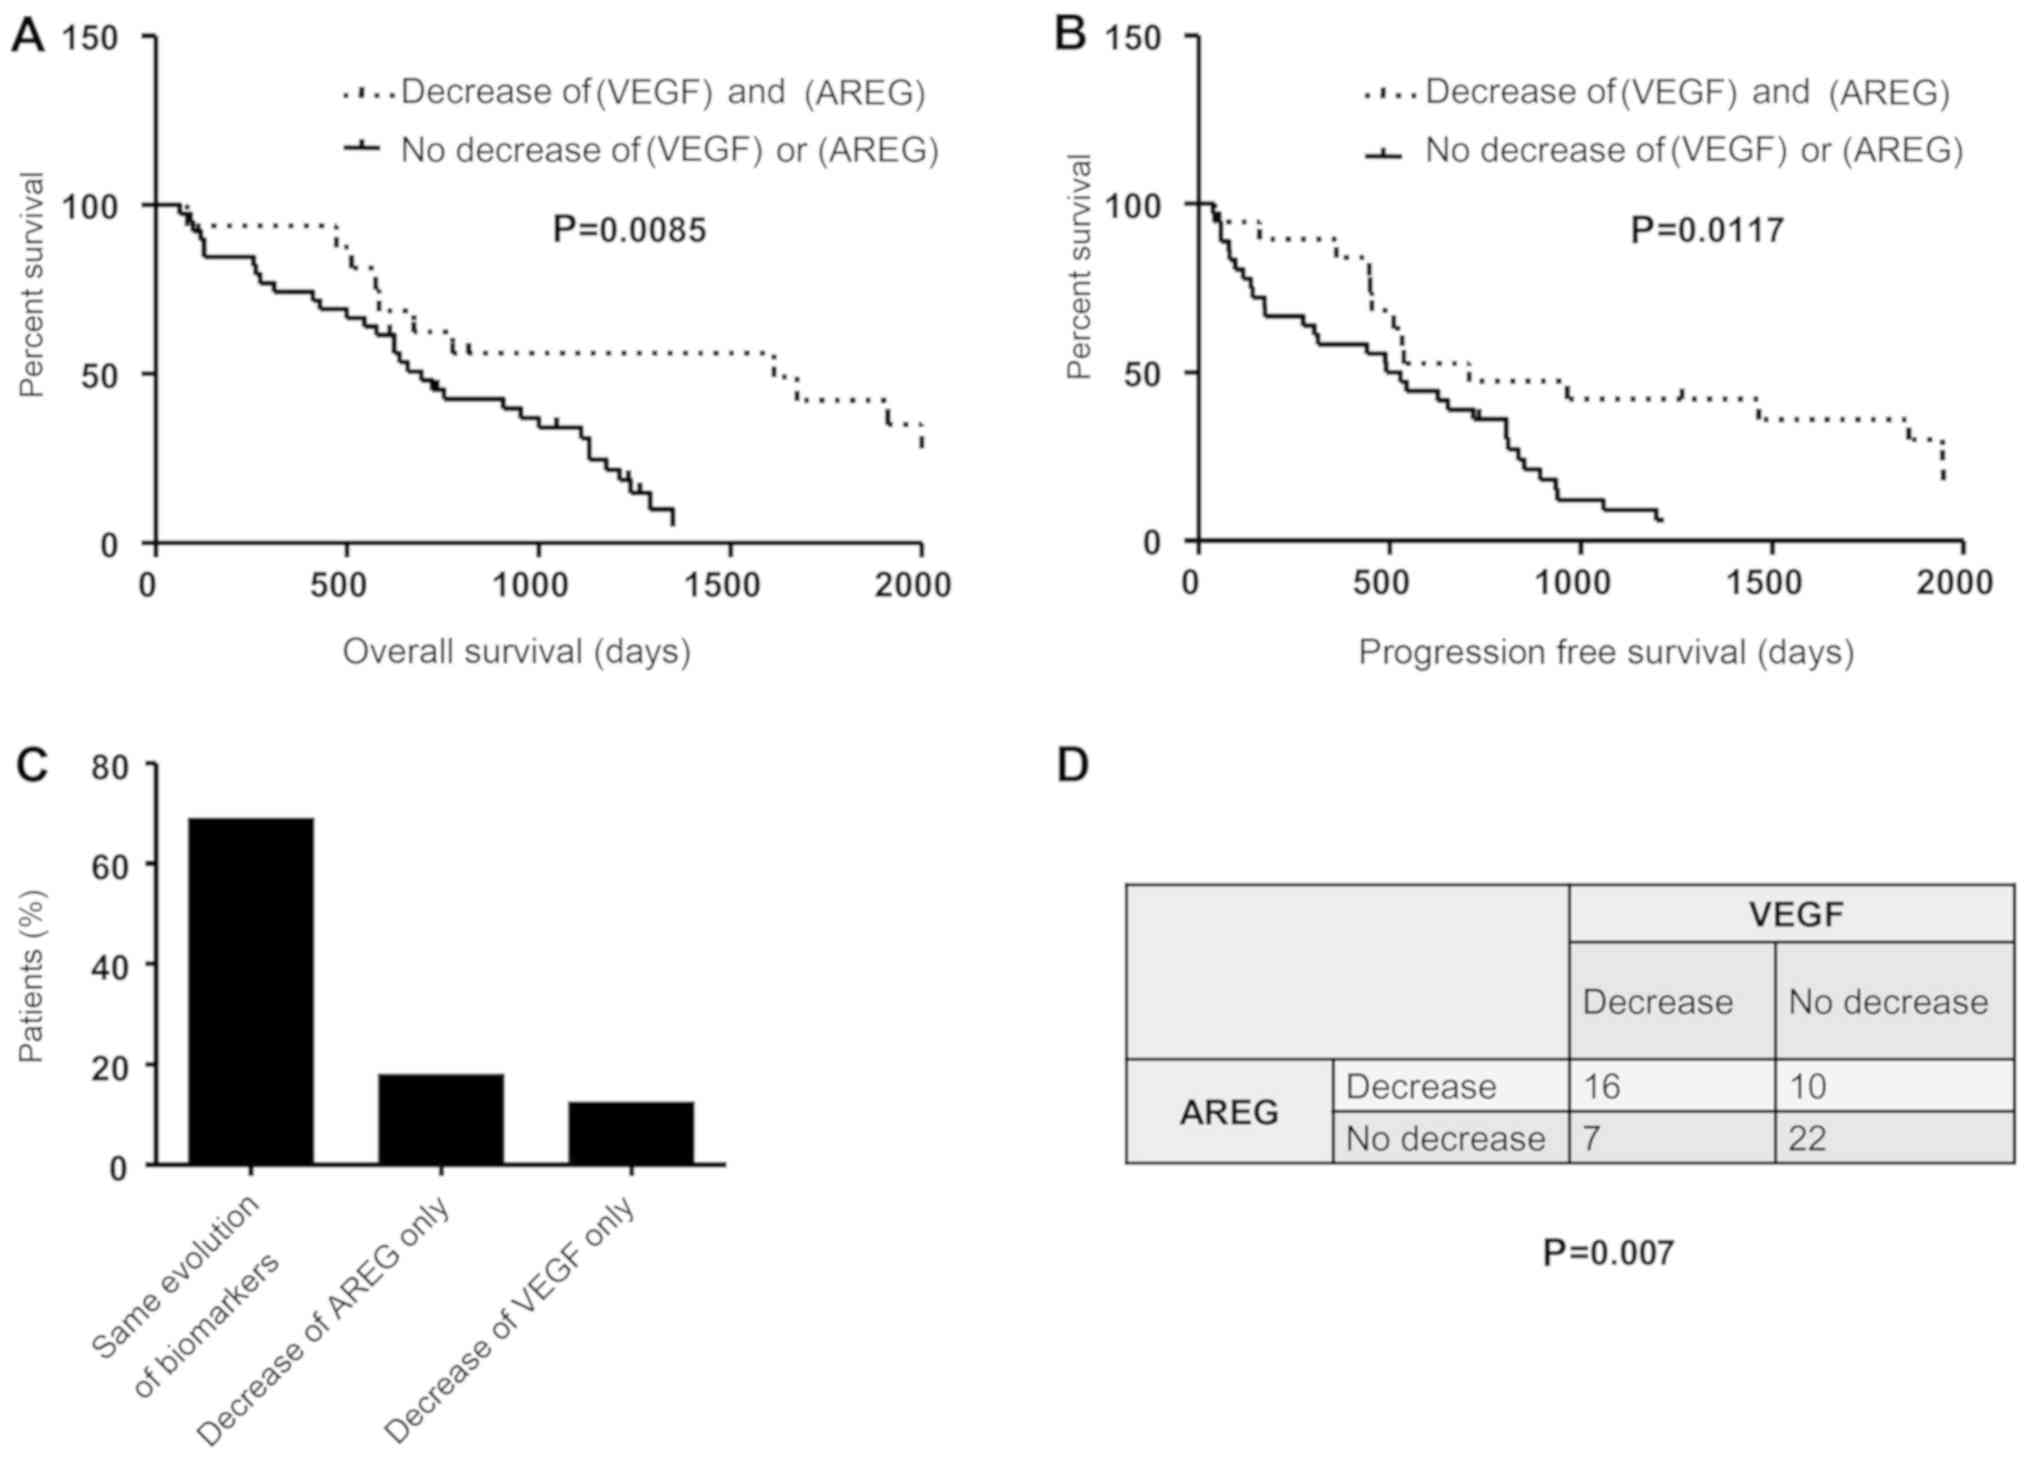
The regulation of AREG and VEGF by
sorafenib is potentially mediated via a common pathway
To investigate the hypothesis of a common pathway
regulating AREG and VEGF, the prognostic value of variations of
both AREG and VEGF were evaluated. The median OS assessed by the
Kaplan-Meier method in patients with a decrease in both AREG and
VEGF was 40.5 vs. 21.9 months in the group with an increase or
discordant results for these two markers (Fig. 4A; P=0.0085). A significant
difference was also observed in PFS (median 23.6 vs. 17 months,
P=0.017; Fig. 4B). These results
suggest that the combination of these two biomarkers was not more
discriminant in terms of prognosis compared with each biomarker
alone. The variations of these biomarkers were compared in each
patient. Interestingly, the two markers varied in the same
direction (decrease or increase) in 69% of the patients (n=38)
(Fig. 4C). A Chi-squared test
revealed that the variations of these two biomarkers were dependent
(Fig. 4D; P=0.007), suggesting that
AREG and VEGF are regulated by sorafenib via a common
mechanism.
Discussion
The present study demonstrated that sorafenib
decreased AREG, VEGF and cytokine levels in HCC cells at the
transcriptional and post-transcriptional levels. These results
suggest that sorafenib induced an inhibition of the production of
biologically active proteins, in accordance with our recent study
highlighting a global inhibitory effect of sorafenib on protein
biosynthesis (9). This previous
study was performed in vitro and, therefore, did not explore
the consequences of this inhibition in a clinical setting. In the
present study, a decrease in serum AREG and VEGF levels was
identified as a potential biomarker of sorafenib efficacy in HCC
patients.
Sorafenib is the standard of care for the medical
treatment of advanced-stage HCC, but there is a lack of biomarkers
to evaluate its effectiveness. AFP is the serum biomarker most
commonly used by clinicians to evaluate sorafenib efficacy. It was
previously reported that a decrease of 20% in the serum levels of
AFP measured during the first 8 weeks of sorafenib treatment was
associated with better OS, while imaging was not predictive in this
context (8). However, a significant
decrease in serum AFP levels following sorafenib treatment is
observed in only ~18% of the patients (8). In our cohort, we observed such a
decrease in only 3 of 38 patients. Due to the small number of
patients, a decrease in serum levels of AFP was not found to be
associated with a statistically significant improvement in OS or
PFS in our cohort (Fig. 2D and E,
P=0.20 and P=0.22, respectively). These results confirm that the
clinical value of AFP is limited to a small number of patients.
In the present study, a decrease in serum AREG or
VEGF levels after only 15 days of sorafenib treatment was shown to
predict sorafenib efficacy. In particular, Kaplan-Meier analyses
revealed that a decrease in serum AREG or VEGF levels after 2 weeks
of sorafenib treatment was associated with a significantly better
OS and PFS. A difference was observed for VEGF and AREG in the
multivariate analysis. A decrease in AREG, but not in VEGF, was a
significant prognostic biomarker for OS. This difference was also
observed with the ROC curve analyses. A decrease in AREG was
predictive of OS at 5 years with an AUC of 0.77, whereas the AUC
was 0.67 for VEGF. Based on these results, we propose that a
decrease in both serum VEGF and AREG levels may be considered as a
prognostic biomarker, but it is likely that the decrease in serum
AREG levels is a better biomarker in this context. Unlike AFP, AREG
and VEGF can be detected in the serum of all HCC patients. The
finding that their early decrease after sorafenib treatment was
correlated with the efficacy of sorafenib may be of interest to
clinicians. These biomarkers may help clinicians identify patients
for whom sorafenib is not expected to be beneficial and to consider
therapeutic alternatives at an earlier stage. A prospective study
comparing the prognostic role of AFP, AREG and VEGF on a larger
number of patients is required to confirm these results.
Previous studies have investigated the prognostic
role of AREG and VEGF in HCC patients. Our conclusions regarding
VEGF confirm and extend those of another previous study by Tsuchiya
et al. In complete agreement with our results, these authors
observed that a decrease in VEGF after 8 weeks of sorafenib therapy
was associated with better OS on Kaplan-Meier analysis (22). Three studies have already explored
AREG as a potential prognostic biomarker in HCC patients, two of
which evaluated AREG at baseline and one after sorafenib treatment.
In agreement with the two studies evaluating AREG at baseline, we
did not observe any correlation between pretreatment AREG levels
and prognosis (23,24). In the present study, although large
fluctuations were observed in AREG concentrations in patients,
pretreatment AREG concentrations were not statistically
significantly different from the concentrations measured after 2
weeks of sorafenib therapy (Fig.
2A). This may be explained by the marked inter- and
intra-individual heterogeneity in AREG levels before and after
sorafenib treatment. The study by Blivet-Van Eggelpöel et al
is the only study to have investigated variations in serum AREG
levels before and after sorafenib therapy. In contrast with the
present study, these authors demonstrated that serum AREG levels
were markedly increased in HCC patients treated with sorafenib
compared with baseline levels. This study was conducted on an
exploratory cohort of only 14 patients, and did not evaluate the
prognostic role of AREG (16).
Blivet-Van Eggelpöel et al observed an increase in serum
concentrations of AREG in 10 out of 14 patients receiving
sorafenib. The authors indicated that ‘no complete or partial
tumour response to sorafenib was present in these patients. Six of
them showed disease progression’. Our results are consistent with
theirs, indicating that an increase in AREG is not in favour of
sorafenib efficacy. In the Blivet-Van Eggelpöel et al study,
serum AREG levels were measured after 28–458 days of sorafenib
treatment. Unfortunately, the study did not provide additional
dosages beyond 15 days. A complementary study would be of
interest.
Apart from the prognostic role of AREG and VEGF in
HCC patients treated by sorafenib, the results of the present study
suggest that these two biomarkers are regulated by a common
mechanism, as a statistically significant correlation was observed
between variations in serum AREG and VEGF levels. The
concentrations of these two biomarkers varied in the same direction
(increase or decrease) in 69% of the patients after sorafenib
therapy. The combination of these two biomarkers was not a more
discriminant predictive factor of the efficacy of sorafenib
compared with each biomarker alone. This potential common pathway
of regulation of AREG and VEGF may be associated with the effect of
sorafenib on tumour proteostasis. Sorafenib alters tumour
proteostasis in a complex way and via several different mechanisms
(9,20,25–27).
Tumour proteostasis includes emerging drivers of tumour progression
and important determinants of clinical efficacy of cancer therapy
(28). Our recent findings indicate
that tumour markers, such as AFP, are regulated by tumour
proteostasis (29,30). It is hypothesized that the decrease
of AREG and VEGF production may be associated with
sorafenib-induced alteration of proteostasis. A thorough
exploration of the role of proteostasis as a regulator of tumour
response to sorafenib is required.
In conclusion, the present study demonstrated a
broad inhibitory effect of sorafenib on the production of bioactive
proteins, such as AREG and VEGF, in vitro. The decrease of
serum AREG or VEGF levels was found to be associated with better OS
and PFS in HCC patients. At this stage, the role of sorafenib in
these decreases remains to be formally demonstrated. However, this
effect may be associated with the ability of sorafenib to alter
proteostasis, as shown in a previous study. The present study
identified two biomarkers of sorafenib efficacy, detectable early
in all HCC patients, and potentially of interest to clinicians.
Acknowledgements
The authors would like to thank Momar Diouf for his
help with ROC curve analyses.
Funding
The authors are grateful for the financial support
received from ‘Ligue Contre le Cancer’, ‘Conseil Régional des Hauts
de France (Soramix)’, ‘Comité de la Somme’ and ‘CHU Amiens’.
Availability of data and materials
The datasets used and/or analysed during the present
study are available from the corresponding author on reasonable
request.
Authors' contributions
RC, AG and CS contributed to the study design. CG,
SB, ZS, CL and CS collected the data. CL, JCB, CG, CF, RC, AG and
CS analyzed and interpreted the data. CS drafted the manuscript.
SB, ZS, JCB, RC and AG revised the manuscript. All authors have
read and approved the final version of the manuscript.
Ethics approval and consent to
participate
This study was conducted in compliance with French
legislation and the Declaration of Helsinki regarding ethical
principles for medical research involving human subjects. The
‘Comité de Protection des Personnes d'Ile de France’ Institutional
Review Board approved the study protocol (Nu-AT140). All patients
provided their written informed consent. No samples were obtained
from patients who were minors or physically or mentally unable to
understand and provide their consent to the use of serum
samples.
Patient consent for publication
Not applicable.
Competing interests
JCB received honoraria as a clinical consultant from
Bayer. Bayer was not involved in this study. Bayer did not provide
any reagent and did not contribute to the design of this study. All
other authors declare that they have no competing interests.
Glossary
Abbreviations
Abbreviations:
|
AREG
|
amphiregulin
|
|
EGFR
|
epidermal growth factor receptor
|
|
OS
|
overall survival
|
|
PFS
|
progression-free survival
|
|
UPR
|
unfolded protein response
|
|
VEGF
|
vascular endothelial growth factor
|
References
|
1
|
European Association for the Study of the
Liver. Electronic address: easloffice@easloffice.eu, European
Association for the Study of the Liver: EASL Clinical Practice
Guidelines: Management of hepatocellular carcinoma. J Hepatol.
69:182–236. 2018. View Article : Google Scholar : PubMed/NCBI
|
|
2
|
Davis MI, Hunt JP, Herrgard S, Ciceri P,
Wodicka LM, Pallares G, Hocker M, Treiber DK and Zarrinkar PP:
Comprehensive analysis of kinase inhibitor selectivity. Nat
Biotechnol. 29:1046–1051. 2011. View
Article : Google Scholar : PubMed/NCBI
|
|
3
|
Llovet JM, Ricci S, Mazzaferro V, Hilgard
P, Gane E, Blanc JF, de Oliveira AC, Santoro A, Raoul JL, Forner A,
et al: SHARP Investigators Study Group: Sorafenib in advanced
hepatocellular carcinoma. N Engl J Med. 359:378–390. 2008.
View Article : Google Scholar : PubMed/NCBI
|
|
4
|
Cheng AL, Kang YK, Chen Z, Tsao CJ, Qin S,
Kim JS, Luo R, Feng J, Ye S, Yang TS, et al: Efficacy and safety of
sorafenib in patients in the Asia-Pacific region with advanced
hepatocellular carcinoma: A phase III randomised, double-blind,
placebo-controlled trial. Lancet Oncol. 10:25–34. 2009. View Article : Google Scholar : PubMed/NCBI
|
|
5
|
Kudo M, Finn RS, Qin S, Han KH, Ikeda K,
Piscaglia F, Baron A, Park JW, Han G, Jassem J, et al: Lenvatinib
versus sorafenib in first-line treatment of patients with
unresectable hepatocellular carcinoma: A randomised phase 3
non-inferiority trial. Lancet. 391:1163–1173. 2018. View Article : Google Scholar : PubMed/NCBI
|
|
6
|
Sauzay C, Petit A, Bourgeois AM, Barbare
JC, Chauffert B, Galmiche A and Houessinon A: Alpha-foetoprotein
(AFP): A multi-purpose marker in hepatocellular carcinoma. Clin
Chim Acta. 463:39–44. 2016. View Article : Google Scholar : PubMed/NCBI
|
|
7
|
Bruix J, Reig M and Sherman M:
Evidence-based diagnosis, staging, and treatment of patients with
hepatocellular carcinoma. Gastroenterology. 150:835–853. 2016.
View Article : Google Scholar : PubMed/NCBI
|
|
8
|
Personeni N, Bozzarelli S, Pressiani T,
Rimassa L, Tronconi MC, Sclafani F, Carnaghi C, Pedicini V,
Giordano L and Santoro A: Usefulness of alpha-fetoprotein response
in patients treated with sorafenib for advanced hepatocellular
carcinoma. J Hepatol. 57:101–107. 2012. View Article : Google Scholar : PubMed/NCBI
|
|
9
|
Sauzay C, Louandre C, Bodeau S, Anglade F,
Godin C, Saidak Z, Fontaine JX, Usureau C, Martin N, Molinie R, et
al: Protein biosynthesis, a target of sorafenib, interferes with
the unfolded protein response (UPR) and ferroptosis in
hepatocellular carcinoma cells. Oncotarget. 9:8400–8414. 2018.
View Article : Google Scholar : PubMed/NCBI
|
|
10
|
Manié SN, Lebeau J and Chevet E: Cellular
mechanisms of endoplasmic reticulum stress signaling in health and
disease. 3. Orchestrating the unfolded protein response in
oncogenesis: An update. Am J Physiol Cell Physiol. 307:C901–C907.
2014. View Article : Google Scholar : PubMed/NCBI
|
|
11
|
Raskopf E, Vogt A, Sauerbruch T and
Schmitz V: siRNA targeting VEGF inhibits hepatocellular carcinoma
growth and tumor angiogenesis in vivo. J Hepatol. 49:977–984. 2008.
View Article : Google Scholar : PubMed/NCBI
|
|
12
|
Goel HL and Mercurio AM: VEGF targets the
tumour cell. Nat Rev Cancer. 13:871–882. 2013. View Article : Google Scholar : PubMed/NCBI
|
|
13
|
Castillo J, Erroba E, Perugorría MJ,
Santamaría M, Lee DC, Prieto J, Avila MA and Berasain C:
Amphiregulin contributes to the transformed phenotype of human
hepatocellular carcinoma cells. Cancer Res. 66:6129–6138. 2006.
View Article : Google Scholar : PubMed/NCBI
|
|
14
|
Xu Q, Chiao P and Sun Y: Amphiregulin in
Cancer: New Insights for Translational Medicine. Trends Cancer.
2:111–113. 2016. View Article : Google Scholar : PubMed/NCBI
|
|
15
|
Ezzoukhry Z, Louandre C, Trécherel E,
Godin C, Chauffert B, Dupont S, Diouf M, Barbare JC, Mazière JC and
Galmiche A: EGFR activation is a potential determinant of primary
resistance of hepatocellular carcinoma cells to sorafenib. Int J
Cancer. 131:2961–2969. 2012. View Article : Google Scholar : PubMed/NCBI
|
|
16
|
Blivet-Van Eggelpoël MJ, Chettouh H,
Fartoux L, Aoudjehane L, Barbu V, Rey C, Priam S, Housset C,
Rosmorduc O and Desbois-Mouthon C: Epidermal growth factor receptor
and HER-3 restrict cell response to sorafenib in hepatocellular
carcinoma cells. J Hepatol. 57:108–115. 2012. View Article : Google Scholar : PubMed/NCBI
|
|
17
|
Livak KJ and Schmittgen TD: Analysis of
relative gene expression data using real-time quantitative PCR and
the 2(-Delta Delta C(T)) Method. Methods. 25:402–408. 2001.
View Article : Google Scholar : PubMed/NCBI
|
|
18
|
Lencioni R: New data supporting modified
RECIST (mRECIST) for Hepatocellular Carcinoma. Clin Cancer Res.
19:1312–1314. 2013. View Article : Google Scholar : PubMed/NCBI
|
|
19
|
Abou-Alfa GK, Schwartz L, Ricci S, Amadori
D, Santoro A, Figer A, De Greve J, Douillard JY, Lathia C, Schwartz
B, et al: Phase II study of sorafenib in patients with advanced
hepatocellular carcinoma. J Clin Oncol. 24:4293–4300. 2006.
View Article : Google Scholar : PubMed/NCBI
|
|
20
|
Louandre C, Ezzoukhry Z, Godin C, Barbare
JC, Mazière JC, Chauffert B and Galmiche A: Iron-dependent cell
death of hepatocellular carcinoma cells exposed to sorafenib. Int J
Cancer. 133:1732–1742. 2013. View Article : Google Scholar : PubMed/NCBI
|
|
21
|
Houessinon A, François C, Sauzay C,
Louandre C, Mongelard G, Godin C, Bodeau S, Takahashi S, Saidak Z,
Gutierrez L, et al: Metallothionein-1 as a biomarker of altered
redox metabolism in hepatocellular carcinoma cells exposed to
sorafenib. Mol Cancer. 15:382016. View Article : Google Scholar : PubMed/NCBI
|
|
22
|
Tsuchiya K, Asahina Y, Matsuda S, Muraoka
M, Nakata T, Suzuki Y, Tamaki N, Yasui Y, Suzuki S, Hosokawa T, et
al: Changes in plasma vascular endothelial growth factor at 8 weeks
after sorafenib administration as predictors of survival for
advanced hepato-cellular carcinoma. Cancer. 120:229–237. 2014.
View Article : Google Scholar : PubMed/NCBI
|
|
23
|
Han SX, Bai E, Jin GH, He CC, Guo XJ, Wang
LJ, Li M, Ying X and Zhu Q: Expression and clinical significance of
YAP TAZ, and AREG in hepatocellular carcinoma. J Immunol Res 2014.
2613652014.
|
|
24
|
Zhu AX, Kang YK, Rosmorduc O, Evans TR,
Santoro A, Ross P, Gane E, Vogel A, Jeffers M, Meinhardt G, et al:
Biomarker analyses of clinical outcomes in patients with advanced
hepatocellular carcinoma treated with sorafenib with or without
erlotinib in the SEARCH trial. Clin Cancer Res. 22:4870–4879. 2016.
View Article : Google Scholar : PubMed/NCBI
|
|
25
|
Booth L, Shuch B, Albers T, Roberts JL,
Tavallai M, Proniuk S, Zukiwski A, Wang D, Chen CS, Bottaro D, et
al: Multi-kinase inhibitors can associate with heat shock proteins
through their NH2-termini by which they suppress chaperone
function. Oncotarget. 7:12975–12996. 2016. View Article : Google Scholar : PubMed/NCBI
|
|
26
|
Shi YH, Ding ZB, Zhou J, Hui B, Shi GM, Ke
AW, Wang XY, Dai Z, Peng YF, Gu CY, et al: Targeting autophagy
enhances sorafenib lethality for hepatocellular carcinoma via ER
stress-related apoptosis. Autophagy. 7:1159–1172. 2011. View Article : Google Scholar : PubMed/NCBI
|
|
27
|
Shimizu S, Takehara T, Hikita H, Kodama T,
Tsunematsu H, Miyagi T, Hosui A, Ishida H, Tatsumi T, Kanto T, et
al: Inhibition of autophagy potentiates the antitumor effect of the
multikinase inhibitor sorafenib in hepatocellular carcinoma. Int J
Cancer. 131:548–557. 2012. View Article : Google Scholar : PubMed/NCBI
|
|
28
|
Hetz C, Chevet E and Oakes SA: Erratum:
Proteostasis control by the unfolded protein response. Nat Cell
Biol. 17:829–838. 2015. View Article : Google Scholar : PubMed/NCBI
|
|
29
|
Galmiche A, Sauzay C, Houessinon A,
Chauffert B and Pluquet O: Probing Tumour Proteostasis and the UPR
with Serum Markers. Trends Cancer. 2:219–221. 2016. View Article : Google Scholar : PubMed/NCBI
|
|
30
|
Houessinon A, Gicquel A, Bochereau F,
Louandre C, Nyga R, Godin C, Degonville J, Fournier E, Saidak Z,
Drullion C, et al: Alpha-fetoprotein is a biomarker of unfolded
protein response and altered proteostasis in hepatocellular
carcinoma cells exposed to sorafenib. Cancer Lett. 370:242–249.
2016. View Article : Google Scholar : PubMed/NCBI
|