Introduction
Liver cancer is one of the most common types of
cancer, and is associated with a high mortality rate. With
>500,000 fatalities worldwide in 2012, liver cancer is ranked as
the third leading cause of cancer-related mortality (1,2).
Clinically, liver cancer is characterized by its high invasiveness
and incidence of recurrence. To date, numerous studies have been
performed to improve the diagnosis and prognosis of liver cancer
(3). Although multiple therapeutic
strategies are currently available, the outcome of patients with
liver cancer remains unsatisfactory (4). The poor clinical outcomes are mainly
attributed to the high frequency of tumor recurrence and distant
metastasis following curative surgical resection (5). Thus, identifying new molecular
targets, as well as elucidating the mechanism underlying liver
cancer progression, may improve available treatments and patient
outcomes.
Tropomodulin 3 (TMOD3) is a ~40 kDa protein that
binds the slow-growing ends of actin filaments and prevents
depolymerization from the pointed ends (6,7). A
previous study identified four TMOD isoforms in vertebrates
(8); however, TMOD3 is a ubiquitous
TMOD in non-erythroid cells, in which it regulates dynamic actin
processes, such as lamellipodia protrusion and cell motility
(9,10). By regulating actin dynamics in
different cells, TMOD3 is involved in facilitating various
processes, including determination of cell shape, cell migration
and muscle contraction. It has been reported that TMOD3 serves
different roles in different types of cells (11); however, the association between
TMOD3 levels and cell migration is controversial, and the role of
TMOD3 in epithelial cells in vivo remains elusive (12). In addition, it has been demonstrated
that deletion of TMOD3 in mice caused embryonic death at
E14.5-E18.5, indicating that TMOD3 may be a key factor in embryonic
development (13–15). Based on its biological function in
stem and progenitor cells, TMOD3 may play an important role in
cancer progression. However, the role of TMOD3 in the regulation of
liver cancer invasion and metastasis has not been fully
elucidated.
The aim of the present study was to investigate the
expression of TMOD3 in liver cancer tissues and cell lines and its
role in liver cancer cell proliferation, invasion and migration,
and elucidate the underlying mechanism, in order to determine
whether TMOD3 may serve as a candidate biomarker and treatment
target for liver cancer.
Materials and methods
Patients and samples
A total of 50 pairs of primary liver cancer (PLC)
and adjacent liver tissue specimens were randomly selected from
patients who had undergone hepatic resection at Xiangya Hospital
(Changsha, China) between January and December 2017. The detailed
clinicopathological data are presented in Table I. All cases were pathologically
diagnosed by two independent pathologists. Furthermore, 30 matched
fresh PLC tissues and adjacent non-tumor tissues were collected
between January and August 2018 for reverse
transcription-quantitative polymerase chain reaction (RT-qPCR) and
western blot analyses. All patients or their families provided
written informed consent regarding the use of their tissues for
research purposes. All the patients were followed up as suggested
in the REMARK guidelines (https://www.ncbi.nlm.nih.gov/pmc/articles/PMC2361579/).
All experiments using human materials were approved by the Ethics
Committee of Xiangya Hospital of Central South University
(Changsha, China).
 | Table I.Correlation between TMOD3 expression
and clinicopathological characteristics in patients with primary
liver cancer. |
Table I.
Correlation between TMOD3 expression
and clinicopathological characteristics in patients with primary
liver cancer.
|
| Tumor TMOD3
expression |
|
|---|
|
|
|
|
|---|
| Clinicopathological
characteristics | High (32) | Low (18) | P-value |
|---|
| Sex |
|
| 0.768 |
|
Male | 26 | 14 |
|
|
Female | 6 | 4 |
|
| Age, years |
|
| 0.700 |
|
≤60 | 23 | 12 |
|
|
>60 | 9 | 6 |
|
| Serum AFP,
ng/ml |
|
|
|
|
≤252 | 12 | 7 | 0.923 |
|
>252 | 20 | 11 |
|
| HBsAg |
|
| 0.885 |
|
Negative | 4 | 2 |
|
|
Positive | 28 | 16 |
|
| Liver
cirrhosis |
|
| 0.486 |
|
Absent | 12 | 5 |
|
|
Present | 20 | 13 |
|
| Tumor number |
|
| 0.022 |
|
Single | 9 | 11 |
|
|
Multiple | 23 | 7 |
|
| Tumor size, cm |
|
| 0.041 |
| ≤5 | 7 | 9 |
|
|
>5 | 25 | 9 |
|
| Edmondson
grade |
|
| 0.941 |
|
I–II | 21 | 12 |
|
|
III–IV | 11 | 6 |
|
| Microvascular
invasion |
|
| 0.020 |
|
Absent | 16 | 15 |
|
|
Present | 16 | 3 |
|
| BCLC stage |
|
| 0.026 |
|
0-A | 5 | 8 |
|
|
B-C | 27 | 10 |
|
RNA extraction and gene expression
analysis as determined by RT-qPCR analysis
Total RNA from fresh PLC, adjacent non-tumor tissues
and cell lines was extracted with TRIzol reagent (Invitrogen;
Thermo Fisher Scientific, Inc., Waltham, MA, USA) according to the
manufacturer's instructions. RNA quantity and quality were
evaluated using a Nanodrop spectrophotometer (Thermo Fisher
Scientific, Inc.). RNA was reverse-transcribed into cDNA by BeyoRT™
II First-Strand cDNA Synthesis kit (Beyotime Institute of
Biotechnology, Shanghai, China), and qPCR was conducted using
SYBR-Green Master Mix on the Applied Biosystems QuantStudio™ 3 and
5 Real-Time PCR System (Thermo Fisher Scientific, Inc.). The
primers were as follows: TMOD3 forward,
5′-TTCCGGCAGAAGAACCAGACATC-3′ and reverse,
5′-CAAGAATTGCTGCGAGGTCACAC-3′; GAPDH forward,
5′-GGCACCGTCAAGGCTGAGAAC-3′ and reverse,
5′-GGTGGCAGTGATGGCATGGAC-3′. Each sample was analyzed in triplicate
and the data were calculated using the 2−ΔΔCq
method.
Western blot analysis
Tissues or cells were dissolved using RIPA lysis
buffer supplemented with 1% phenylmethanesulfonyl fluoride. Protein
concentration was measured using a bicinchoninic acid protein assay
kit (Beyotime Institute of Biotechnology). Next, proteins were
separated by 1% SDS-PAGE and transferred onto polyvinylidene
difluoride membranes. Then, the membranes were blocked with 5%
skimmed milk and incubated with specific primary antibodies
overnight at 4°C. Following washing, the membranes were incubated
with the appropriate horseradish peroxidase-conjugated secondary
antibody at room temperature for 30 min and detected using an
enhanced chemiluminescence kit (Thermo Fisher Scientific, Inc.).
Antibodies against TMOD3 (cat. no. 70-ab4606-050) were obtained
from MultiScicences (Hangzhou, China). Antibodies against p-ERK
(cat. no. ab126455) and ERK (cat. no. ab17942) were obtained from
Abcam (Cambridge, MA, USA), and those against E-cadherin (cat. no.
sc-8426), vimentin (cat. no. sc-6260) and cyclin D1 (cat. no.
sc-246) were purchased from Santa Cruz Biotechnology, Inc. (Dallas,
TX, USA). Antibodies against matrix metalloproteinase (MMP)2 (cat.
no. AF0577) and MMP9 (cat. no. AF0220) were purchased from Affinity
Biosciences (Cincinnati, OH, USA). The β-actin antibody (cat. no.
TA-09) and corresponding secondary antibodies (cat. no. ZB-2305;
cat. no. ZB-2301) were purchased from Zhongshan Golden Bridge
Biotechnology (ZSGB; Beijing, China).
Immunohistochemistry (IHC)
All tissues were cut into 4-µm sections,
dewaxed in xylene and rehydrated in a graded ethanol series.
Following heating in a microwave for antigen retrieval (12 min in
sodium citrate buffer, pH 6), endogenous peroxidase was inactivated
with 0.3% H2O2 for 30 min and the sections
were incubated with 10% normal goat serum for 30 min. The TMOD3
antibody (1:100; MultiSciences) was applied overnight in a moist
chamber at 4°C, followed by incubation with the secondary antibody
(ZSGB) for 30 min. The antigen-antibody interactions were detected
by 3,3′-diaminobenzidine and counterstained with hematoxylin.
Tissue sections were dehydrated in graded ethanols and mounted.
The immunostained sections were independently
evaluated by two pathologists who were blinded to all patient
clinical data. The staining intensity and the percentage of protein
expression were assessed. The staining intensity of TMOD3 was
graded between 0 and 3 as follows: 0, negative; 1, weak; 2,
moderate; and 3, strong. The percentage of positive cells was
classified as 1 (0–25%), 2 (26–50%), 3 (51–75%) or 4 (>75%). The
final score was calculated by multiplying these two scores, and the
protein expression of TMOD3 in liver cancer specimens was divided
into high-expression (≥4) and low-expression (<4) groups for
further analysis.
Cell culture
The human liver cancer cell lines Hep3B, HepG2 and
PLC/PRF5 were purchased from the American Type Culture Collection
(Manassas, VA, USA). The MHCC97-H, MHCC97-L, HCCLM3 and Huh7 liver
cancer cell lines and the normal liver cell line L02 were obtained
from the Chinese Academy of Sciences (Shanghai, China). Cell
culture was conducted according to the manufacturer's instructions
and all the cell lines were cultured at 37°C in a humidified
atmosphere of 5% CO2.
Construction of stable cell lines
A human TMOD3 overexpression clone lentivirus, three
short hairpin RNA (shRNA) lentiviruses of TMOD3 and their control
vectors were purchased from Shanghai GenePharma Co., Ltd.
(Shanghai, China). The cells were cultured in 6-well plates prior
to transfection until reaching 80–90% confluence within 24 h. Then,
transfection was performed according to standard procedures.
Puromycin (2 µg/ml) was used to select stable clones. The
three candidate hairpin sequences for TMOD3 were as follows:
5′-CCTTGGGAATCTGTCAGAAACAG-3′ (shRNA-1);
5′-AAAGAAGCATTGGAGCATAAAGA-3′ (shRNA-2);
5′-CCTCGCAGCAATTCTTGGGAGC-3′ (shRNA-3); The efficiency of TMOD3
overexpression and knockdown were assessed by RT-qPCR and western
blot analysis.
MTT assay and colony formation
assay
For the MTT assay, 5×10³ cells were
seeded into each well of 96-well plates (6 wells/group). The cells
were incubated for 0–7 days, then stained with MTT (Sigma-Aldrich;
Merck KGaA, Darmstadt, Germany), and the absorbance was measured at
570 nm. For colony formation, the cells were grown in 6-well plates
at a density of 5×10² cells/well and cultured for 14
days. Then, the number of colonies was counted following staining
with 1% crystal violet solution. All studies were conducted with 3
replicates.
Wound healing assay
The cells were seeded into 6-well plates at a
density of 1×10⁵ cells/well. When grown to 90%
confluence, the cells were incubated with mitomycin C (10
µg/ml) for 1 h at 37°C to suppress cell proliferation, and
the cells were then starved for 24 h in serum-free medium. A
10-µl pipette tip was used to create an artificial wound.
The results were observed and photographed every 12 h.
Transwell invasion assay
The cell invasion assay was performed in a 24-well
Transwell plate. Cells were incubated with mitomycin C (10
µg/ml) for 1 h at 37°C to suppress cell proliferation, then
1×10⁵ cells in 500 µl of serum-free medium were
placed into the upper chamber with Matrigel-coated membranes (BD
Biosciences, Franklin Lakes, NJ, USA). The lower chamber was filled
with 500 µl medium supplemented with 10% fetal bovine serum.
Following a 48-h incubation at 37°C, the cells that remained in the
upper chambers were removed and the cells that adhered to the lower
membranes were stained with 0.1% crystal violet solution. The
invading cells were counted in 5 random fields per well.
Immunofluorescence (IF)
The cells were seeded into 6-well plates with glass
coverslips for 24 h. Then, the cells were fixed in 4%
paraformaldehyde, permeabilized with 0.5% Triton X-100 and
incubated with phalloidin (Sigma-Aldrich; Merck KGaA) according to
the manufacturer's protocol. The coverslips were counterstained
with DAPI and the results were photographed under an inverted
microscope.
Statistical analysis
Statistical analysis was conducted using SPSS 18.0
(SPSS Inc., Chicago, IL, USA). All measurement data were expressed
as the mean ± standard deviation. Student's t-test or one-way
analysis of variance were used to test the statistical significance
of the differences between the groups, while proportional
comparisons were conducted via a Chi-squared test. P<0.05 was
considered to indicate a statistically significant difference.
Results
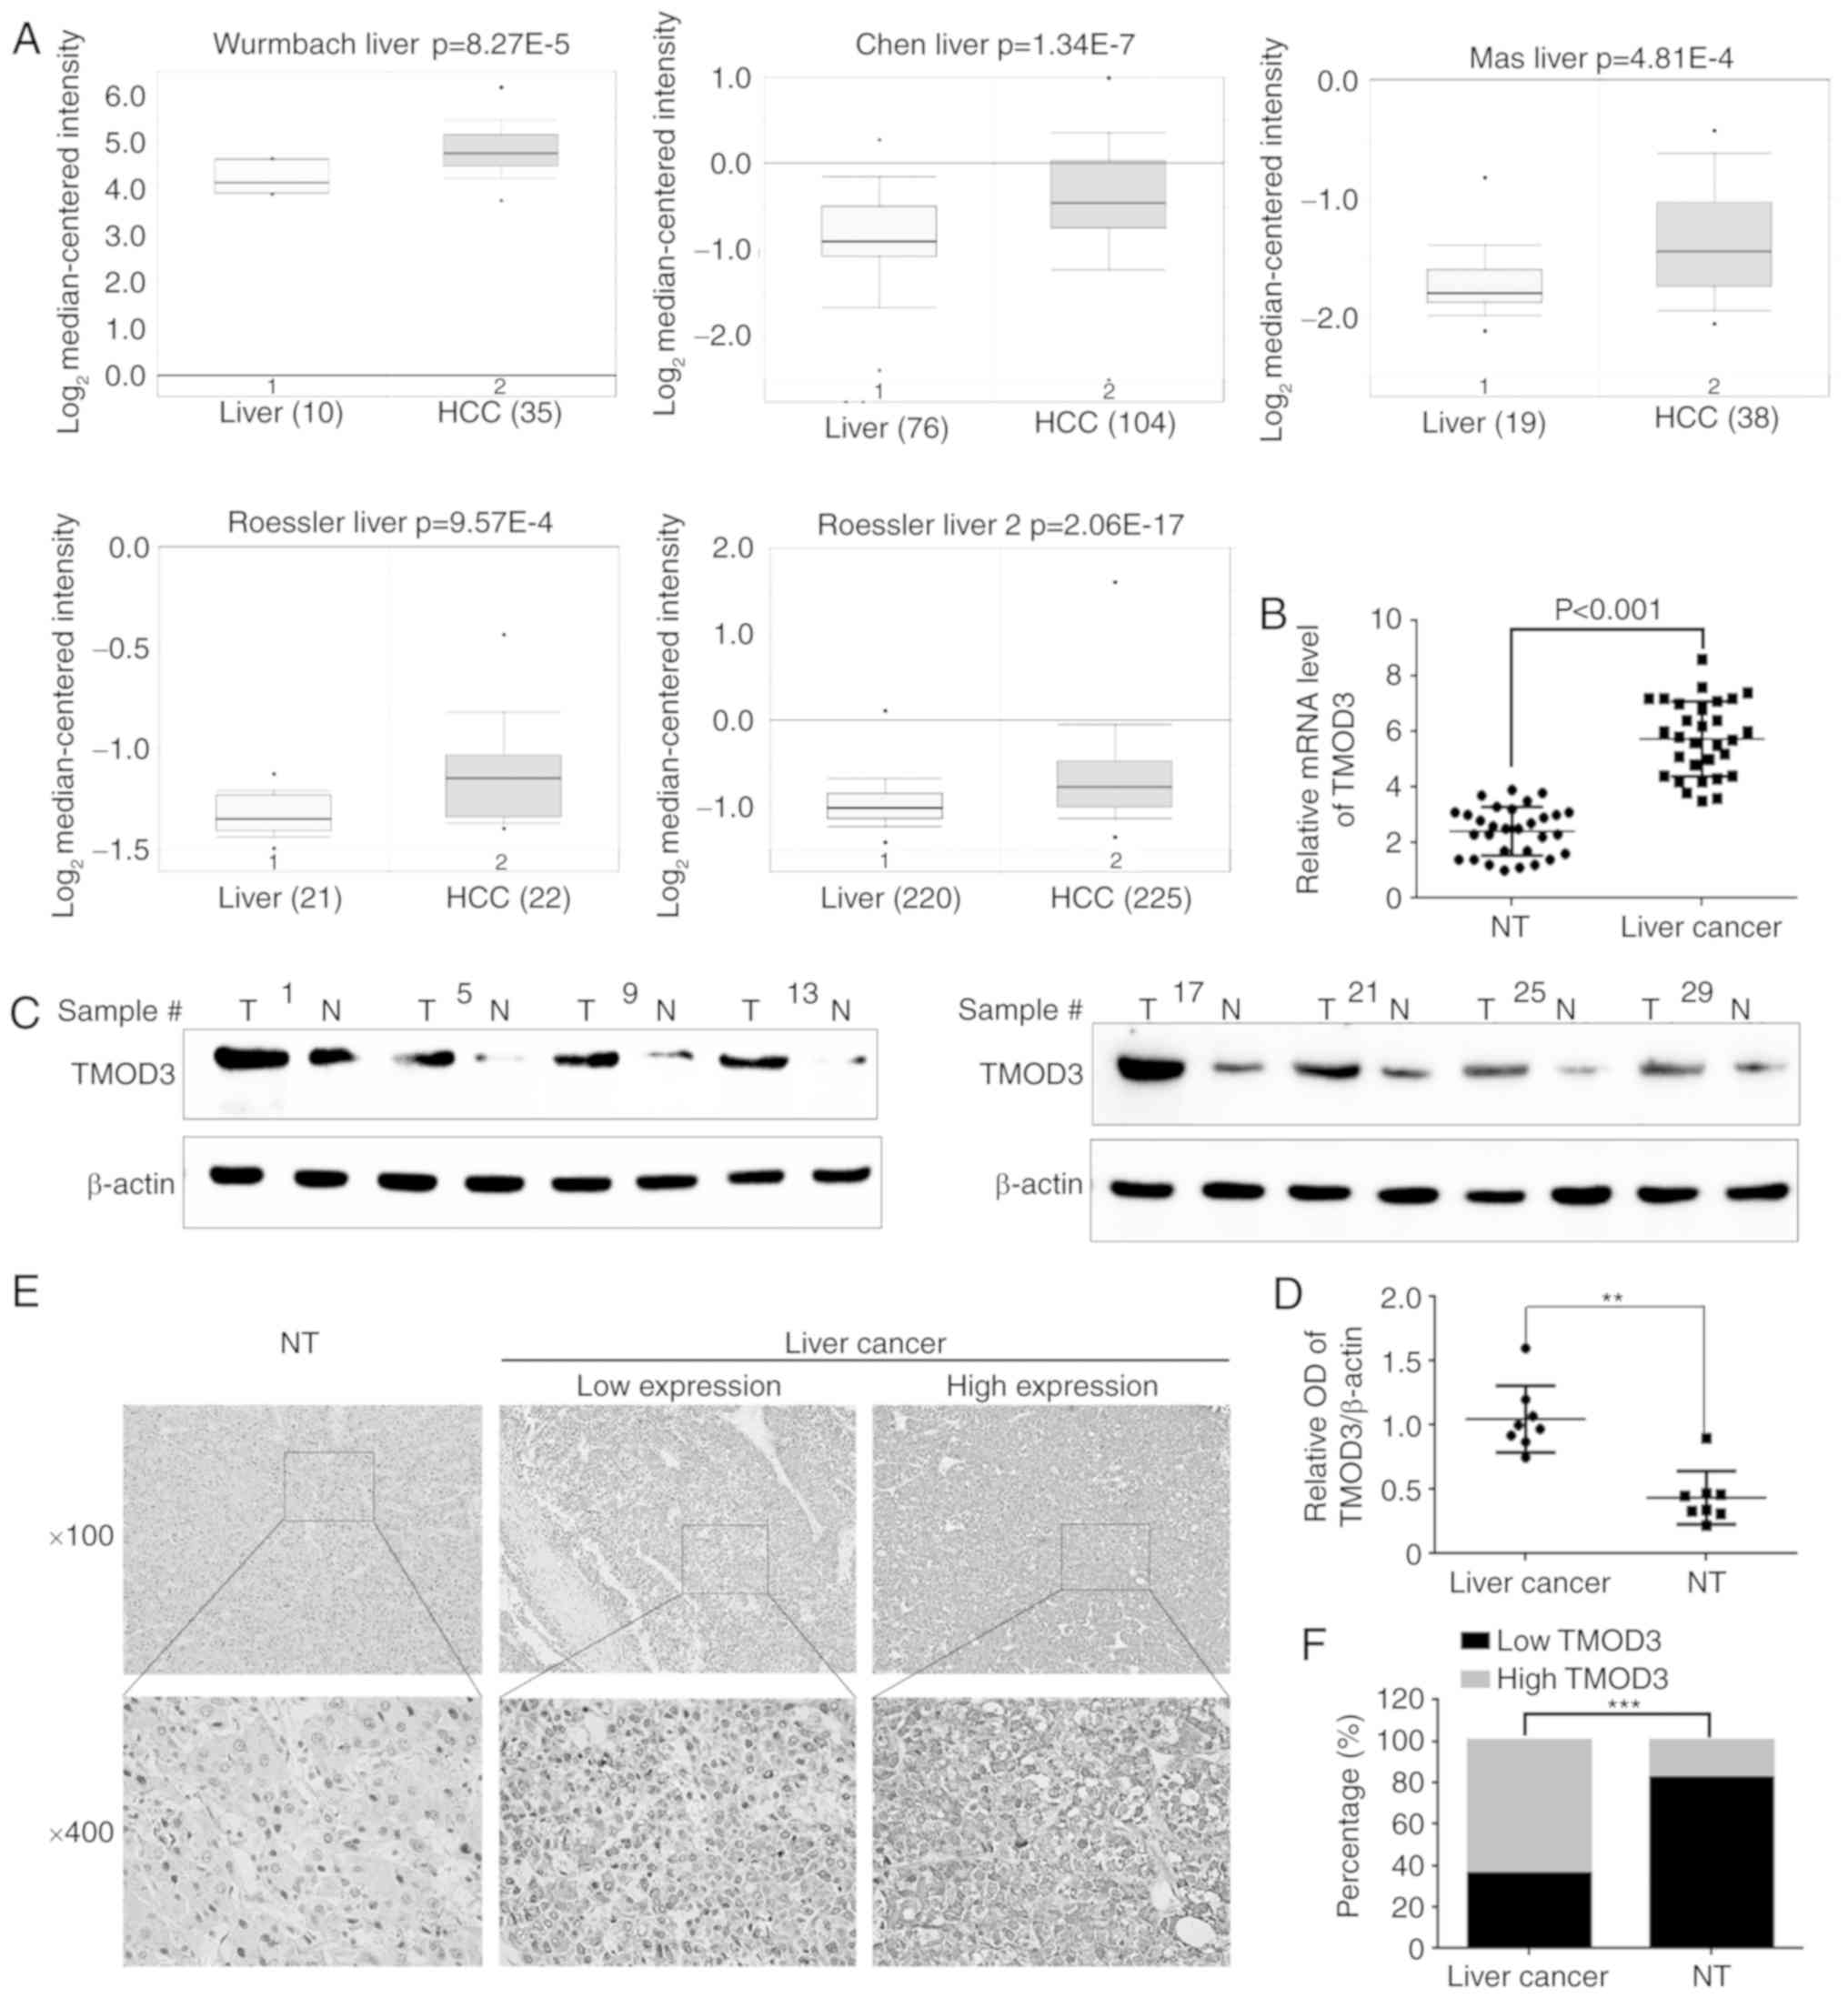
TMOD3 is upregulated in liver cancer
tissues
Initially, the Oncomine Database (www.oncomine.org) was utilized to investigate TMOD3
expression in liver cancer. The results revealed that the TMOD3
mRNA levels were higher compared with those observed in normal
liver tissues. The P-values recorded in the Wurmbach, Chen, Mas,
Roessler 1 and 2 liver datasets were 8.27×10⁻⁵,
1.34×10⁻⁷, 4.81×10⁻⁴, 9.57×10⁻⁴
and 2.06×10⁻¹⁷, respectively (Fig. 1A). Subsequently, RT-qPCR and western
blotting were performed in 30 pairs of PLC samples and matched
normal liver tissues. Consistently, the mRNA and protein levels of
TMOD3 were significantly higher compared with those observed in the
normal liver tissues (P<0.001; Fig.
1B-D). IHC was performed to further analyze TMOD3 expression in
50 paired PLC and adjacent liver specimens. As shown in Fig. 1E, TMOD3 was mainly localized in the
cytoplasm. It was also positively expressed in the 50 PLC
specimens, of which 32 (64%) exhibited a high expression and 18
(36%) exhibited a low expression (Fig.
1F). Compared with the matched non-tumor tissues, TMOD3
expression was significantly higher in liver cancer tissues
(P<0.001). These results indicate that TMOD3 is upregulated in
liver cancer tissues and may contribute to liver cancer
progression.
TMOD3 promotes the proliferation of
liver cancer cells in vitro
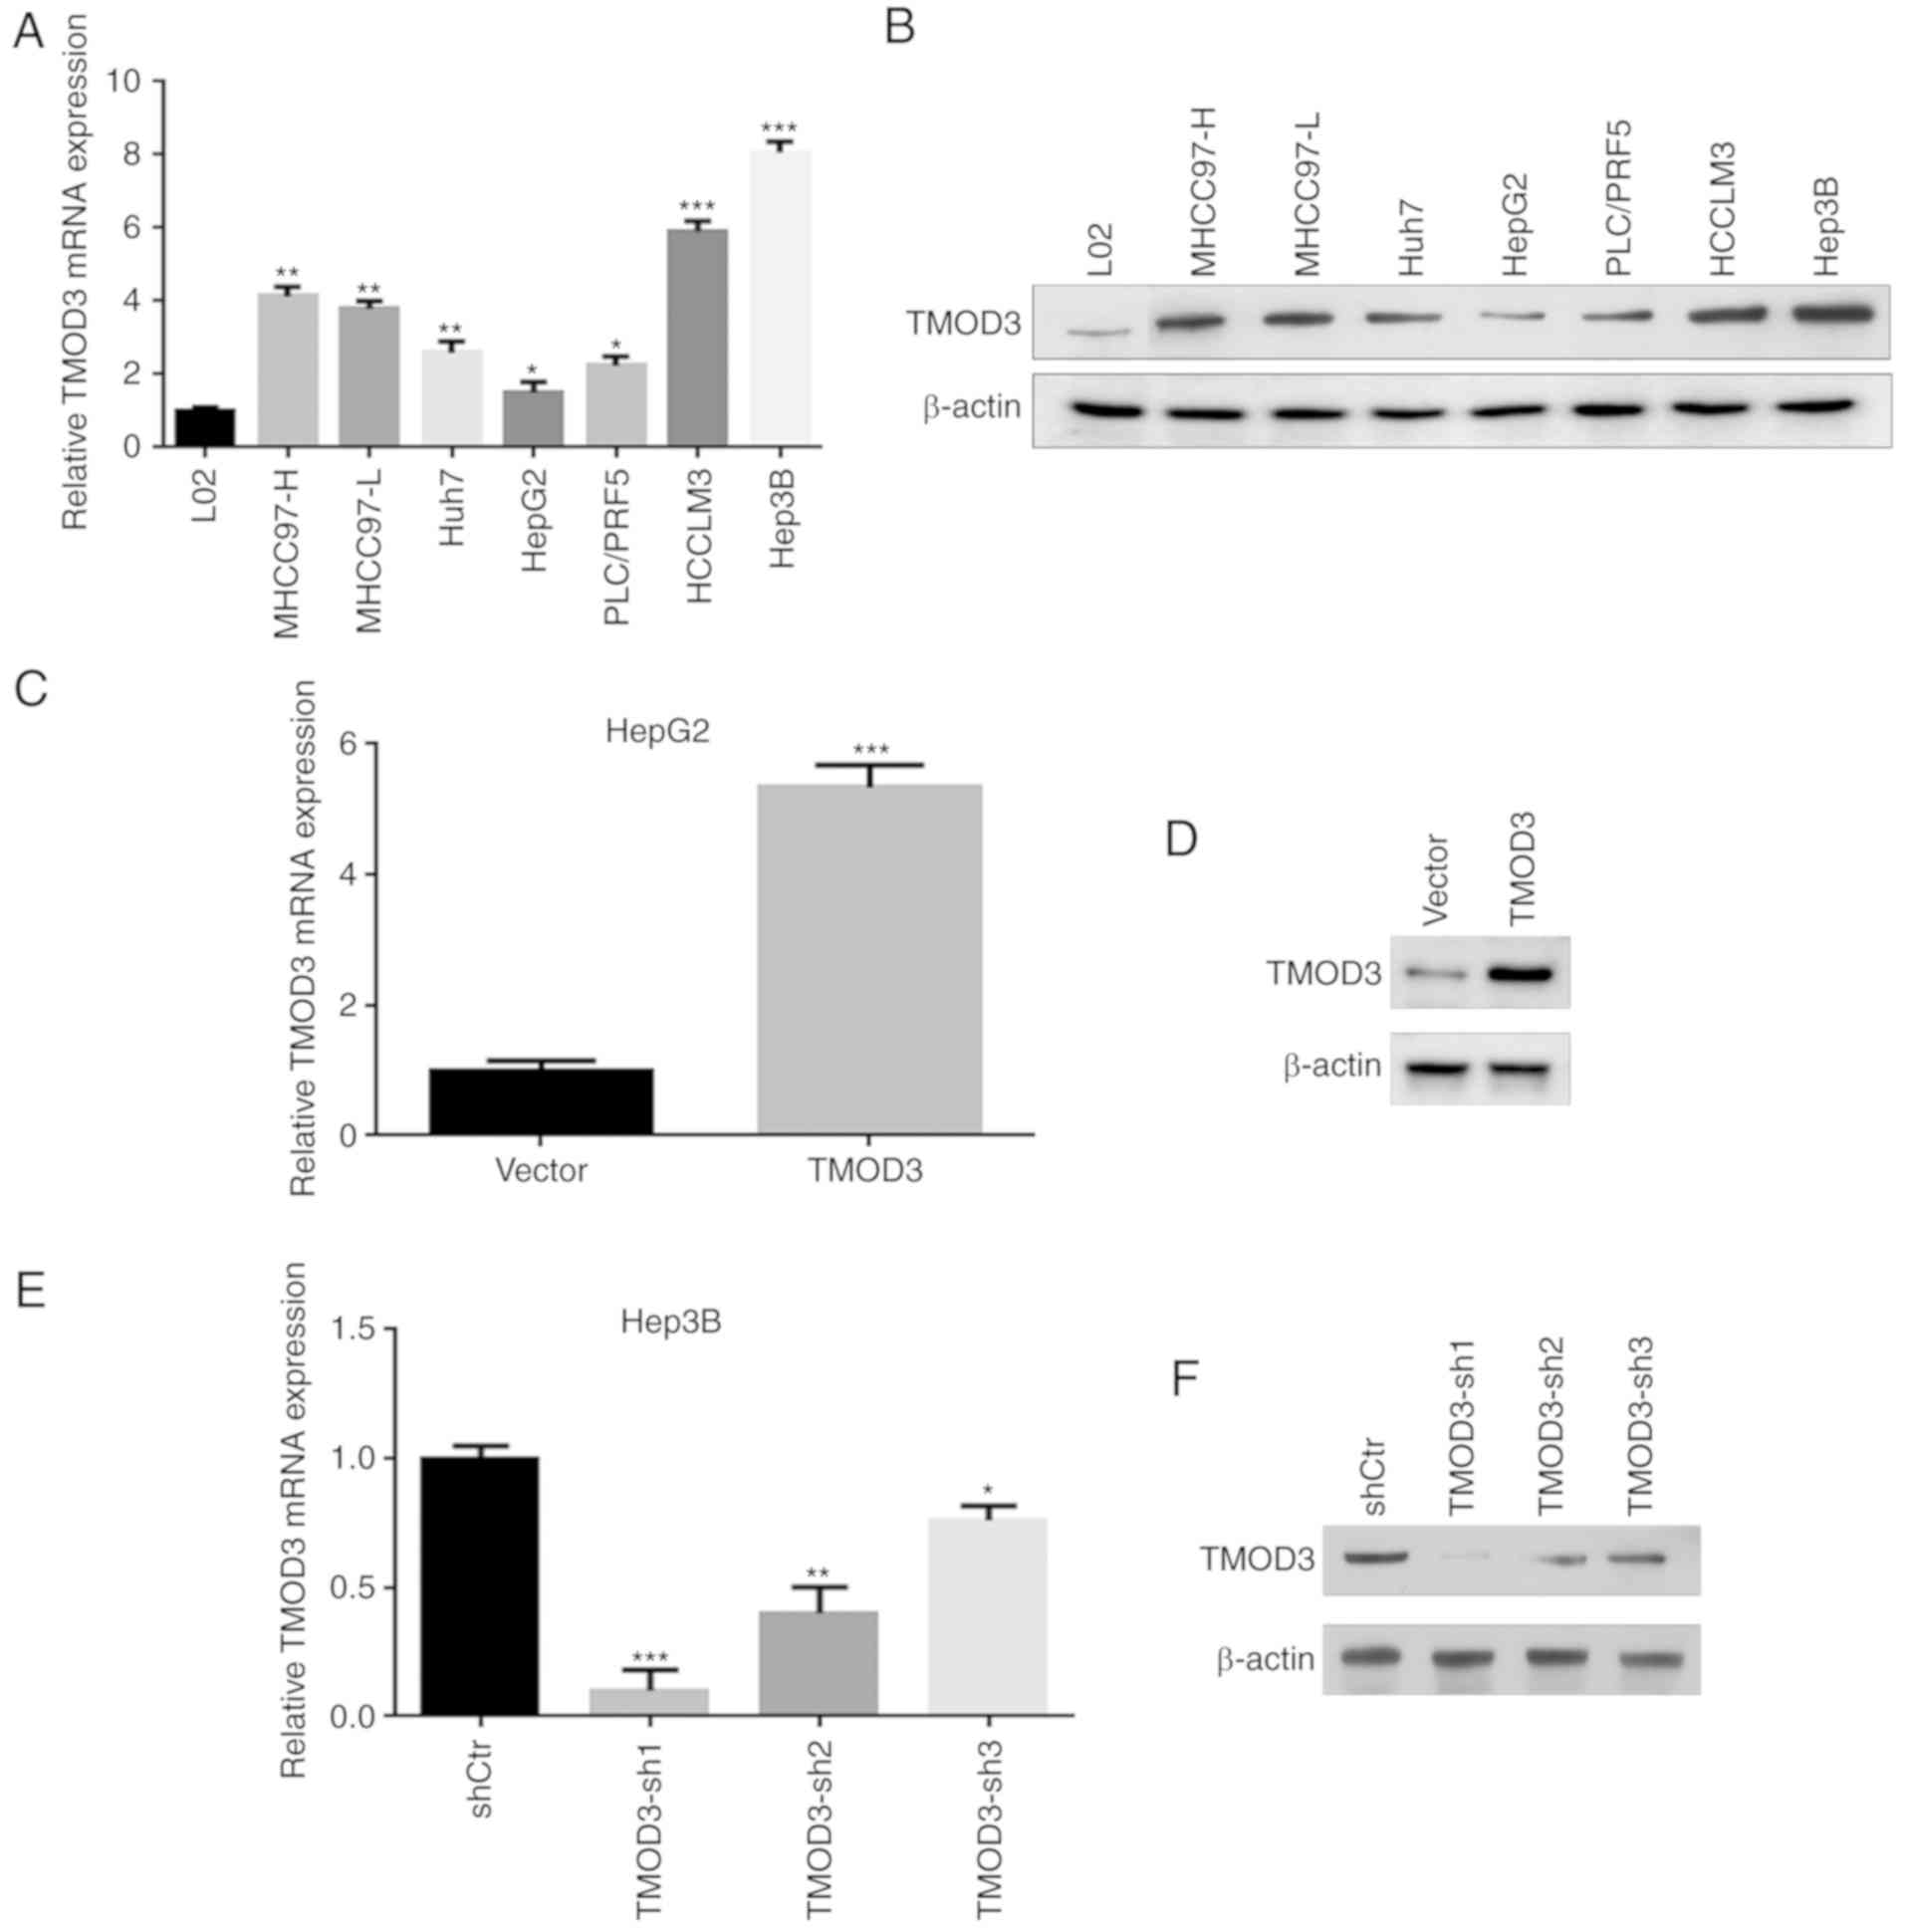
In order to study the biological functional role of
TMOD3 in liver cancer, the present study conducted knockdown and
overexpression experiments. First, the expression of the TMOD3
protein in the normal liver cell line L02 and in 7 liver cancer
cell lines (MHCC97-H, MHCC97-L, Huh7, HepG2, PLC/PRF5, HCCLM3 and
Hep3B) was evaluated. The results revealed that TMOD3 exhibited the
greatest expression in Hep3B cells and the lowest in HepG2 cells,
which had high and low metastatic potential, respectively (Fig. 2A and B). Stable TMOD3-overexpressing
HepG2-TMOD3 cells and TMOD3-knockdown Hep3B-shTMOD3 cells were
established via lentivirus transfection. The cell transfection
efficiency in each cell type was confirmed by RT-qPCR and western
blot analysis. Transfection of TMOD3-expressing lentivirus plasmids
increased the expression of TMOD3 in HepG2 cells (P<0.001;
Fig. 2C and D). Three shRNAs
(shRNA1, shRNA2 and shRNA3) were constructed to silence TMOD3
expression in Hep3B cells. The expression level of TMOD3 was
determined by RT-qPCR and western blot analysis, and shRNA1 was
found to be the most effective; shRNA1 was consequently selected
for further experiments (Fig. 2E and
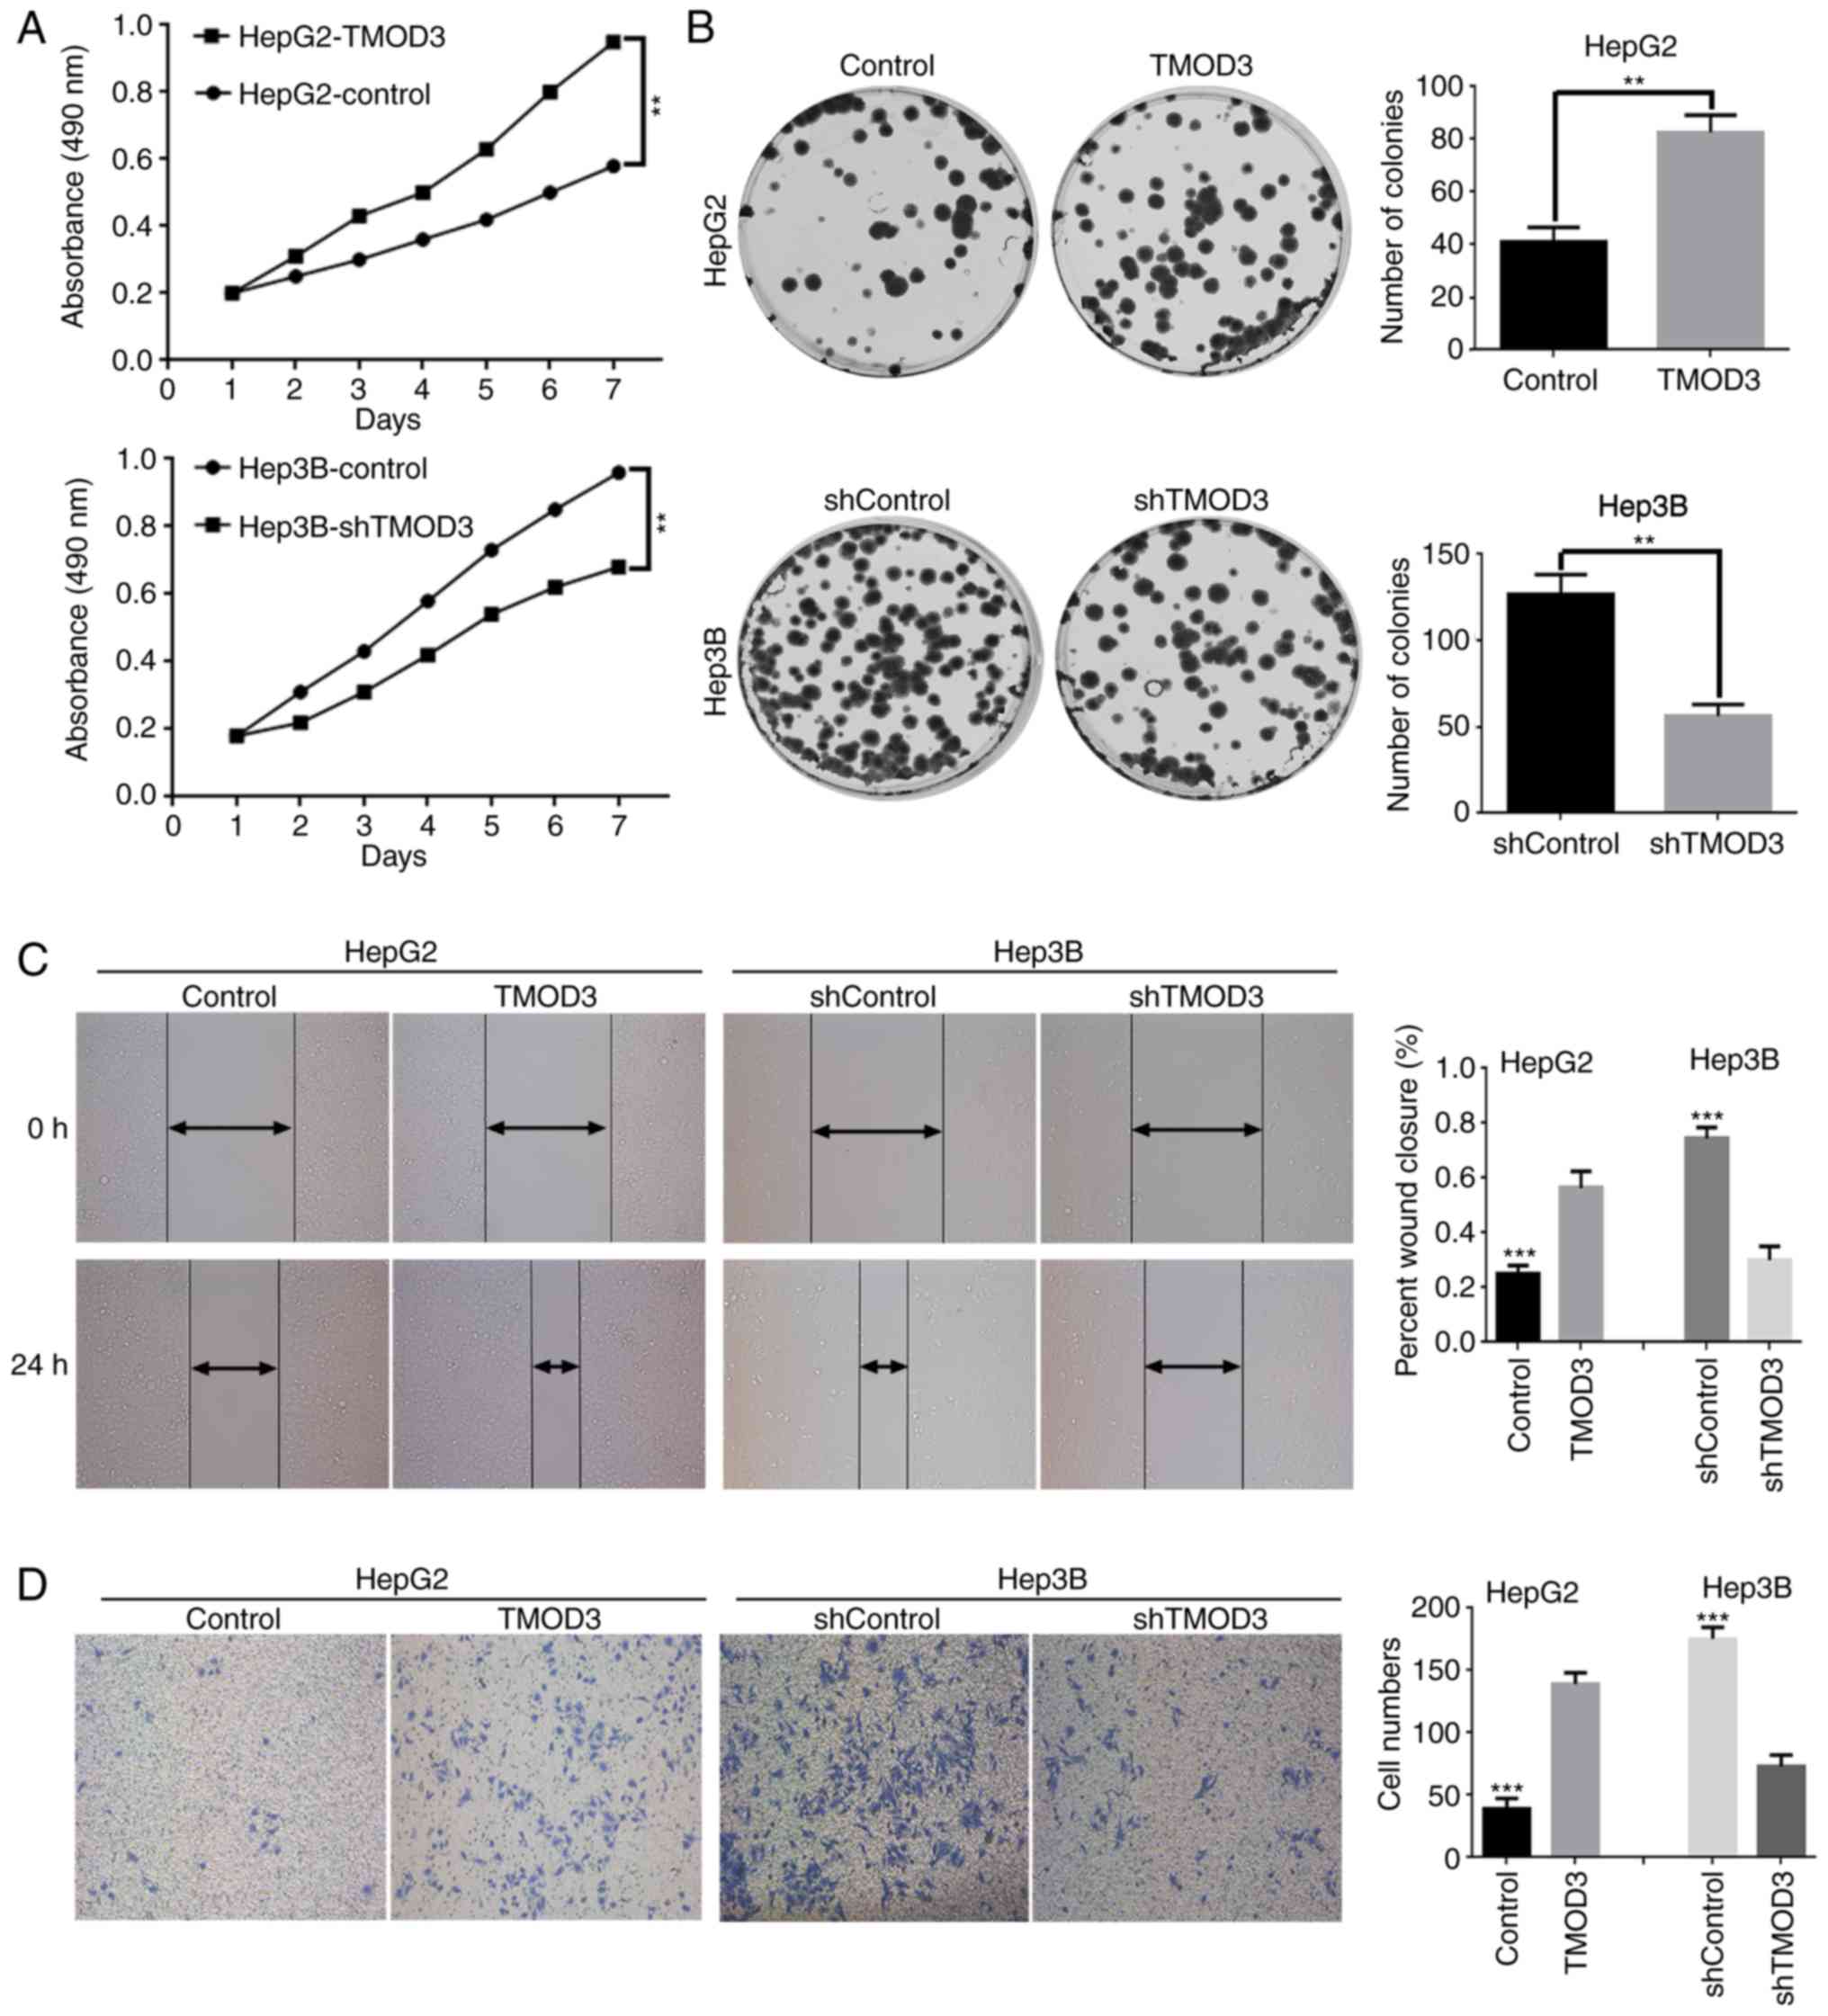
F). The MTT assay demonstrated that the proliferation rate was
markedly increased in HepG2-TMOD3 cells, whereas Hep3B-shTMOD3
cells exhibited the opposite effect (Fig. 3A). Consistently, in the colony
formation assay, HepG2-TMOD3 cells formed more colonies, while
Hep3B-shTMOD3 cells exhibited decreased clonogenic ability
(P<0.01; Fig. 3B). These results
suggested that TMOD3 promotes the proliferation of liver cancer
cells.
TMOD3 promotes liver cancer cell
migration and invasion in vitro
Wound healing and Transwell assays were performed to
determine the impact of TMOD3 on the migration and invasion
capacities of these cells. The results presented in Fig. 3C and D suggested that overexpression
of TMOD3 in HepG2 cells significantly enhanced the wound healing
ability and promoted cell invasion, while Hep3B-shTMOD3 cells
displayed a slow wound closure rate and weak invasive abilities.
Therefore, the present study demonstrated that TMOD3 promotes the
migration and invasion of liver cancer cells.
High expression of TMOD3 may promote
EMT in liver cancer
As TMOD3 is associated with actin binding and is
involved in cell migration and invasion, it was hypothesized that
TMOD3 may be associated with the EMT process. IF analysis revealed
that ectopic expression of TMOD3 in HepG2 cells displayed
fibroblast-like spindled morphology. However, TMOD3 silencing in
Hep3B cells produced a cobblestone-like appearance (Fig. 4A). Western blotting was performed to
determine the expression of EMT biomarkers in liver cancer cells.
The results demonstrated that overexpression of TMOD3 decreased the
expression of E-cadherin (epithelial marker), and resulted in the
upregulation of vimentin and Snail (mesenchymal markers) levels,
while the opposite trend in the expression of these markers was
observed in Hep3B-shTMOD3 cells (Fig.
4B). These results indicate that TMOD3 may induce EMT in liver
cancer.
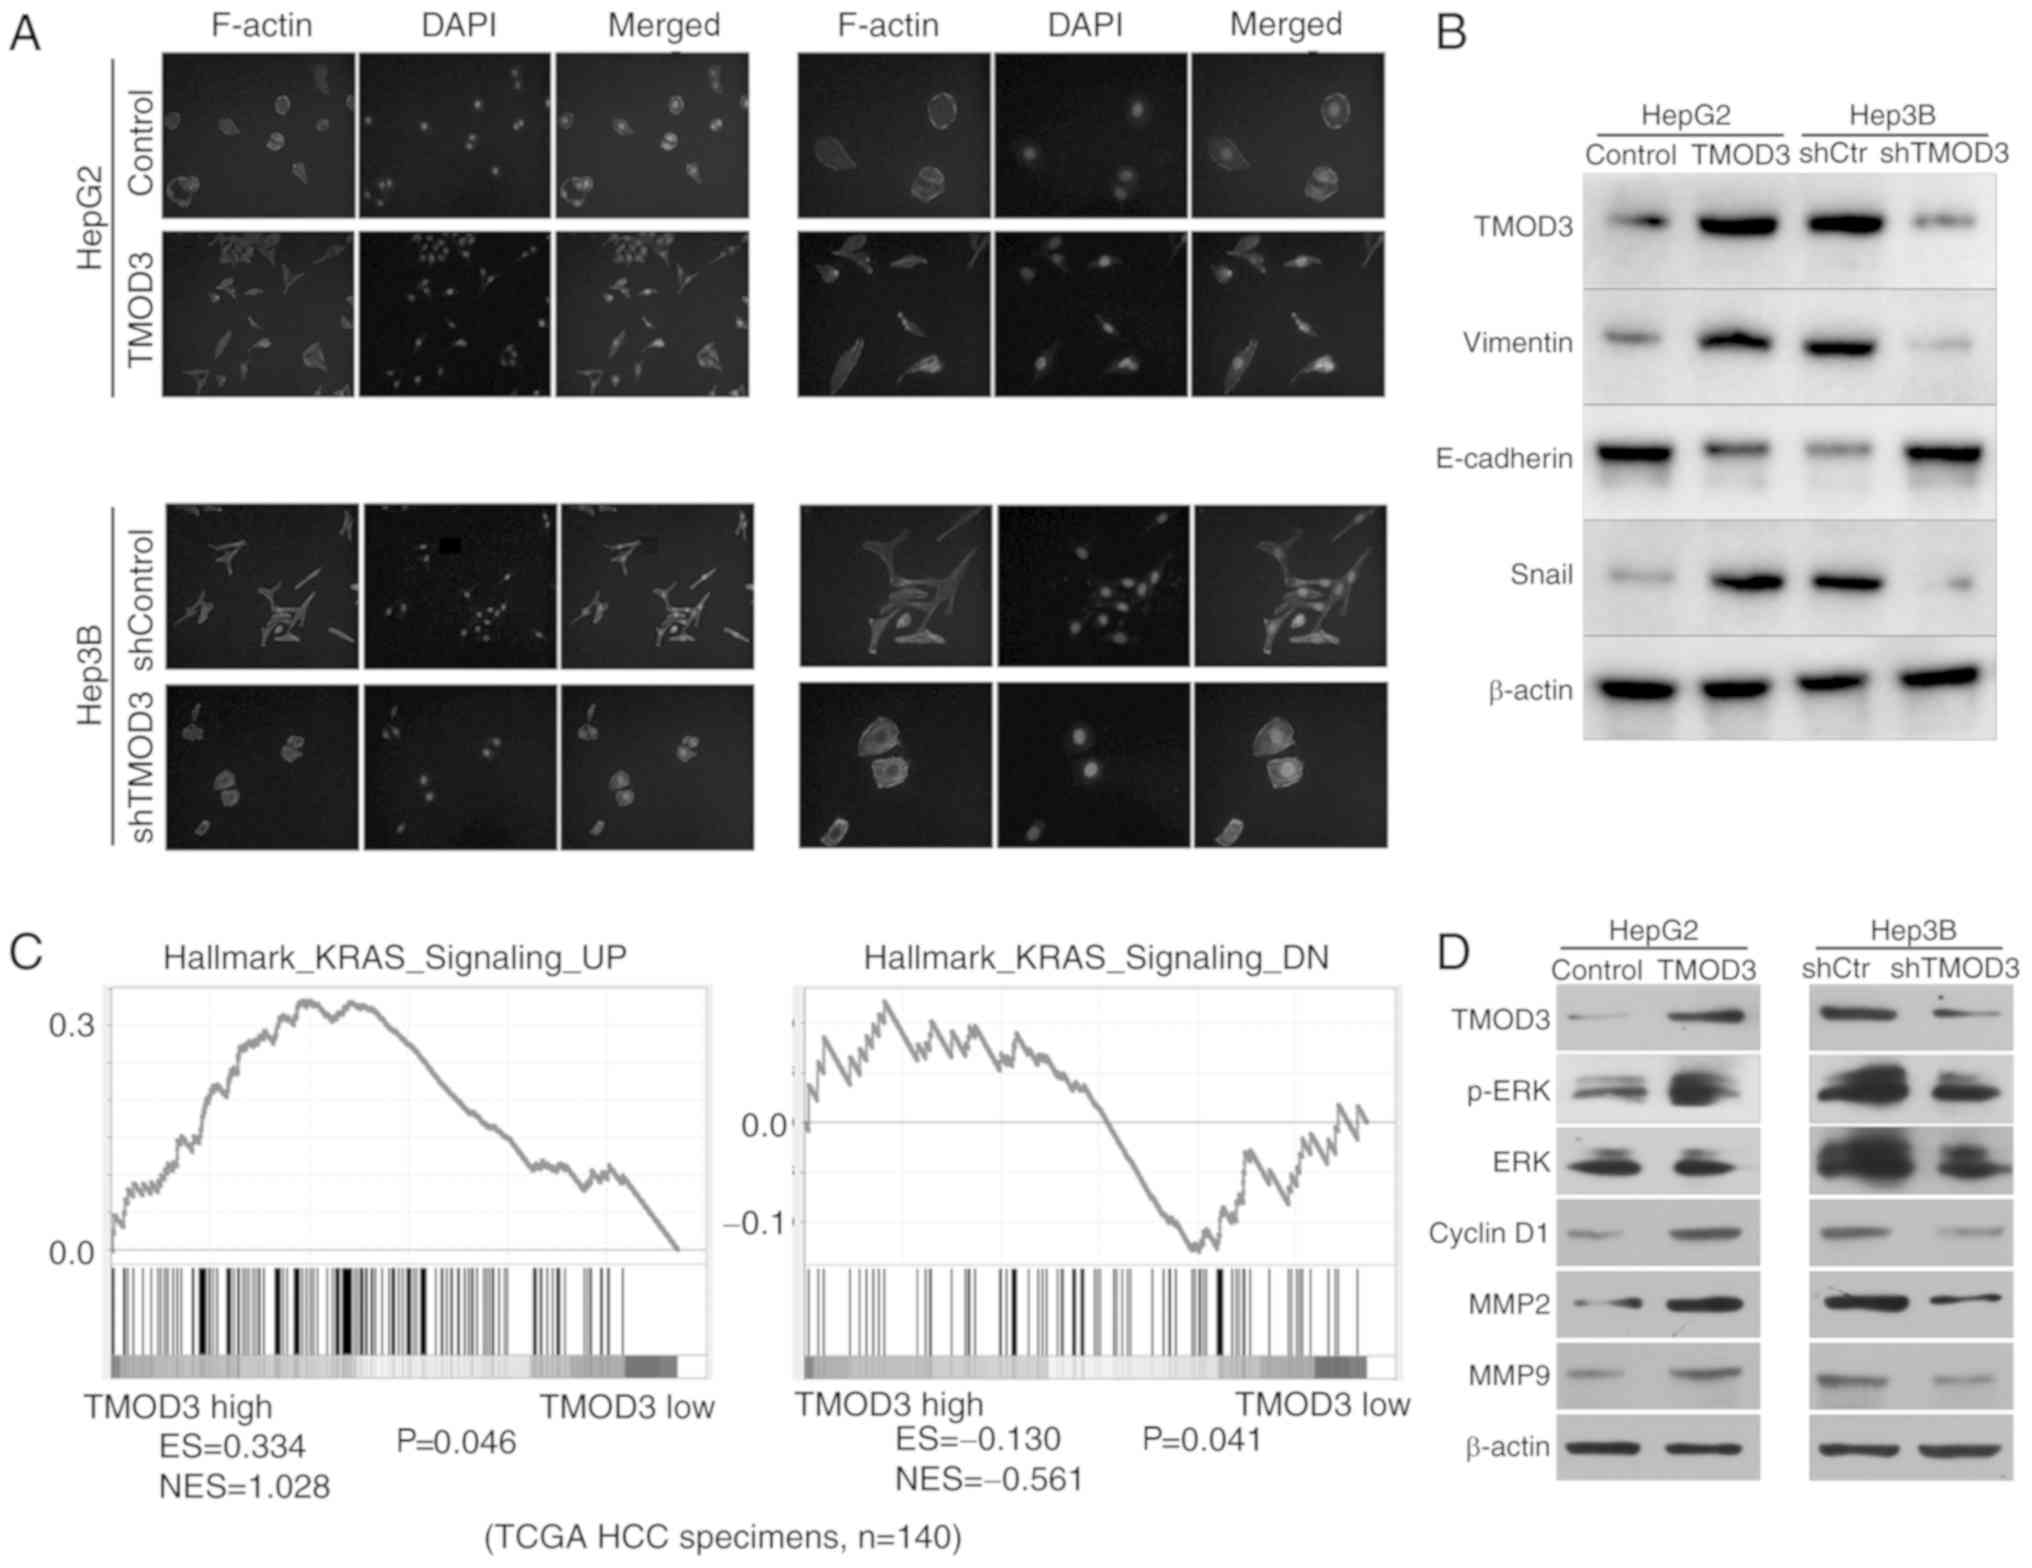 | Figure 4.TMOD3 is associated with EMT and
activates the MAPK/ERK signaling pathway. (A) Representative images
of the cytoskeleton. (B) The expression of EMT markers mediated by
TMOD3 was detected by western blot analysis. (C) The Gene Set
Enrichment Analysis plot indicated that TMOD3 expression was
positively correlated with the hallmark of KRAS (MAPK/ERK
signaling-associated gene) using The Cancer Genome Atlas data.
Enriched gene signatures were associated with the correlation
observed in the TMOD3-high and -low liver cancer groups. The
results indicated that the KRAS expression levels are positively
associated with the level of TMOD3. N=140 (D) The expression of
critical members and downstream effectors of the MAPK/ERK signaling
pathway was examined by western blot analysis in
HepG2TMOD3, Hep3BshTMOD3 and their control
cells. TMOD3, tropomodulin 3; EMT, epithelial-to-mesenchymal
transition; ES, enrichment score; NES, normalized enrichment score;
MAPK, mitogen-activated protein kinase; MMP, matrix
metalloproteinase; ERK, extracellular signal-regulated kinase;
shRNA, short hairpin RNA; KRAS, Kirsten rat sarcoma viral
proto-oncogene; HCC, hepatocellular carcinoma. |
TMOD3 promotes liver cancer
progression by activating the MAPK/ERK signaling pathway
To evaluate the potential regulatory mechanism of
TMOD3 in promoting liver cancer development, the Gene Set
Enrichment Analysis (GSEA) analysis was used to identify the
pathways regulated by TMOD3. High TMOD3 levels were positively
associated with Kirsten rat sarcoma viral proto-oncogene (KRAS;
Fig. 4C), which has previously been
defined as a key component of the MAPK/ERK signaling pathway for
modulating ERK activity, suggesting that TMOD3 may regulate
MAPK/ERK signaling. The MAPK/ERK pathway plays an important role in
cell proliferation, migration, differentiation and apoptosis, and
it is one of the most important molecular pathways in cancer growth
and metastasis (16). Western blot
analysis revealed that TMOD3 overexpression increased the
phosphorylation of ERK in HepG2 cells, whereas TMOD3 knockdown
decreased the levels of p-ERK in Hep3B cells; however, the total
level of ERK remained unchanged (Fig.
4D). In addition, the present study detected the expression of
MMP2, MMP9 and cyclin D1, which are controlled by the MAPK/ERK
signaling pathway and are associated with cancer cell proliferation
and invasion. The results revealed that the expression of MMP2,
MMP9 and cyclin D1 were significantly increased in HepG2-TMOD3
cells and decreased in Hep3B-shTMOD3 cells (Fig. 4D). These results indicated that
TMOD3 may promote liver cancer progression by activating the
MAPK/ERK signaling pathway.
Discussion
Liver cancer is one of the most common and lethal
cancers of the human digestive system. In the present study, the
mRNA and protein levels of TMOD3 were significantly increased in
liver cancer cells and tissues. Elevated TMOD3 expression was found
to be significantly associated with more unfavorable
clinicopathological characteristics of liver cancer. To the best of
our knowledge, the present study was the first to reveal that TMOD3
overexpression may promote cancer cell proliferation, migration and
invasion through the activation of the MAPK/ERK signaling pathway.
In addition, the results also provided evidence that TMOD3 may
enhance the EMT process. Therefore, TMOD3 may serve as a candidate
prognostic biomarker and therapeutic target in human liver
cancer.
TMOD3, one of the TMOD isoforms located at 15q21.2,
is an important component of the cytoskeleton of brain cells
(17) that can block the
depolymerization of the actin filaments at the pointed end
(6,18). Actin filaments are essential
components of the cytoskeleton in all types of cells (19,20).
F-actin has two structurally and biochemically distinct ends,
namely a barbed and a pointed end. Polymerization and
depolymerization occur at both ends; however, polymerization is
faster at the barbed end. G-actin is continuously polymerized at
the barbed end and depolymerized from the pointed end. In addition,
TMOD3 can block the elongation and depolymerization of the actin
filament at the pointed end. By regulating actin dynamics, TMOD3
may facilitate various processes, including determination of cell
shape, cell migration and muscle contraction (11). However, TMOD3 can also sequester
actin monomers or nucleate actin polymerization by binding to
G-actin, although how TMOD3 affects F- and G-actin remains
controversial. Our research was not sufficiently in-depth to
explain how TMOD3 impacts F-actin organization in liver cancer
cells, and confocal microscopy would be required to actually
measure the filament length. The mechanism underlying the function
of TMOD3 in actin organization requires further experimental
support through image quantification and biochemical analysis.
Previous studies have revealed that TMOD3 can cap the pointed ends
of actin filament, which is necessary for maintaining the actin
meshwork, and is important for spindle formation and cancer cell
division (21,22). In addition, Sui et al
(15) reported that deletion of
TMOD3 affected the fetal liver and caused embryonic death. These
findings suggest that TMOD3 may play a role in cancer development.
Previous studies have also revealed that TMOD3 expression was
associated with prostate and bladder cancer (23,24),
but no studies have yet identified the function of TMOD3 in liver
cancer. We herein aimed to determine whether TMOD3 is involved in
liver cancer progression and the results revealed that, when
compared with adjacent non-tumor liver tissues, TMOD3 expression
was significantly increased in cancer tissues. Furthermore, TMOD3
was shown to promote liver cancer cell growth, invasion and
migration.
Further mechanistic studies indicated that TMOD3
promoted liver cancer progression by activating the MAPK/ERK
signaling pathway. MAPK/ERK signaling, one of the most important
molecular pathways in cancer development, is critical for human
cancer cell proliferation, survival and dissemination (25,26).
Numerous studies have confirmed the close association between
MAPK/ERK signaling and liver cancer progression (27–29).
The results of Gene Set Enrichment Analysis demonstrated that TMOD3
was the most closely associated with the MAPK/ERK signaling
pathway, which was further verified by western blot analysis. In
addition, the results also revealed that TMOD3 significantly
reduced the levels of MMP2, MMP9 and cyclin D1 in Hep3B-shTMOD3
cells and increased their levels in HepG2-TMOD3 cells. p-ERK, MMP2
and MMP9 are known to promote tumor proliferation and metastasis by
degrading basement membrane components (30), while cyclin D1 is required for the
G1-to-S transition and plays a key role in the maintenance of the
malignant phenotype (31). These
findings may explain the role of TMOD3 in promoting liver
cancer.
Recently, a number of studies suggested that EMT may
enhance epithelial cell invasive and migratory abilities during
cancer progression (32,33). Several types of cancer, such as
glioma (34), lung (35) and liver cancer (36), have been found to be associated with
EMT. Considering the function of TMOD3, the present study performed
IF and western blot analysis to verify whether TMOD3 induced EMT in
liver cancer cells. The results revealed that HepG2-TMOD3 cells
exhibited an elongated morphology and decreased E-cadherin
expression, but increased vimentin and Snail expression. However,
the opposite effects were observed in Hep3B-TMOD3 cells. Thus, it
was hypothesized that TMOD3 may induce EMT in liver cancer. In this
study, TMOD3 was shown to activate MAPK/ERK signaling during liver
cancer progression. It is known that MAPK/ERK signaling is
associated with EMT, and loss of epithelial polarity regulated by
ERK requires remodeling of the actin cytoskeleton. However, we were
unable to obtain more details on the connection between actin
organization and MAPK/ERK signaling, which is a limitation to our
study.
There were certain limitations to the present study.
First, more liver cancer specimens and experiments are required to
validate the concept of TMOD3 promoting liver cancer progression.
Second, further IHC analysis is required to demonstrate whether
TMOD3 induces EMT in liver cancer. Third, no confocal imaging was
available to demonstrate F-actin organization and TMOD3 staining on
F-actin, and confocal microscopy would be required to accurately
measure filament length.
In conclusion, the present study demonstrated that
TMOD3 enhanced the proliferation, migration and invasion of liver
cancer cells by activating the MAPK/ERK signaling pathway, and its
increased expression may be associated with EMT. Therefore, TMOD3
may serve as a potential prognostic biomarker and therapeutic
target for liver cancer.
Acknowledgements
Not applicable.
Funding
No funding was received.
Availability of data and materials
The datasets used and/or analyzed during the present
study are available from the corresponding author upon reasonable
request.
Authors' contributions
CJ conceived the study and wrote the manuscript. CJ
and QL conducted the experiments and contributed to the data
analysis. WS and QL collected the clinical samples and
corresponding clinical data. ZC was involved in the conception of
the study and revised the manuscript. All authors read and approved
the final version of this manuscript.
Ethics approval and consent to
participate
The protocols for the collection of human tissues
and all experiments using human materials were approved by the
Ethics Committee of Xiangya Hospital of Central South University,
and written informed consent was signed by all the participants or
their families prior to their inclusion in the study.
Patient consent for publication
Not applicable.
Competing interests
The authors declare that they have no competing
interests.
Glossary
Abbreviations
Abbreviations:
|
TMOD3
|
tropomodulin 3
|
|
PLC
|
primary liver cancer
|
|
RT-qPCR
|
reverse transcription-quantitative
polymerase chain reaction
|
|
GAPDH
|
glyceraldehyde 3-phosphate
dehydrogenase
|
|
mRNA
|
microRNA
|
|
shRNA
|
short hairpin RNA
|
|
IHC
|
immunohistochemistry
|
|
PBS
|
phosphate-buffered saline
|
|
GSEA
|
Gene Set Enrichment Analysis
|
References
|
1
|
Torre LA, Bray F, Siegel RL, Ferlay J,
Lortet-Tieulent J and Jemal A: Global cancer statistics, 2012. CA
Cancer J Clin. 65:87–108. 2015. View Article : Google Scholar : PubMed/NCBI
|
|
2
|
Forner A, Reig M and Bruix J:
Hepatocellular carcinoma. Lancet. 391:1301–1314. 2018. View Article : Google Scholar : PubMed/NCBI
|
|
3
|
Fu J, Li Y, Li Z and Li N: Clinical
utility of decarboxylation prothrombin combined with α-fetoprotein
for diagnosing primary hepatocellular carcinoma. Biosci Rep.
38:BSR201800442018. View Article : Google Scholar : PubMed/NCBI
|
|
4
|
El-Serag HB: Hepatocellular carcinoma. N
Engl J Med. 365:1118–1127. 2011. View Article : Google Scholar : PubMed/NCBI
|
|
5
|
Dhir M, Melin AA, Douaiher J, Lin C, Zhen
WK, Hussain SM, Geschwind JF, Doyle MB, Abou-Alfa GK and Are C: A
Review and update of treatment options and controversies in the
management of hepatocellular carcinoma. Ann Surg. 263:1112–1125.
2016. View Article : Google Scholar : PubMed/NCBI
|
|
6
|
Weber A, Pennise CR, Babcock GG and Fowler
VM: Tropomodulin caps the pointed ends of actin filaments. J Cell
Biol. 127:1627–1635. 1994. View Article : Google Scholar : PubMed/NCBI
|
|
7
|
Narita A, Oda T and Maéda Y: Structural
basis for the slow dynamics of the actin filament pointed end. EMBO
J. 30:1230–1237. 2011. View Article : Google Scholar : PubMed/NCBI
|
|
8
|
Fischer RS and Fowler VM: Tropomodulins:
Life at the slow end. Trends Cell Biol. 13:593–601. 2003.
View Article : Google Scholar : PubMed/NCBI
|
|
9
|
Weber KL, Fischer RS and Fowler VM: Tmod3
regulates polarized epithelial cell morphology. J Cell Sci.
120:3625–3632. 2007. View Article : Google Scholar : PubMed/NCBI
|
|
10
|
Lim CY, Bi X, Wu D, Kim JB, Gunning PW,
Hong W and Han W: Tropomodulin3 is a novel Akt2 effector regulating
insulin-stimulated GLUT4 exocytosis through cortical actin
remodeling. Nat Commun. 6:59512015. View Article : Google Scholar : PubMed/NCBI
|
|
11
|
Yamashiro S, Gokhin DS, Kimura S, Nowak RB
and Fowler VM: Tropomodulins: Pointed-end capping proteins that
regulate actin filament architecture in diverse cell types.
Cytoskeleton. 69:337–370. 2012. View
Article : Google Scholar : PubMed/NCBI
|
|
12
|
Cox-Paulson EA, Walck-Shannon E, Lynch AM,
Yamashiro S, Zaidel-Bar R, Eno CC, Ono S and Hardin J: Tropomodulin
protects α-catenin-dependent junctional-actin networks under stress
during epithelial morphogenesis. Curr Biol. 22:1500–1505. 2012.
View Article : Google Scholar : PubMed/NCBI
|
|
13
|
Moyer JD, Nowak RB, Kim NE, Larkin SK,
Peters LL, Hartwig J, Kuypers FA and Fowler VM: Tropomodulin 1-null
mice have a mild spherocytic elliptocytosis with appearance of
tropomodulin 3 in red blood cells and disruption of the membrane
skeleton. Blood. 116:2590–2599. 2010. View Article : Google Scholar : PubMed/NCBI
|
|
14
|
Sui Z, Nowak RB, Sanada C, Halene S,
Krause DS and Fowler VM: Regulation of actin polymerization by
tropomodulin-3 controls megakaryocyte actin organization and
platelet biogenesis. Blood. 126:520–530. 2015. View Article : Google Scholar : PubMed/NCBI
|
|
15
|
Sui Z, Nowak RB, Bacconi A, Kim NE, Liu H,
Li J, Wickrema A, An XL and Fowler VM: Tropomodulin3-null
mice are embryonic lethal with anemia due to impaired erythroid
terminal differentiation in the fetal liver. Blood. 123:758–767.
2014. View Article : Google Scholar : PubMed/NCBI
|
|
16
|
Sun Y, Liu WZ, Liu T, Feng X, Yang N and
Zhou HF: Signaling pathway of MAPK/ERK in cell proliferation,
differentiation, migration, senescence and apoptosis. J Recept
Signal Transduct Res. 35:600–604. 2015. View Article : Google Scholar : PubMed/NCBI
|
|
17
|
Cox PR and Zoghbi HY: Sequencing,
expression analysis, and mapping of three unique human tropomodulin
genes and their mouse orthologs. Genomics. 63:97–107. 2000.
View Article : Google Scholar : PubMed/NCBI
|
|
18
|
Fischer RS, Yarmola EG, Weber KL, Speicher
KD, Speicher DW, Bubb MR and Fowler VM: Tropomodulin 3 binds to
actin monomers. J Biol Chem. 281:36454–36465. 2006. View Article : Google Scholar : PubMed/NCBI
|
|
19
|
Pollard TD and Cooper JA: Actin, a central
player in cell shape and movement. Science. 326:1208–1212. 2009.
View Article : Google Scholar : PubMed/NCBI
|
|
20
|
Diz-Muñoz A, Fletcher DA and Weiner OD:
Use the force: Membrane tension as an organizer of cell shape and
motility. Trends Cell Biol. 23:47–53. 2013. View Article : Google Scholar : PubMed/NCBI
|
|
21
|
Jo YJ, Jang WI, Kim NH and Namgoong S:
Tropomodulin-3 is essential in asymmetric division during mouse
oocyte maturation. Sci Rep. 6:292042016. View Article : Google Scholar : PubMed/NCBI
|
|
22
|
Chaigne A, Campillo C, Voituriez R, Gov
NS, Sykes C, Verlhac MH and Terret ME: F-actin mechanics control
spindle centring in the mouse zygote. Nat Commun. 7:102532016.
View Article : Google Scholar : PubMed/NCBI
|
|
23
|
Paez AV, Pallavicini C, Schuster F,
Valacco MP, Giudice J, Ortiz EG, Anselmino N, Labanca E, Binaghi M,
Salierno M, et al: Heme oxygenase-1 in the forefront of a
multi-molecular network that governs cell-cell contacts and
filopodia-induced zippering in prostate cancer. Cell Death Dis.
7:e25702016. View Article : Google Scholar : PubMed/NCBI
|
|
24
|
Pawlak G, McGarvey TW, Nguyen TB,
Tomaszewski JE, Puthiyaveettil R, Malkowicz SB and Helfman DM:
Alterations in tropomyosin isoform expression in human transitional
cell carcinoma of the urinary bladder. Int J Cancer. 110:368–373.
2004. View Article : Google Scholar : PubMed/NCBI
|
|
25
|
Kyriakis JM and Avruch J: Mammalian MAPK
signal transduction pathways activated by stress and inflammation:
A 10-year update. Physiol Rev. 92:689–737. 2012. View Article : Google Scholar : PubMed/NCBI
|
|
26
|
De Luca A, Maiello MR, D'Alessio A,
Pergameno M and Normanno N: The RAS/RAF/MEK/ERK and the PI3K/AKT
signalling pathways: Role in cancer pathogenesis and implications
for therapeutic approaches. Expert Opin Ther Targets. 16 (Suppl
2):S17–S27. 2012. View Article : Google Scholar : PubMed/NCBI
|
|
27
|
Liao YJ, Fang CC, Yen CH, Hsu SM, Wang CK,
Huang SF, Liang YC, Lin YY, Chu YT and Arthur Chen YM: Niemann-Pick
type C2 protein regulates liver cancer progression via modulating
ERK1/2 pathway: Clinicopathological correlations and therapeutical
implications. Int J Cancer. 137:1341–1351. 2015. View Article : Google Scholar : PubMed/NCBI
|
|
28
|
Chung W, Kim M, de la Monte S, Longato L,
Carlson R, Slagle BL, Dong X and Wands JR: Activation of signal
transduction pathways during hepatic oncogenesis. Cancer Lett.
370:1–9. 2016. View Article : Google Scholar : PubMed/NCBI
|
|
29
|
Fang Y, Liu G, Xie C, Qian K, Lei X, Liu
Q, Liu G, Cao Z, Fu J, Du H, et al: Pharmacological inhibition of
TRPV4 channel suppresses malignant biological behavior of
hepatocellular carcinoma via modulation of ERK signaling pathway.
Biomed Pharmacother. 101:910–919. 2018. View Article : Google Scholar : PubMed/NCBI
|
|
30
|
Dhillon AS, Hagan S, Rath O and Kolch W:
MAP kinase signalling pathways in cancer. Oncogene. 26:3279–3290.
2007. View Article : Google Scholar : PubMed/NCBI
|
|
31
|
Tashiro E, Tsuchiya A and Imoto M:
Functions of cyclin D1 as an oncogene and regulation of cyclin D1
expression. Cancer Sci. 98:629–635. 2007. View Article : Google Scholar : PubMed/NCBI
|
|
32
|
Nieto MA, Huang RY, Jackson RA and Thiery
JP: EMT: 2016. Cell. 166:21–45. 2016. View Article : Google Scholar : PubMed/NCBI
|
|
33
|
De Craene B and Berx G: Regulatory
networks defining EMT during cancer initiation and progression. Nat
Rev Cancer. 13:97–110. 2013. View Article : Google Scholar : PubMed/NCBI
|
|
34
|
Meng L, Wang X, Liao W, Liu J, Liao Y and
He Q: BAF53a is a potential prognostic biomarker and promotes
invasion and epithelial-mesenchymal transition of glioma cells.
Oncol Rep. 38:3327–3334. 2017.PubMed/NCBI
|
|
35
|
Chen JH, Zhou LY, Xu S, Zheng YL, Wan YF
and Hu CP: Overexpression of lncRNA HOXA11-AS promotes cell
epithelial-mesenchymal transition by repressing miR-200b in
non-small cell lung cancer. Cancer Cell Int. 17:642017. View Article : Google Scholar : PubMed/NCBI
|
|
36
|
Ma J, Zeng S, Zhang Y, Deng G, Qu Y, Guo
C, Yin L, Han Y, Cai C, Li Y, et al: BMP4 promotes oxaliplatin
resistance by an induction of epithelial-mesenchymal transition via
MEK1/ERK/ELK1 signaling in hepatocellular carcinoma. Cancer Lett.
411:117–129. 2017. View Article : Google Scholar : PubMed/NCBI
|