Introduction
Ovarian cancer is the leading cause of mortality
from gynecological cancer globally (1). Taxanes-platinum combination have
become the first-line chemotherapeutic regimen used against
advanced epithelial ovarian cancer (EOC), which accounts for 85–90%
of all ovarian malignancies (2).
Taxanes, docetaxel (DTX) included, are widely recognized as a
viable treatment method, and have been indicated to inhibit tumor
angiogenesis and cell proliferation, induce tumor cell apoptosis
and suppress tumor growth (3–5).
Despite the encouraging survival benefits, not every patient with
EOC responds to therapy in a satisfactory manner due to resistance
or insensitivity (6,7). Detecting treatment responses early
will benefit these non-responders. At present, cancer antigen 125
detection and the Response Evaluation Criterion in Solid Tumors
(RECIST) are widely used to clinically assess treatment responses
(8,9). However, size changes due to therapy
tend to appear later compared with changes in the underlying tumor
functions, including vascularization and vascular permeability
(10,11). This emphasizes the need to develop
reliable methods for predicting early responses to therapy in order
to replace unsuccessful drugs with potentially more effective
therapeutic methods.
As a non-invasive imaging method, dynamic contrast
enhanced-magnetic resonance imaging (DCE-MRI) contributes to the
evaluation of tumor vasculature function and has increasingly been
applied in animal experiments and clinical trials to predict early
tumor responses to therapy (12–16).
However, it has not yet been determined whether
quantitative DCE-MRI is able to predict the early response to DTX
in EOC or whether there are associations between DCE-MRI parameters
and the tumor size or histopathological changes. Therefore, the
present study aimed to investigate whether quantitative DCE-MRI
parameters may be used to determine an early treatment response to
DTX in induced rat EOC by assessing the association of these
parameters with tumor size, vascular endothelial growth factor
(VEGF) levels and microvessel density (MVD) of the tumor.
Materials and methods
Tumor model and treatment
All animal experimental procedures were ethically
approved by the Institutional Review Board of Jinshan Hospital of
Fudan University (Shanghai, China) and were performed according to
the Guide for the Care and Use of Laboratory Animals of the
National Science and Technology Committee of China. A total of 160
female Sprague-Dawley rats (8 weeks old, 150–200 g; Shanghai
Laboratory Animal Research Center, Shanghai, China) underwent
surgery to establish orthotopic rat EOC. They were fed sterile
water and food and housed under controlled temperature (at 25±1°C)
and relative humidity (40–60%) conditions, with a 12–12 h
light-dark cycle. The surgical procedures and protocol for the
induction of EOC were performed as previously described (17).
MRI scanning
After anesthetization with pentobarbital sodium (40
mg/kg, i.p.) via the caudal vein, rats underwent MRI scanning using
a 3.0 T scanner (Verio; Siemens Healthineers, Erlangen, Germany)
with a rat coil. The following sequences were obtained: Axial spin
echo (SE) T1 weighted image (WI) = [repetition time (TR)/echo time
(TE)] = 7.29/2.28 msec; axial, sagittal and coronal turbo SE T2WI
with fat saturation = TR/TE = 2,500/93 msec; and turbo SE T2WI =
TR/TE = 8,000/98 msec.
For DCE-MRI, pre-contrasted fast low angle shot-two
dimensional T1WI with fat saturation (TR/TE = 7.92/2.28 msec) was
performed at two different flip angles (3° and 15°) for T1 mapping.
Subsequent to the acquisition of four baseline scans, a dose of 0.2
mmol/kg gadopentetate dimeglumine (Magnevist; Bayer AG, Leverkusen,
Germany) was administered to the rats via the caudal vein at a rate
of 0.3 ml/sec, followed by a bolus injection of 0.4 ml saline at
the same rate. A total of 30 phases of images were sequentially
acquired with intervals of 6 sec. The scan parameters for the
DCE-MRI were as follows: Slice thickness, 1 mm; no gap; spatial
in-plane resolution, 224×370; TR/TE = 5.27/2.14 msec; flip angle,
15°; and field of view, 80×62.5 mm. The total acquisition time was
4 min. DCE-MRI was performed in an axial plane covering the entire
tumor volume.
DCE-MRI processing and analysis
Using tissue four-dimensional software (Siemens
Healthineers) and two-compartment modeling (18), DCE-MRI analysis was performed by two
radiologists, each with 10 years of experience in pelvic MRI, who
were blinded to the original information By avoiding hemorrhage,
necrosis and major vascular structures, regions of interest of
20–50 mm2 in size were manually drawn on the slice to
determine the longest diameter of the ovarian tumor types.
Quantitative parameters, including the volume transfer constant
(Ktrans), rate constant (kep), extravascular
extracellular space volume ratio (ve) and initial area
under the curve (IAUC), were automatically generated. MRI
morphological features, including the tumor size, shape, boundary
and mass configuration, were also assessed on T2WI.
Histopathological and
immunohistochemical (IHC) analysis
Subsequent to validation (Fig. 1B) following the completion of the
MRI scans at every time point, one rat ovary was removed and fixed
for hematoxylin and eosin staining to evaluate the histopathology
and tumor necrosis. IHC staining of VEGF and cluster of
differentiation 31 was performed in order to investigate the
expression of VEGF and the MVD, as previously described (17). A total of three high power fields
(magnification, ×200) were randomly selected and the tumor necrosis
rate was semi-quantitatively analyzed using Image-Pro Plus 6.0
imaging software (Media Cybernetics, Inc., Rockville, MD, USA).
Tumor necrosis rate = necrotic area/field area × 100%.
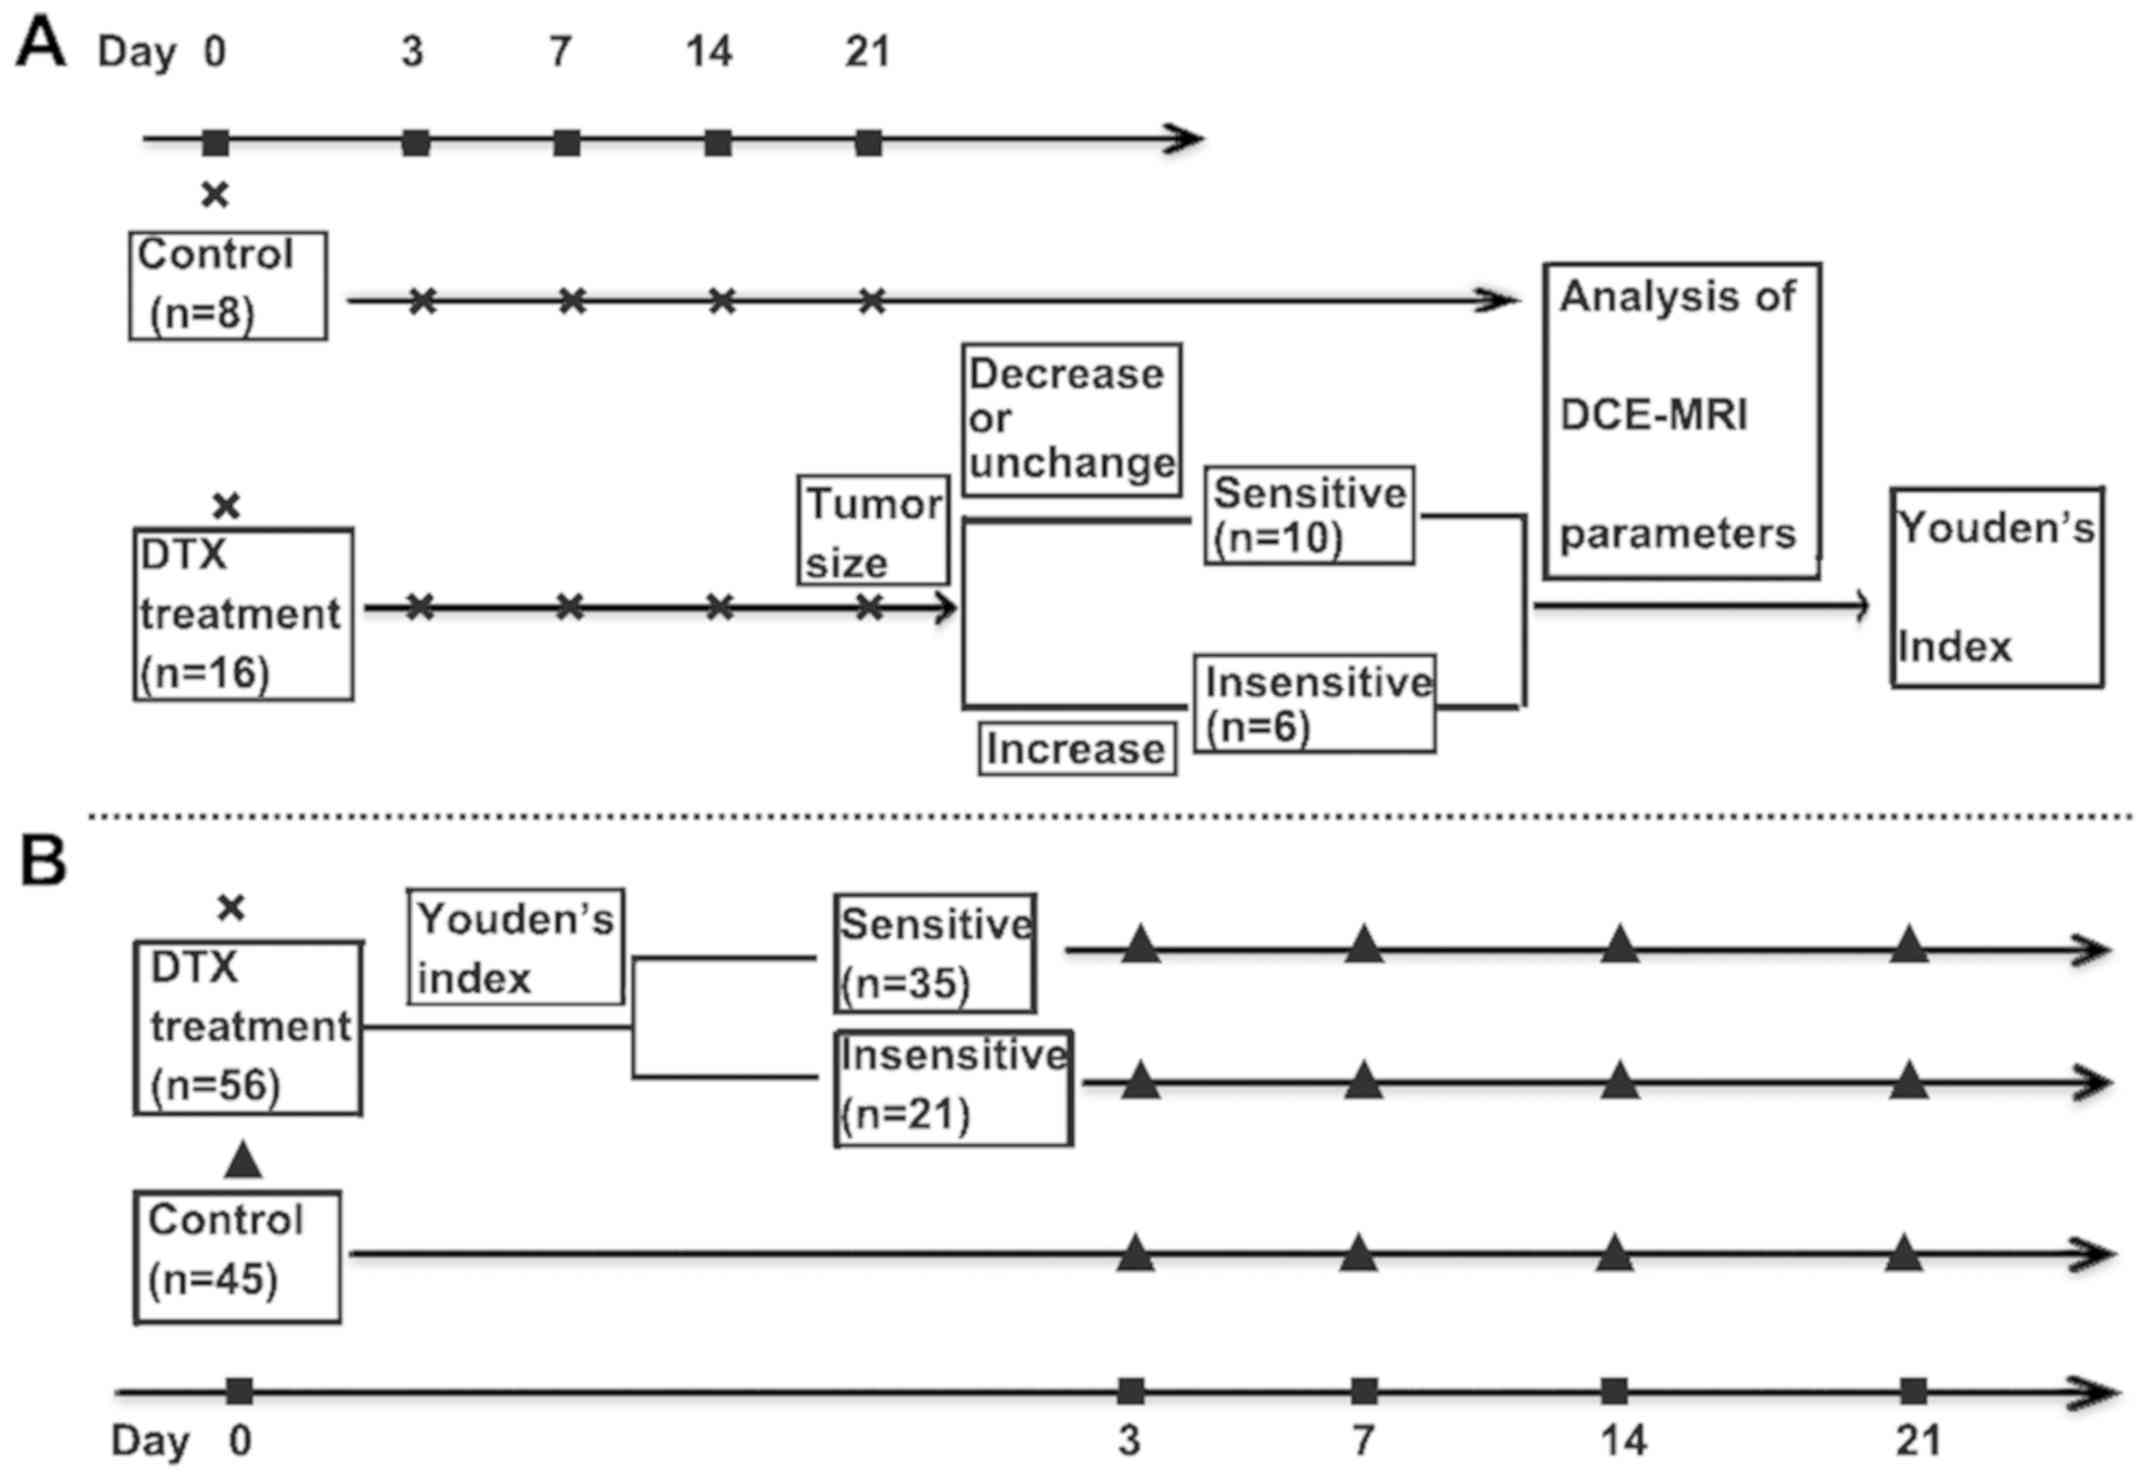 | Figure 1.Flow chart of the study design
showing grouping, treatment and imaging time points. (A) DCE-MRI
was performed for all rats on day 0 after which they were randomly
assigned to treatment and control groups. The rats in the treatment
group received 12 mg/kg DTX on day 0. Post-treatment (day 0) and 3,
7, 14 and 21 days after DTX therapy, all rats underwent MRI
scanning under anesthesia. Twenty-one days after DTX therapy,
tumors with decreased or unchanged longest diameters were
categorized into a sensitive group, with increased ones into an
insensitive group. Youden's index was obtained by means of
retrospective logistic regression analysis of the DCE-MRI
parameters at different time points (Tumor size indicates the
longest diameter; Youden's index indicates the cut-off value that
was the predictive factor for assessing early therapy response at
optimal time point in Δ% of parameters; ‘x’ indicates DCE-MRI; ‘■’
indicates the time of DCE-MRI). (B) The rats received the same
DCE-MRI and DTX as those in A. According to the above cut-off value
at optimal time point, the treatment rats were categorized into
sensitive or insensitive groups. Several rats in the control group
on day 0 and in every group at a different time point were
sacrificed and the tumors were excised for histology (‘▲’ indicates
DCE-MRI and histology). % Change in DCE parameter = (DCE
parametersubsequent to treatment - DCE parameterday
0)/DCE parameterday 0 × 100%. % change in tumor
size = (tumor sizesubsequent to treatment - tumor
sizeday 0)/tumor sizeday 0 × 100%. % change
in MVD/VEGF expression levels/necrosis rate = (MVD/VEGF expression
levels/necrosis ratesubsequent to treatment - MVD/VEGF
expression levels/necrosis rateday 0)/MVD/VEGF
expression levels/necrosis rateday 0 × 100% (Note: The
tumor size indicated the longest diameter of the tumor. MVDday
0, VEGFday 0 and necrosisday 0 were the
mean expression levels of the corresponding biomarkers in the
control group on day 0). DCE-MRI, dynamic contrast enhanced
magnetic resonance imaging; DTX, docetaxel. |
Experimental design
The study consisted of training and validation
phases (Fig. 1). During the
training phase (Fig. 1A), 24 rats
were randomly assigned to treatment (n=16) and control (n=8)
groups. The rats in the treatment group received 12 mg/kg DTX on
day 0, as previously described (19). All rats underwent conventional MRI
and DCE-MRI scanning on days 0, 3, 7, 14 and 21 post-treatment. On
day 21 following DTX therapy, rats with EOCs were divided into a
sensitive group (a tumor with decreased or unchanged tumor size)
and an insensitive group (tumor with increased tumor size)
according to RECIST guidelines and a previous study (20,21).
DCE-MRI parameters and tumor sizes at different time points (days
3, 7, 14 and 21) between the three groups were compared. Youden's
index, which indicated the cut-off value that was used as the
predictive factor for determining an early response to therapy (the
optimal time point for the percentage change in the DCE-MRI
parameters), was obtained using logistic regression analysis and
receiver operating characteristic (ROC) curve analysis. In the
validation phase (Fig. 1B), the
experiment was repeated, and a further 101 rats received the same
DTX therapy and MRI scanning as those in the training phase. The
treatment group was divided into sensitive and insensitive groups
at the optimal time point according to the obtained Youden's index.
A number of rats in every group at different time points and in the
control group on day 0 were sacrificed by cervical dislocation for
histopathological and IHC analyses. In the two phases, only rats
validated to have EOC (confirmed by autopsy and histopathology)
were included in the study. Non-epithelial ovarian tumor types were
excluded from the study. The numbers of rats sacrificed with EOC in
different groups and at different time points are listed in
Table I.
 | Table I.Numbers of rats with epithelial
ovarian cancer in the different groups and at different time points
following treatment. |
Table I.
Numbers of rats with epithelial
ovarian cancer in the different groups and at different time points
following treatment.
| Group | Day 0 | Day 3 | Day 7 | Day 14 | Day 21 |
|---|
| Treatment
group | 56 |
|
|
|
|
| Sensitive
group | 35 (0) | 35 (8) | 27 (8) | 19 (10) | 9 (9) |
| Insensitive
group | 21 (0) | 21 (4) | 17 (6) | 11 (5) | 6 (6) |
| Control group | 45 (10) | 35 (8) | 27 (9) | 18 (10) | 8 (8) |
Statistical analysis
Data were analyzed using SPSS 22.0 (IBM Corp.,
Armonk, NY, USA) and values are presented as the mean ± standard
deviation. One-way analysis of variance was used for data analysis
between multiple groups, and comparisons between every two groups
were performed using Fisher's least significant difference test.
Spearman's correlation analysis was used to analyze the correlation
between the percentage changes in DCE-MRI parameters and the
percentage changes in tumor size, VEGF, MVD and tumor necrosis as
follows: A correlation coefficient between 0.75 and 1.00 was
considered highly relevant, a coefficient between 0.50 and 0.74 was
considered moderately relevant, a coefficient between 0.25 and 0.49
was considered weakly relevant and a coefficient ≤0.249 was not
considered relevant as previously described (22). P<0.05 was considered to indicate
a statistically significant difference.
Results
Tumor size changes in rat EOC
subsequent to DTX therapy
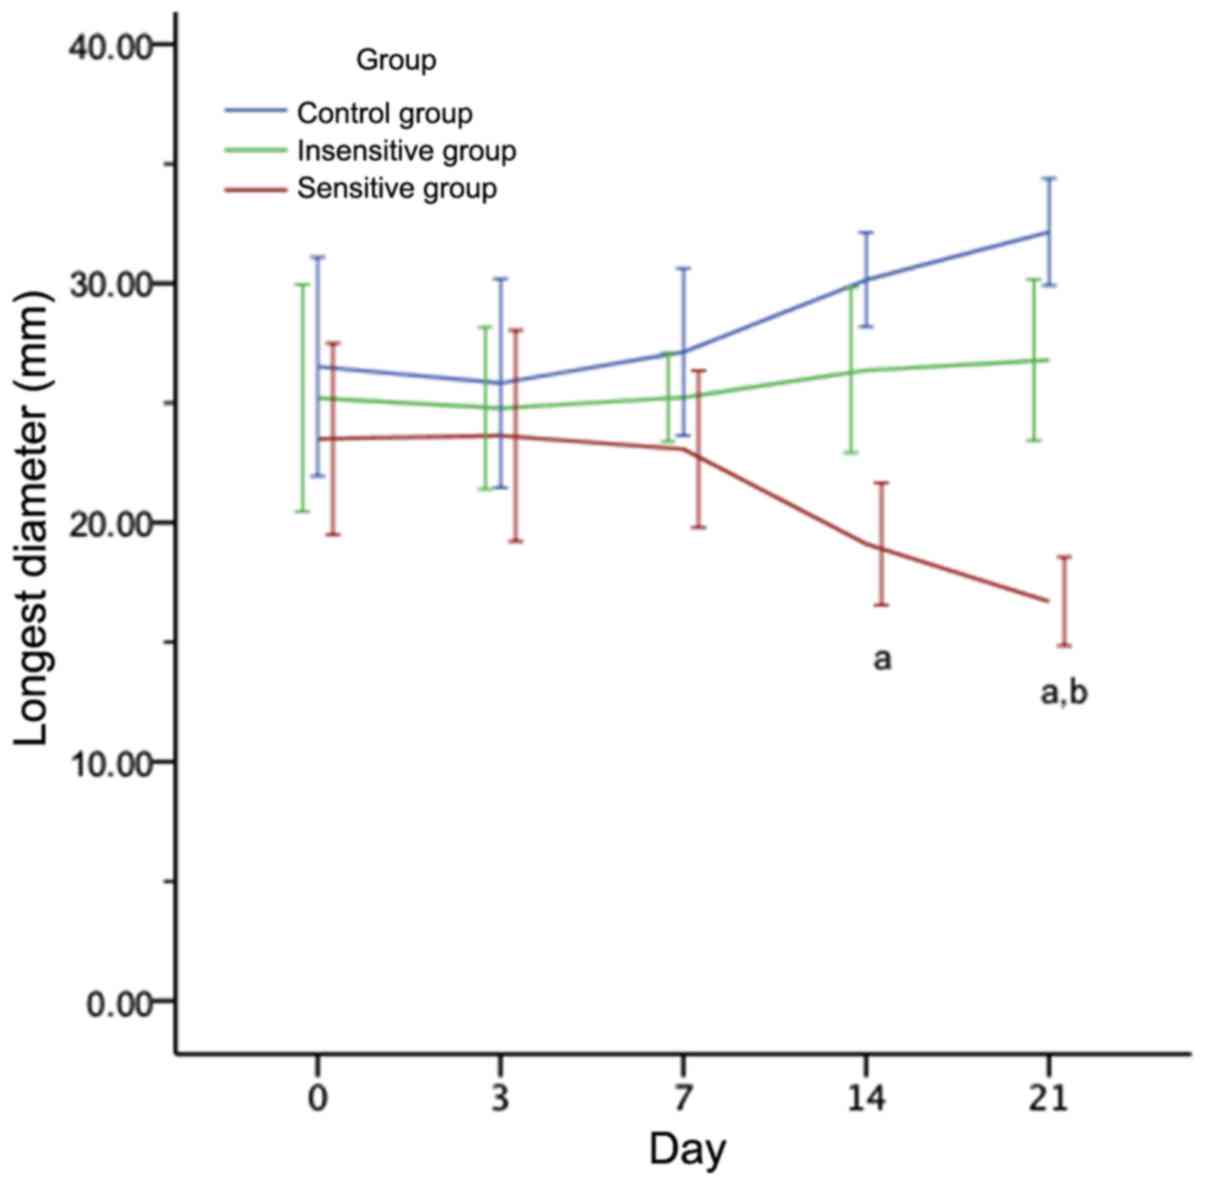
As presented in Fig.
2, on days 0, 3 and 7, the difference in the mean tumor size of
EOC among the three groups was not significant (P>0.05). From
day 14 onwards following DTX administration, the tumor size of the
sensitive group was significantly decreased compared with the
insensitive and control groups (P<0.05). As presented in
Table II, the percentage change in
tumor size was not significantly different between the three groups
on day 3 (P>0.05). On day 7, there remained no significant
difference in the sensitive group compared with the insensitive
group (P>0.05), but there was a significant decrease in the
sensitive group compared with the control group (P=0.028). On days
14 and 21, significant differences were observed between the
sensitive and insensitive or control groups (P<0.05). However,
there was no significant difference between the insensitive and
control groups (P>0.05).
| Table II.The change rate in the tumor size at
different time points (%). |
Table II.
The change rate in the tumor size at
different time points (%).
| Group | Day 3 | Day 7 | Day 14 | Day 21 |
|---|
| Sensitive | −2.17±5.35 |
−4.82±5.14a |
−10.90±3.05a,b |
−30.46±3.05a,b |
| Insensitive | 4.09±6.69 | 5.53±4.77 | 5.44±2.95 | 20.58±4.24 |
| Control | 8.53±4.33 | 14.77±5.63 | 22.41±8.26 | 37.49±9.64 |
DCE-MRI parameter changes in rat EOC
subsequent to DTX therapy
On days 0, 3 and 7, there were no significant
differences in the DCE-MRI parameters (Ktrans,
kep and IAUC) of the EOC compared between the three
groups (P>0.05). On days 14 and 21, there were significant
differences obtained in all pairwise comparisons (P<0.05),
except for Ktrans, kep and IAUC in the
insensitive group compared with the control group (Fig. 3). The percentage changes of the
DCE-MRI parameters in the different groups at different time points
are summarized in Table III. On
days 3, 7, 14 and 21, there were significant differences in the
pairwise comparisons between the percentage change of the DCE-MRI
parameters (Ktrans, kep and IAUC), except for
the comparison of the insensitive group with the control group. The
ve and percentage change in the ve lacked
significant differences between the three groups at all time points
(P>0.05). Figs. 4 and 5 present representative MRI images of the
sensitive and insensitive groups respectively.
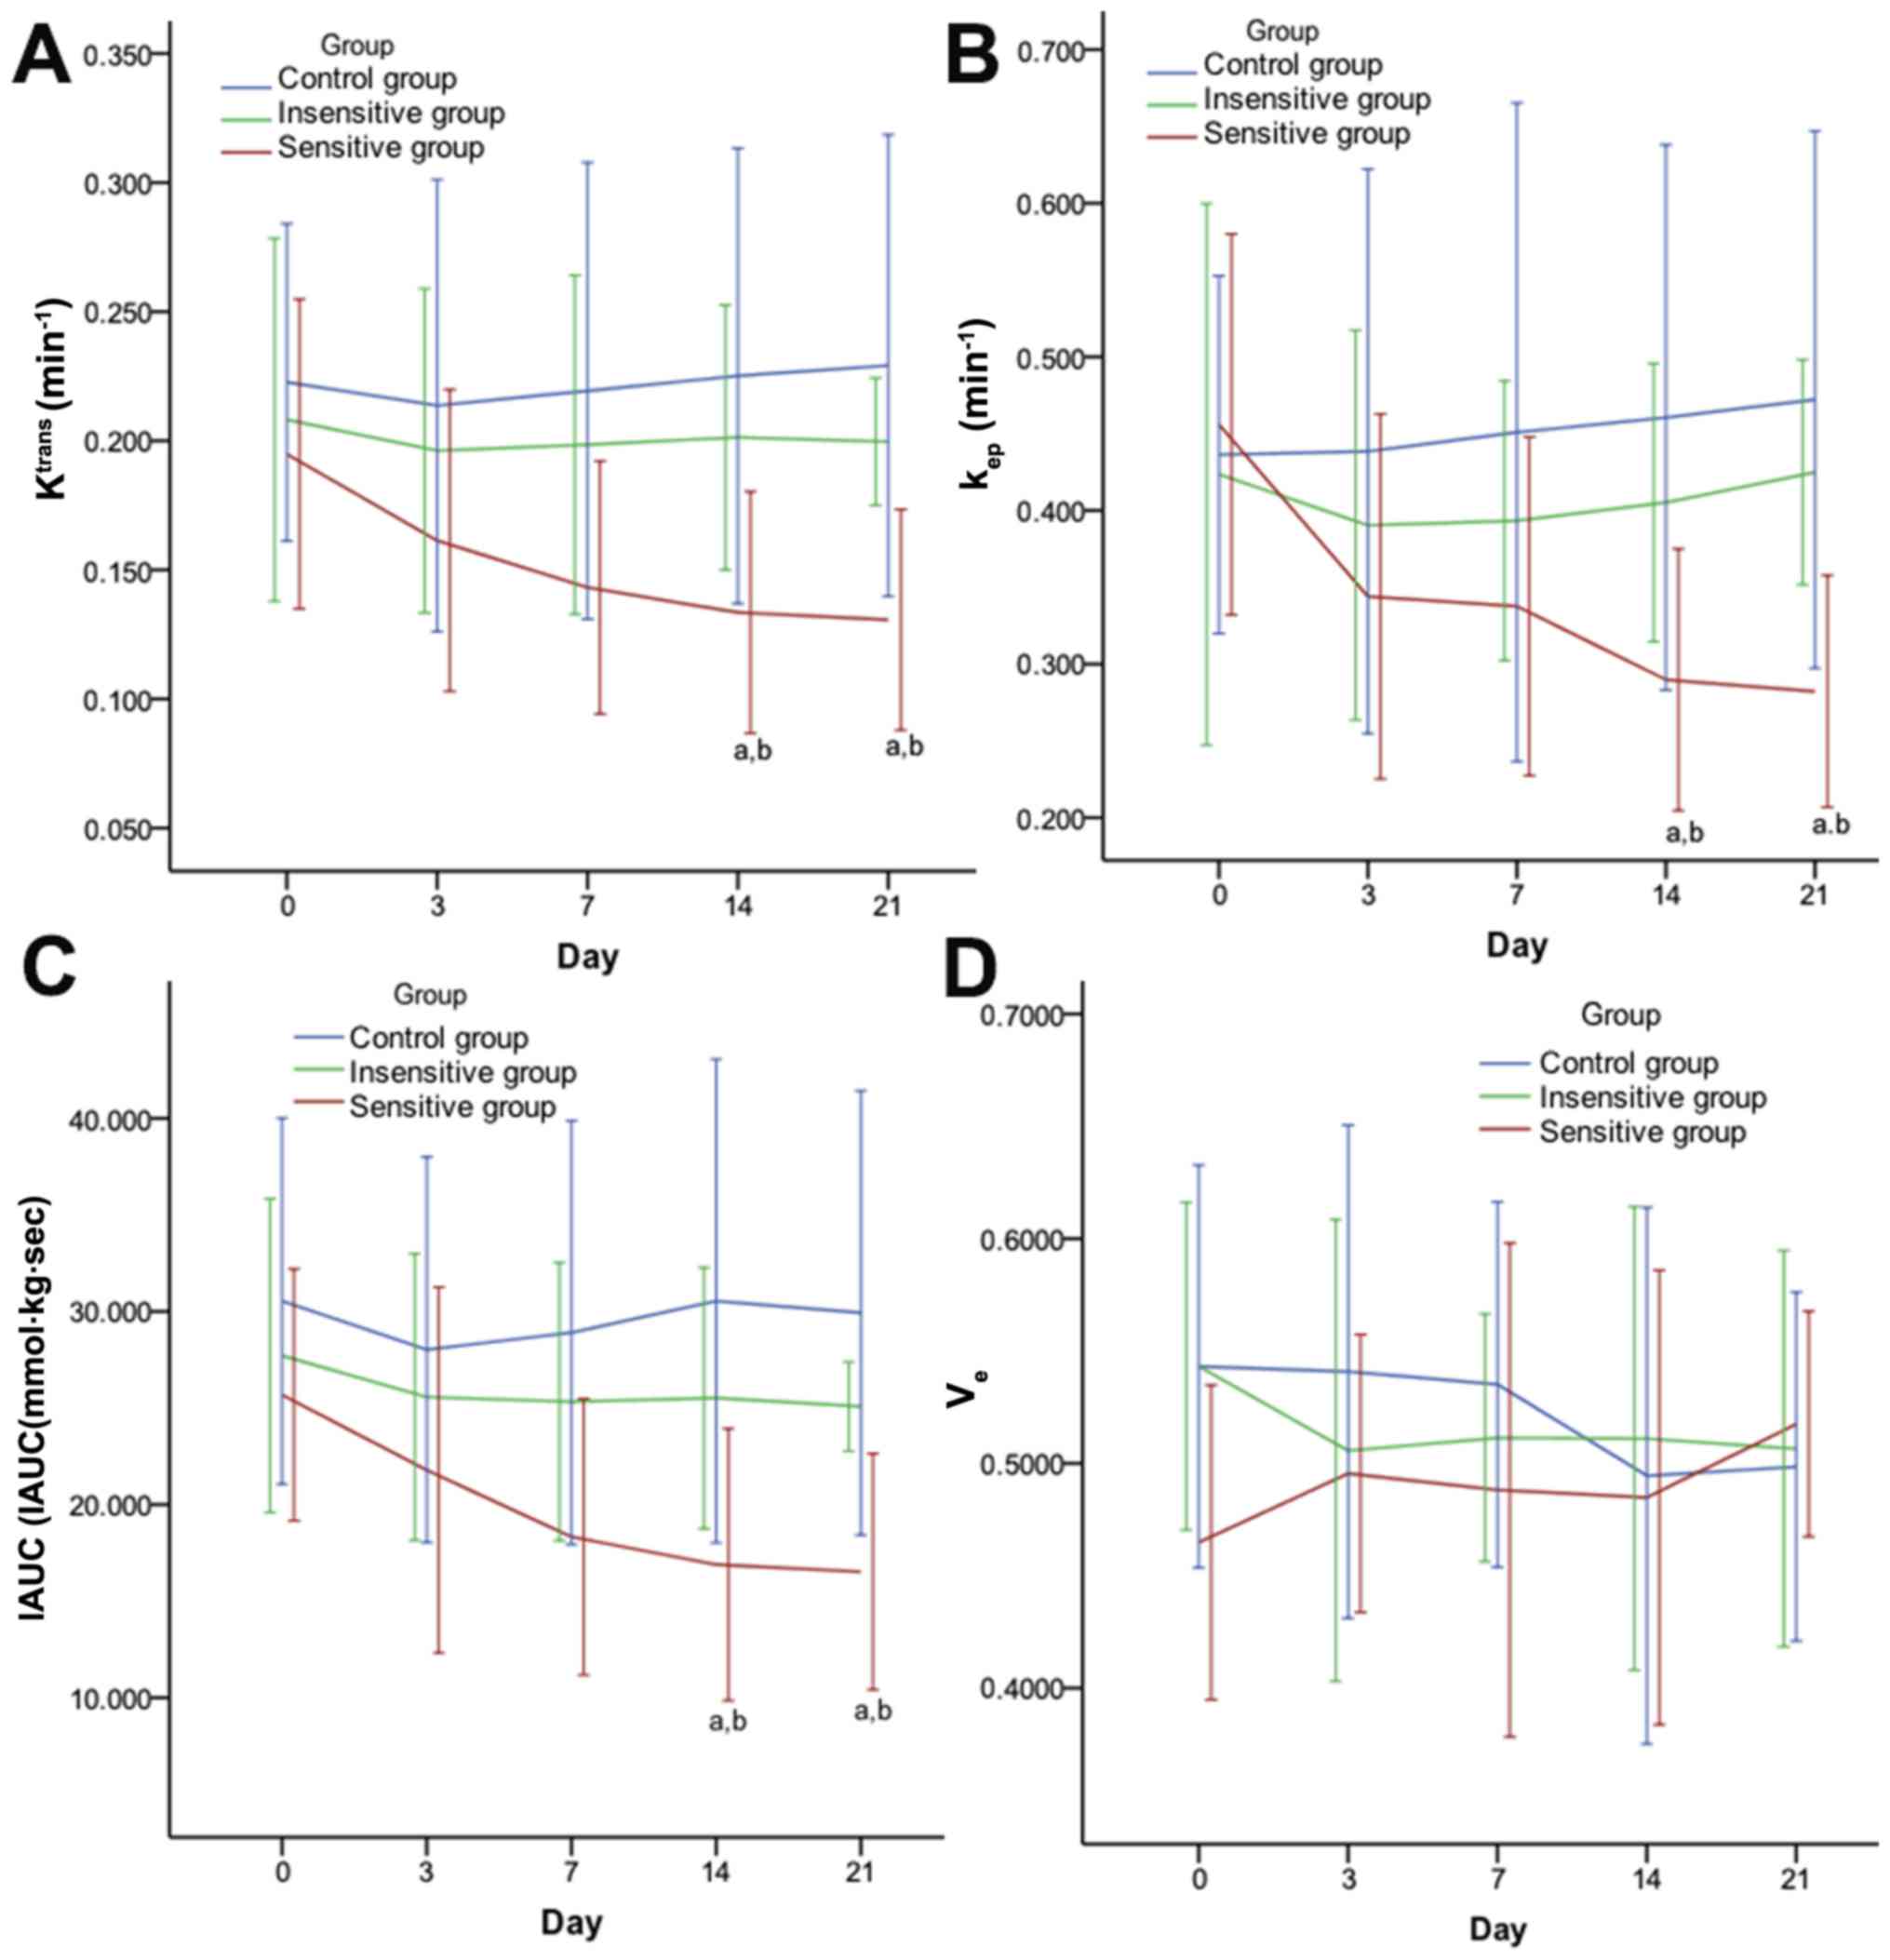 | Figure 3.Effect of DTX on DCE-MRI parameters
in rat EOC. Quantitative parameters [(A) Ktrans, (B)
kep, (C) IAUC and (D) ve] were achieved with
Tissue 4D software and two-compartment (Tofts) modeling (Verio;
Siemens Healthineers, Erlangen, Germany). From day 14 after DTX
administration, DCE-MRI parameters, Ktrans (A),
kep (B), IAUC (C) included, of the sensitive group were
significantly decreased compared to its insensitive and control
counterparts. Data are represented as means ± standard deviation.
aP<0.05 vs. control; bP<0.05 vs.
insensitive. DTX, docataxel; DCE-MRI, dynamic contrast enhanced
magnetic resonance imaging. Ktrans, volume transfer
constant; kep, rate constant; ve,
extravascular extracellular space volume ratio; IAUC, initial area
under the curve. |
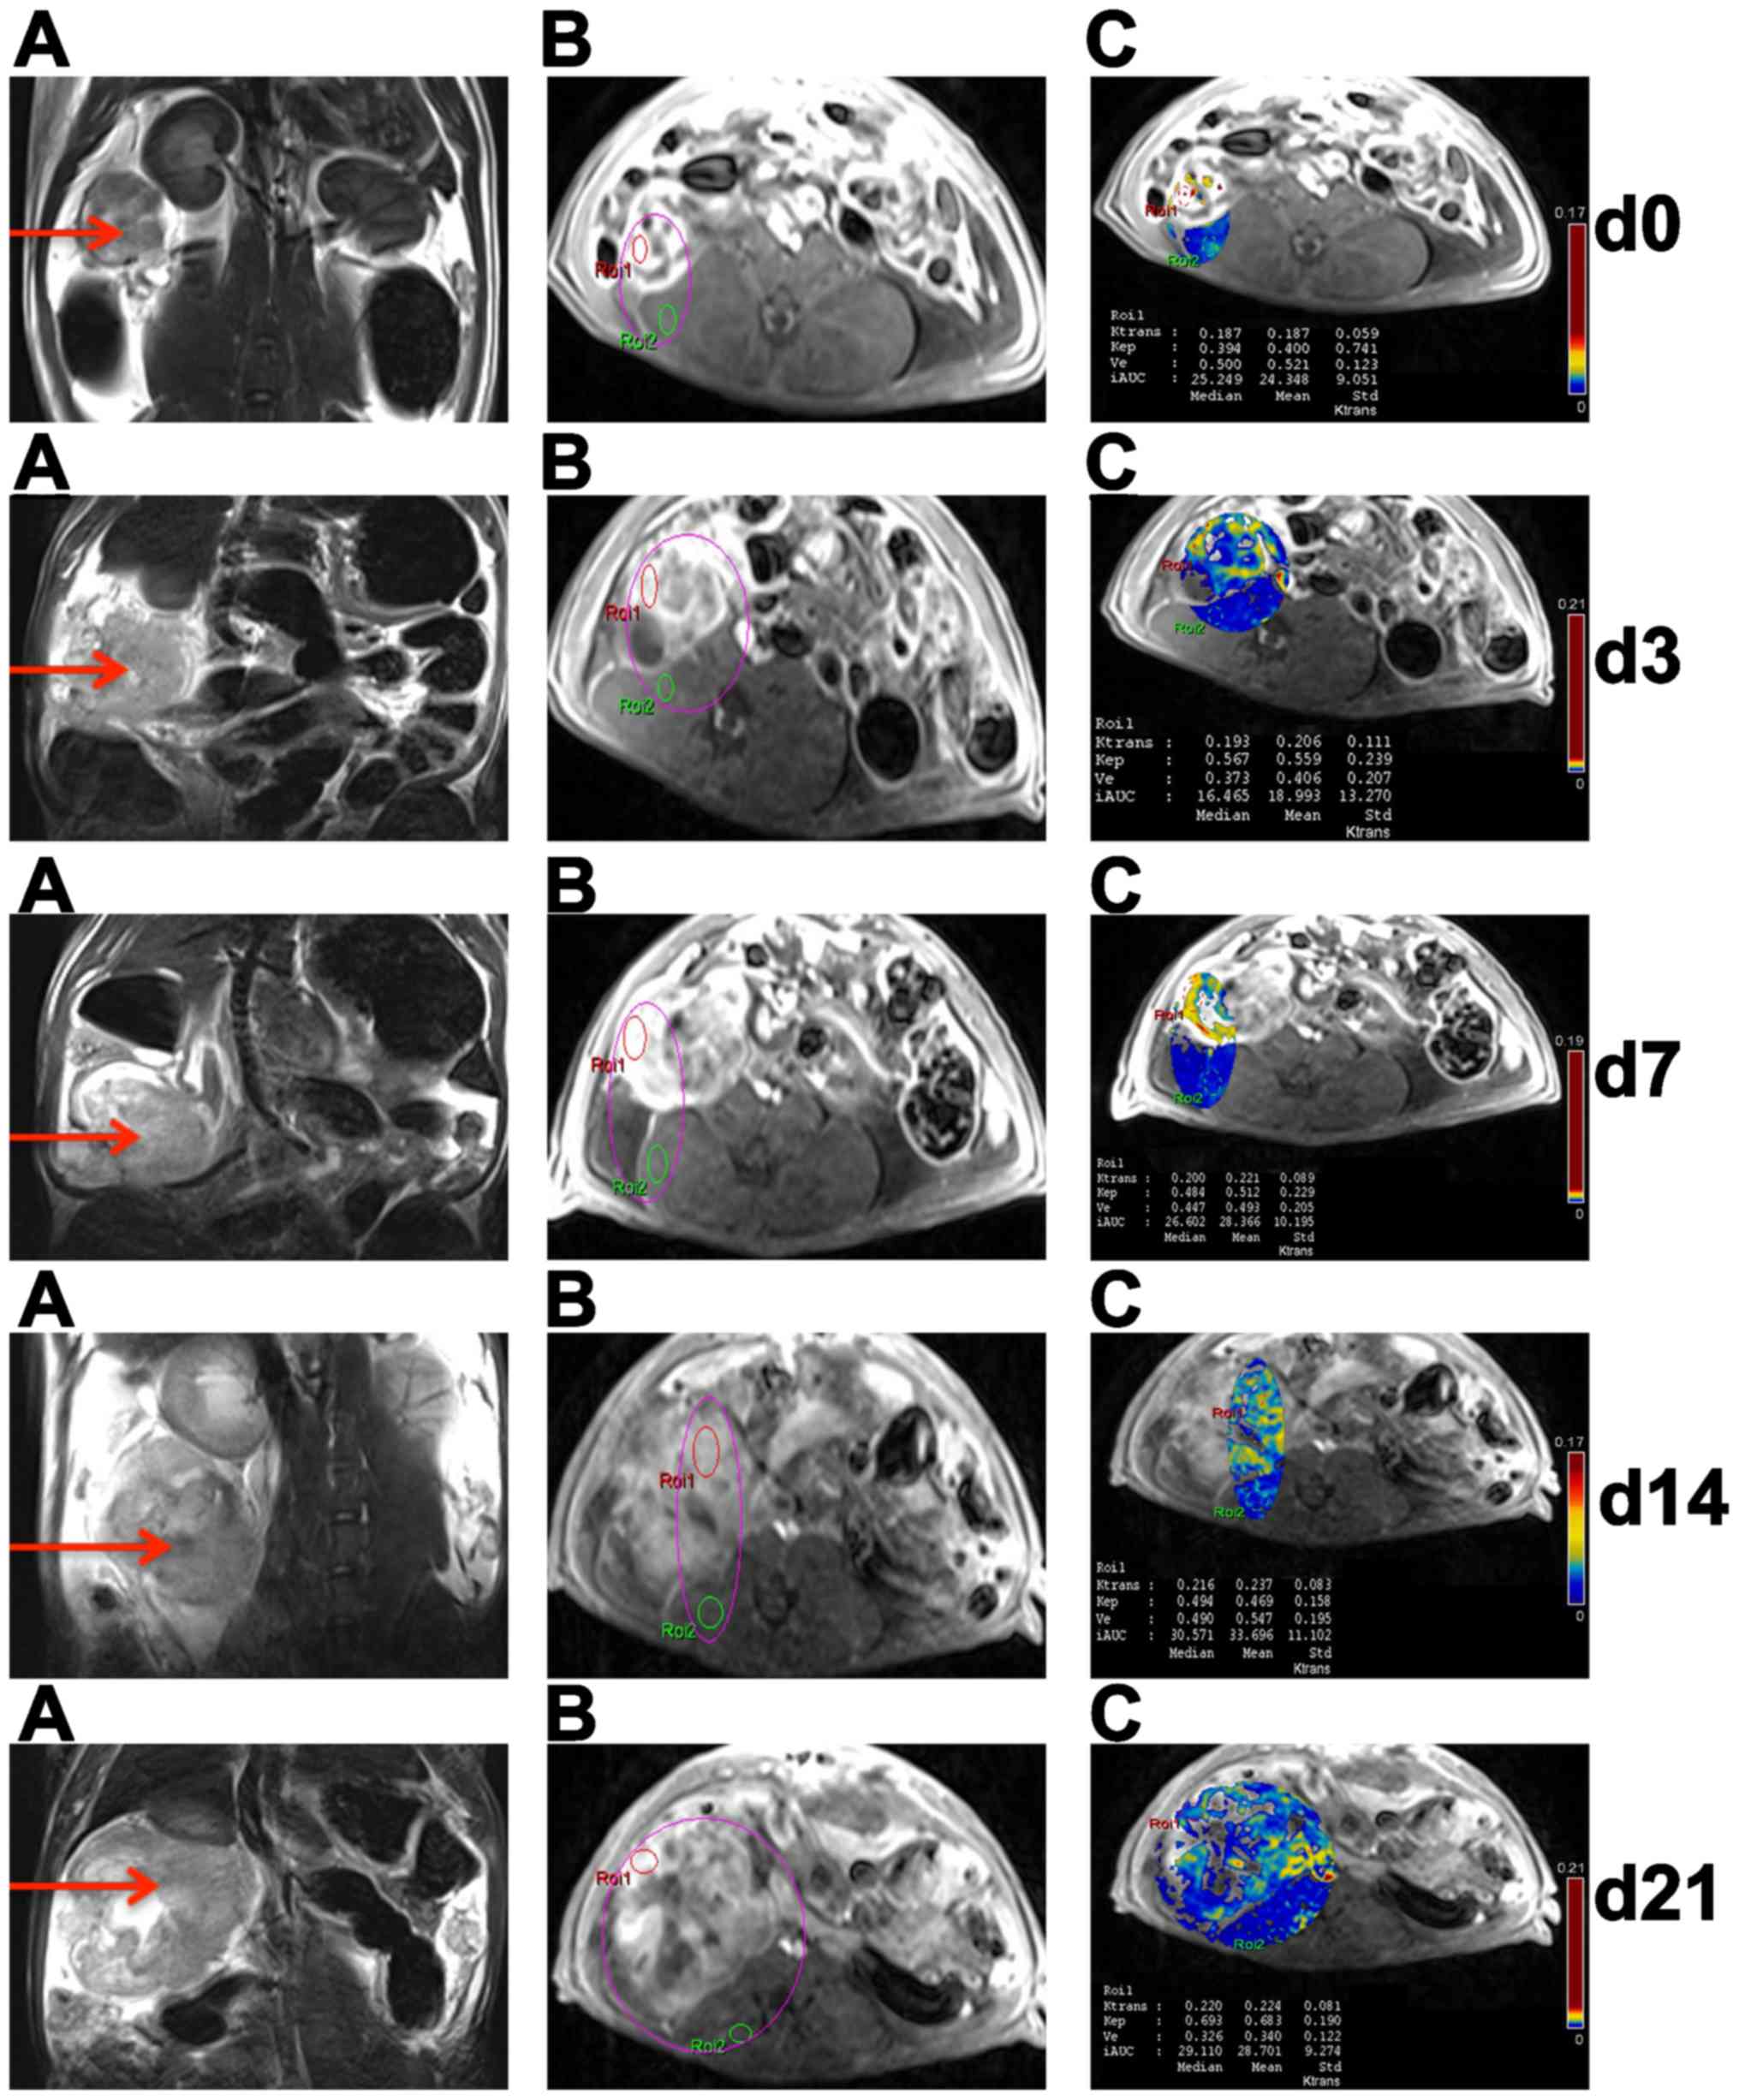
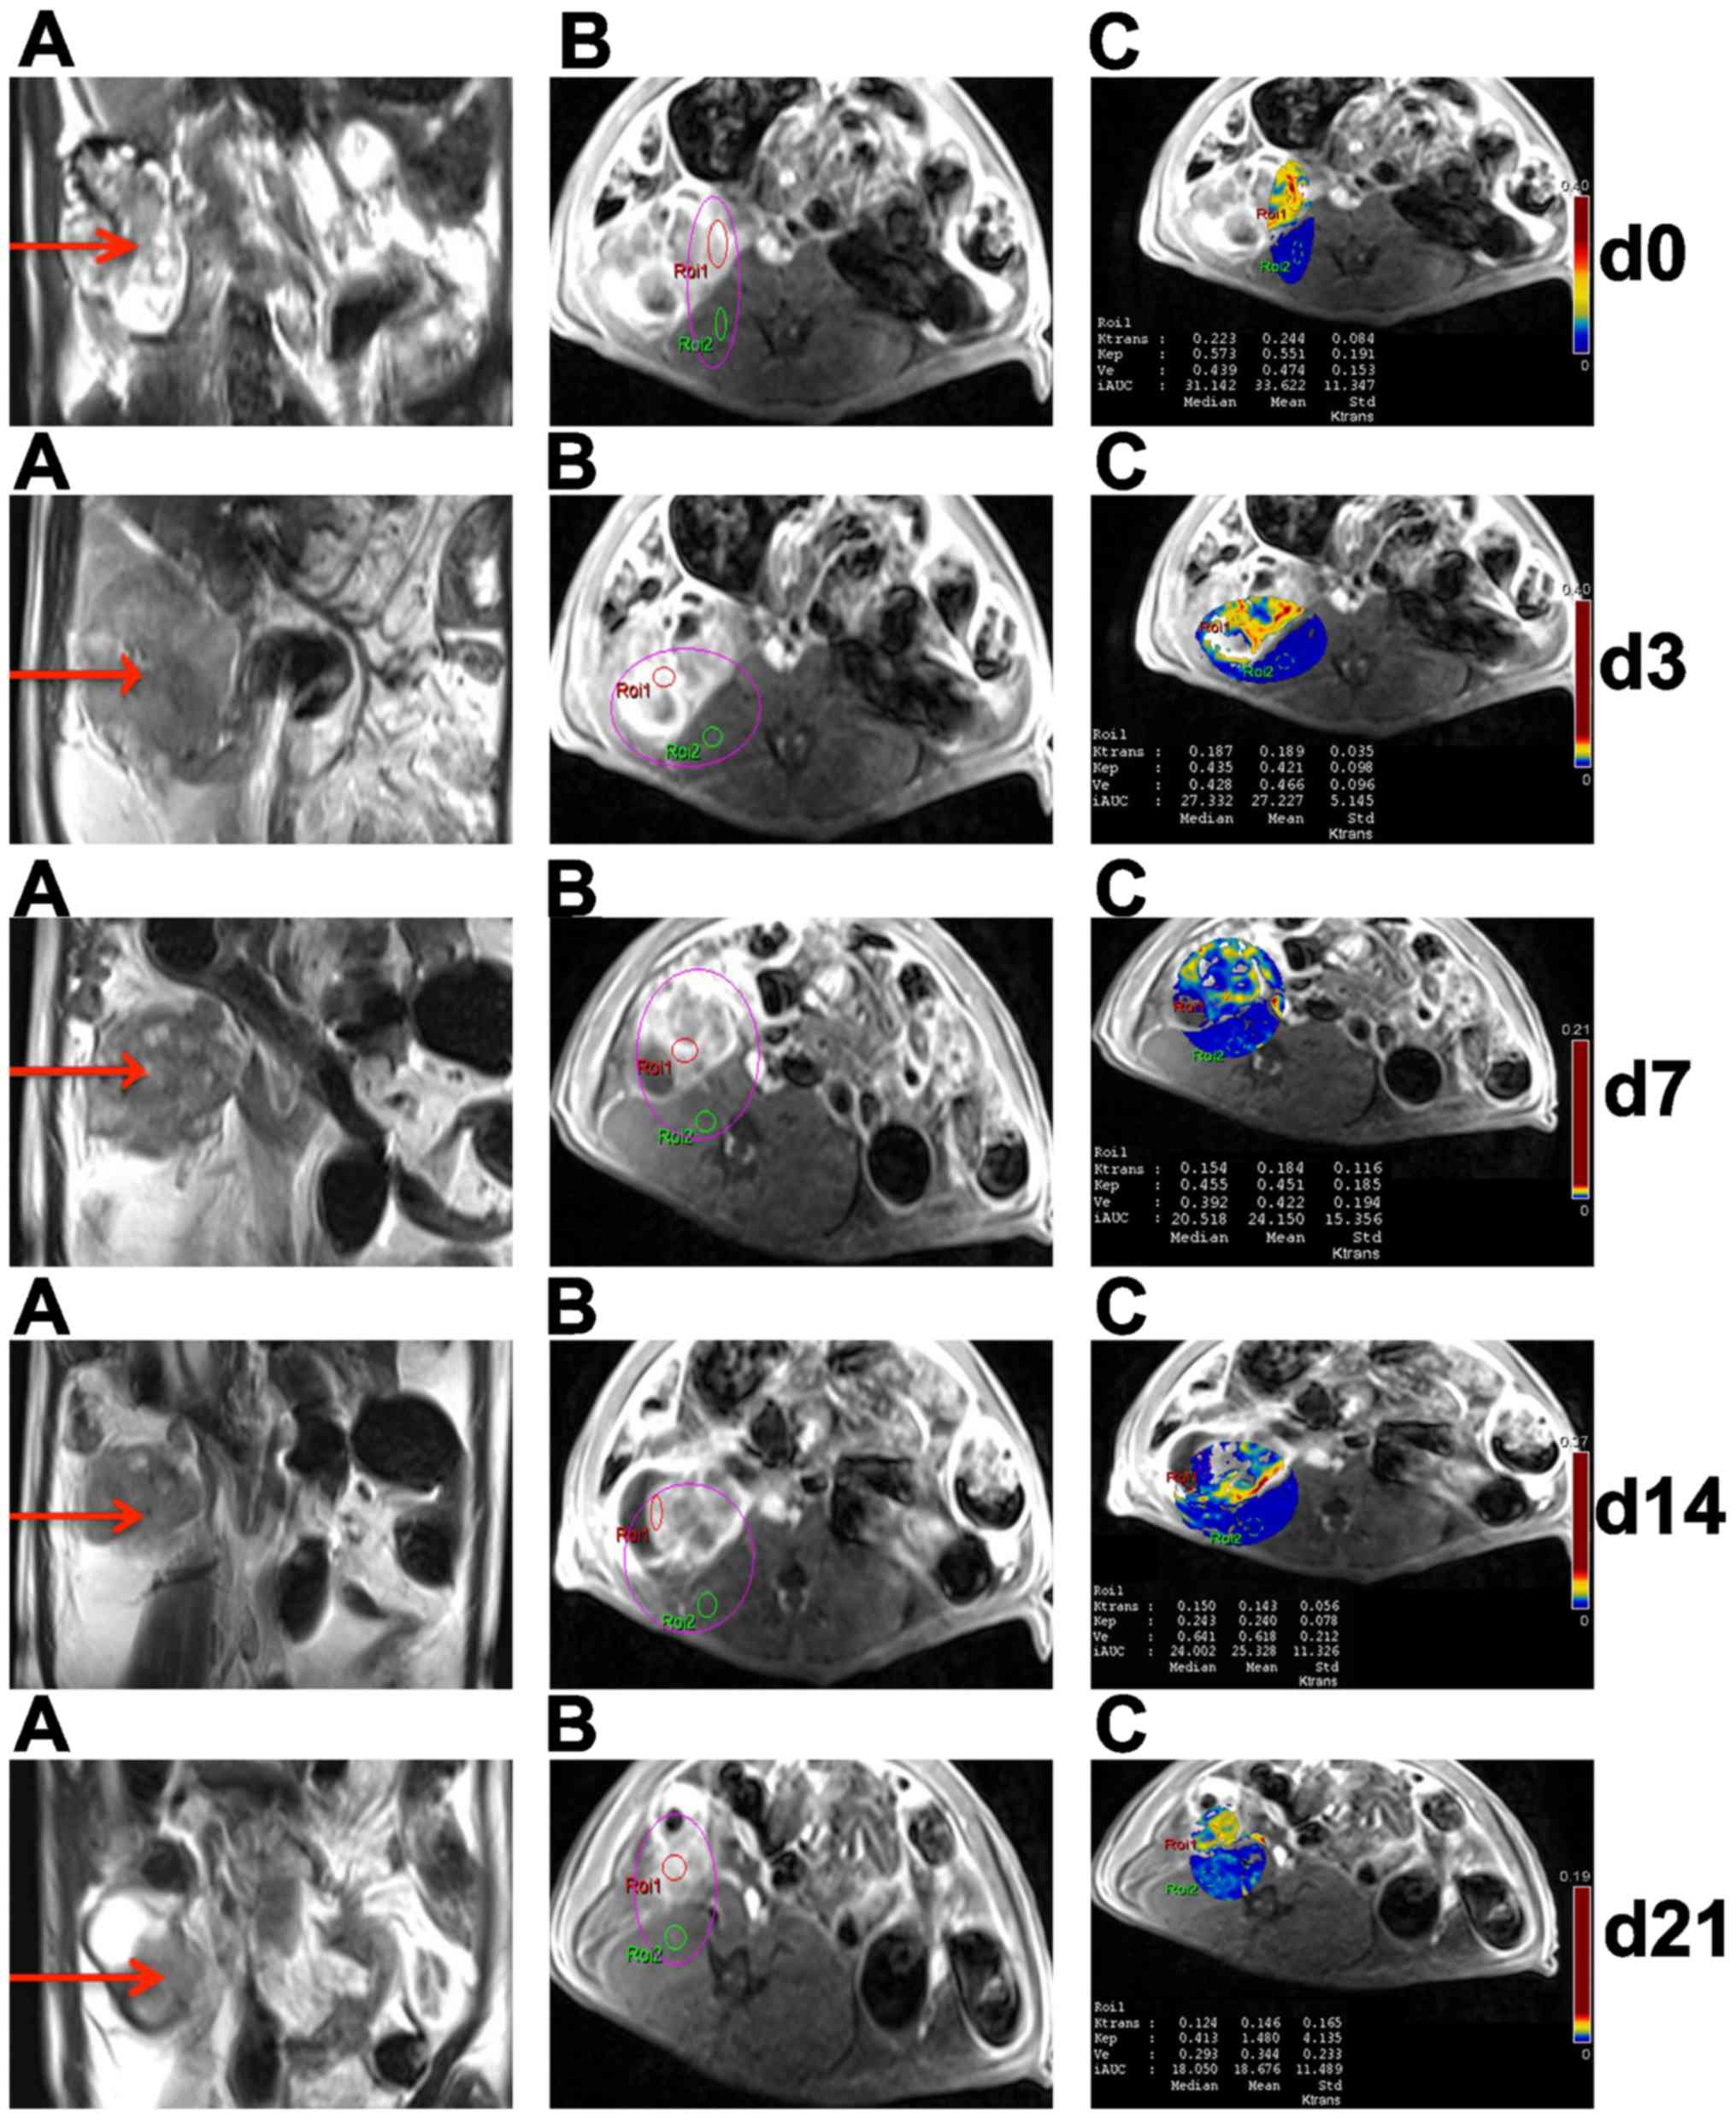 | Figure 4.Conventional and DCE-MRI of EOC in
sensitive rats at different time points. In the right adnexal area,
a multilocular cystic-solid EOC (red arrow) progressively became
smaller on T2WI (A). On DCE-MRI, ROI 1 and ROI 2 were located in
ovarian EOC and muscle, respectively (B); DCE-MRI parameters
(Ktrans, kep, ve and IAUC) of EOC
in ROI 1 were obtained by quantitatively analyzing software on
pseudo-color images (C). DCE-MRI, dynamic contrast enhanced
magnetic resonance imaging; EOC, epithelial ovarian cancer; T2WI,
T2-weighted imaging; ROI, region of interest; Ktrans,
volume transfer constant; kep, rate constant;
ve, extravascular extracellular space volume ratio;
IAUC, initial area under the curve. |
 | Figure 5.Conventional and DCE-MRI of EOCs in
insensitive rat at different time points. In the right adnexal
area, a multilocular cystic-solid EOC (red arrow) progressively
became larger on T2WI (A). On DCE-MRI, ROI 1 and ROI 2 were located
in ovarian EOC and muscle, respectively (B); DCE-MRI parameters
(Ktrans, kep, ve and IAUC) of EOC
in ROI 1 were obtained by quantitatively analyzing software on
pseudo-color images (C). DCE-MRI, dynamic contrast enhanced
magnetic resonance imaging; EOC, epithelial ovarian cancer; T2WI,
T2-weighted imaging; ROI, region of interest; Ktrans,
volume transfer constant; kep, rate constant;
ve, extravascular extracellular space volume ratio;
IAUC, initial area under the curve. |
| Table III.Change in dynamic contrast
enhanced-magnetic resonance imaging parameters at different time
points (%). |
Table III.
Change in dynamic contrast
enhanced-magnetic resonance imaging parameters at different time
points (%).
| Time | Group | % Change in volume
transfer constant | % Change in rate
constant | % Change in
extravascular extracellular space volume ratio | % Change in initial
area under the curve |
|---|
| Day 3 | Sensitive |
−20.55±2.40a,b |
−22.44±5.65a,b | 6.38±9.39 |
−17.83±4.28a,b |
|
| Insensitive | −3.28±4.28 | −0.51±5.50 | −0.99±4.92 | −1.56±2.55 |
|
| Control | 6.75±1.70 | 9.06±7.42 | −1.42±8.98 | 5.08±3.61 |
| Day 7 | Sensitive |
−29.19±1.92a,b |
−23.39±4.04a,b | −9.19±10.12 |
−29.11±1.93a,b |
|
| Insensitive | −1.56±4.53 | −5.57±3.57 | −0.67±14.39 | −2.93±5.64 |
|
| Control | 9.87±1.55 | 9.51±17.05 | −3.28±6.71 | 7.40±3.31 |
| Day 14 | Sensitive |
−34.04±3.05a,b |
−32.88±5.36a,b | 3.69±8.03 |
−33.32±5.71a,b |
|
| Insensitive | 1.80±5.46 | −2.73±5.81 | 6.69±8.19 | −1.65±4.35 |
|
| Control | 13.05±1.19 | 15.89±7.15 | −5.85±10.35 | 12.47±4.68 |
| Day 21 | Sensitive |
−33.80±4.44a,b |
−32.85±7.27a,b | −8.52±7.14 |
−33.17±6.47a,b |
|
| Insensitive | 3.48±6.44 | 4.48±9.93 | 3.35±8.09 | 0.34±8.70 |
|
| Control | 15.14±1.26 | 18.92±8.36 | −5.29±8.63 | 11.32±4.62 |
ROC evaluation based on DCE-MRI
parameters
On days 0, 3 and 7, the Ktrans,
kep, ve and IAUC did not achieve a
statistically significant difference in the sensitive group
compared with the insensitive or control groups, for monitoring and
evaluating the response to DTX therapy in EOC. On day 14,
Ktrans and kep were able to be used to
evaluate the efficacy of DTX in EOC, and the AUCs, sensitivities
and specificities of Ktrans and kep were
0.917 and 0.889, 83.3 and 100% and 100 and 66.7%, respectively. On
day 21, the AUCs, sensitivities and specificities of the two
parameters were 0.917 and 0.917, 83.3 and 100% and 83.3 and 83.3%,
respectively. However, as early as day 3, the percentage changes in
Ktrans combined with kep were able to be used
to evaluate the efficacy of DTX in EOC, and the AUC, sensitivity
and specificity were 1, 100 and 100%, respectively. Youden's index
revealed a 17.59% reduction in Ktrans and
kep.
Effective DTX therapy decreases MVD
and VEGF expression in rat EOC
On day 3, the treatment group was divided into the
sensitive and insensitive groups, with a ~17.59% reduction in
Ktrans and kep. The specimens collected from
the rats with EOC are described in Table I. As presented in Figs. 6 and 7 and Table
IV, on days 7, 14 and 21, the MVD and VEGF expression levels or
the percentage change in the MVD and VEGF expression levels were
significantly different between the three groups and pairwise
comparisons (P<0.05), except for in the insensitive group
compared with the control group (P>0.05).
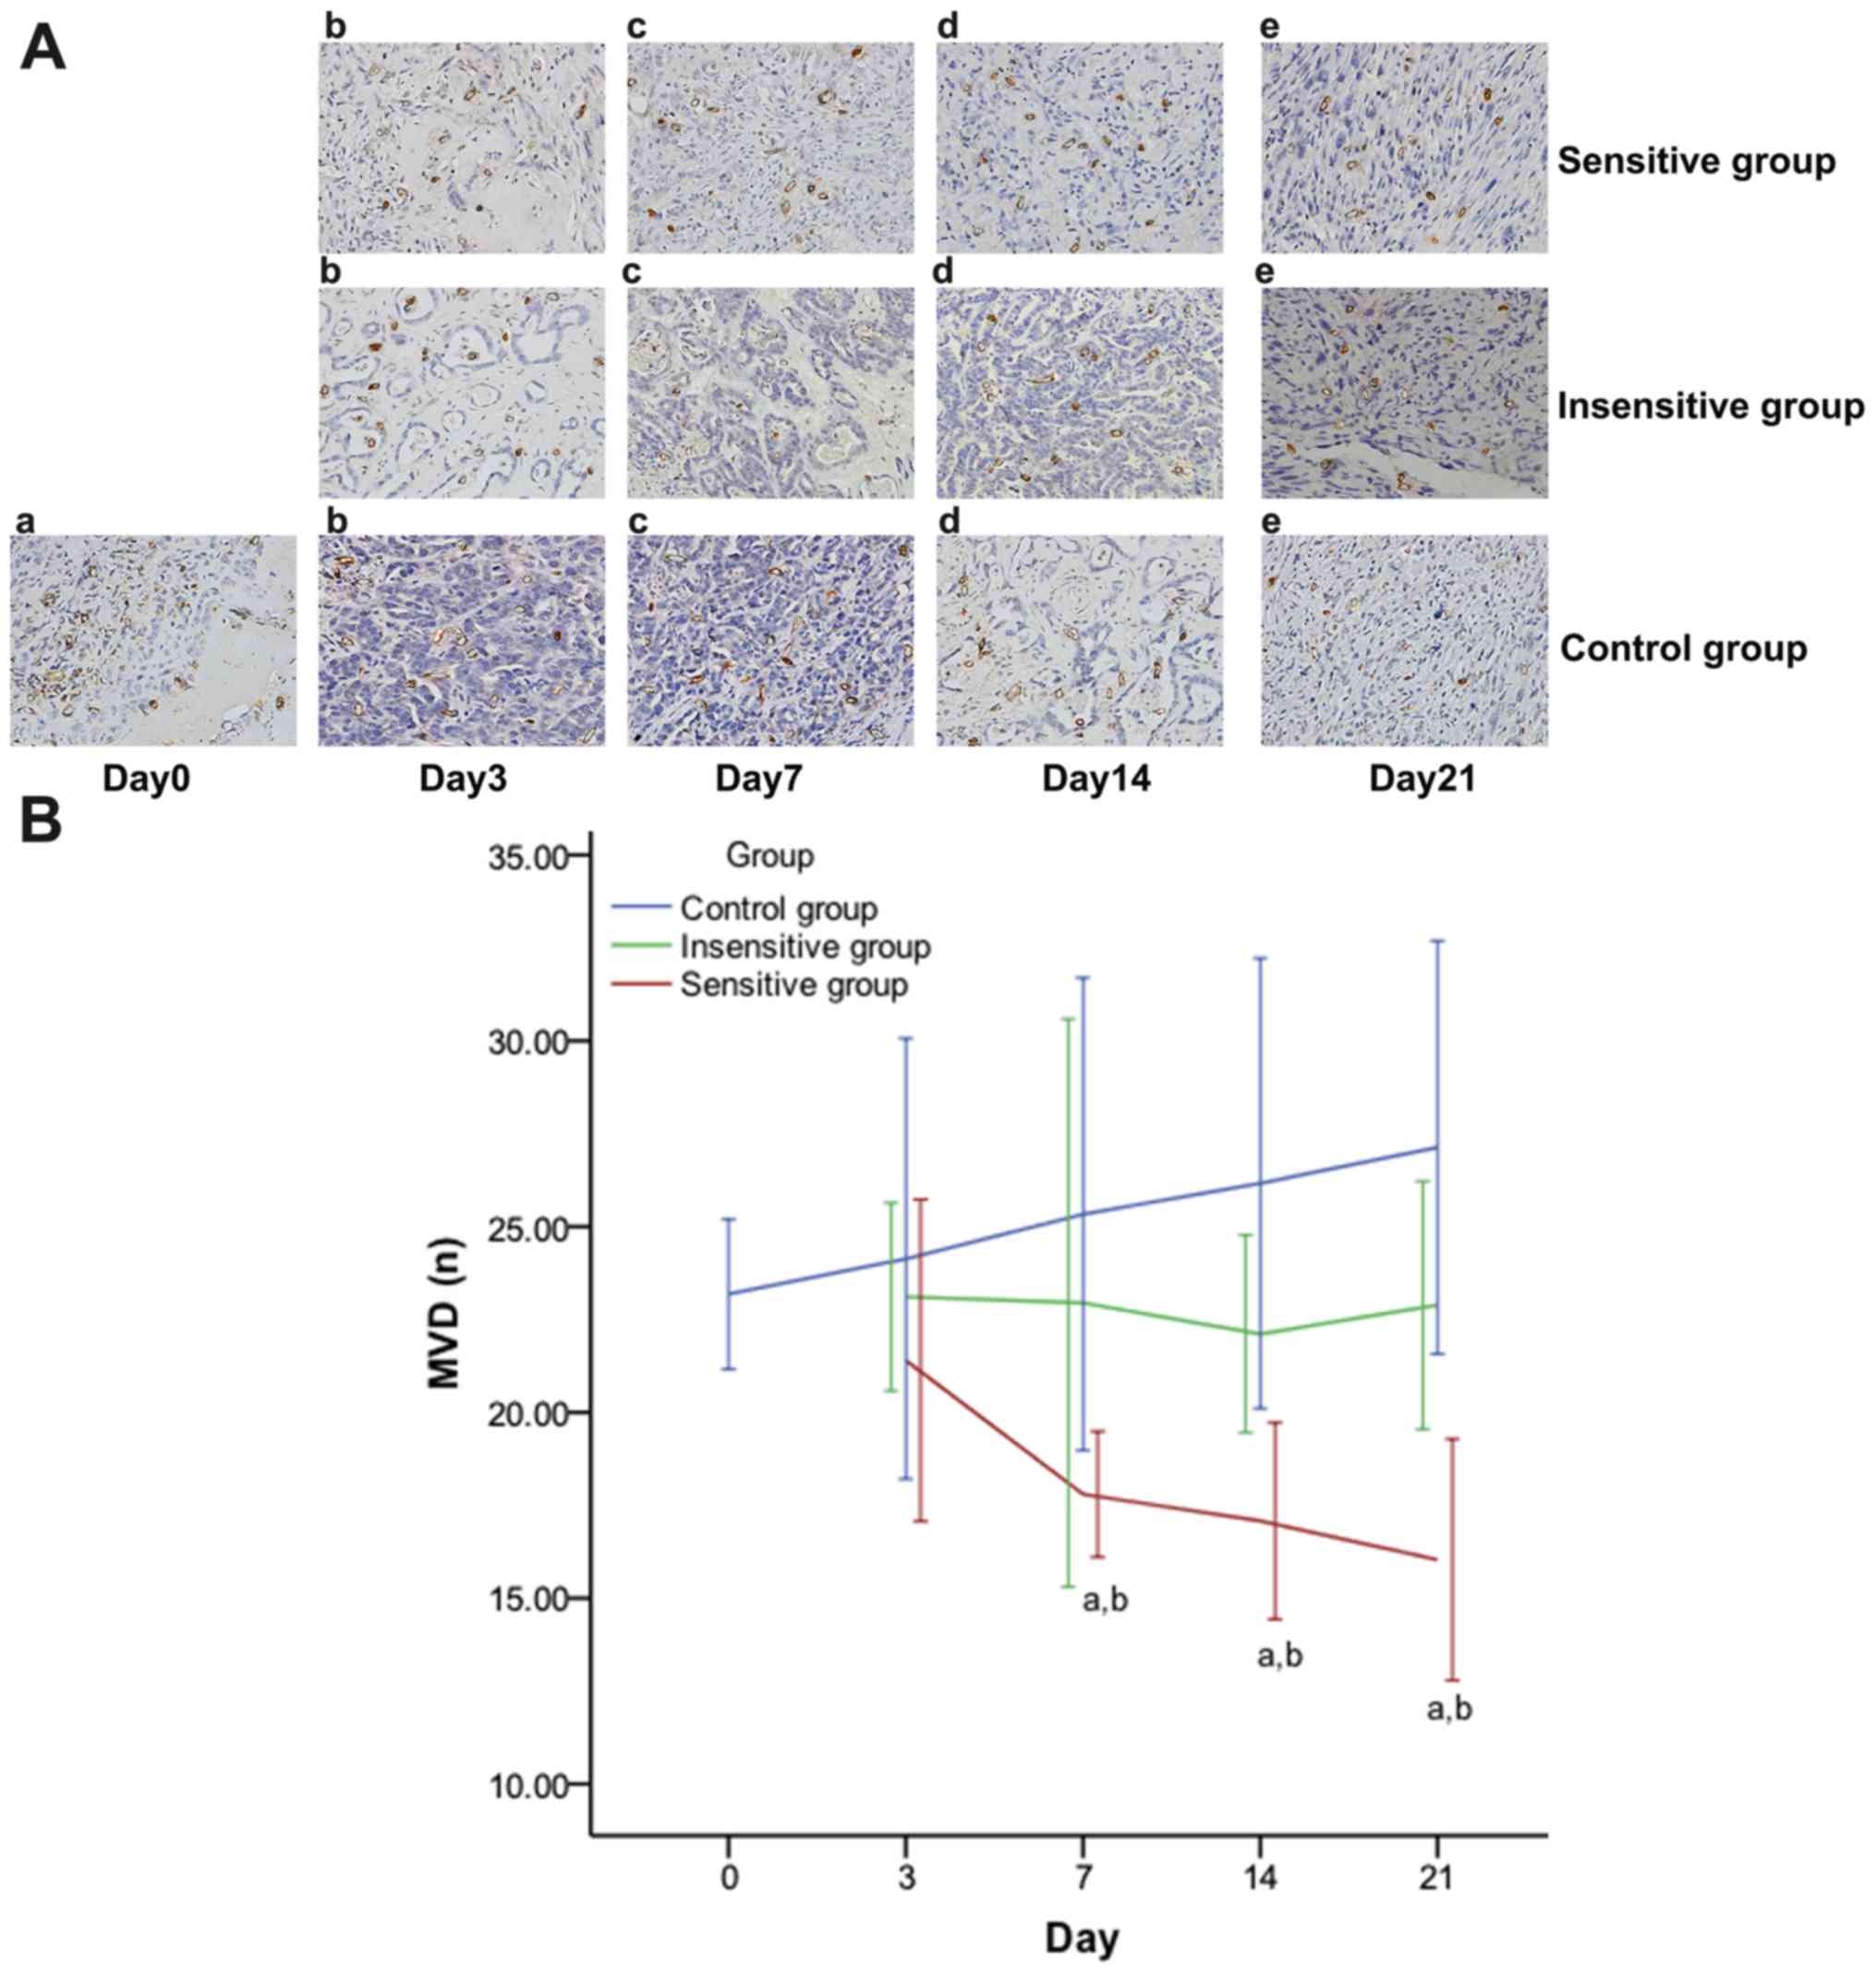 | Figure 6.Effect of DTX on MVD in rat EOC.
Images obtained under a microscope (high power field magnification,
×200) on (a) day 0, (b) day 3, (c) day 7, (d) day 14, (e) day 21
post-treatment, presenting the expression of MVD (A), which were
observed to have brown microvessels. The MVD decreased in the
sensitive group, but increased in the insensitive or control group.
On days 7, 14 and 21, MVD expression (B) was significantly
different between the three groups and pairwise comparisons, except
for insensitive vs. control. Data are represented as means ±
standard deviation. aP<0.05 vs. control;
bP<0.05 vs. insensitive. DTX, docataxel; MVD,
microvessel density; EOC, epithelial ovarian cancer. |
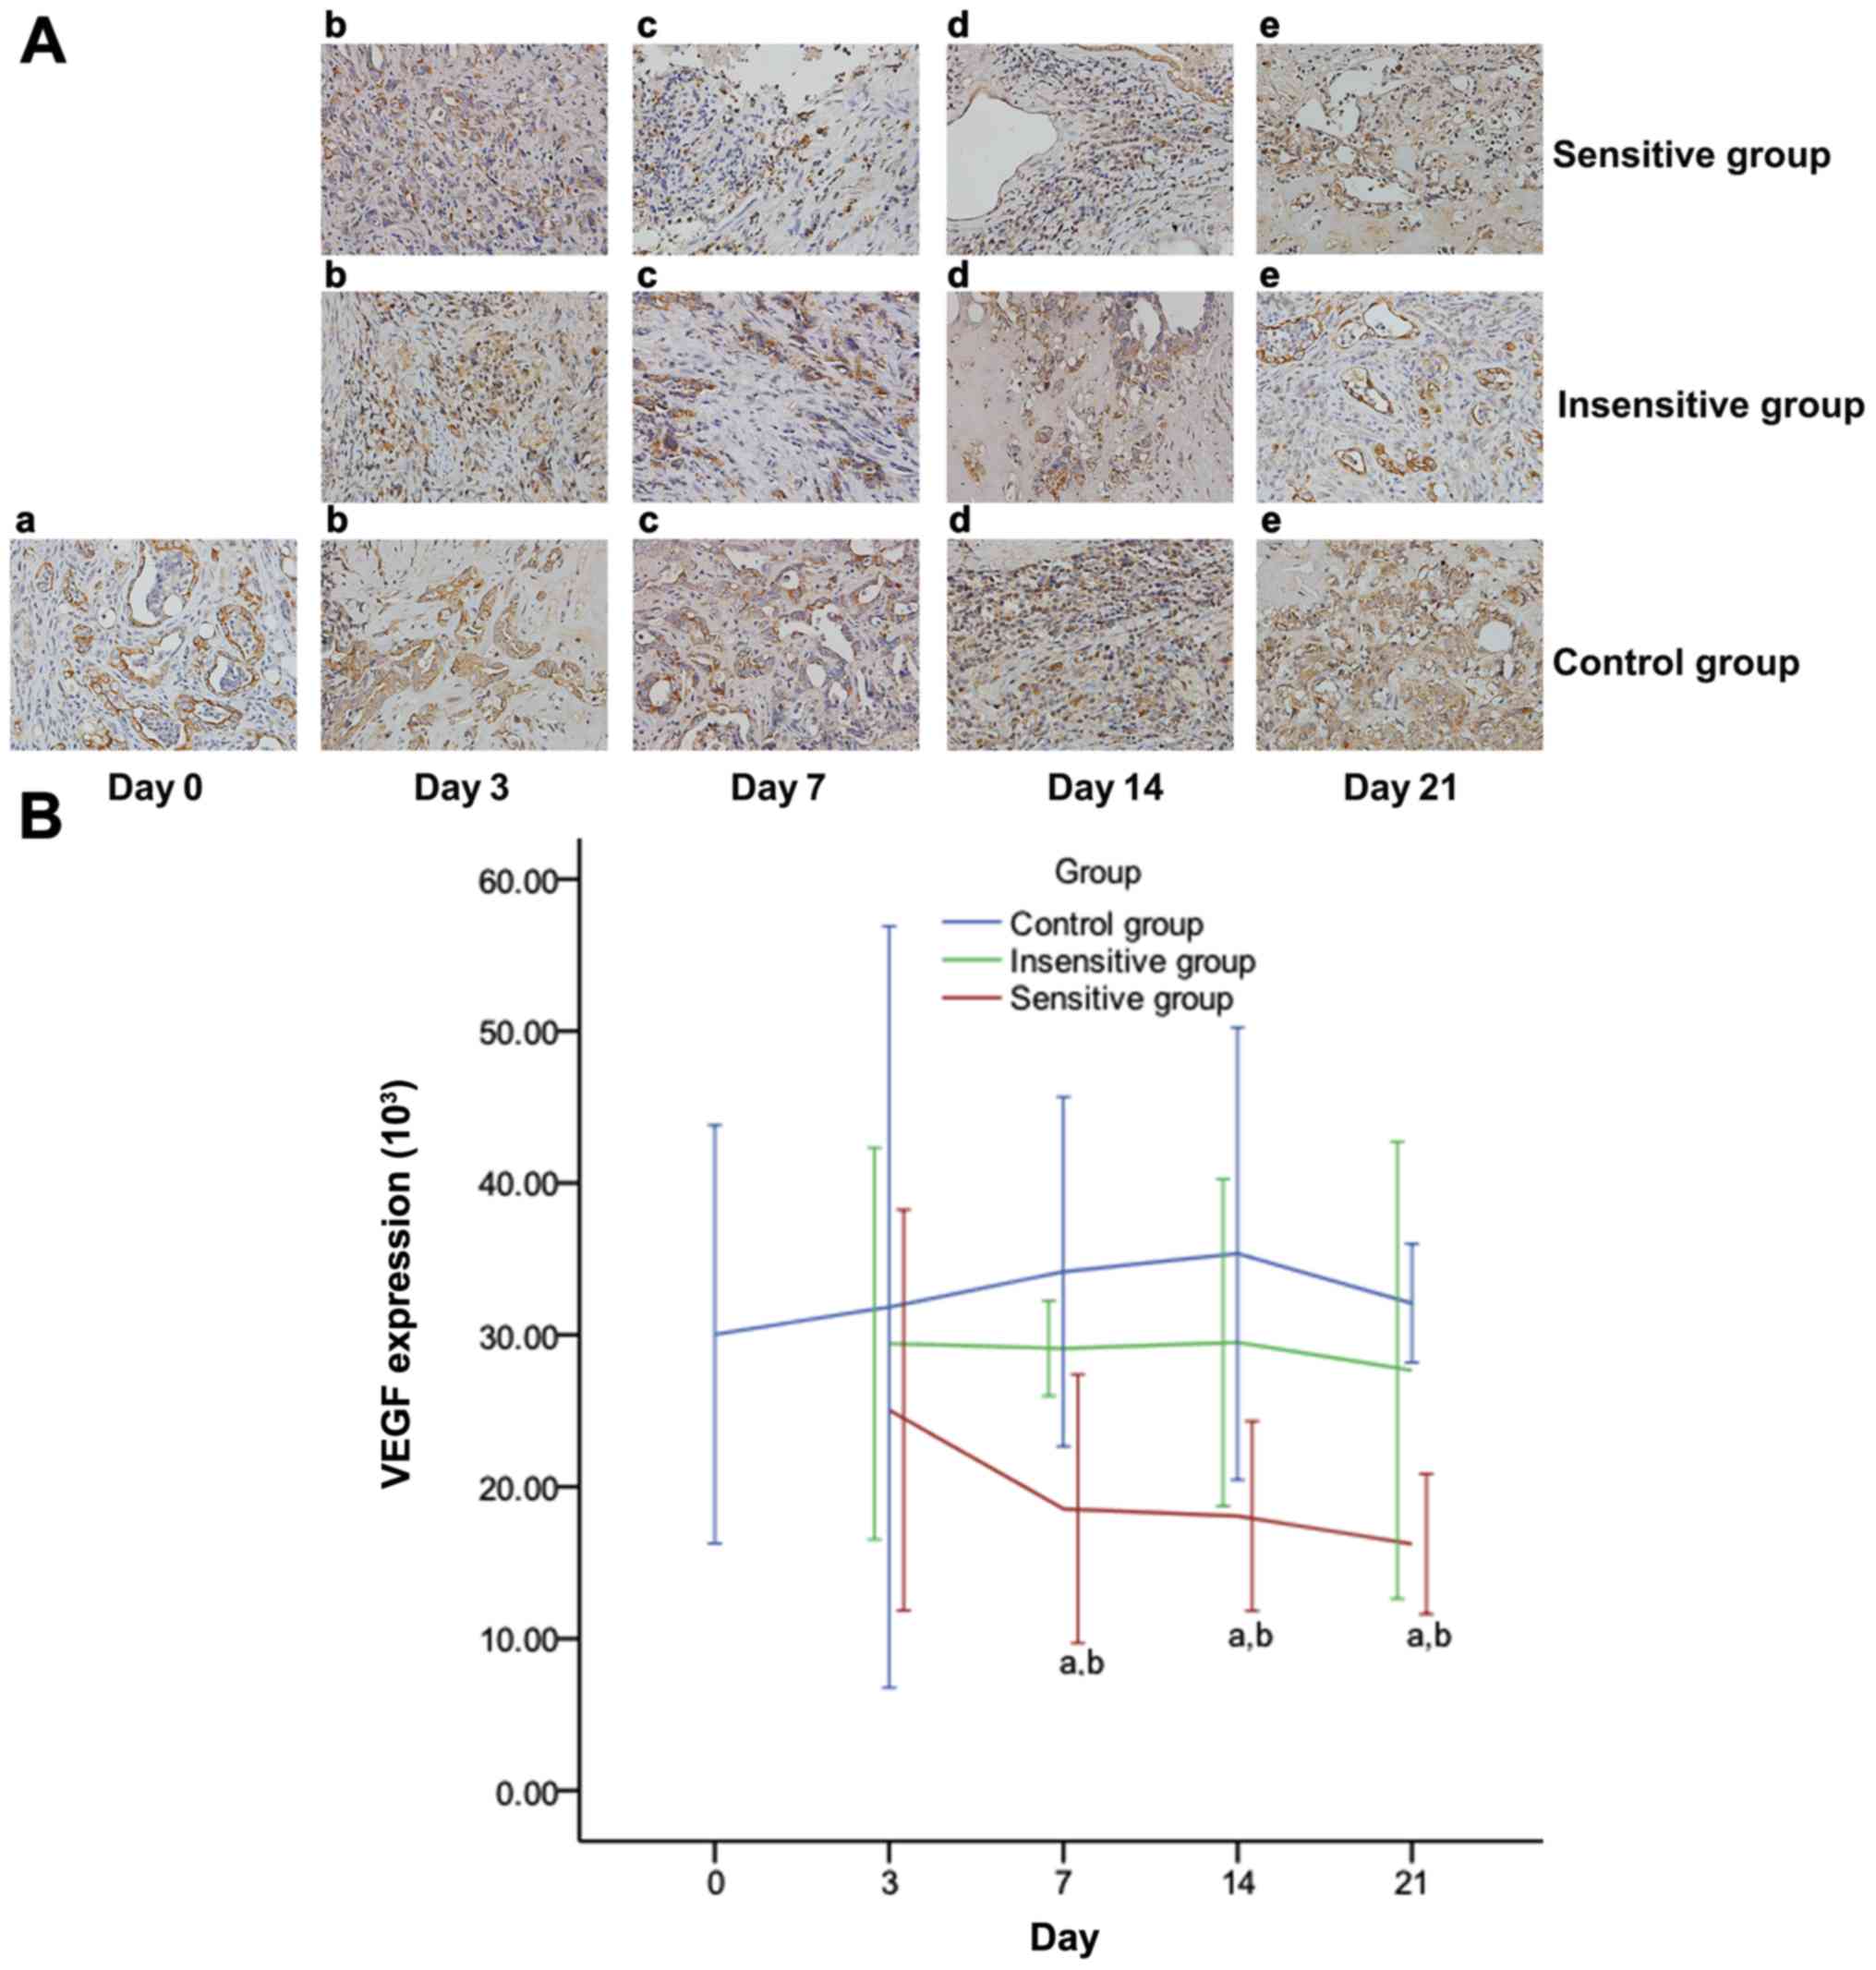 | Figure 7.Effect of DTX on VEGF expression in
rat EOC. Images obtained under a microscope (high power field
magnification, ×200) on (a) day 0, (b) day 3, (c) day 7, (d) day
14, (e) day 21 post-treatment, presenting the immunohistochemical
expression of VEGF (A), which was observed to have brownish yellow
granules in the cytoplasm and intercellular spaces. The expression
of VEGF (B) decreased in the sensitive group, but increased in the
insensitive or control group. On days 7, 14 and 21, VEGF expression
was significantly different between the three groups and pairwise
comparisons, except for insensitive vs. control. Data are
represented as means ± standard deviation. aP<0.05
vs. control; bP<0.05 vs. insensitive. DTX, docataxel;
VEGF, vascular endothelial growth factor; EOC, epithelial ovarian
cancer. |
| Table IV.Changes in MVD and VEGF expression
levels at different time points (%). |
Table IV.
Changes in MVD and VEGF expression
levels at different time points (%).
| Day | Group | % Change in the
MVD | % Change in VEGF
levels |
|---|
| Day 3 | Sensitive
group | −7.70±6.73 | −16.62±15.82 |
|
| Insensitive
group | −0.32±2.54 | −2.03±9.97 |
|
| Control group | 4.09±9.21 | 5.99±30.07 |
| Day 7 | Sensitive
group |
−25.82±4.03a,b |
−36.59±11.00a,b |
|
| Insensitive
group | −1.03±7.66 | −3.08±2.42 |
|
| Control group | 9.27±9.89 | 13.76±13.79 |
| Day 14 | Sensitive
group |
−26.34±4.10a,b |
−39.84±7.50a,b |
|
| Insensitive
group | −4.64±2.66 | −1.76±8.33 |
|
| Control group | 12.87±9.41 | 17.71±17.87 |
| Day 21 | Sensitive
group |
−30.84±5.05a,b |
−40.20±9.88a,b |
|
| Insensitive
group | −1.27±3.35 | −3.13±5.18 |
|
| Control group | 17.02±8.64 | 17.93±15.32 |
Tumor necrosis in rat EOC following
DTX therapy
As presented in Fig.
8 and Table V, the tumor
necrosis or the percentage change in necrosis rates lacked
significant differences among the three groups on days 3 and 7
(P>0.05). Significant differences were observed between the
sensitive and insensitive or control groups (P<0.05), but not
between the insensitive and control groups (P>0.05) on days 14
and 21.
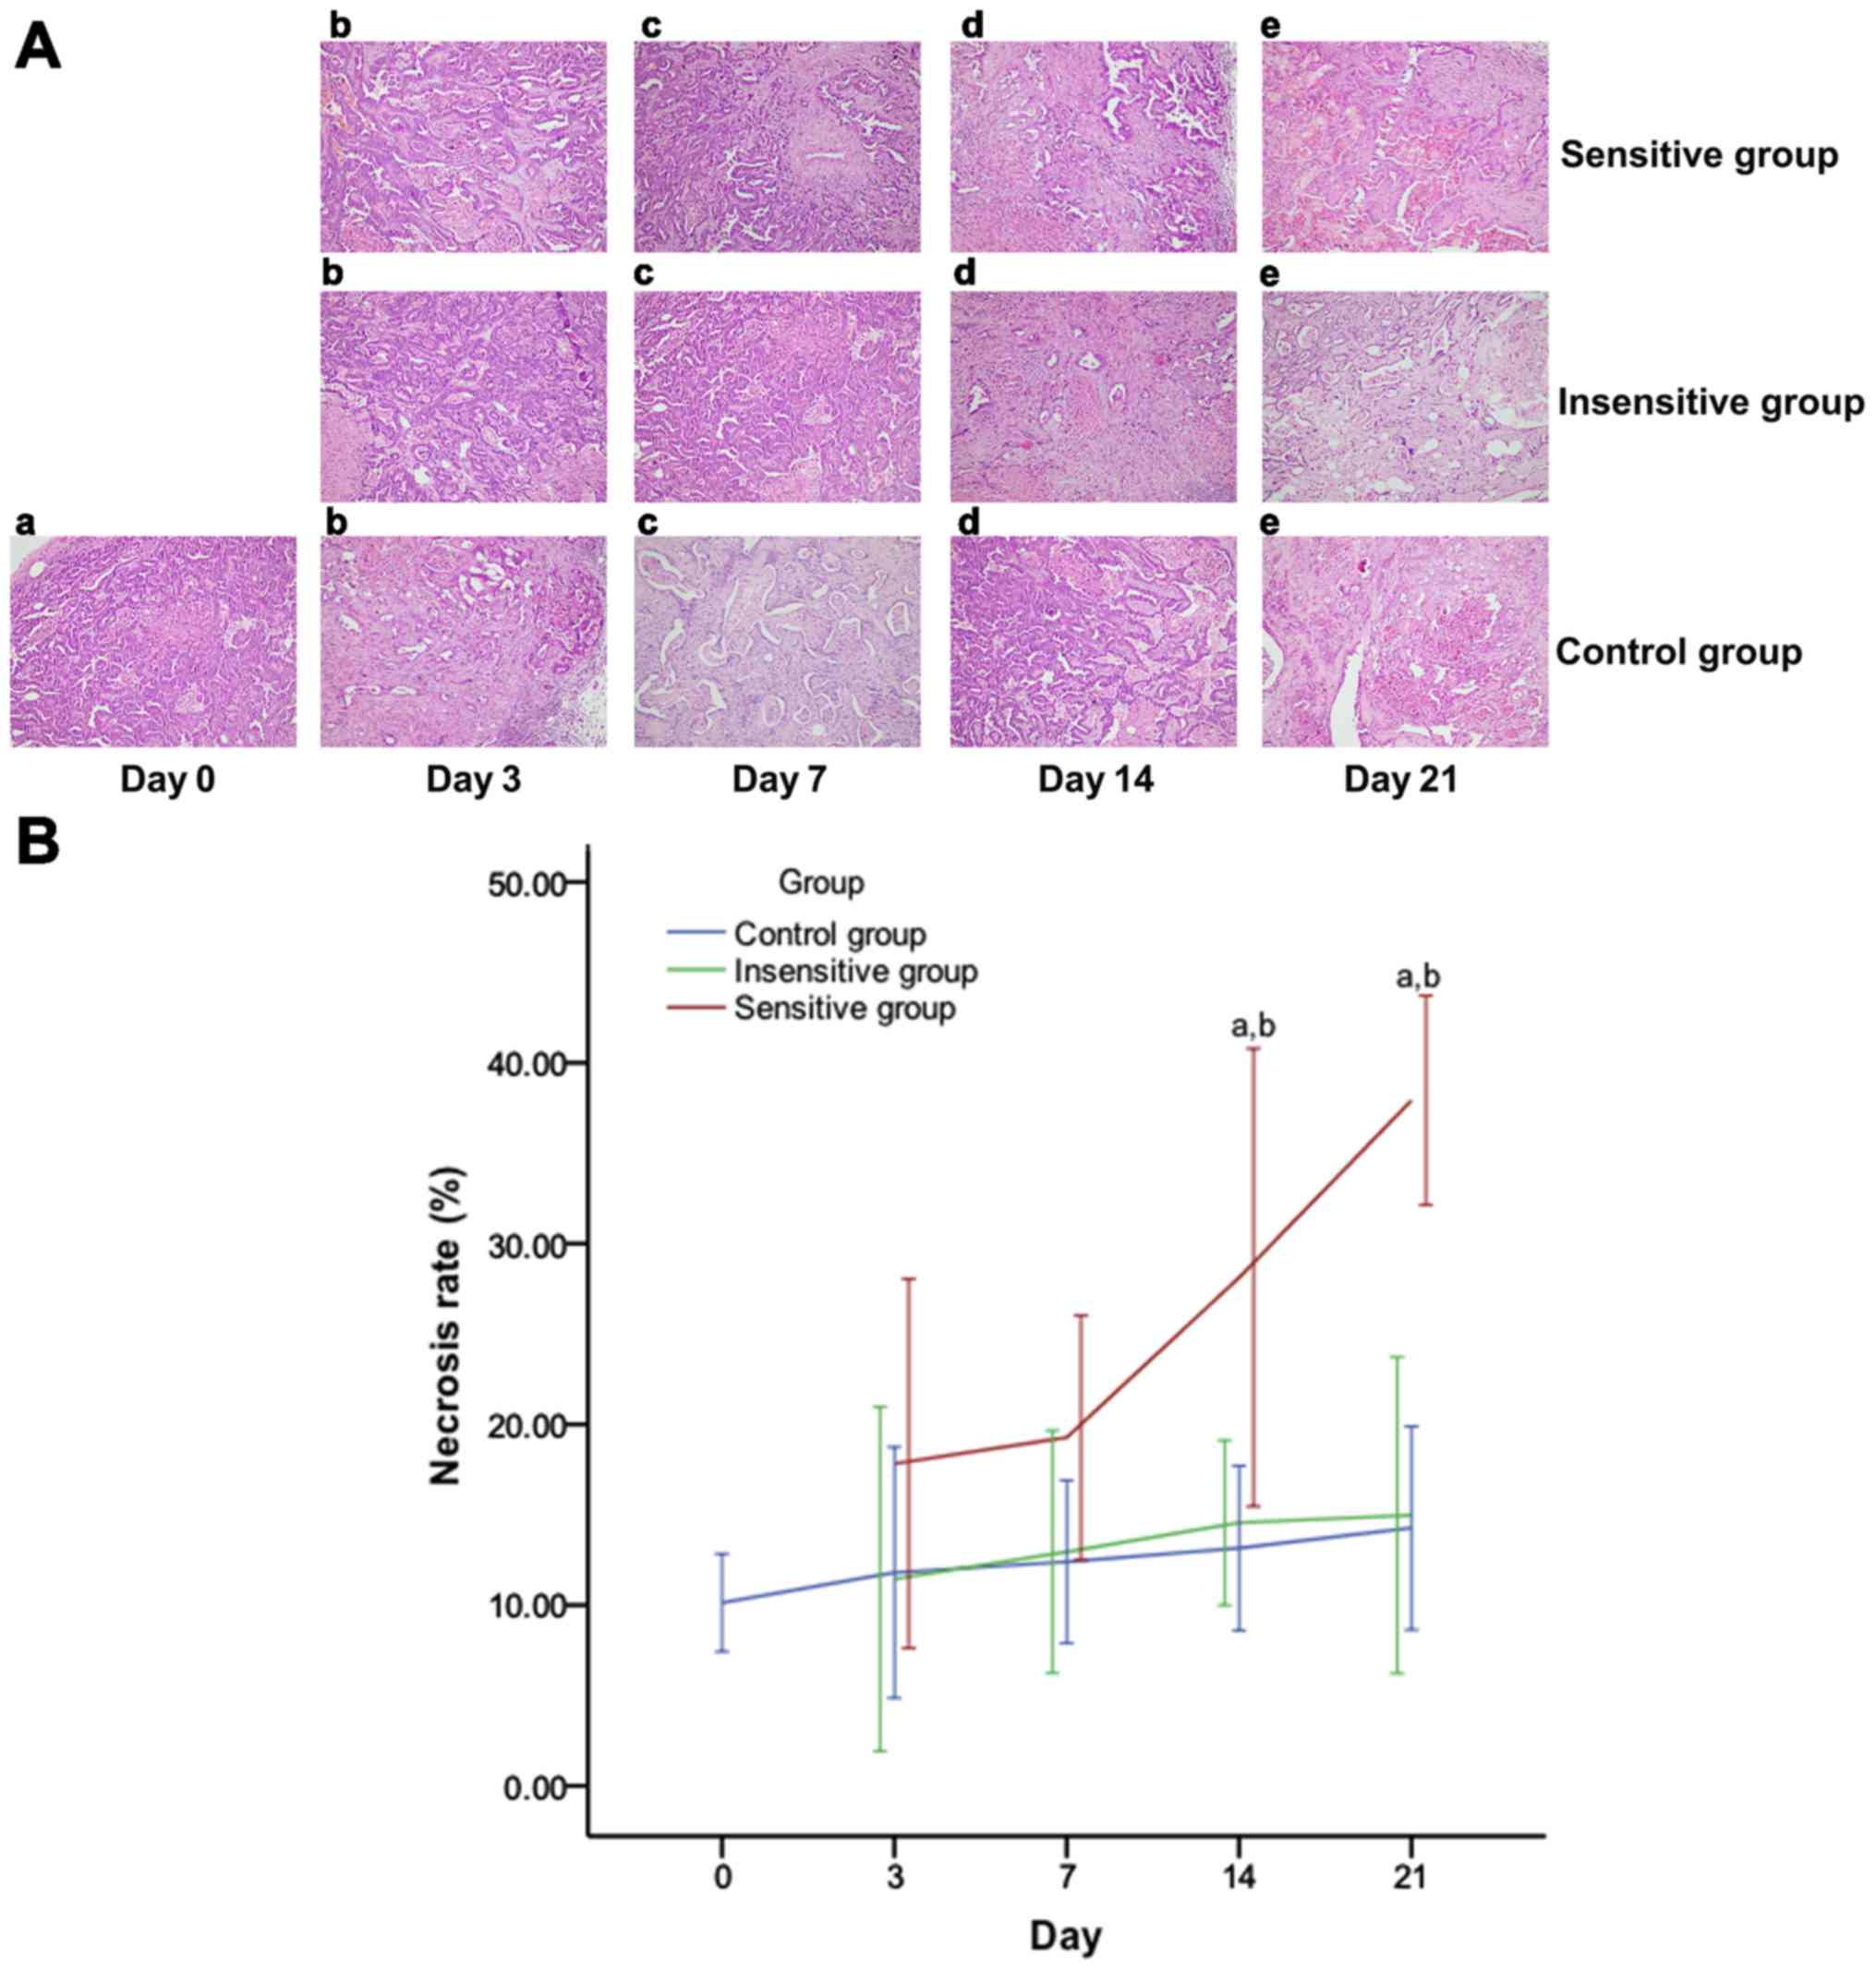 | Figure 8.Effect of DTX on tumor necrosis in
rat EOC. Images obtained under a microscope (high power field
magnification, ×200) on (a) day 0, (b) day 3, (c) day 7, (d) day 14
and (e) day 21 post-treatment, presenting the histopathology of (A)
EOC specimens, which were observed to have spotty or patchy
necrosis scattering. Tumor necrosis increased in the sensitive
group over time, but demonstrated no notable change in the
insensitive or control group. (B) On days 14 and 21, tumor necrosis
rates were significantly different between the three groups, except
for the insensitive group vs. the control group. Data are
represented as means ± standard deviation. aP<0.05
vs. control; bP<0.05 vs. insensitive. DTX, docataxel;
EOC, epithelial ovarian cancer. |
| Table V.Change in tumor necrosis at different
time points (%). |
Table V.
Change in tumor necrosis at different
time points (%).
| Group | Day 3 | Day 7 | Day 14 | Day 21 |
|---|
| Sensitive | 75.98±36.30 | 90.21±24.05 |
177.58±45.00a,b |
274.26±20.62a,b |
| Insensitive | 12.95±21.83 | 27.81±15.42 | 43.67±10.47 | 47.78±20.09 |
| Control | 16.46±24.71 | 22.60±16.04 | 29.81±16.18 | 40.80±19.99 |
Correlations between the percentage
change in DCE-MRI parameters and the percentage change in tumor
size, MVD, VEGF expression levels and tumor necrosis
As presented in Table
VI, the percentage change in Ktrans had a moderately
positive correlation with the percentage change in tumor size, MVD
and VEGF expression levels (P<0.01) and a moderately negative
correlation with the percentage change in tumor necrosis rates. The
percentage change in kep was moderately positively
correlated with the percentage change in tumor size and MVD; there
was a weak positive correlation with the percentage change VEGF
expression levels and a moderate negative correlation with the
percentage change in tumor necrosis rates (P<0.01). No
significant correlation was observed between the percentage change
in ve and tumor size, MVD, VEGF expression levels or
tumor necrosis rates (P>0.05). The IAUC was weakly positively
correlated with the percentage change in tumor size, moderately
positively correlated with the percentage change in MVD and VEGF
expression levels and weakly negatively correlated with the
percentage change in tumor necrosis rates (P<0.01).
| Table VI.Correlation between the percentage
change in dynamic contrast enhanced-magnetic resonance imaging
parameters and the percentage change in tumor size, VEGF levels,
MVD and necrosis. |
Table VI.
Correlation between the percentage
change in dynamic contrast enhanced-magnetic resonance imaging
parameters and the percentage change in tumor size, VEGF levels,
MVD and necrosis.
|
| % Change in volume
transfer constant | % Change in rate
constant | % Change in
extravascular extracellular space volume ratio | % Change in initial
area under the curve |
|---|
|
|
|
|
|
|
|---|
| Tumor
characteristics | r-value | P-value | r-value | P-value | r-value | P-value | r-value | P-value |
|---|
| % Change in
diameter | 0.735 | <0.001 | 0.589 | <0.001 | −0.060 | 0.499 | 0.410 | <0.001 |
| % Change in
MVD | 0.748 | <0.001 | 0.450 | 0.001 | 0.126 | 0.375 | 0.638 | <0.001 |
| % Change in VEGF
levels | 0.728 | <0.001 | 0.386 | 0.005 | 0.239 | 0.084 | 0.639 | <0.001 |
| % Change in
necrosis | −0.554 | <0.001 | −0.524 | <0.001 | −0.115 | 0.417 | −0.411 | 0.001 |
Discussion
DTX is a chemotherapy drug that is commonly used to
treat EOC, and one of its notable antitumor mechanisms is
associated with its inhibitory effect on angiogenesis (3,23).
Previous studies on breast, cervical, spine and other cancer types
have revealed that quantitative DCE-MRI parameters may be able to
detect a treatment response prior to a change in the tumor size
(11–15,24).
Cebulla et al (15)
demonstrated that DCE-MRI may detect cellular and vascular
responses to phosphoinositide 3-kinase/mammalian target of
rapamycin inhibition in vivo in ovarian cancer xenografts.
In the present study, quantitative DCE-MRI was applied to analyze
the early treatment response to DTX in induced rat EOC.
The present study demonstrated that there were
significantly higher percentage changes in Ktrans,
kep and IAUC in the DTX sensitive group compared with
its insensitive and control counterparts between day 3 and day 21.
However, differences in these parameters themselves were not
observed until day 14 or 21. Early during the treatment process (on
day 3), the percentage change of Ktrans combined with
kep had an AUC of 1 and a sensitivity and specificity of
100 and 100%, respectively (which may be used for detecting the
response to DTX), using a cut-off value of a 17.59% reduction in
Ktrans and kep. These results illustrated
that the percentage change in the DCE-MRI parameters were more
effective compared with the DCE-MRI parameters alone in detecting
the tumor response to chemotherapeutic agents in individual
animals. Therefore, they may be reliable biomarkers for monitoring
the tumor response to chemotherapy and for determining
individualized therapeutic methods.
For oncologists, a change in tumor size according to
guidelines such as RECIST is the most commonly used method of
assessing the tumor response to chemotherapy (25). In the present study, the percentage
change in the tumor size observed using MRI was significantly
higher in the DTX sensitive group compared with its insensitive
counterpart from day 7 onwards, and its control counterpart from
day 14 onwards. However, neither the tumor size nor its percentage
change achieved a perfect result of an AUC of 1, a sensitivity of
100% and a specificity of 100% for the monitoring of the response
of EOC to DTX until day 21. These results suggested that the
percentage changes in Ktrans, kep and IAUC
reflected more effectively and more quickly the efficacy of DTX
treatment compared with the percentage change in the size of the
tumor. And more importantly, quantitative DCE-MRI parameters
(Ktrans, kep and IAUC) were superior to
imaging tumor size for early detection of response to DTX
chemotherapy in EOCs.
Ktrans and kep reflect the
tissue perfusion, vascular permeability and tumor angiogenesis
(26–28). Ve indirectly represents
the appearance of tumor angiogenesis (29). IAUC is associated with the blood
flow, volume and interstitial space of the tumor, and it is the
comprehensive reflection of the changes in Ktrans,
kep and ve (30). DCE-MRI is being increasingly used in
research to detect the treatment response to targeted
antiangiogenic agents by demonstrating the occurrence of vascular
disruption and changes in the microcirculation (31). A study by Li et al (32) demonstrated that the DCE-MRI
parameters Ktrans and kep allowed for the
estimation of angiogenesis in breast cancer and predicted breast
cancer prognosis. Tumor growth or development is accompanied by
angiogenesis. Consequently, tumor growth results in higher
Ktrans, kep and IAUC values (33). By contrast, effective DTX treatment
blocks neovascularization, which in turn decreases the
Ktrans, kep and IAUC values.
As early as the 1970s, Folkman (34) demonstrated that angiogenesis was
essential for the survival and sustained growth of solid tumor
types and proposed the theory of anti-angiogenic therapy for a
tumor. MVD has been accepted as a standard indicator of
angiogenesis that is tightly regulated by pro-angiogenic and
anti-endothelial growth factors (35). VEGF is one of the most necessary
pro-angiogenic growth factors, and it has appeared to be essential
in the angiogenic process (36,37).
Our previous study demonstrated that Ktrans,
kep and IAUC were positively correlated with MVD and
VEGF expression, which suggested that changes of Ktrans,
kep and IAUC induced by antiangiogenic therapy may
reflect changes of MVD and VEGF (17).
When the treatment group of the present study was
divided into sensitive and insensitive groups according to a
cut-off value of a 17.59% reduction in Ktrans and
kep values on day 3, comprehensive histopathology
analysis at each time point demonstrated that the MVD and VEGF
expression levels in EOC were notably decreased in the sensitive
group compared with the insensitive group in addition to the
control group on day 7. The results of the present study were in
accordance with the results of Ji et al (38) and Zhang et al (39,40).
The present results indicated that DTX chemotherapy had inhibitory
effects on angiogenesis by decreasing the MVD count and VEGF
expression levels, and treatment-induced hemodynamics changes
occurred prior to changes in the tumor morphology.
Chen et al (41) demonstrated that Ktrans
and IAUC were moderately positively correlated with MVD, while the
kep and ve values were not correlated with
MVD subsequent to percutaneous ethanol injection in a rabbit VX2
liver tumor. According to a study by Yuan et al (42), the Ktrans value, which
reflects the perfusion and permeability of tumor microvessels, was
highest in VEGF189-overexpressing tumor types. The results of the
present study additionally revealed that changes in the
Ktrans, kep and IAUC values were positively
correlated with changes in MVD and VEGF. Additionally, dynamic
changes in these parameters may noninvasively reflect the
expression of tumor biomarkers in vivo.
Histopathological analysis demonstrated more
prominent necrosis in the sensitive group compared with the
insensitive and control counterparts from day 14 onwards, which was
concurrent with, but occurred later compared with, the results of
the analysis of the quantitative DCE-MRI parameters. Furthermore,
the percentage changes in the Ktrans, kep and
IAUC values were positively correlated with that of the necrosis
rates. These results demonstrated that the changes in DCE-MRI
parameters may help to predict the tumor histopathological
responses and monitor the effectiveness of DTX treatment.
However, the present study also had limitations. For
example, 3.0 T MRI was used. In order to improve the image
resolution, 7.0 T MRI will be applied in future studies. Neither
DCE-MRI nor angiogenesis were analyzed regionally, and the vascular
variant in the tumor and normal tissue junction was the greatest.
Furthermore, the vascular variant may have affected the overall
stability of tumor angiogenesis (43).
In conclusion, the results of the present study
indicated that the quantitative DCE-MRI parameters were superior to
imaging tumor size for the detection of tumor histopathological
responses for the early detection of responses to DTX in EOC.
Quantitative DCE-MRI parameters may contribute to adjusting the
treatment regimen for non-responders sooner in the progression of
the disease and improving the prognosis.
Acknowledgements
Not applicable.
Funding
The present study was supported by the Shanghai
Municipal Health Bureau Commission of Health and Family Planning
(grant no 20134y156).
Availability of data and materials
All data generated or analyzed during this study are
included in this published article.
Authors' contributions
JWQ conceived the study concepts and study design,
and defined the intellectual content. SJY and SQC performed the
data analysis, acquired the data and performed the literature
research. SJY edited the manuscript. TKQ was involved in the
conception of the study. All authors read and approved the final
manuscript and agree to be accountable for all aspects of the
research in ensuring that the accuracy or integrity of any part of
the work are appropriately investigated and resolved.
Ethics approval and consent to
participate
All animal experimental procedures were ethically
approved by the Institutional Review Board of Jinshan Hospital of
Fudan University (Shanghai, China) and were performed according to
the Guide for the Care and Use of Laboratory Animals of the
National Science and Technology Committee of China.
Patient consent for publication
Not applicable.
Competing interests
The authors declare that they have no competing
interests.
References
|
1
|
Pan Z and Xie X: BRCA mutations in the
manifestation and treatment of ovarian cancer. Oncotarget.
8:97657–97670. 2017.PubMed/NCBI
|
|
2
|
Köbel M, Kalloger SE, Boyd N, McKinney S,
Mehl E, Palmer C, Leung S, Bowen NJ, Ionescu DN, Rajput A, et al:
Ovarian carcinoma subtypes are different diseases: Implications for
biomarker studies. PLoS Med. 5:e2322008. View Article : Google Scholar : PubMed/NCBI
|
|
3
|
Chen ZK, Cai MX, Yang J, Lin LW, Xue ES,
Huang J, Wei HF, Zhang XJ and Ke LM: Chemotherapy with PLGA
microspheres containing docetaxel decreases angiogenesis in human
hepatoma xenograft. Med Oncol. 29:62–69. 2012. View Article : Google Scholar : PubMed/NCBI
|
|
4
|
Razi Soofiyani S, Mohammad Hoseini A,
Mohammadi A, Khaze Shahgoli V, Baradaran B and Hejazi MS:
siRNA-mediated silencing of CIP2A enhances docetaxel activity
against PC-3 prostate cancer cells. Adv Pharm Bull. 7:637–643.
2017. View Article : Google Scholar : PubMed/NCBI
|
|
5
|
Liu P, Feng J, Sun M, Yuan W, Xiao R,
Xiong J, Huang X, Xiong M, Chen W, Yu X, et al: Synergistic effects
of baicalein with gemcitabine or docetaxel on the proliferation,
migration and apoptosis of pancreatic cancer cells. Int J Oncol.
51:1878–1886. 2017. View Article : Google Scholar : PubMed/NCBI
|
|
6
|
Du Z, Li L, Sun W, Wang X, Zhang Y, Chen
Z, Yuan M, Quan Z, Liu N, Hao Y, et al: HepaCAM inhibits the
malignant behavior of castration-resistant prostate cancer cells by
downregulating Notch signaling and PF-3084014 (a γ-secretase
inhibitor) partly reverses the resistance of refractory prostate
cancer to docetaxel and enzalutamide in vitro. Int J Oncol.
53:99–112. 2018.PubMed/NCBI
|
|
7
|
Armstrong SR, Narendrula R, Guo B,
Parissenti AM, McCallum KL, Cull S and Lannér C: Distinct genetic
alterations occur in ovarian tumor cells selected for combined
resistance to carboplatin and docetaxel. J Ovarian Res. 5:402012.
View Article : Google Scholar : PubMed/NCBI
|
|
8
|
Cohen JG, White M, Cruz A and
Farias-Eisner R: In 2014, can we do better than CA125 in the early
detection of ovarian cancer? World J Biol Chem. 5:286–300. 2014.
View Article : Google Scholar : PubMed/NCBI
|
|
9
|
Therasse P, Arbuck SG, Eisenhauer EA,
Wanders J, Kaplan RS, Rubinstein L, Verweij J, Van Glabbeke M, van
Oosterom AT, Christian MC, et al: New guidelines to evaluate the
response to treatment in solid tumors. European Organization for
Research and Treatment of Cancer, National Cancer Institute of the
United States, National Cancer Institute of Canada. J Natl Cancer
Inst. 92:205–216. 2000. View Article : Google Scholar : PubMed/NCBI
|
|
10
|
Leach MO, Morgan B, Tofts PS, Buckley DL,
Huang W, Horsfield MA, Chenevert TL, Collins DJ, Jackson A, Lomas
D, et al: Imaging vascular function for early stage clinical trials
using dynamic contrast-enhanced magnetic resonance imaging. Eur
Radiol. 22:1451–1464. 2012. View Article : Google Scholar : PubMed/NCBI
|
|
11
|
Padhani AR and Miles KA: Multiparametric
imaging of tumor response to therapy. Radiology. 25:348–364. 2010.
View Article : Google Scholar
|
|
12
|
Yuh WT, Mayr NA, Jarjoura D, Wu D, Grecula
JC, Lo SS, Edwards SM, Magnotta VA, Sammet S, Zhang H, et al:
Predicting control of primary tumor and survival by DCE MRI during
early therapy in cervical cancer. Invest Radiol. 44:343–350. 2009.
View Article : Google Scholar : PubMed/NCBI
|
|
13
|
Jensen LR, Huuse EM, Bathen TF, Goa PE,
Bofin AM, Pedersen TB, Lundgren S and Gribbestad IS: Assessment of
early docetaxel response in an experimental model of human breast
cancer using DCE-MRI, ex vivo HR MAS, and in vivo 1H MRS. NMR
Biomed. 23:56–65. 2010. View
Article : Google Scholar : PubMed/NCBI
|
|
14
|
Tudorica A, Oh KY, Chui SY, Roy N, Troxell
ML, Naik A, Kemmer KA, Chen Y, Holtorf ML, Afzal A, et al: Early
prediction and evaluation of breast cancer response to neoadjuvant
chemotherapy using quantitative DCE-MRI. Transl Oncol. 9:8–17.
2016. View Article : Google Scholar : PubMed/NCBI
|
|
15
|
Cebulla J, Huuse EM, Pettersen K, van der
Veen A, Kim E, Andersen S, Prestvik WS, Bofin AM, Pathak AP,
Bjørkøy G, et al: MRI reveals the in vivo cellular and vascular
response to BEZ235 in ovarian cancer xenografts with different
PI3-kinase pathway activity. Br J Cancer. 112:504–513. 2015.
View Article : Google Scholar : PubMed/NCBI
|
|
16
|
Lis E, Saha A, Peck KK, Zatcky J, Zelefsky
MJ, Yamada Y, Holodny AI, Bilsky MH and Karimi S: Dynamic
contrast-enhanced magnetic resonance imaging of osseous spine
metastasis before and 1 hour after high-dose image-guided radiation
therapy. Neurosurg Focus. 42:E92017. View Article : Google Scholar : PubMed/NCBI
|
|
17
|
Yuan SJ, Qiao TK, Qiang JW, Cai SQ and Li
RK: The value of DCE-MRI in assessing histopathological and
molecular biological features in induced rat epithelial ovarian
carcinomas. J Ovarian Res. 10:652017. View Article : Google Scholar : PubMed/NCBI
|
|
18
|
Tofts PS, Brix G, Buckley DL, Evelhoch JL,
Henderson E, Knopp MV, Larsson HB, Lee TY, Mayr NA, Parker GJ, et
al: Estimating kinetic parameters from dynamic contrast-enhanced
T(1)-weighted MRI of a diffusable tracer: Standardized quantities
and symbols. J Magn Reson Imaging. 10:223–232. 1999. View Article : Google Scholar : PubMed/NCBI
|
|
19
|
Zhang P, Chen L, Zhang Z, Lin L and Li Y:
Pharmacokinetics in rats and efficacy in murine ovarian cancer
model for solid lipid nanoparticles loading docetaxel. J Nanosci
Nanotechnol. 10:7541–7544. 2010. View Article : Google Scholar : PubMed/NCBI
|
|
20
|
Rustin GJ, Quinn M, Thigpen T, du Bois A,
Pujade-Lauraine E, Jakobsen A, Eisenhauer E, Sagae S, Greven K,
Vergote I, et al: Re: New guidelines to evaluate the response to
treatment in solid tumors (ovarian cancer). J Natl Cancer Inst.
96:487–488. 2004. View Article : Google Scholar : PubMed/NCBI
|
|
21
|
Zhou LN, Wu N, Liang Y, Gao K, Li XY and
Zhang LF: Monitoring response to gefitinib in nude mouse tumor
xenografts by 18F-FDG microPET-CT: Correlation between
18F-FDG uptake and pathological response. World J Surg
Oncol. 13:1112015. View Article : Google Scholar : PubMed/NCBI
|
|
22
|
Kovač JD, Terzić M, Mirković M, Banko B,
Đikić-Rom A and Maksimović R: Endometrioid adenocarcinoma of the
ovary: MRI findings with emphasis on diffusion-weighted imaging for
the differentiation of ovarian tumors. Acta Radiol. 57:758–766.
2016. View Article : Google Scholar : PubMed/NCBI
|
|
23
|
Khatun Z, Nurunnabi, Cho KJ, Byun Y, Bae
YH and Lee YK: Oral absorption mechanism and anti-angiogenesis
effect of taurocholic acid-linked heparin-docetaxel conjugates. J
Control Release. 177:64–73. 2014. View Article : Google Scholar : PubMed/NCBI
|
|
24
|
Whisenant JG, Sorace AG, McIntyre JO, Kang
H, Sánchez V, Loveless ME and Yankeelov TE: Evaluating treatment
responseusing DW-MRI and DCE-MRI in trastuzumab responsive and
resistant HER2-overexpressing human breast cancer xenografts.
Transl Oncol. 7:768–779. 2014. View Article : Google Scholar : PubMed/NCBI
|
|
25
|
Eisenhauer EA, Therasse P, Bogaerts J,
Schwartz LH, Sargent D, Ford R, Dancey J, Arbuck S, Gwyther S,
Mooney M, et al: New response evaluation criteria in solid tumours:
Revised RECIST guideline (version 1.1). Eur J Cancer. 45:228–247.
2009. View Article : Google Scholar : PubMed/NCBI
|
|
26
|
de Bazelaire C, Siauve N, Fournier L,
Frouin F, Robert P, Clement O, de Kerviler E and Cuenod CA:
Comprehensive model for simultaneous MRI determination of perfusion
and permeability using a blood-pool agent in rats rhabdomyosarcoma.
Eur Radiol. 15:2497–2505. 2005. View Article : Google Scholar : PubMed/NCBI
|
|
27
|
Boult JKR, Box G, Vinci M, Perryman L,
Eccles SA, Jones C and Robinson SP: Evaluation of the response of
intracranial xenografts to VEGF signaling inhibition using
multiparametric MRI. Neoplasia. 19:684–694. 2017. View Article : Google Scholar : PubMed/NCBI
|
|
28
|
Merz M, Moehler TM, Ritsch J, Bäuerle T,
Zechmann CM, Wagner B, Jauch A, Hose D, Kunz C, Hielscher T, et al:
Prognostic significance of increased bone marrow microcirculation
in newly diagnosed multiple myeloma: Results of a prospective
DCE-MRI study. Eur Radiol. 26:1404–11. 2016. View Article : Google Scholar : PubMed/NCBI
|
|
29
|
Ma L, Xu X, Zhang M, Zheng S, Zhang B,
Zhang W and Wang P: Dynamic contrast-enhanced MRI of gastric
cancer: Correlations of the pharmacokinetic parameters with
histological type, Lauren classification, and angiogenesis. Magn
Reson Imaging. 37:27–32. 2017. View Article : Google Scholar : PubMed/NCBI
|
|
30
|
Hirashima Y, Yamada Y, Tateishi U, Kato K,
Miyake M, Horita Y, Akiyoshi K, Takashima A, Okita N, Takahari D,
et al: Pharmacokinetic parameters from 3-Tesla DCE-MRI as surrogate
biomarkers of antitumor effects of bevacizumab plus FOLFIRI in
colorectal cancer with liver metastasis. Int J Cancer.
130:2359–2365. 2012. View Article : Google Scholar : PubMed/NCBI
|
|
31
|
Yang J, Kim JH, Im GH, Heo H, Yoon S, Lee
J, Lee JH and Jeon P: Evaluation of antiangiogenic effects of a new
synthetic candidate drug KR-31831 on xenografted ovarian carcinoma
using dynamic contrast enhanced MRI. Korean J Radiol. 12:602–610.
2011. View Article : Google Scholar : PubMed/NCBI
|
|
32
|
Li L, Wang K, Sun X, Wang K, Sun Y, Zhang
G and Shen B: Parameters of dynamic contrast-enhanced MRI as
imaging markers for angiogenesis and proliferation in human breast
cancer. Med Sci Monit. 21:376–382. 2015. View Article : Google Scholar : PubMed/NCBI
|
|
33
|
Yao WW, Zhang H, Ding B, Fu T, Jia H, Pang
L, Song L, Xu W, Song Q, Chen K, et al: Rectal cancer: 3D dynamic
contrast-enhanced MRI; correlation with microvascular density and
clinicopathological features. Radiol Med. 116:366–374. 2011.
View Article : Google Scholar : PubMed/NCBI
|
|
34
|
Folkman J: Tumor angiogenesis: Therapeutic
implications. N Engl J Med. 285:1182–1186. 1971. View Article : Google Scholar : PubMed/NCBI
|
|
35
|
Mikalsen LT, Dhakal HP, Bruland OS,
Nesland JM and Olsen DR: Quantification of angiogenesis in breast
cancer by automated vessel identification in CD34
immunohistochemical sections. Anticancer Res. 31:4053–4060.
2011.PubMed/NCBI
|
|
36
|
Bando H: Vascular endothelial growth
factor and bevacitumab in breast cancer. Breast Cancer. 14:163–173.
2007. View Article : Google Scholar : PubMed/NCBI
|
|
37
|
Hayes DF, Miller K and Sledge G:
Angiogenesis as targeted breast cancer therapy. Breast. 16 (Suppl
2):S17–S19. 2007. View Article : Google Scholar : PubMed/NCBI
|
|
38
|
Ji Y, Hayashi K, Amoh Y, Tsuji K, Yamauchi
K, Yamamoto N, Tsuchiya H, Tomita K, Bouvet M and Hoffman RM: The
camptothecin derivative CPT-11 inhibits angiogenesis in a
dual-color imageable orthotopic metastatic nude mouse model of
human colon cancer. Anticancer Res. 27:713–718. 2007.PubMed/NCBI
|
|
39
|
Zhang Q, Kang X and Zhao W: Antiangiogenic
effect of low-dose cyclophosphamide combined with ginsenoside Rg3
on Lewis lung carcinoma. Biochem Biophys Res Commun. 342:824–828.
2006. View Article : Google Scholar : PubMed/NCBI
|
|
40
|
Zhang M, Tao W, Pan S, Sun X and Jiang H:
Low-dose metronomic chemotherapy of paclitaxel synergizes with
cetuximab to suppress human colon cancer xenografts. Anticancer
Drugs. 20:355–363. 2009. View Article : Google Scholar : PubMed/NCBI
|
|
41
|
Chen J, Qian T, Zhang H, Wei C, Meng F and
Yin H: Combining dynamic contrast enhanced magnetic resonance
imaging and microvessel density to assess the angiogenesis after
PEI in a rabbit VX2 liver tumor model. Magn Reson Imaging.
34:177–182. 2016. View Article : Google Scholar : PubMed/NCBI
|
|
42
|
Yuan A, Lin CY, Chou CH, Shih CM, Chen CY,
Cheng HW, Chen YF, Chen JJ, Chen JH, Yang PC, et al: Functional and
structural characteristics of tumor angiogenesis in lung cancers
overexpressing different VEGF isoforms assessed by DCE- and
SSCE-MRI. PLoS One. 6:e160622011. View Article : Google Scholar : PubMed/NCBI
|
|
43
|
Wu L, Lv P, Zhang H, Fu C, Yao X, Wang C,
Zeng M, Li Y and Wang X: Dynamic contrast-enhanced (DCE) MRI
assessment of microvascular characteristics in the murine
orthotopic pancreatic cancer model. Magn Reson Imaging. 33:737–760.
2015. View Article : Google Scholar : PubMed/NCBI
|