Introduction
In the past forty years, the incidence of colorectal
cancer (CRC) has increased by 75%. Currently, CRC ranks fourth
worldwide in terms of the number of cancer-related deaths and
accounts for 8% of all cancer-related deaths (1). The current understanding of the
genetic mechanisms underlying the development of CRC is not yet
complete. Exploring new mechanisms involved in CRC is important for
the comprehensive diagnosis and treatment of patients with CRC.
In unpublished observations from our group, sequence
analysis of gene expression profiles of CRC tissues and adjacent
normal tissues has revealed that calpain-1 gene expression was
significantly upregulated in CRC tissues. Calpains are a family of
calcium-dependent cysteine proteases that are widely expressed in
many tissues and cells (2).
Currently, 15 calpain genes have been discovered. Decreased calpain
activity is related to various pathologies: Calpain-1 and calpain-2
are associated with Alzheimer's disease and neuronal degeneration,
calpain-3 is associated with muscular dystrophy and cataracts,
calpain-8 and calpain-10 are associated with type 2 diabetes
mellitus and hyperglycemia, and calpain-9 is associated with
gastric cancer (3–7). Among these genes, calpain-1 is the
best characterized. In general, it exists in the form of an
inactive zymogen in the cytoplasm and cell membrane and is
activated when the intracellular Ca2+ concentration
increases. Calpain-1 consists of two subunits, a regulatory subunit
and a catalytic subunit, which are the products of genes on
chromosomes 1 and 11, respectively (8). Calpain-1 has an important effect on
carcinogenesis by participating in multiple vital cellular
processes, such as cell apoptosis and proliferation (9–14). The
expression of calpastatin in endometrial carcinoma is higher
compared with benign endometrial tissue, and calpain-1 influences
the survival, apoptosis and migration of breast cancer cells.
However, the specific role and mechanism of action of calpain-1 in
the development of CRC remains unclear. Filamin A (FLNA) is an
actin-binding protein that participates in cancer progression, and
can be cleaved by calpains (15).
In our unpublished genomic data, we found that the expression of
calpain-1 and FLNA in CRC was inversely correlated, therefore,
their interaction in CRC warrants further study.
In the present study, the expression levels of the
calpain-1 and FLNA genes were examined in CRC tissues and the
relationship between calpain-1 and FLNA expression and the
clinicopathological features of CRC was analyzed. In addition, the
effects of calpain-1 on the biological functions of CRC cells and
the underlying mechanisms were investigated.
Materials and methods
Patients and specimens
The present study was approved by the Ethics
Committee of the Second Affiliated Hospital of Wenzhou Medical
University, and informed consent was obtained from each patient. In
total, 467 CRC and corresponding paracancerous tissue samples were
collected at the Second Affiliated Hospital of Wenzhou Medical
University, between June 2011 and December 2017. Tissue specimens
were surgically resected from the patients, none of whom received
neoadjuvant chemotherapy prior to the operation. The age of the
patients ranged from 32 to 90 years old (61.77±12.7). The patients'
clinical data and tumor characteristics are summarized in Table I. All patients were followed for
6–79 months following surgery.
 | Table I.Association between Calpain-1 or FLNA
expression and clinicopathological features. |
Table I.
Association between Calpain-1 or FLNA
expression and clinicopathological features.
|
| Calpain-1 |
| FLNA |
|
|---|
|
|
|
|
|
|
|---|
| Clinicopathological
feature | Low | High | P-value | Low | High | P-value |
|---|
| Age (years) |
|
| 0.041 |
|
| 0.566 |
| ≥60 | 158 | 163 |
| 185 | 136 |
|
|
<60 | 57 | 89 |
| 80 | 66 |
|
| Sex |
|
| 0.974 |
|
| 0.085 |
|
Male | 130 | 152 |
| 151 | 131 |
|
|
Female | 85 | 100 |
| 114 | 71 |
|
| Tumor Site |
|
| 0.280 |
|
| 0.367 |
|
Colon | 126 | 160 |
| 167 | 119 |
|
|
Rectum | 89 | 92 |
| 98 | 83 |
|
| Size (cm) |
|
| 0.618 |
|
| 0.000 |
|
>5 | 83 | 103 |
| 126 | 60 |
|
| ≤5 | 132 | 149 |
| 139 | 142 |
|
| Histologic
grade |
|
| 0.069 |
|
| 0.000 |
| High to
moderate | 143 | 147 |
| 95 | 195 |
|
|
Low | 72 | 105 |
| 170 | 7 |
|
| Metastasis |
|
| 0.024 |
|
| 0.000 |
|
Yesa | 103 | 147 |
| 165 | 85 |
|
| No | 112 | 105 |
| 100 | 117 |
|
| Dukes stage |
|
| 0.024 |
|
| 0.000 |
|
A-B | 112 | 105 |
| 100 | 117 |
|
|
C-D | 103 | 147 |
| 165 | 85 |
|
| Mean survival time
(months) | 59.7 | 51 | 0.003 | 50.7 | 60.7 | 0.000 |
Immunohistochemistry assay
Calpain-1 and FLNA expression in CRC tissue samples
was detected by immunohistochemistry. Paraffin-embedded CRC tissue
sections (4-µm thick) as well as the corresponding paracancerous
samples were obtained. Sections were deparaffinized by submerging
in xylene for 10 min three times and then hydrated in a graded
series of ethanol. Antigen retrieval was performed with 10 mM
citrate buffer (pH 6.0) at 120°C and 103 kPa for 2 min. Then,
endogenous peroxidase activity was quenched by treatment with 3%
hydrogen peroxide (20 min, ambient temperature), after which the
samples were blocked with 10% normal goat serum (cat. no. ab138478;
Abcam, Cambridge, MA, USA; 30 min, ambient temperature). Next, the
samples were sequentially incubated with anti-calpain-1 (rabbit
monoclonal; cat. no. ab108400; Abcam; dilution 1:150) or anti-FLNA
(rabbit monoclonal; cat. no. ab76289; Abcam; dilution 1:800)
antibodies overnight at 4°C in a humid environment followed by
streptavidin-peroxidase-conjugated secondary antibodies (goat
anti-rabbit IgG; cat. no. zb2306; Beijing Zhongshan Golden Bridge
Biotechnology Co., Ltd., OriGene Technologies, Inc., Rockville, MD,
USA; dilution 1:5,000) for 18 min at ambient temperature. Antibody
detection was performed using a 3,5-diaminobenzidine (DAB)
substrate kit (Beijing Zhongshan Golden Bridge Biotechnology Co.,
Ltd., OriGene Technologies, Inc.), and the slides were
counterstained with haematoxylin. Data were independently analyzed
by two experienced pathologists. A double-headed microscope was
utilized to assess discrepancies. Calpain-1 or FLNA protein
expression levels were evaluated based on staining intensity (0,
negative; 1, weak; 2, moderate; 3, strong) and extent (0, <5%
positive CRC cells; 1, ≥5–25%; 2, ≥26–50%; 3, ≥51–75%; 4, ≥76%).
The product of both subscores represented the final score (0–12). A
score ≤4 reflected low expression levels for both calpain-1 and
FLNA, and was used as the cutoff for diving the patients to
low-expression and high-expression groups for survival and
correlation analyses.
Western blot assay
First, the calpain-1 protein expression levels in
six CRC cell lines were tested. In brief, the human CRC cell lines
HCT116, HT29, LS174T, RKO, SW480, and SW620 were prepared, and the
normal colon cell line NCM460 (purchased from the Shanghai Fudan
Zhongke Biomedical Research and Development Service Center) was
used as control. All CRC cell lines were acquired from the Shanghai
Cell Bank of Chinese Academy of Sciences. The cells were incubated
in Dulbecco's modified Eagle's medium (DMEM; Gibco; Thermo Fisher
Scientific, Inc., Waltham, MA, USA) containing 10% fetal bovine
serum (FBS; MediaTech, Herndon, VA, USA) at 37.5°C in a humidified
incubator containing 5% CO2. CRC cells were harvested,
washed with cold phosphate-buffered saline (PBS) and lysed with
radio-immunoprecipitation assay (RIPA) lysis buffer (Beyotime
Institute of Biotechnology, Haimen, China). Lysates were
centrifuged for 10 min at 11,000 × g at 4°C, and the supernatant
was discarded. Protein samples were prepared by mixing the cell
lysates with 200 µl of BCA mixture and incubating them for 30 min
at 37°C. Then, we measured the absorbance value at 562 nm and
detected the protein concentration of the samples. Proteins (30 µg)
were separated by 12% SDS-PAGE, and then transferred to
polyvinylidene fluoride (PVDF) membranes. The membrane was blocked
with 5% non-fat milk, shaken gently for 2 h, and washed in
Tris-buffered saline with Tween-20 (TBST) buffer on a shaking table
for 10 min; this process was repeated three times before the
addition of antibodies targeting GAPDH (cat. no. ab8245; Abcam;
dilution 1:5,000) calpain-1 (rabbit monoclonal; cat. no. ab108400;
Abcam; dilution 1:1,000) or FLNA (rabbit polyclonal; cat. no.
ab51217; Abcam; dilution 1:2,000) at 4°C overnight. Next, the
membrane was washed in TBST buffer three times, secondary antibody
(goat anti-rabbit IgG; cat. no. zb2306; Beijing Zhongshan Golden
Bridge Biotechnology Co., Ltd., OriGene Technologies, Inc.;
dilution 1:5,000) was added, and the membrane was incubated on a
shaking table for 2 h. The membrane was washed in TBST buffer three
times. An ECL chemiluminescence assay (Clarity Western ECL
Substrate; cat. no. 170-5060; Bio-Rad Laboratories, Inc.) was used
to visualize the signals. The results revealed that HT29 and SW480
cells expressed the highest levels of calpain-1 protein, and
therefore these cell lines were selected for the subsequent
experiments. Second, after calpain-1 was knocked down by
liposome-mediated RNA interference, the calpain-1 and FLNA protein
expression levels in HT29 and SW480 cells were detected by western
blot assay. Third, different concentrations (0, 5, 20 and 40 µg) of
MDL28170 (cat. no. ab145601; Abcam), a calpain-1 inhibitor that
binds with active sulfhydryl and influences the Ca2+
binding site, were added to HT29 and SW480 cells. The calpain-1 and
FLNA protein expression levels in HT29 and SW480 cells were
detected by western blot assay at 48 h following MDL28170
treatment.
Calpain-1 knockdown by
liposome-mediated RNA interference
HT29 and SW480 cells were incubated in DMEM
containing 10% FBS at 37.5°C in a humidified incubator containing
5% CO2. When cells reached 90% confluence, the medium
was removed, the cells were washed twice with PBS and 1 ml of 0.25%
trypsin was added. When the cells had retracted, 4 ml of normal
medium was added to stop the activity. The cells were centrifuged
at 230 × g for 5 min, the supernatant was discarded, and normal
medium was added. The cells were counted and seeded into 10 cm
culture dishes at 1×10⁶ cells/ml. Then, three small
interfering RNAs (siRNAs) against calpain-1 were transfected
[capn1-1983 (siRNA1), 5′-CAUGGAUCGUGAUGGCAAUTT-3′; capn1-2287
(siRNA2), 5′-GGAGUUGUGACCUUUGACUTT-3′; and capn1-1293 (siRNA3),
5′-GAACACCACACUCUACGAATT-3′; 20 pM each; Invitrogen; Thermo Fisher
Scientific, Inc.] into the treatment group using the Lipofectamine
RNAiMAX reagent (Invitrogen; Thermo Fisher Scientific, Inc.),
according to the manufacturers protocol. The negative control (NC)
group was transfected with a scrambled siRNA
(5′-GCAGAAUCACAGCACUUUAUC-3′). To examine the efficiency of RNA
interference, western blot analysis was performed. Cell lysates
were mixed with 200 µl of BCA mixture and incubated for 30 min at
37°C. Then, the absorbance value was measured at 562 nm, and the
protein concentration of the samples was calculated. SDS-PAGE was
performed as aforementioned. PVDF membranes were blocked with 0.5
mg/ml standard bovine serum protein before adding primary antibody
(rabbit monoclonal; cat. no. ab108400; Abcam; dilution 1:1,000) at
4°C overnight. The membrane was washed for 10 min three times on a
shaking table. The secondary antibody (goat anti-rabbit IgG; cat.
no. zb2306; Beijing Zhongshan Golden Bridge Biotechnology Co.,
Ltd., OriGene Technologies, Inc.; dilution 1:5,000) was added to
the membrane and incubated on a shaking table for 2 h at room
temperature. The membrane was washed three times in TBST buffer,
and the protein bands were visualized on a gel imaging
analyser.
Colony formation assay
SW480 and HT29 cells were incubated in serum-free
DMEM for 24 h. Five groups of cells at the logarithmic growth stage
were used, digested with trypsin and centrifuged for 5 min at 64 ×
g, at room temperature. The cell density was adjusted to
4×10⁴ cells/ml, and 2 ml of cell suspension was added
into each well of a 6-well plate. The cells were placed in an
incubator overnight. The medium was changed to serum-free DMEM, and
the cells were incubated for another 24 h before they were
transfected with siRNA (Lipofectamine RNAiMAX; Invitrogen; Thermo
Fisher Scientific, Inc.). After 48 h, cell samples were collected
for colony formation detection. The monolayer of cells in the
logarithmic growth phase was digested with 0.25% trypsin and
suspended in culture medium with 10% FBS. The cell suspension
underwent a gradient dilution and was seeded into culture dishes at
the appropriate cell density (according to the proliferative
capacity). Generally, a suspension containing 100 cells was seeded
in a dish containing 10 ml of pre-heated culture solution at 37°C
and gently rotated to evenly disperse the cells. The cells were
incubated at 37°C in 5% CO2 and saturated humidity for
2–3 weeks. An inverted light microscope (ECLIPSE Ti-S; Nikon
Corporation, Tokyo, Japan) was used to count the number of
colonies.
Detection of cell proliferation with
the Cell Counting Kit-8 (CCK-8) assay
SW480 and HT29 cells were incubated in serum-free
DMEM for 24 h and cells in the logarithmic growth stage were
obtained and centrifuged for 5 min at 64 × g, at room temperature.
The cell density was adjusted to 2×10⁴ cells/ml, and the
suspensions were seeded into 96-well plates at 100 µl/well. After
the SW480 and HT29 cells were incubated overnight, they were
divided into experimental and negative control groups. In the
experimental group, cells were transfected with siRNA for 0, 24, 48
and 72 h. The control group was transfected with the scrambled
siRNA. Then, 10 µl of CCK-8 detection solution (cat. no. ab228554;
Abcam) was added to each well, and a blank control well was
established. After incubation at 37°C for 1.5 h, the optical
density (OD) value was read at 450 nm, and the cell survival rate
was calculated as follows: (OD450 experimental group/OD450 control
group) × 100%.
Detection of apoptosis by flow
cytometry
SW480 and HT29 cells in the logarithmic growth phase
were cultured in serum-free medium for 24 h to synchronize them,
after which the cells were digested, counted and seeded into
culture dishes at 2.5×10⁵ cells/dish. The next day, the
cells were transfected with siRNA or NC for 72 h before they were
collected for flow cytometry analysis of apoptosis. The cells were
centrifuged for 5 min at 64 × g, at room temperature, washed twice
with PBS, and then centrifuged again for 5 min at 100 × g. A total
of 300 µl binding buffer was added to the cells; the cells were
then mixed with 5 µl of Annexin V-fluorescein isothiocyanate (cat.
no. a13199; Invitrogen; Thermo Fisher Scientific, Inc.) and
incubated at room temperature for 15 min. Then, 5 µl of propidium
iodide (cat. no. v13245; Invitrogen; Thermo Fisher Scientific,
Inc.) was added to the samples, which were incubated in the dark
for another 5 min. Finally, 200 µl binding buffer was added, and
the cells were analyzed by flow cytometry (NovoCyte; ACEA
Biosciences, Inc., San Diego, CA, USA.) using the Kaluza analysis
software (Beckman Coulter, Inc., Brea, CA, USA).
Detection of cell migration by the
scratch assay
SW480 and HT29 cells were cultured in DMEM medium
containing 10% FBS and incubated at 37°C in 5% CO2 and
saturated humidity. When SW40 and HT29 cells reached the
logarithmic growth phase, they were transfected with NC or siRNA.
Then, the cells were centrifuged for 5 min at 64 × g at room
temperature and counted. Cells were seeded in 6-well plates, at
1×10⁶ cells/well (2 ml), and incubated overnight. When
the cells grew to 90% confluence, the supernatant was discarded,
and serum-free medium was added. After the cells were scratched
with a 10 µl Microlance needle, the supernatant was discarded, the
floating cells were washed off with PBS, and serum-free medium was
added to the culture. Then, Leica Application Suite software was
used to capture photos (magnification, ×100) and record the scratch
distance at 0, 24 and 48 h. Cells in each group were observed under
an inverted microscope, and the cell mobility of each group was
calculated. The formula was as follows: Cell migration rate % = (0
h scratch distance-scratch distance at a certain time)/0 h scratch
distance × 100%.
Migration and invasion assays
SW480 and HT29 cells were incubated in serum-free
DMEM for 24 h, transfected with NC or siRNA and collected 48 h
later. The cells were treated with 0.25% trypsin and 0.02% EDTA,
stained with trypan blue, and washed twice with PBS. A total of
5×10⁴ cells in 200 µl of medium was added to the upper
chamber of migration and invasion Transwells, and 600 µl of medium
with 10% FBS was added to the lower chambers. The cells were
incubated for 24 h in 5% CO2 at 37°C, after which the
Transwell chamber was removed, the non-migratory cells in the upper
Transwell chamber were wiped off with cotton swabs, and the insert
was inverted and dried. Next, 500 µl of 0.1% crystal violet per
well was added to a 24-well plate, and the cells were stained at
37°C for 30 min. The cells were washed with PBS, three random views
were photographed per filter, and the average number of cells was
calculated.
Statistical analysis
SPSS v22.0 (IBM Corp., Armonk, NY, USA) was employed
for the statistical analyses. Data are presented as the mean ±
standard error of the mean from three independent experiments and
were assessed by one-way analysis of variance followed by SNK post
hoc test. Chi-square test and the Kaplan-Meier method with the
log-rank test were used to assess the associations between
calpain-1 or FLNA expression and pathological indices. P<0.05
was considered to indicate a statistically significant
difference.
Results
Calpain-1 and FLNA expression levels
are associated with the clinicopathological features of CRC
patients
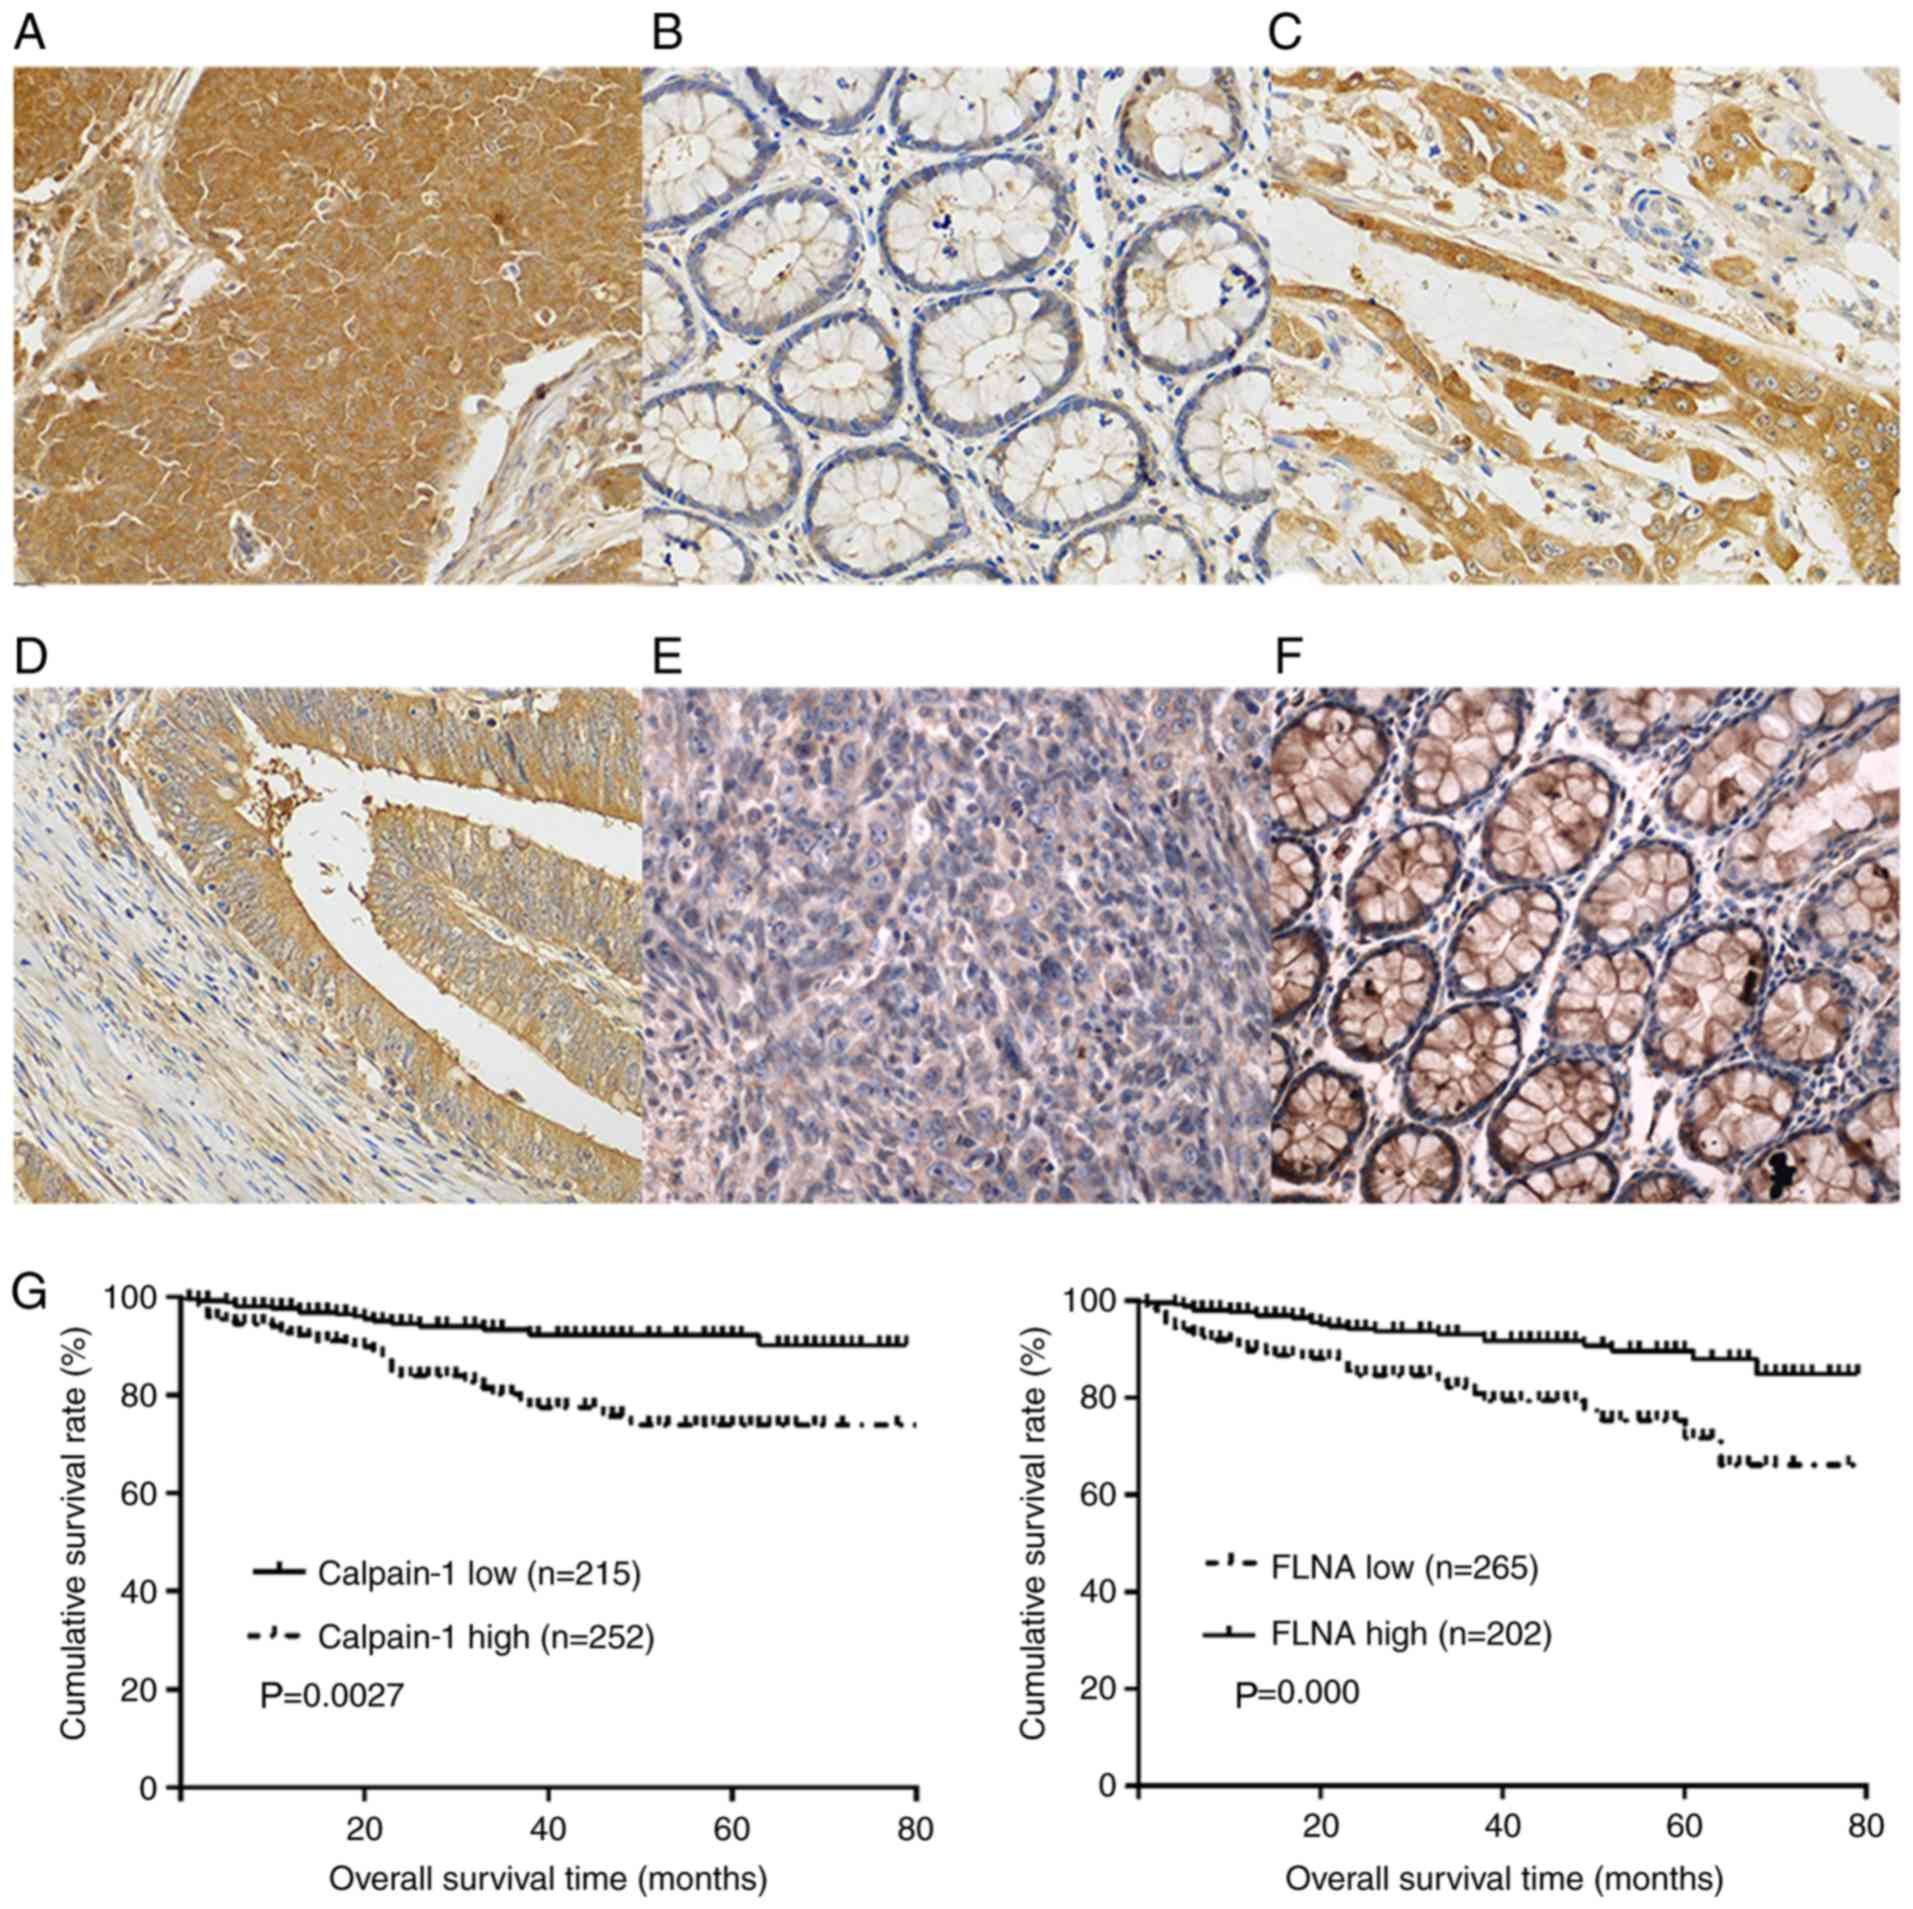
The immunohistochemistry results revealed that
calpain-1 protein was highly expressed in 252 (252/467, 53.9%) CRC
patients (Fig. 1A) but only in 42
(42/467, 9.0%) adjacent non-cancerous tissues (P=0.000). In
addition, the expression levels of calpain-1 in most of the
adjacent non-cancerous colorectal tissues was low (Fig. 1B). High expression levels of
calpain-1 were more often found in the less differentiated CRC
tissues (105/177, 59.3%; Fig. 1C)
than in the moderately to well-differentiated CRC tissues (147/290,
50.7%; Fig. 1D; P=0.02). High
expression levels of calpain-1 were significantly associated with
age, metastasis, Dukes stage and survival time, but not with sex,
histologic grade, tumor location or tumor size (Table I).
By contrast, FLNA protein was expressed at low
levels in 265 (265/467, 56.7%) CRC tissues (Fig. 1E) and was highly expressed in 382
(382/467, 81.8%) adjacent non-cancerous tissues (Fig. 1F; P=0.000). A low expression level
of FLNA was significantly associated with tumor size, histological
grade, metastasis, Dukes stage and survival time, but not with age,
sex, or tumor location (Table
I).
Relationship between calpain-1 or FLNA
expression and the prognosis of CRC patients
In total, 467 CRC patients were divided into two
groups according to their immunohistochemical results. Group one
consisted of 252 patients with high levels of calpain-1 expression
and had a mean overall survival (OS) of 59.7 months [95% confidence
interval (CI), 54.8–64.7]. Group two consisted of 215 patients with
low levels of calpain-1 expression and had a mean OS of 51 months
(95% CI, 45.7–56.2). The results indicated that patients with high
levels of calpain-1 expression had shorter OS compared with
patients with low levels of calpain-1 expression (P=0.0027;
Fig. 1G). The patients were also
grouped according to their level of FLNA expression, and the mean
OS of the FLNA overexpression group was 60.7 months (95% CI,
52.9–62.6), while the mean OS of the group with low levels of FLNA
expression was 50.7 months (95% CI, 45.7–56.2). In contrast to the
calpain-1 results, patients with high levels of FLNA expression had
longer OS than patients with low levels of FLNA expression
(P=0.000; Fig. 1G).
Relationship between calpain-1 and
FLNA expression
In all 467 patients, there were 94 cases with high
expression of calpain-1 and FLNA, 108 cases with high expression of
FLNA and low expression of calpain-1, 158 cases with low expression
of FLNA and high expression of calpain-1, and 107 cases with low
expression of both. In ~57% (268/467) of patients, the expression
level of calpain-1 was inversely correlated to that of FLNA. A
significant inverse relationship was found between the expression
levels of calpain-1 and FLNA (P=0.007; Table II).
| Table II.Relationship between calpain-1 and
FLNA expression. |
Table II.
Relationship between calpain-1 and
FLNA expression.
|
| Calpain-1 |
|
|
|
|---|
|
|
|
|
|
|
|---|
| FLNA | High | Low | Total |
χ2-value | P-value |
|---|
| High | 94 | 108 | 202 | 7.385 | 0.007 |
| Low | 158 | 107 | 265 |
|
|
| Total | 252 | 215 | 467 |
|
|
Calpain-1 expression and
siRNA-mediated knockdown in CRC cells
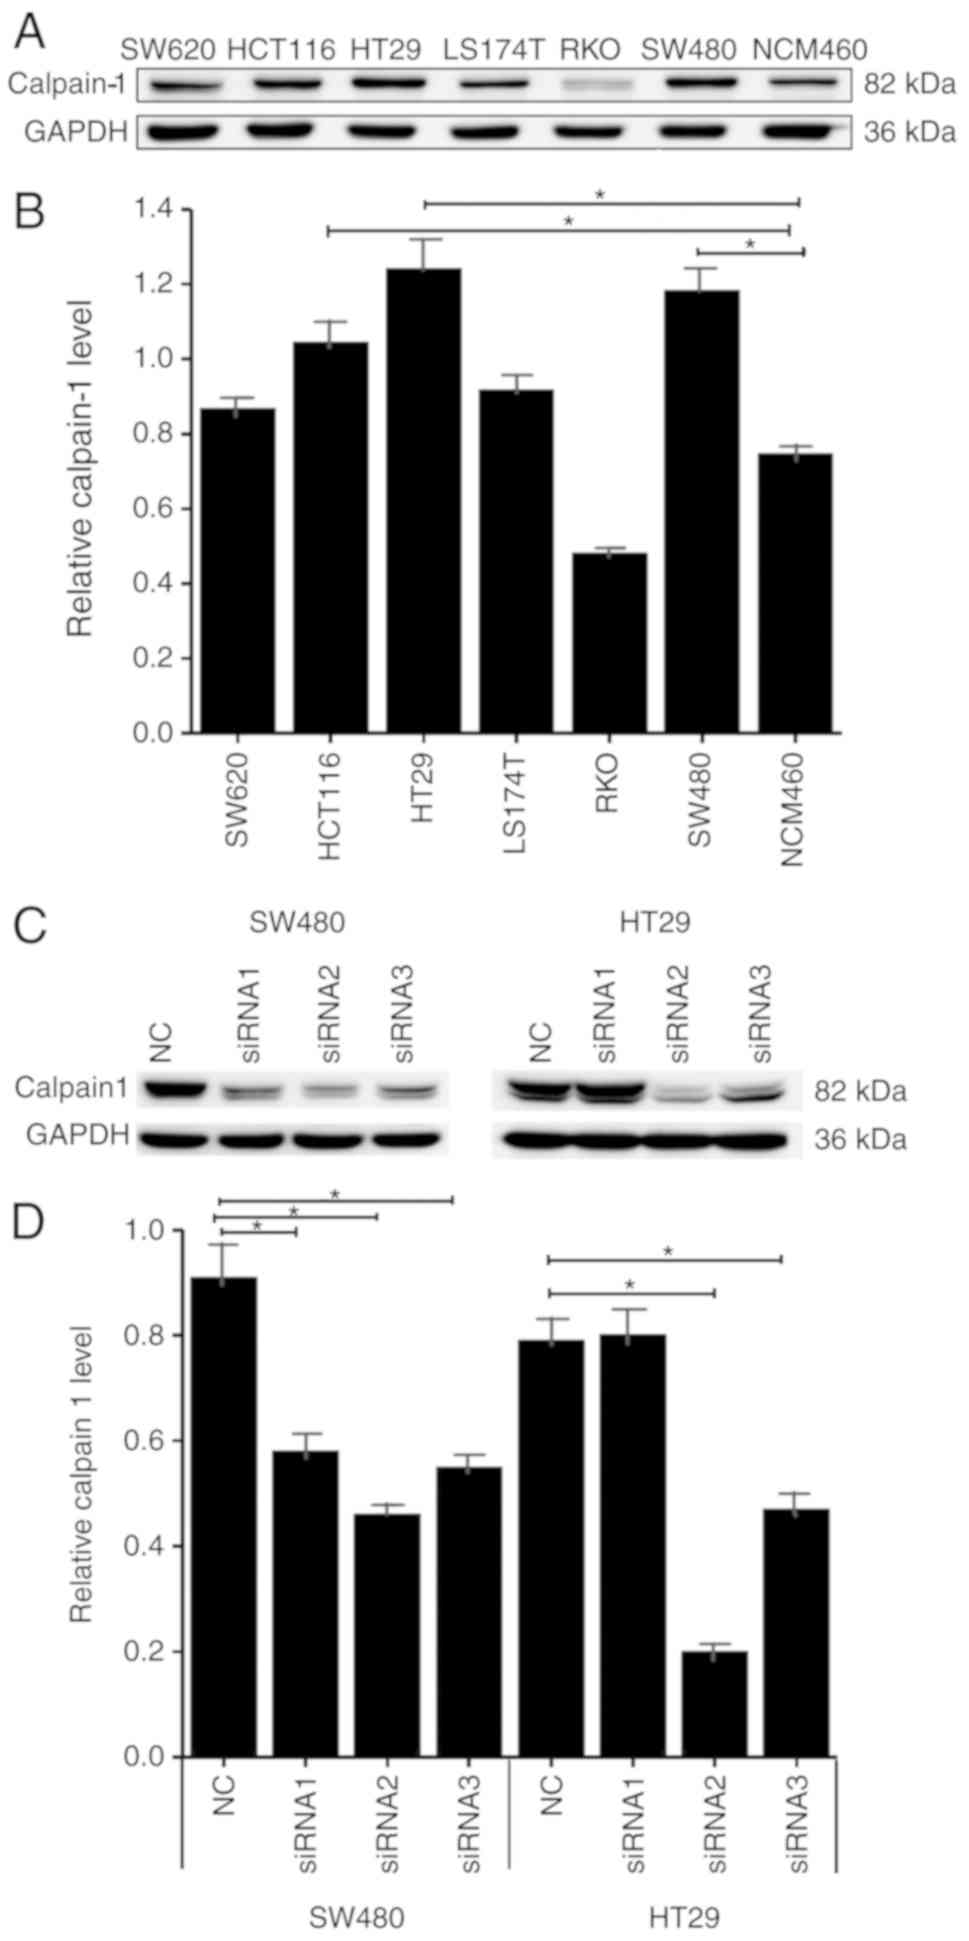
Calpain-1 expression levels were examined by western
blotting in 6 CRC cell lines (HCT116, HT29, LS174T, RKO, SW480 and
SW620) and one normal colon cell line, NCM460. Five of the colon
cancer cell lines expressed high levels of calpain-1 protein
compared with the normal colon NCM460 cells, among which HT29 and
SW480 cells had the highest levels (Fig. 2A and B). Therefore, HT29 and SW480
cells were used for all subsequent experiments. Three siRNAs were
designed against calpain-1 and transfected into the CRC cells. In
HT29 cells, calpain-1 levels of NC and three siRNA groups were
0.91±0.11, 0.58±0.05, 0.47±0.03 and 0.56±0.04, respectively. In
SW480 cells, the levels of NC and three siRNA groups were
0.79±0.07, 0.80±0.08, 0.21±0.02 and 0.49±0.04, respectively.
Calpain-1 protein was downregulated to different degrees in HT29
and SW480 cells following knockdown by the three siRNAs. siRNA2 was
the most efficient in silencing calpain-1 in both cell lines
(Fig. 2C and D), and therefore,
siRNA2 was selected for use in subsequent experiments.
Calpain-1 knockdown inhibits colony
formation in CRC cells
As presented in Fig.
3, the number of colonies in the SW480 NC, SW480 siRNA, HT29
NC, and HT29 siRNA groups was 151±13, 66±5 (P<0.05), 76±8, and
26±3 (P<0.05), respectively. Calpain-1 knockdown significantly
inhibited the colony forming ability of both HT29 and SW480 cells
compared with control (Fig. 3A and
B).
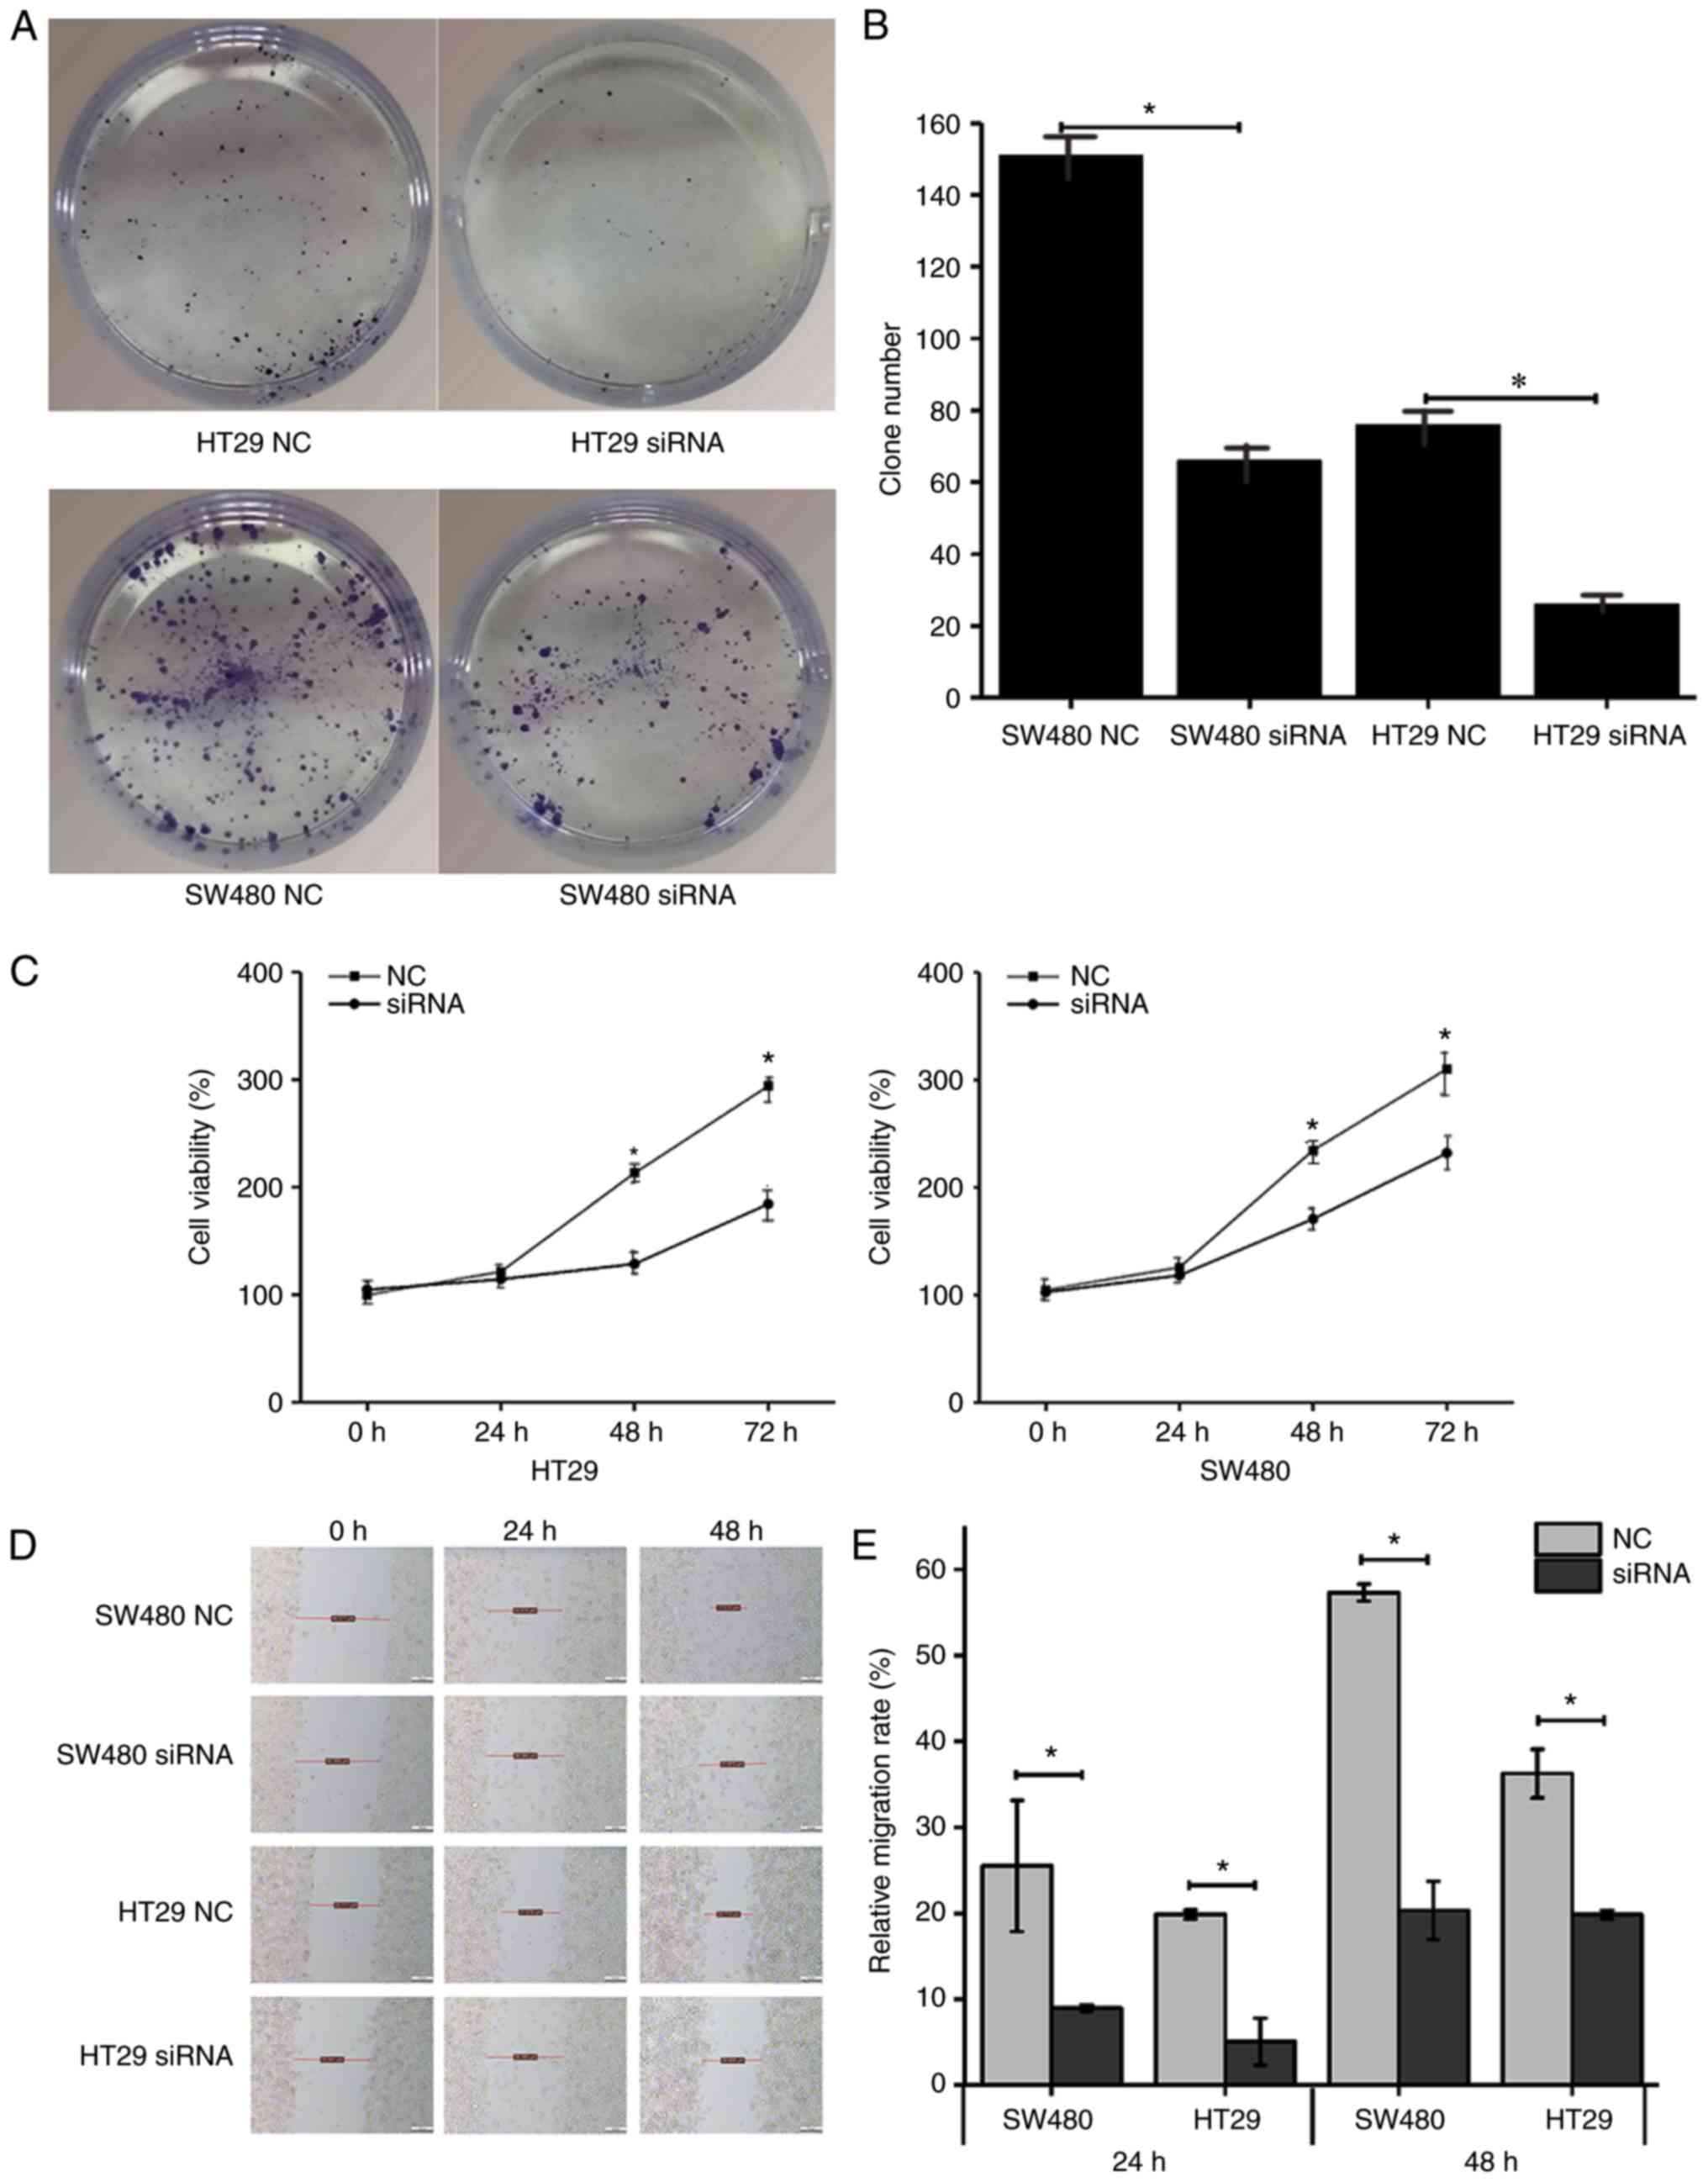 | Figure 3.Calpain-1 knockdown inhibits colony
formation, proliferation and migration ability of CRC cells. HT29
and SW480 cells were transfected with either NC or
calpain-1-targeting siRNA. (A) Representative images and (B)
quantification of results from colony formation assay. (C) Cell
viability by Cell Counting Kit-8 assay. (D) Representative imaged
and (E) quantification of scratch migration assay. In the SW480 NC
group, distance at 0 h was 44.311 µm, at 24 h 34.919 µm, at 48 h
17.614 µm; in the SW480 siRNA group, distance at 0 h was 40.358 µm,
at 24 h 36.380 µm, at 48 h 31.870 µm; in the HT29 NC group,
distance at 0 h was 32.711 µm, at 24 h 27.679 µm, at 48 h 22.713
µm; and in HT29 siRNA group, distance at 0 h was 35.941 µm, at 24 h
36.380 µm, at 48 h 28.459 µm. *P<0.05 compared with NC. CRC,
colorectal cancer; si, small interfering; NC, negative control. |
Calpain-1 knockdown inhibits cell
proliferation as measured by the CCK-8 assay
As presented in Fig.
3C, in the 0 h group, the viability of cells in the HT29 NC,
HT29 siRNA, SW480 NC, and SW480 siRNA groups was 100.0±2.8%,
104.7±4.1% (P=0.174), 104.7±4.8%, and 102.5±5.0% (P=0.606),
respectively. At 24 h, the viability of cells in the same groups
was 121.3±1.8%, 114.4±2.2% (P=0.013), 125.7±4.9%, and 118.2±3.5%
(P=0.097), respectively. At 48 h, the viability was 213.1±3.7%,
128.6±2.6% (P=0.000), 234.5±1.9%, and 170.7±4.4% (P=0.000),
respectively. Finally, at 72 h, the viability was 294.0±3.5%,
184.3±7.6% (P=0.000), 310.1±18.2%, and 231.9±7.6% (P=0.002),
respectively. Thus, calpain-1 knockdown significantly reduced the
numbers of viable cells compared with control (Fig. 3C).
Calpain-1 knockdown inhibits the
migration ability of CRC cells as measured by the scratch
assay
After transfecting HT29 and SW480 cells with siRNA,
scratch assays were performed to compare the migration ability of
the cells. As presented in Fig. 3D and
E, in the 24 h group, the relative migration rate of SW480 NC,
SW480 siRNA, HT29 NC, and HT29 siRNA cells was 25.51±7.64,
8.97±0.39, 19.87±0.52 and 5.08±2.74%, respectively. In the 48 h
group, the relative migration rate was 57.32±0.99, 20.34±3.38,
36.26±2.83 and 19.85±0.49%, respectively. The migration ability was
decreased following calpain-1 knockdown and was higher in SW480
cells than in HT29 cells.
Calpain-1 knockdown inhibited the
migration and invasion of CRC cells
As presented in Fig.
4A-D, calpain-1 knockdown resulted in fewer migrating [SW480 NC
(93.33±5.69) vs. SW480 siRNA (7.67±0.58), P=0.0014; HT29 NC
(24.00±2.65) vs. HT29 siRNA (6.65±0.48), P=0.0115] and invading
[SW480 NC (93.33±5.69) vs. SW480 siRNA (3.67±0.58), P=0.0011; HT29
NC (19.33±1.53) vs. HT29 siRNA (4.67±0.58), P=0.0036] cells
compared with the control groups. These results revealed that
calpain-1 knockdown significantly inhibited the migration and
invasion abilities of CRC cells.
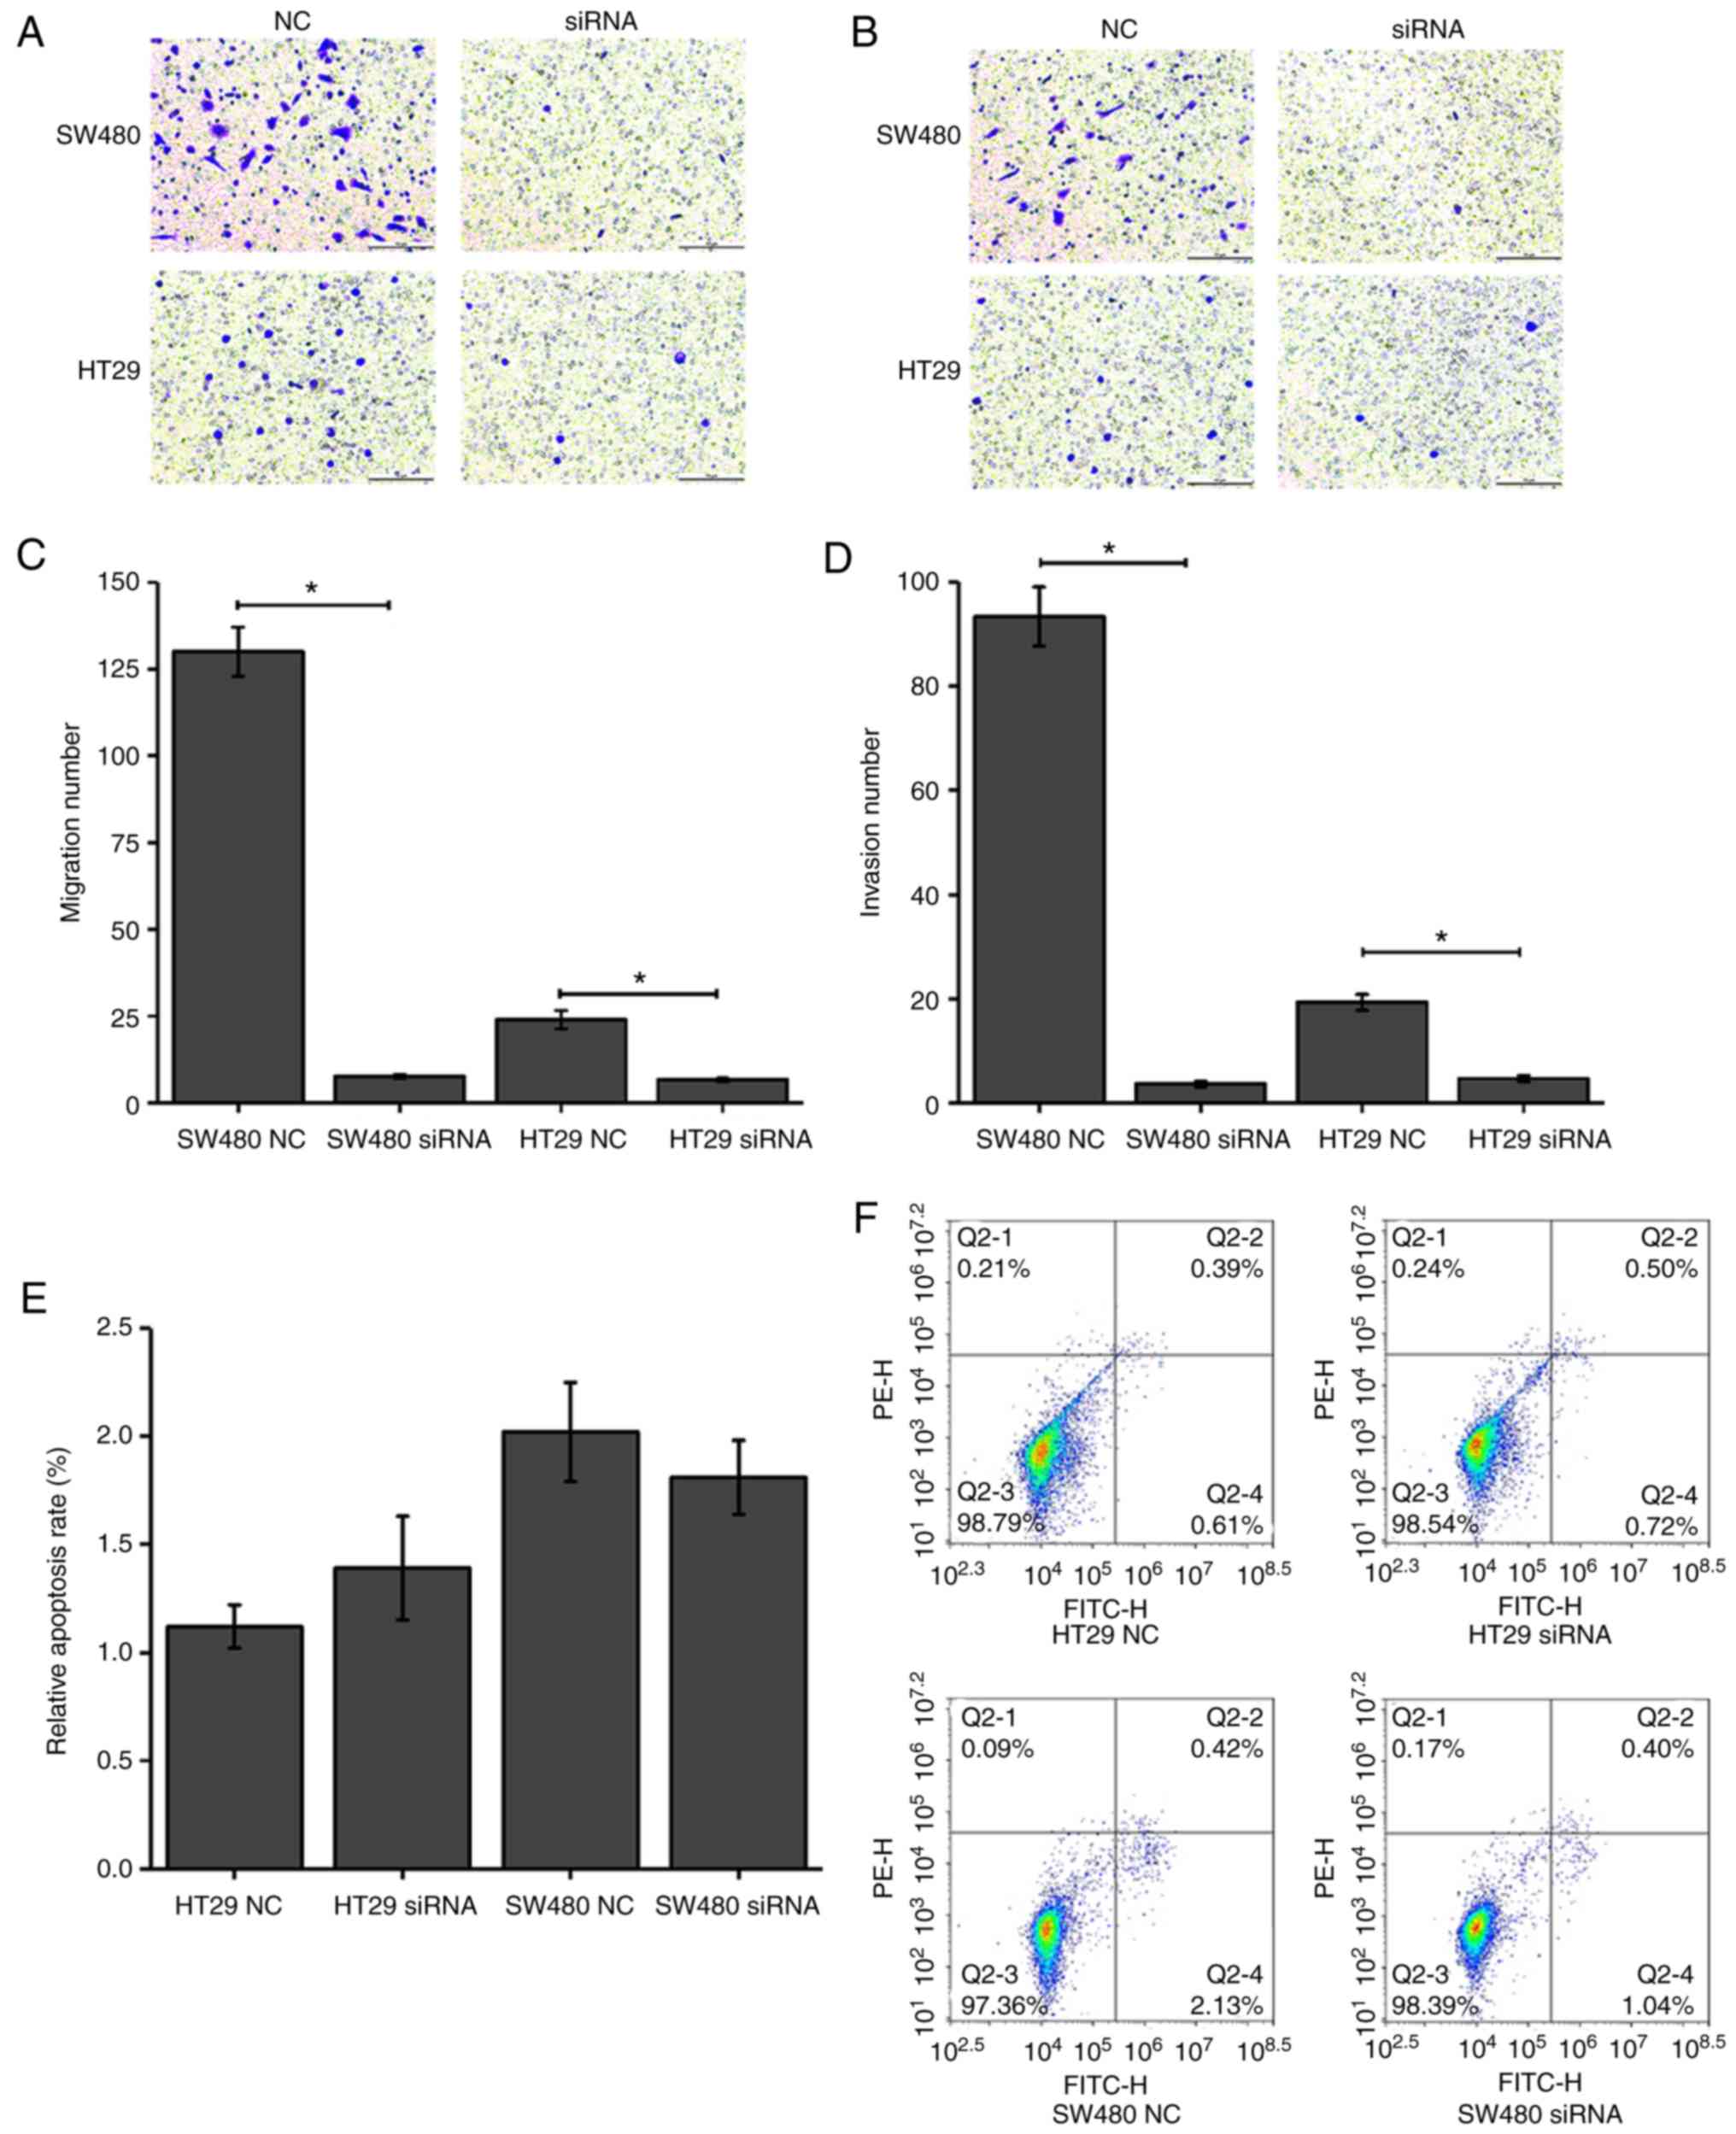 | Figure 4.Effect of calpain-1 knockdown on CRC
cell migration, invasion and apoptosis. HT29 and SW480 cells were
transfected with either NC or calpain-1-targeting siRNA. (A)
Representative images of Transwell migration assays (magnification,
×200; Scale bar, 10 µm). (B) Representative images of Transwell
invasion assays (magnification, ×200; Scale bar, 10 µm). (C)
Quantification of migration from panel A. (D) Quantification of
invasion from panel B. (E) Quantification and (F) representative
plots of flow cytometry analysis of apoptosis. Q1, necrotic cells;
Q2, late apoptotic cells; Q3, normal cells; Q4, early apoptotic
cells. *P<0.05 compared with NC. CRC, colorectal cancer; si,
small interfering; NC, negative control. |
Calpain-1 knockdown has no significant
effect on the apoptosis of CRC cells
Following calpain-1 knockdown in HT29 and SW480
cells, flow cytometry was used to detect the apoptosis rate and
compare it to control cells. As presented in Fig. 4E and F, the apoptosis rates of the
HT29 NC and HT29 siRNA groups were 1.12±0.10 and 1.39±0.24,
respectively, and the apoptosis rates of the SW480 NC and SW480
siRNA groups were 2.02±0.23 and 1.81±0.17, respectively. The
results revealed that the apoptosis rates of both cell lines
following calpain-1 knockdown were not altered compared with the
control groups (P>0.05).
Calpain-1 knockdown in CRC cells is
associated with the upregulation of FLNA
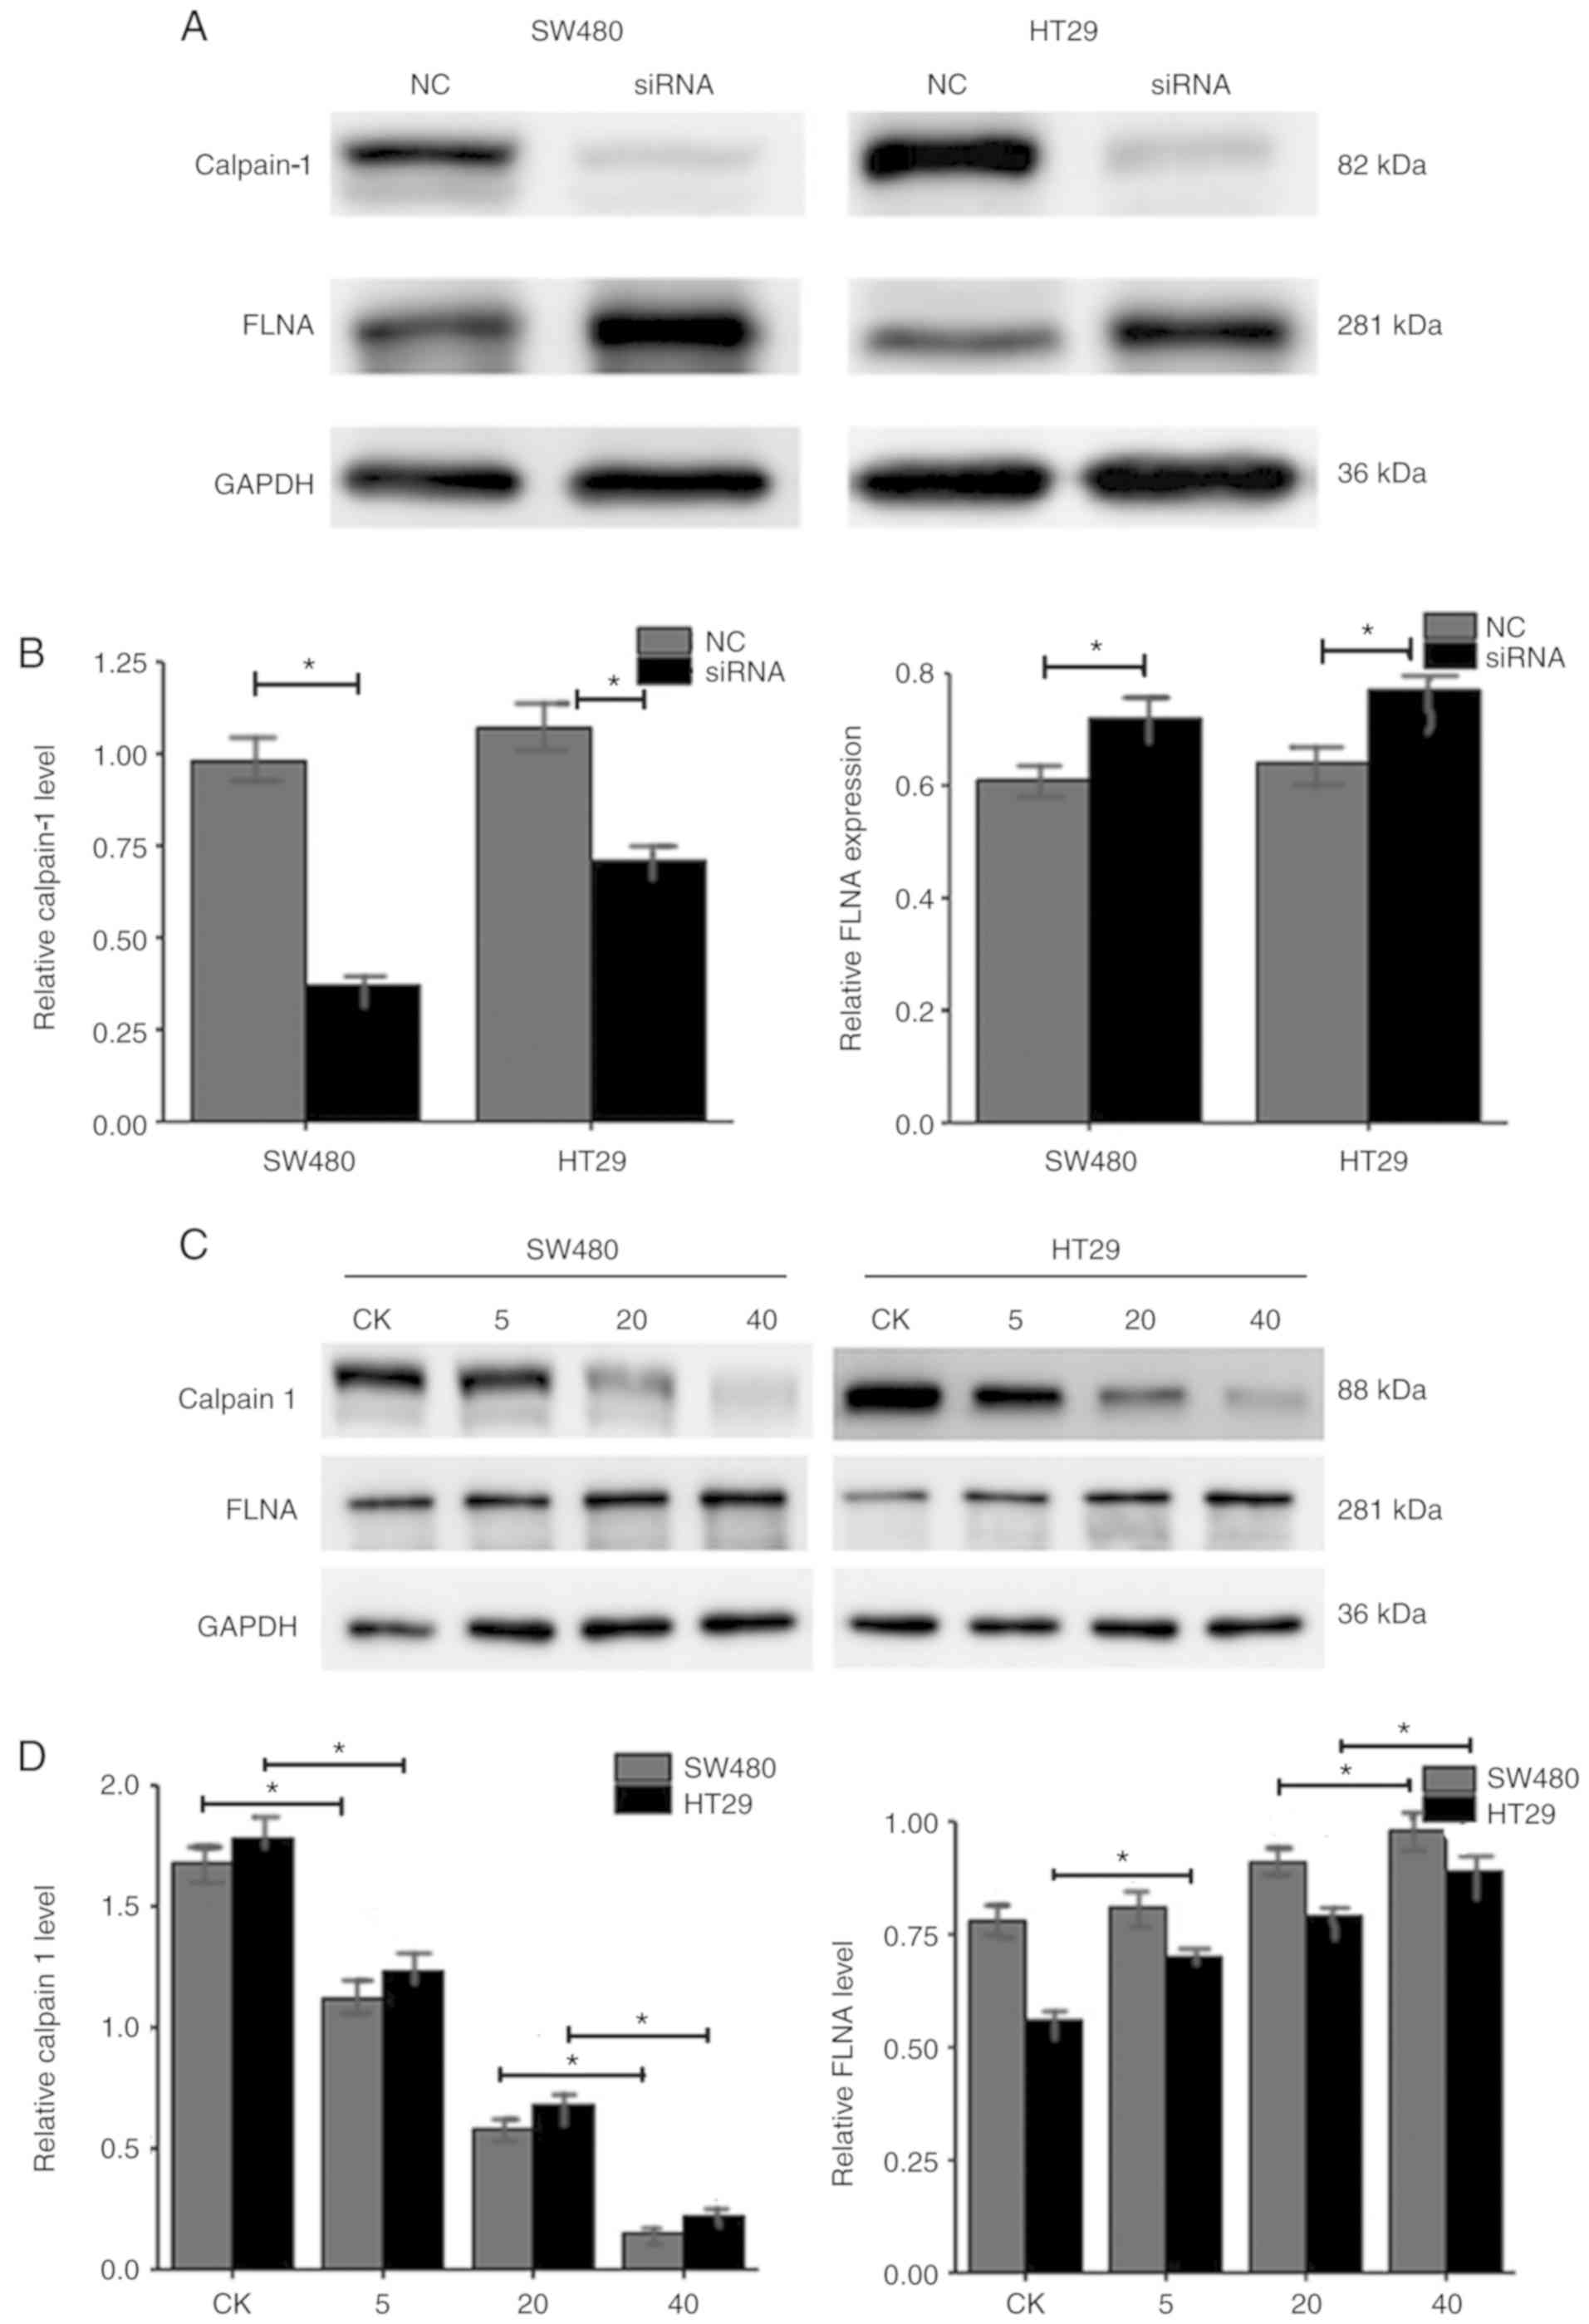
As presented in Fig. 5A
and B, the relative protein expression levels of calpain-1 in
SW480 NC, SW480 siRNA, HT29 NC, and HT29 siRNA groups were
0.98±0.09, 0.38±0.04, 1.08±0.10, 0.69±0.06, respectively. The
relative protein expression levels of FLNA in SW480 NC, SW480
siRNA, HT29 NC, and HT29 siRNA groups were 0.61±0.03, 0.73±0.06,
0.65±0.04, 0.77±0.06, respectively. The western blot results
revealed that calpain-1 knockdown decreased calpain-1 expression,
while it increased FLNA expression in both CRC cell lines.
FLNA expression is upregulated when
calpain-1 expression is decreased
MDL28170, a calpain-1 inhibitor, was used to test if
FLNA expression is directly influenced by the expression of
calpain-1. As the MDL28170 treatment amount increased from 0 to 40
µg, the levels of calpain-1 in SW480 control, SW480 5 µg, SW480 20
µg and SW480 40 µg groups were 1.65±0.13, 1.11±0.09, 0.61±0.05,
0.19±0.02, respectively (Fig. 5C and
D). The levels of calpain-1 in the corresponding HT29 groups
were 1.75±0.15, 1.22±0.11, 0.69±0.05, 0.22±0.03, respectively
(Fig. 5C and D). The levels of FLNA
in the corresponding SW480 groups were 0.77±0.06, 0.79±0.06,
0.87±0.08 and 0.95±0.10, and in the HT29 groups 0.57±0.03,
0.69±0.04, 0.76±0.05 and 0.84±0.08, respectively (Fig. 5C and D). The results revealed that
as calpain-1 expression decreased in a dose-dependent manner, the
FLNA expression levels increased, in both CRC cells lines.
Discussion
Calpain-1 was first recognized as a
Ca2+-dependent neutral protease in rat brain (16). Deficiency of the calpain-1 gene in
mice results in abnormal growth, decreased platelet aggregation and
poor blood clotting (17). Calpain
is involved in target protein hydrolysis, thus has a role in the
protein modification pathway (18).
Calpain is also involved in cell mobility, proliferation, cell
cycle progression, migration, necrosis, apoptosis (2,19),
platelet activation, differentiation and membrane fusion (3,20,21).
Calpain-1 is so versatile that it is easy to speculate that it may
have a role in tumorigenesis and cancer progression.
Indeed, several studies have demonstrated that
calpains are associated with certain types of cancer. In renal cell
cancer, a higher expression level of calpain-1 was correlated with
more advanced disease and worse prognosis (22). In melanoma, calpains are involved in
mitogen-activated protein kinase (MAPK)-dependent cyclin-dependent
kinase inhibitor 1B (p27Kip1) regulation, and calpain inhibitors
impair MAPK-dependent p27Kip1 downregulation in melanoma cells
(23). Based on these studies,
calpain may act as a tumor promoter. However, the role of the
calpain-1 gene in CRC has not been reported.
Immunohistochemical staining of 467 paired specimens
of CRC and adjacent paracancerous tissues was performed to examine
the relationship between calpain protein expression and the
clinicopathological features of CRC. First, the expression level of
calpain-1 protein in CRC tissues was demonstrated to be
significantly higher compared with the adjacent normal tissues by
immunohistochemistry. Overexpression of calpain-1 was associated
with age, metastasis, and Dukes stage, and Kaplan-Meier analysis
revealed that patients in the calpain-1 high expression group had a
shorter OS compared with the low expression group. These results
indicated that overexpression of calpain-1 may be associated with a
worse prognosis in CRC patients.
To investigate the biological function of calpain-1
in CRC, calpain-1 expression levels in six CRC cell lines were
detected by western blotting. Calpain-1 protein was highly
expressed in five of the CRC cell lines compared with a healthy
intestinal epithelial cell line (NCM460). Next, an in vitro
model of calpain-1 knockdown was established by siRNA transfection
in HT29 and SW480 CRC cells, and successful knockdown was confirmed
by western blotting. Using this model, the effects of calpain-1 on
the proliferation of HT29 and SW480 cells were examined and the
results demonstrated that calpain-1 knockdown inhibited the
proliferative ability of CRC cells. Similarly, Ma et al
(24) reported that downregulation
of calpain-1 in oral squamous cell carcinoma cells resulted in cell
cycle arrest and inhibited proliferation. Colony formation assays
in the present study revealed that the colony forming ability of
CRC cells was significantly inhibited following calpain-1
knockdown. A previous study has also demonstrated that calpain
inhibitors impair colony formation of mouse tumor cells (25). These results suggested that
calpain-1 promoted cell proliferation in CRC cell lines. By
contrast, the present results revealed that calpain-1 had no effect
on apoptosis in HT29 and SW480 cells, which was in agreement with
previously reported results. Calpain-1 knockdown did not increase
the CRC cell apoptosis rate compared with the negative control
group. Additionally, calpain-1 knockdown inhibited the migration
and invasion abilities of CRC cells. This is consistent with the
experimental results of Ma et al (24) in oral squamous cell carcinoma cells.
The present results suggested that a high expression level of
calpain-1 may promote the malignant biological behavior of CRC
cells. The underlying mechanism requires further investigation.
FLNA is an actin filament cross-linking protein
involved in cancer progression; it is the most abundant and widely
expressed isoform of filamin in human tissues and can be cleaved by
calpain. Research has demonstrated that FLNA is a novel cancer
suppressor gene in colorectal adenocarcinoma (15). The relationship between calpain and
FLNA in the development of CRC is of interest. The
immunohistochemistry results revealed that FLNA protein expression
levels in adjacent normal colorectal tissues were significantly
higher than those in CRC tissues. Low expression of FLNA was
associated with tumor size, histologic grade, metastasis and Dukes
stage. Kaplan-Meier analysis revealed that the FLNA low expression
group had a shorter OS compared with the high expression group.
These results suggested that FLNA may act as a tumor suppressor in
CRC. Notably, calpain expression is correlated with FLNA
expression. One study reported that activation of calpain followed
by the cleavage of FLNA resulted in enhanced motility of melanoma
cells (26). To further confirm the
relationship between calpain-1 and FLNA, the expression levels of
FLNA and calpain-1 in HT29 and SW480 cells were examined. The
results demonstrated that when calpain-1 expression was
downregulated, FLNA expression was increased. Similarly, after
adding different concentrations of a calpain inhibitor, the FLNA
expression levels were increased in a dose-dependent manner.
Therefore, it can be speculated that calpain-1 may promote CRC
progression via cleavage of FLNA, which is consistent with the
findings of Salimi et al (25); by proliferation, migration, invasion
and colony formation assays, they concluded that a calpain
inhibitor decreased human and mouse tumor cell growth by blocking
the cleavage of FLNA.
In conclusion, the present findings suggested that
high levels of calpain-1 predicted a poor prognosis and contributed
to tumor progression in CRC. These tumor promoting functions of
calpain-1 may occur through calpain-mediated cleavage of FLNA. In
the future, calpain-1 might serve as a novel target gene for CRC
therapy.
Acknowledgements
We would like to thank Mr. Xie Zuokai (Department of
Pathology, The Second Affiliated Hospital and Yuying Children's
Hospital of Wenzhou Medical University) for contributing to the
statistical analysis of this article.
Funding
This study received funding from the Zhejiang
Provincial Natural Science Foundation of China (grant no.
LY15H160059), the College Student and Technology Innovation
Programme of Zhejiang Province (grant no. 2017R413021), the Wenzhou
Municipal Science and Technology Bureau (grant no. Y20170035) and
the Medical and Health Science and Tech-nology Project of Zhejiang
Province (grant no. 2018245219).
Availability of data and materials
The datasets used and analyzed during the current
study are available from the corresponding author on reasonable
request.
Authors' contributions
LZ and ZX conceived, designed, reviewed and edited
the manuscript. LY, YL, HY and XY performed the experiments. CX and
YZ wrote the paper. CX wrote the manuscript, performed the data
analysis and interpretation. YZ collected the pathological features
and clinical data of colorectal cancer patients and approved the
publication of the final version. ZC reviewed and edited the
manuscript and also involved in the conception of the study. All
authors read and approved the manuscript and agree to be
accountable for all aspects of the research in ensuring that the
accuracy or integrity of any part of the work are appropriately
investigated and resolved.
Ethics approval and consent to
participate
The present study was approved by the Ethics
Committee of the Second Affiliated Hospital of Wenzhou Medical
University, and informed consent was obtained from each
patient.
Patient consent for publication
Not applicable.
Competing interests
The authors declare that they have no competing
interests.
References
|
1
|
Ferlay J, Shin HR, Bray F, Forman D,
Mathers C and Parkin DM: Estimates of worldwide burden of cancer in
2008: GLOBOCAN 2008. Int J Cancer. 127:2893–2917. 2010. View Article : Google Scholar : PubMed/NCBI
|
|
2
|
Cotton SW, Kornegay JN, Bogan DJ, Wadosky
KM, Patterson C and Willis MS: Genetic myostatin decrease in the
golden retriever muscular dystrophy model does not significantly
affect the ubiquitin proteasome system despite enhancing the
severity of disease. Am J Transl Res. 6:43–53. 2013.PubMed/NCBI
|
|
3
|
Arthur JS, Elce JS, Hegadorn C, Williams K
and Greer PA: Disruption of the murine calpain small subunit gene,
Capn4: Calpain is essential for embryonic development but not for
cell growth and division. Mol Cell Biol. 20:4474–4481. 2000.
View Article : Google Scholar : PubMed/NCBI
|
|
4
|
Suzuki K, Hata S, Kawabata Y and Sorimachi
H: Structure, activation, and biology of calpain. Diabetes. 53
(Suppl 1):S12–S18. 2004. View Article : Google Scholar : PubMed/NCBI
|
|
5
|
Huang Y and Wang KK: The calpain family
and human disease. Trends Mol Med. 7:355–362. 2001. View Article : Google Scholar : PubMed/NCBI
|
|
6
|
Gonzalez A, Abril E, Roca A, Aragón MJ,
Figueroa MJ, Velarde P, Royo JL, Real LM and Ruiz A: CAPN10 alleles
are associated with polycystic ovary syndrome. J Clin Endocrinol
Metab. 87:3971–3976. 2002. View Article : Google Scholar : PubMed/NCBI
|
|
7
|
Ehrmann DA, Schwarz PE, Hara M, Tang X,
Horikawa Y, Imperial J, Bell GI and Cox NJ: Relationship of
calpain-10 genotype to phenotypic features of polycysticovary
syndrome. J Clin Endocrinol Metab. 87:1669–1673. 2002. View Article : Google Scholar : PubMed/NCBI
|
|
8
|
Ohno S, Minoshima S, Kudoh J, Fukuyama R,
Shimizu Y, Ohmi-Imajoh S, Shimizu N and Suzuki K: Four genes for
the calpain family locate on four distinct human chromosomes.
Cytogenet Cell Genet. 53:225–229. 1990. View Article : Google Scholar : PubMed/NCBI
|
|
9
|
Storr SJ, Thompson N, Pu X, Zhang Y and
Martin SG: Calpain in breast cancer: Role in disease progression
and treatment response. Pathobiology. 82:133–141. 2015. View Article : Google Scholar : PubMed/NCBI
|
|
10
|
Storr SJ, Carragher NO, Frame MC, Parr T
and Martin SG: The calpain system and cancer. Nat Rev Cancer.
11:364–374. 2011. View
Article : Google Scholar : PubMed/NCBI
|
|
11
|
Storr SJ, Woolston CM, Barros FF, Green
AR, Shehata M, Chan SY, Ellis IO and Martin SG: Calpain-1
expression is associated with relapse-free survival in breast
cancer patients treated with trastuzumab following adjuvant
chemotherapy. Int J Cancer. 129:1773–1780. 2011. View Article : Google Scholar : PubMed/NCBI
|
|
12
|
Luo W, Ren Z, Gao S, Jin H, Zhang G, Zhou
L and Zheng S: Clinical correlation of calpain-1 and glypican-3
expression with gallbladder carcinoma. Oncol Lett. 11:1345–1352.
2016. View Article : Google Scholar : PubMed/NCBI
|
|
13
|
Salehin D, Fromberg I, Haugk C, Dohmen B,
Georg T, Bohle RM, Bauerschlag D, Maass N and Friedrich M:
Immunhistochemical analysis for expression of calpain 1, calpain 2
and calpastatin in endometrial cancer. Anticancer Res.
30:2837–2843. 2010.PubMed/NCBI
|
|
14
|
Kovacs L and Su Y: The critical role of
calpain in cell proliferation. Biomol Res Ther. 3:1122014.
|
|
15
|
Tian ZQ, Shi JW, Wang XR, Li Z and Wang
GY: New cancer suppressor gene for colorectal adenocarcinoma:
Filamin A. World J Gastroenterol. 21:2199–2205. 2015. View Article : Google Scholar : PubMed/NCBI
|
|
16
|
Guroff G: A neutral, calcium-activated
proteinase from the soluble fraction of rat brain. J Biol Chem.
239:149–155. 1964.PubMed/NCBI
|
|
17
|
Azam M, Andrabi SS, Sahr KE, Kamath L,
Kuliopulos A and Chishti AH: Disruption of the mouse mu-calpain
gene reveals an essential role in platelet function. Mol Cell Biol.
21:2213–2220. 2001. View Article : Google Scholar : PubMed/NCBI
|
|
18
|
Sorimachi H, Hata S and Ono Y: Impact of
genetic insights into calpain biology. J Biochem. 150:23–37. 2011.
View Article : Google Scholar : PubMed/NCBI
|
|
19
|
Van Ba H and Inho H: Significant role of
µ-calpain (CANP1) in proliferation/survival of bovine skeletal
muscle satellite cells. In vitro Cell Dev Biol Anim. 49:785–797.
2013. View Article : Google Scholar : PubMed/NCBI
|
|
20
|
Santella L, Kyozuka K, De Riso L and
Carafoli E: Calcium, protease action, and the regulation of the
cell cycle. Cell Calcium. 23:123–130. 1998. View Article : Google Scholar : PubMed/NCBI
|
|
21
|
Wang KK: Calpain and caspase: Can you tell
the difference? Trends Neurosci. 23:20–26. 2000. View Article : Google Scholar : PubMed/NCBI
|
|
22
|
Braun C, Engel M, Seifert M, Theisinger B,
Seitz G, Zang KD and Welter C: Expression of calpain I messenger
RNA in human renal cell carcinoma: Correlation with lymph node
metastasis and histological type. Int J Cancer. 84:6–9. 1999.
View Article : Google Scholar : PubMed/NCBI
|
|
23
|
Delmas C, Aragou N, Poussard S, Cottin P,
Darbon JM and Manenti S: MAP kinase-dependent degradation of
p27Kip1 by calpains in choroidal melanoma cells. Requirement of
p27Kip1 nuclear export. J Biol Chem. 278:12443–12451. 2003.
View Article : Google Scholar : PubMed/NCBI
|
|
24
|
Ma D, Fang J, Liu Y, Song JJ, Wang YQ, Xia
J, Cheng B and Wang Z: High level of calpain1 promotes cancer cell
invasion and migration in oral squamous cell carcinoma. Oncol Lett.
13:4017–4026. 2017. View Article : Google Scholar : PubMed/NCBI
|
|
25
|
Salimi R, Bandaru S, Devarakonda S, Gökalp
S, Ala C, Alvandian A, Yener N and Akyürek LM: Blocking the
cleavage of filamin A by calpain inhibitor decreases tumor cell
growth. Anticancer Res. 38:2079–2085. 2018.PubMed/NCBI
|
|
26
|
O'Connell MP, Fiori JL, Baugher KM, Indig
FE, French AD, Camilli TC, Frank BP, Earley R, Hoek KS, Hasskamp
JH, et al: Wnt5A activates the calpain-mediated cleavage of filamin
A. J Invest Dermatol. 129:1782–1789. 2009. View Article : Google Scholar : PubMed/NCBI
|