Introduction
Hepatocellular carcinoma (HCC) is a highly lethal
cancer with an increasing incidence, making it a cause of major
health problems worldwide (1,2). Recently, surgical treatments including
hepatic resection, liver transplantation, local ablative therapy
and transarterial chemoembolization have been the most successful
approaches to HCC. Patients with HCC have benefitted from
significant improvements in tumor identification and patient
survival (3,4). However, the incidence rate of HCC is
almost equivalent to its mortality rate in most countries,
indicating a lack of early diagnostic methods and effective
therapies (5). Therefore, studies
that identify novel factors involved in HCC oncogenesis are
essential for the improvement of early diagnosis and therapeutic
approaches.
The DEP domain containing 1 (DEPDC1) gene is a
highly conserved protein that is located at 1p31.3. It is primarily
expressed in the testis and is not detected in other normal human
tissues (6). Recently, several
studies revealed that DEPDC1 was upregulated in many tumor types,
indicating its important role in tumorigenesis (7–10). For
example, DEPDC1 was upregulated in bladder carcinogenesis and the
inhibition of DEPDC1 via small-interfering RNA (siRNA)
significantly suppressed the growth of bladder cancer cells
(7). In nasopharyngeal carcinoma,
DEPDC1 was overexpressed in tumor tissues and DEPDC1 depletion
induced the inhibition of cell proliferation, migration and
invasion (9). Thus, DEPDC1 usually
functions as an oncogene. In addition, HCC has been determined to
overexpress DEPDC1, which is associated with a poor prognosis
(11). Furthermore, a previous study
revealed that disrupting the DEPDC1-ZNF224 complex via the 1R-DEP
peptide induced apoptosis and inhibited the proliferation of HepG2
cells (12). Qu et al
(13) demonstrated that DEPDC1
upregulation induced HCC cell proliferation and neoplasm
metastasis. The present study revealed that DEPDC1 knockdown
significantly suppressed HCC cell proliferation, colony formation
and invasion, and DEPDC1 overexpression significantly induced HCC
cell proliferation, colony formation and invasion. However, the
role and precise mechanism of DEPDC1 in HCC is still not fully
understood.
The aim of the present study was to elucidate the
underlying mechanism of DEPDC1 in HCC. After a DNA microarray assay
was performed, Gene ontology (GO) annotation results revealed that
DEPDC1 was involved in vasculature development and blood vessel
development. Furthermore, Kyoto Encyclopedia of Genes and Genomes
(KEGG) pathway analysis revealed cytokine-cytokine receptor
interactions were significantly enriched. DNA microarray, reverse
transcription-quantitative PCR (RT-qPCR) and western blotting
results revealed that DEPDC1 knockdown significantly suppressed the
expression of chemokine (C-C motif) ligand 20 (CCL20) and chemokine
(C-C motif) receptor 6 (CCR6). Recently, the CCL20/CCR6 axis has
been determined to be involved in HCC cell growth and invasion
(14,15). Additionally, Benkheil et al
(16) revealed that the CCL20/CCR6
axis contributed to hepatic angiogenesis in hepatitis C virus
(HCV)-associated HCC. Angiogenesis is vital for the growth of
cancer and the development of metastasis (17). Thus, the CCL20/CCR6 axis may serve an
important role in DEPDC1-mediated HCC progression. Based on the
aforementioned hypothesis, the present study further investigated
the role of the CCL20/CCR6 axis in DEPDC1-mediated HCC progression,
which may elucidate a novel mechanism of DEPDC1 in HCC.
Materials and methods
Ethics statement
The present was approved by the Ethics Committee of
the First Affiliated Hospital of Chongqing Medical University
(Chongqing, China). All animal experiments were performed as
indicated in the Guidelines of the National Institutes of Health
for Animal Care (Guide for the Care and Use of Laboratory Animals,
Department of Health and Human Services, NIH publication no. 86-23,
revised 1985).
Human tissues
A total of 12 pairs of tumor tissue with matched
adjacent normal tissue were obtained from patients diagnosed with
HCC at the First Affiliated Hospital of Chongqing Medical
University (Chongqing, China) between October 2016 and July 2017.
The patients comprised of 10 men and 2 women from 45 to 73 years of
age. All patients provided their written informed consent. None of
the patients had received radiotherapy, immunotherapy or
chemotherapy prior to surgery. All tissue samples were frozen in
liquid nitrogen and subsequently stored at −80°C for RT-qPCR
analysis.
Immunohistochemistry (IHC)
IHC examination of DEPDC1, CCL20 and CCR6 was
performed as previously described (18). HCC tissues embedded in paraffin were
cut into 4-µm-thick sections. Sections were then subjected to
dewaxing and rehydration, after which antigen retrieval was
performed via microwave treatment for 15 min. Samples were
subsequently treated with 3% hydrogen peroxide for 15 min to block
endogenous peroxidase activity and incubated with 10% goat
non-immune serum for 30 min. Sections were incubated with the
following antibodies overnight at 4°C: Rabbit anti-human DEPDC1
(1:50; cat. no. GTX17614; GeneTex, Inc.), rabbit anti-human CCL20
(1:200; cat. no. 26527-1-AP; ProteinTech Group, Inc.) and rabbit
anti-human CCR6 (1:1,000; cat. no. ab227036; Abcam). Sections were
then incubated with corresponding goat anti-rabbit secondary
antibody (dilution 1:500; cat. no. SA00004-2; ProteinTech Group,
Inc.) at room temperature for 1 h. Freshly prepared
3,3′-diaminobenzidine (DAB) from a DAB Substrate kit (Abcam) was
added for color development. ICH scoring was performed as
previously described (18). Staining
intensity was graded on a 0–3 scale as follows: 0, absence of
staining; 1, weak staining; 2, moderate staining; 3, strong
staining. The percentage of positive tumor cells was scored as
follows: 0, absence of tumor cells; 1, <33% positive tumor
cells; 2, 33–66% positive tumor cells; 3, >66% tumor cells. The
IHC score (0–9) was calculated by multiplying the staining
intensity by the percentage scores.
Cell culture
L02 cells were purchased from Xiangya Central
Experiment Laboratory (Changsha, China). Li-7, Huh-7, SNU-387 and
Hep3B cells were obtained from the Cell Bank of the Chinese Academy
of Sciences (Shanghai, China). Human umbilical vein endothelial
cells (HUVECs) were purchased from the China Center for Typical
Culture Collection. L02, SNU-387 and Li-7 cells were cultured in
RPMI-1640 medium (Gibco; Thermo Fisher Scientific, Inc.) containing
10% fetal bovine serum (FBS; Gibco; Thermo Fisher Scientific,
Inc.). Huh-7 cells were cultured in DMEM (Invitrogen; Thermo Fisher
Scientific, Inc.) containing 10% FBS. Hep3B cells were cultured in
Minimum Essential medium (Gibco; Thermo Fisher Scientific, Inc.)
containing 10% FBS.
siRNA, plasmids, cell grouping and
transfection
The full-length clone DNA of human DEPDC1
(NM_001114120.3; 2,436 bp) was obtained from FulenGen and
subsequently cloned into the pcDNA3.1 plasmid vector by SunBio
(Shanghai, China). DEPDC1 siRNA, CCL20 siRNA, CCR6 siRNA and the
scrambled negative control (NC) used in this study were designed
and synthesized by Shanghai GenePharma Co., Ltd. DEPDC1 short
hairpin RNA (DEPDC1 shRNA) and scrambled negative shRNA (shNC) were
designed, synthesized and cloned into the pMAGic1.1 plasmid vector
by SunBio (Shanghai, China). The sequences of siRNA and shRNA are
listed in Table I.
 | Table I.The sequences of siRNA, shRNA and
RT-qPCR primers. |
Table I.
The sequences of siRNA, shRNA and
RT-qPCR primers.
| Name | Sequences |
|---|
| DEPDC1 siRNA
sense |
5′-UCAGAACAAUCGCAGAUUAUUTT-3′ |
| DEPDC1 siRNA
antisense |
5′-AAUAAUCUGCGAUUGUUCUGATT-3′ |
| CCR6 siRNA
sense |
5′-GACCAGUGAGACCGCAGAUAATT-3′ |
| CCR6 siRNA
antisense |
5′-UUAUCUGCGGUCUCACUGGUCTT-3′ |
| NC sense |
5′-UUCUCCGAACGUGUCACGUTT-3′ |
| NC antisense |
5′-ACGUGACACGUUCGGAGAATT-3′ |
| DEPDC1 shRNA
sense |
5′-CCGGTCAGAACAATCGCAGATTATTCTCGAGAATAATCTGCGATTGTTCTGATTTTTG-3′ |
| DEPDC1 shRNA
antisense |
5′-AATTCAAAAAACCGGTCAGAACAATCGCAGATTATTCTCGAGAATAATCTGCGATTGTTCTGA-3′ |
| shNC sense |
5′-CCGGTTCTCCGAACGTGTCACGTTTCAAGAGAACGTGACACGTTCGGAGAATTTTTG-3′ |
| shNC antisense |
5′-AATTCAAAAATTCTCCGAACGTGTCACGTTCTCTTGAAACGTGACACGTTCGGAGAA-3′ |
| DEPDC1 forward |
5′-CCGAACATAGAAGGACAA −3′ |
| DEPDC1 reverse |
5′-CTCTTGGTCTTGAACAGT-3′ |
| β-actin
forward |
5′-CATGTACGTTGCTATCCAGGC-3′ |
| β-actin
reverse |
5′-CTCCTTAATGTCACGCACGAT-3′ |
| CCL20 forward |
5′-CTCCTGGCTGCTTTGATGTC-3′ |
| CCL20 reverse |
5′-ATTTGCGCACACAGACAACT-3′ |
| CCR6 forward |
5′-CCTGGGGAATATTCTGGTGGTGA-3′ |
| CCR6 reverse |
5′-CATCGCTGCCTTGGGTGTTGTAT-3′ |
To determine the effects of DEPDC1 downregulation,
Huh-7 and SNU-387 cells were divided to two groups: A scrambled NC
group and a DEPDC1 siRNA group. Huh-7 and SNU-387 cells
(3×10⁵ cells/2 ml) were seeded into 6-well plates. When
cells reached 70–90% confluence, they were transfected. A total of
30 pmol NC or DEPDC1 siRNA with 7.5 µl Lipofectamine®
RNAiMAX reagent (Invitrogen; Thermo Fisher Scientific, Inc.) in 250
µl Opti-MEM® medium was added into each well. After 6 h,
the transfection medium was replaced with DMEM or RPMI-1640 medium.
Further analyses were performed after incubation for 72 h.
To generate a stable DEPDC1-suppressed Huh-7 cell
line, Huh-7 cells were transfected with the shNC and DEPDC1 shRNA
plasmid vectors. Huh-7 cells (3×10⁵ cells/2 ml) were
seeded into 6-well plates. When cells reached 70–90% confluence,
2.5 µg shNC or DEPDC1 shRNA with 8 µl Lipofectamine®
2000 reagent (Invitrogen; Thermo Fisher Scientific, Inc.) in 250 µl
Opti-MEM® medium was added into each well. After 8 h,
the transfection medium was replaced with DMEM. After 72 h, the
cells were selected using 6 µg/ml puromycin for 4 weeks.
To assess the effect of DEPDC1 upregulation, Li-7
and Hep3B cells were divided into two groups: A pcDNA3.1 control
group (pcDNA3.1) and a pcDNA3.1 DEPDC1 expression vector group
(DEPDC1). Li-7 and Hep3B cells (3×10⁵ cells/2 ml) were
seeded into 6-well plates. When the cells reached 70–90%
confluence, 2.5 µg pcDNA3.1 or DEPDC1 plasmids with 8 µl
Lipofectamine® 2000 reagent in 250 µl
Opti-MEM® medium were added into each well. After 8 h,
the transfection medium was replaced with RPMI-1640 medium or MEM.
Further analyses were performed after incubation for 72 h.
For rescue experiments, Li-7 and Hep3B cells were
divided into four groups: Cells co-transfected with pcDNA3.1
control vectors and the scrambled negative control (pcDNA3.1+NC
group); cells co-transfected with DEPDC1 expression vectors and the
scrambled negative control (DEPDC1+NC group); cells co-transfected
with DEPDC1 expression vectors and CCL20 siRNA (DEPDC1+CCL20 siRNA
group); and cells co-transfected with DEPDC1 expression vectors and
CCR6 siRNA (DEPDC1+CCR6 siRNA group). Li-7 and Hep3B cells
(3×10⁵ cells/2 ml) were seeded into 6-well plates. When
cells reached 70–90% confluence, 75 pmol NC, CCL20 siRNA or CCR6
siRNA in addition to 2.5 µg pcDNA3.1 control vectors or DEPDC1
expression vectors in 250 µl Opti-MEM® medium were added
into each well. After 8 h, the transfection medium was replaced
with RPMI-1640 medium or MEM. Further analyses were performed after
incubation for 72 h.
Western blotting
After treatment, cells were collected and lysed with
ice-cold RIPA lysis buffer (cat. no. AR0105; Wuhan Boster
Biological Technology, Ltd.). The cell suspension was centrifuged
at 12,000 × g for 15 min, and the supernatant was aspirated and
placed in a fresh tube. A bicinchoninic acid protein concentration
assay kit (cat. no. AR0146; Wuhan Boster Biological Technology,
Ltd.) was used to determine the protein concentration of each cell
lysate. Total protein (30 µg) from each cell lysate was adjusted to
an equal volume using loading buffer and denatured at 100°C for 5
min. Each cell sample was separated via 10% SDS-PAGE and
subsequently electro-transferred to PVDF membranes (cat. no.
AR0136-04; Wuhan Boster Biological Technology, Ltd.). The membranes
were then blocked with 5% non-fat milk for 1 h at room temperature.
After blocking, the membranes were incubated with the following
primary antibodies overnight at 4°C: Rabbit anti-human DEPDC1
(dilution 1:500; cat. no. PA5-34864) and goat anti-human CCL20
(dilution 1:2,000; cat. no. PA5-47517; both from Invitrogen; Thermo
Fisher Scientific, Inc.), rabbit anti-human CCR6 (dilution 1:1,000;
cat. no. ab227036; Abcam), rabbit anti-human p-AKT (dilution
1:1,500; cat. no. P00024-6; Wuhan Boster Biological Technology,
Ltd.), rabbit anti-human AKT (dilution 1:1,000; cat. no.
10176-2-AP), rabbit anti-human c-myc (dilution 1:2,000; cat. no.
10828-1-AP), rabbit anti-human cyclin E1 (dilution 1:1,000; cat.
no. 11554-1-AP) and mouse anti-human β-actin (dilution 1:5,000;
cat. no. 66009-1-Ig; all from ProteinTech Group, Inc.). After
incubation, the membranes were washed three times with TBST and
incubated with horseradish peroxidase (HRP)-conjugated AffiniPure
goat anti-rabbit (dilution 1:5,000; cat. no. SA00001-2; ProteinTech
Group, Inc.), HRP-conjugated AffiniPure rabbit anti-goat (dilution
1:5,000; cat. no. SA00001-4; ProteinTech Group, Inc.) and
HRP-conjugated AffiniPure goat anti-mouse (dilution 1:5,000; cat.
no. SA00001-1; ProteinTech Group, Inc.) at room temperature for 1
h. After incubation, the membranes were washed three times with
TBST. Protein bands were visualized using an enhanced
chemiluminescence substrate (cat. no. 34095; Thermo Fisher
Scientific, Inc.). Grey values of the protein bands were
semi-quantified by ImageJ software (version 1.43; National
Institutes of Health). Grey values were normalized to β-actin and
expressed as relative densities.
RT-qPCR
Total RNA was isolated from tissues and cultured
cells using RNAiso Plus (cat. no. 9108; Takara Biotechnology Co.,
Ltd.) in accordance with the manufacturer's protocol. Sample
integrity and purity was analyzed via agarose gel electrophoresis
and the value of A260/A280. RT was performed using M-MLV-RTase
(cat. no. M1705; Promega Corporation) at 42°C for 1 h with an 11-µl
system (4 µl 5×RT buffer, 2 µl 10 mM dNTPs, 0.5 µl RNasin, 1 µl
M-MLV-RTase and 3.5 µl DEPC-H2O). The expression of
target genes was analyzed using SYBR Master Mixture (cat. no.
DRR041B; Takara Biotechnology Co., Ltd.). The thermocycling
conditions were as follows: Pre-denaturation for 15 sec at 95°C, 45
cycles of denaturation for 5 sec at 95°C, annealing at 60°C for 30
sec and extension at 60°C for 30 sec. The sequences of all primers
used are presented in Table I. The
relative expression of the target genes was normalized to β-actin
using the 2−ΔΔCq analysis method (19).
Cell viability assay
After treatment, cells were inoculated in 96-well
plates (1×10⁴ cells/well) and further cultured for 1, 2,
3 or 4 days. Cell Counting Kit-8 solution (CCK-8; cat. no. C0038;
Beyotime Institute of Biotechnology) was thawed in a water bath at
37°C. A total of 10 µl CCK-8 solution was then added to each well
of the plate. Cells were subsequently incubated for 2 h at 37°C.
After incubation, absorbance was measured at 450 nm using a
microplate reader (Beckman Coulter, Inc.).
EdU assay
Cell proliferation was determined using the
BeyoClick™ EdU Cell Proliferation kit with Alexa Fluor 594 (cat.
no. C0078S; Beyotime Institute of Biotechnology). Cells were then
washed with PBS and fresh medium (RPMI-1640 medium, DMEM or MEM)
containing 10 µM EdU was added. Cells were subsequently incubated
for 2 h at 37°C in 5% CO2 and washed with PBS to remove
the free EdU probe and medium. Cells were then fixed in 4%
paraformaldehyde at room temperature for 15 min and stained with
DAPI for 5 min. After an additional wash in PBS, positive cells
were observed under a Olympus IX71 fluorescent microscope (Olympus
Corp., Tokyo, Japan; magnification, ×200) and analyzed using ImageJ
software (version 1.43; National Institutes of Health). The mean
numbers of EdU-positive cells were calculated from three images of
each group (20).
Colony formation assay
After treatment, cells were seeded into 6-well
plates (400 cells/well) and further cultured at 37°C. After
incubation for 14 days, the cells were washed with PBS, fixed with
4% paraformaldehyde at room temperature for 15 min, and stained
with 0.2% crystal violet solution at room temperature for 20 min.
The number of colonies was counted with an inverted fluorescence
microscope (Nikon TE2000; Nikon Corp.).
HCC cell invasion assay
HCC cell invasion activities were determined using a
24-well Transwell chamber (cat. no. 3577; Corning Costar Corp.)
with Matrigel (cat. no. 356234; BD Biosciences). After treatment,
cells were seeded into the upper chamber of the Transwell equipment
at a density of 1×10⁵ cells per insert. A total of 500
µl of RPMI-1640, DMEM or MEM with 10% FBS was added to the lower
chamber of the Transwell insert. After incubation for 48 h, cells
remaining on the upper chamber of the Transwell insert were
removed. Cells on the underside of the chamber were fixed with 4%
paraformaldehyde and stained with 0.1% crystal violet. Invaded
cells were subsequently counted under a microscope (magnification,
×200) in six different fields of view for each sample.
In vitro HUVEC tube formation
assay
Li-7 and Hep3B cells transfected with pcDNA3.1 or
DEPDC1 expression vectors, or co-transfected with NC or CCL20 siRNA
were further incubated for 72 h. Tumor cell-conditioned medium
(TCM) was prepared as previously described (21,22). The
medium was removed, and the cells were washed in triplicate with
PBS. Serum-free RPMI-1640 medium or MEM was then added to each well
of the plate. After incubation for 24 h, TCM was collected and
stored at −80°C. Prior to the tube formation assay, each well of a
96-well plate was pre-coated with Matrigel (cat. no. 3432-005-01;
R&D Systems, Inc.). HUVECs or HUVECs pretreated with NC or CCR6
siRNA (2×10⁴ cells/100 µl) were then added to each well
of the plate. After incubation for 4 h, the branch points of the
formed tubes were scanned under a inverted fluorescence microscope
(Nikon TE2000; Nikon Corp.) and quantitated in at least 5
microscopic fields.
HUVEC invasion assays
HUVECs invasion activities were determined using a
24-well Transwell chamber (cat. no. 3577; Corning Costar Corp.)
with Matrigel (cat. no. 356234; BD Biosciences). Cells
(1×10⁵) prepared in 400 µl serum-free media were seeded
into the upper chamber of the Transwell insert. A total of 600 µl
TCM was added to the lower chamber of the Transwell insert. After
incubation for 48 h, the cells remaining in the upper chamber of
the Transwell insert were removed. Cells on the underside of the
chamber were fixed with 4% paraformaldehyde at room temperature for
30 min and stained with 0.1% crystal violet at room temperature for
20 min. Invaded cells were subsequently counted under a inverted
fluorescence microscope (Nikon TE2000; Nikon Corp.) (magnification,
×200) in six different fields of view for each sample.
Nude mice tumour xenograft model
BALB/c nude mice (n=5) at 4–5 weeks of age (weighing
~20 g) were obtained from Vital River Laboratories Co., Ltd., and
randomly divided into two groups. All mice were maintained under
specific pathogen-free conditions (temperature 25±10°C and relative
humidity 60±10%) in laminar flow cabinets. All mice were housed
with a 12-h light/dark cycle and autoclaved food/water was provided
freely. The stable DEPDC1-suppressed Huh-7 cell line (DEPDC1 shRNA)
and the shRNA control Huh-7 cell line (shNC; 2×10⁶
cells/100 µl PBS) were inoculated subcutaneously in the left dorsal
flank and the right flank of BALB/c nude mice, respectively. The
width and length of the tumors were measured weekly and the volume
was calculated using the following equation: (length ×
width2)/2. After five weeks of injections, all mice were
euthanized by CO2 asphyxiation and the tumors were
excised.
Microarray analysis
Huh-7 cells were transfected with DEPDC1 siRNA or NC
siRNA and further cultured for 72 h. After incubation, total RNA
was isolated using the TRIzol Reagent (cat. no. 15596026;
Invitrogen; Thermo Fisher Scientific, Inc.). The integrity and
purity of RNA was analyzed via agarose gel electrophoresis and the
value of A260/A280. cDNA was subsequently synthesized from total
RNA and hybridized to the Affymetrix Gene Chip Human Gene 1.0 ST
Array (cat. no. 901085; Affymetrix; Thermo Fisher Scientific,
Inc.). Differentially expressed genes were analyzed using the
Expression Console and Transcriptome Analysis Console v3.0
(Affymetrix; Thermo Fisher Scientific, Inc.). DAVID Bioinformatics
Resources 6.7 (https://david.ncifcrf.gov/) was used to perform GO
annotation and KEGG pathway analyses. Raw data has been deposited
in the GEO database (GEO accession no. GSE122124).
Statistical analysis
All data were analyzed using IBM SPSS 21.0 software
(IBM Corp.) and all experiments were repeated at least three times.
Data were presented as the mean ± standard deviation. Significant
differences between groups were determined using a Student's t-test
or one-way analysis of variance (ANOVA) and Dunnetts multiple
comparison post hoc test. The correlation between DEPDC1 and CCL20
or CCR6 expression in HCC tissue was determined via Pearson's
correlation. P<0.05 was considered to indicate a statistically
significant difference.
Results
DEPDC1 knockdown suppresses HCC
tumourigenesis in vitro and in vivo
To assess the molecular role of DEPDC1 in HCC, the
expression of DEPDC1 was analyzed in four human HCC cell lines
(Li-7, Huh-7, SNU-387 and Hep3B) and one normal human hepatic cell
line (L02) via western blotting. The results revealed that DEPDC1
protein was primarily detected in HCC cell lines and a decreased
expression was detected in L02 cells (Fig. 1A). Huh-7 and SNU-387 cells were
transfected with a scrambled NC and DEPDC1 siRNA, the expression of
DEPDC1 was determined by RT-qPCR and western blotting. As presented
in Fig. 1B, DEPDC1 siRNA
significantly suppressed DEPDC1 mRNA and protein expression. The
results of the CCK-8 assay demonstrated that DEPDC1 knockdown
significantly inhibited Huh-7 and SNU-387 cell viability (Fig. 1C). Following the EdU assay, a
decreased number of EdU-positive cells were observed in Huh-7 and
SNU-387 cells transfected with DEPDC1 siRNA compared with those
transfected with the NC (Fig. 1D).
The results of the colony formation and cell invasion assays
revealed that DEPDC1 knockdown significantly inhibited colony
formation and cell invasion in Huh-7 and SNU-387 cells (Fig. 1E and F). The present study generated a
stable DEPDC1-suppressed Huh-7 cell line using DEPDC1 shRNA vectors
and puromycin. The results also revealed that the tumor volume of
the DEPDC1 shRNA group was lower than that of the shNC group
(Fig. 1G).
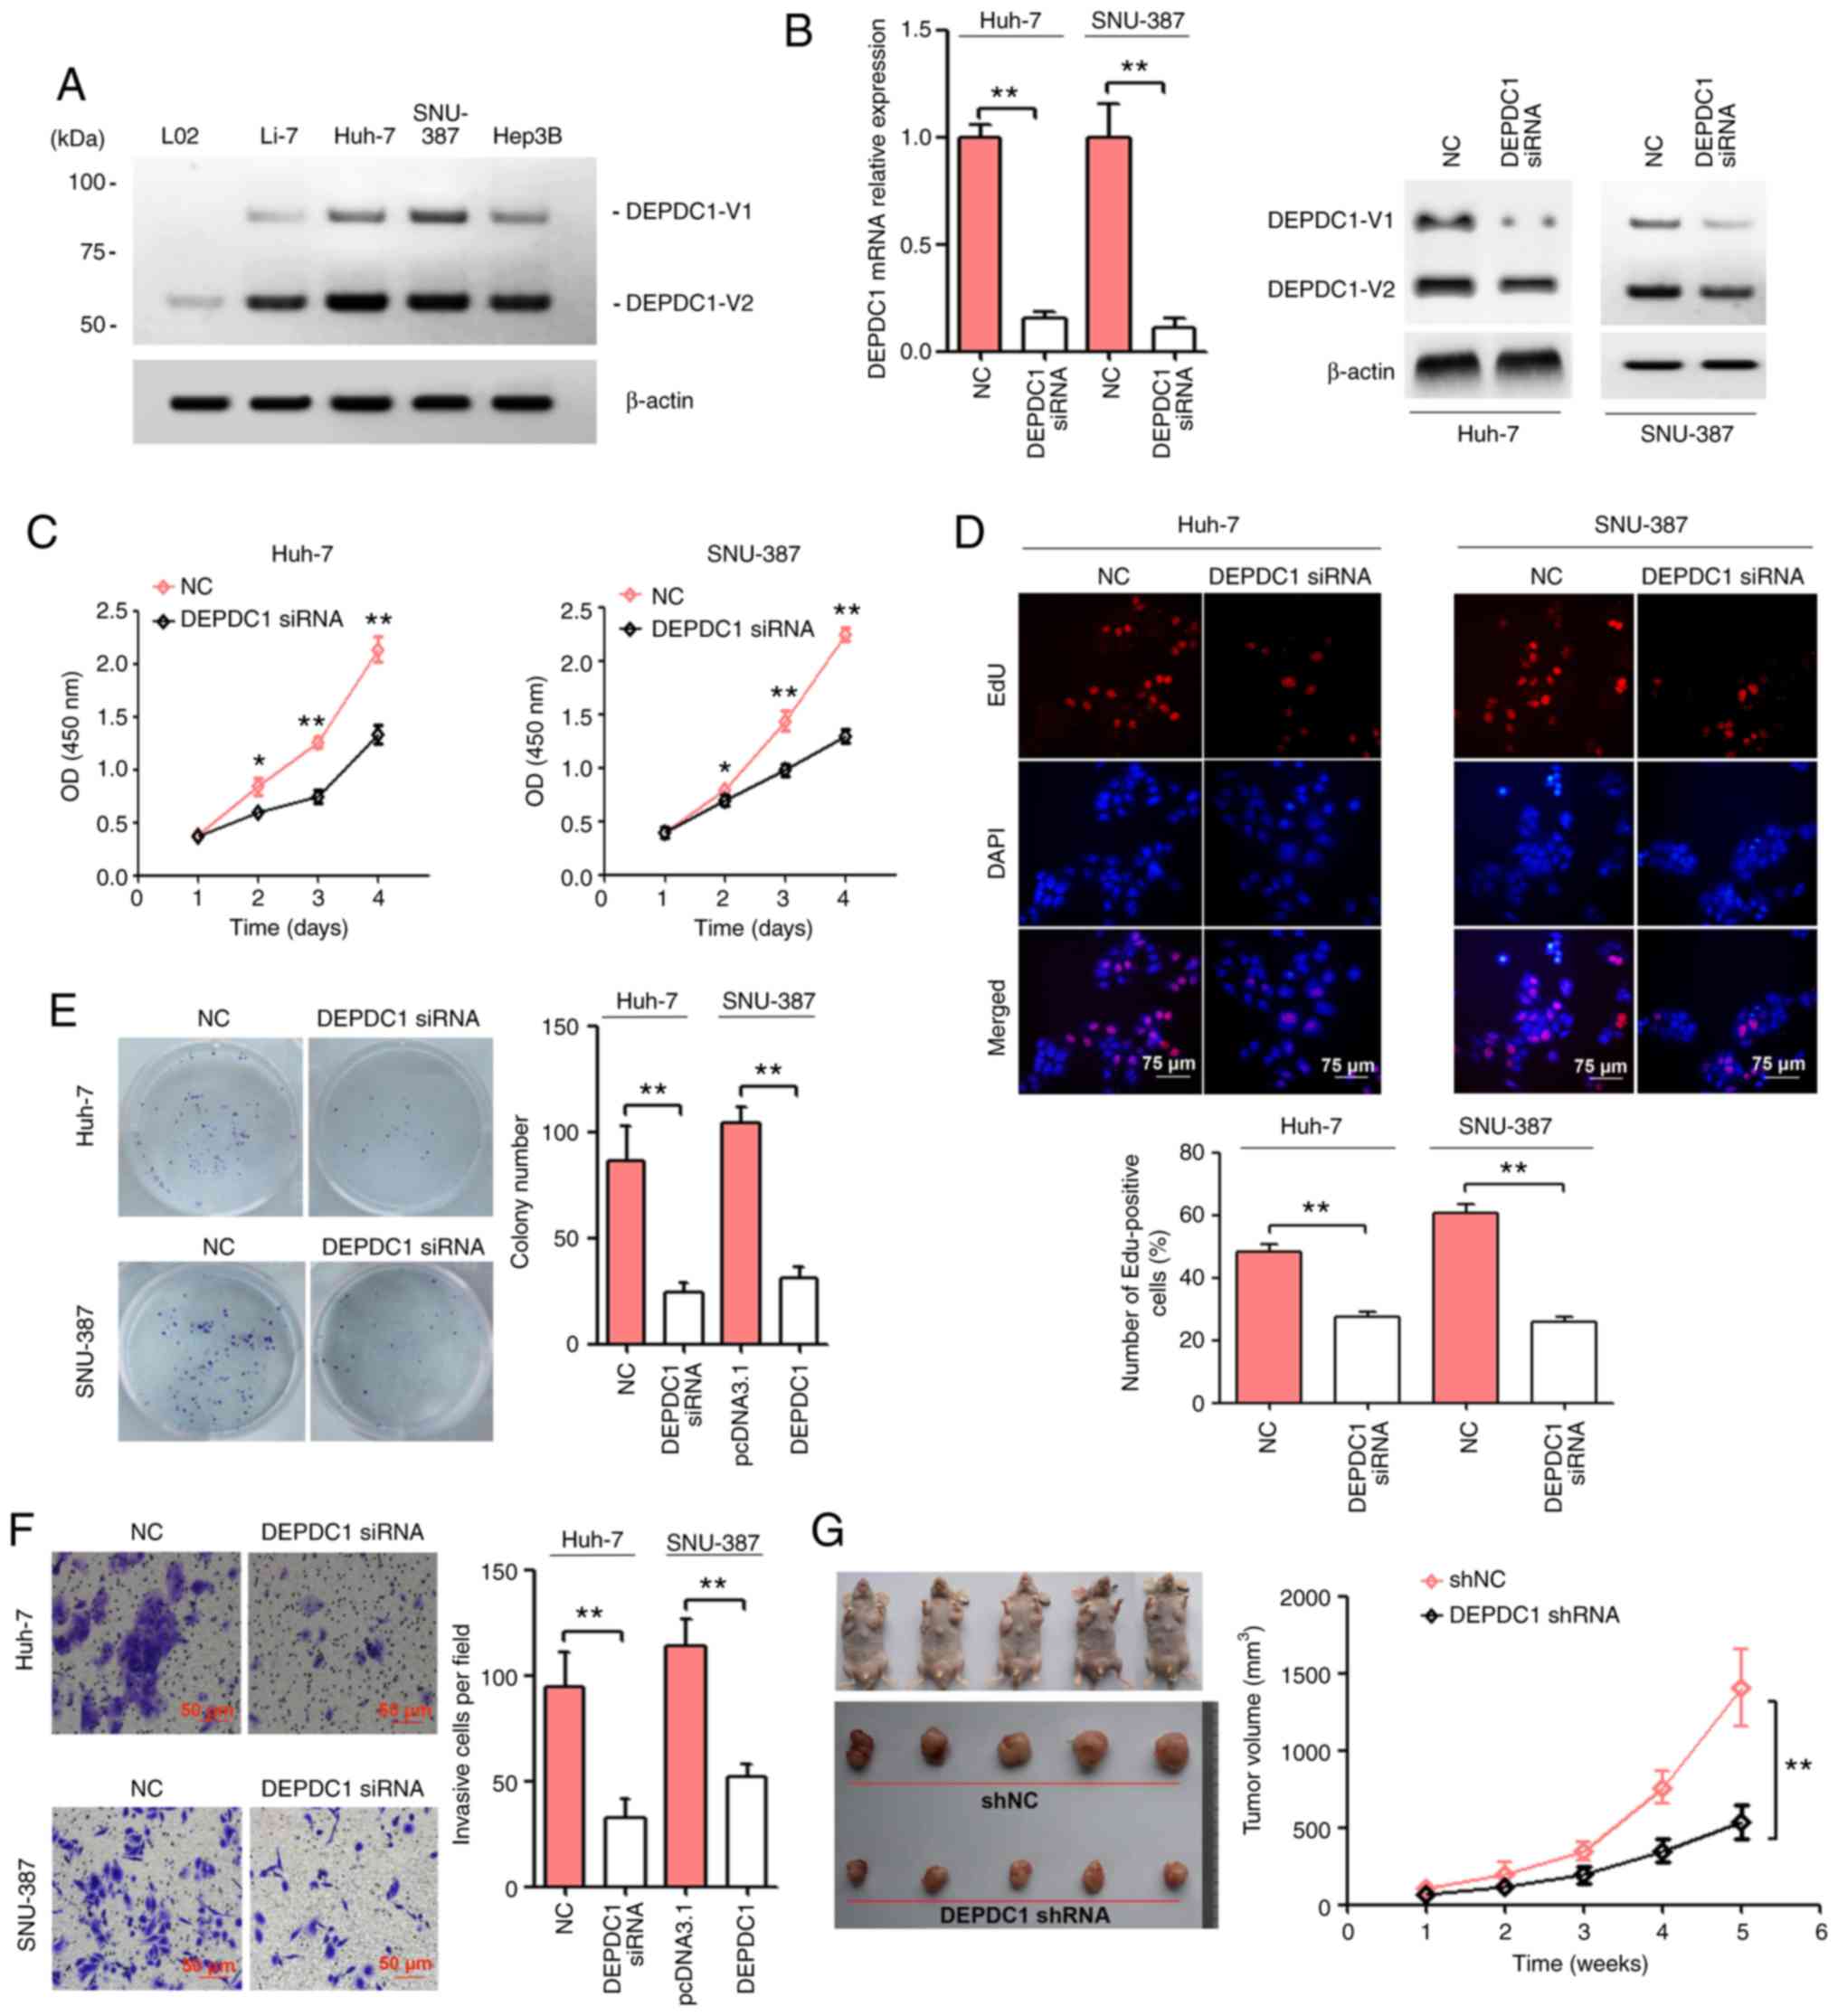 | Figure 1.DEPDC1 knockdown suppresses HCC
tumourigenesis in vitro and in vivo. (A) The protein expression of
DEPDC1 in a normal human hepatic cell line (L02) and four human HCC
cell lines (Li-7, Huh-7, SNU-387 and Hep3B) was detected by western
blotting. (B) Huh-7 and SNU-387 cells were transfected with a
scrambled negative control and DEPDC1 siRNA. After transfection for
72 h, DEPDC1 mRNA and protein expression was confirmed via RT-qPCR
and western blotting, respectively. Huh-7 and SNU-387 cells were
transfected as described above. Cell growth was evaluated via (C)
Cell Counting Kit-8, (D) EdU and (E) colony formation assays. Scale
bar, 75 µm. (F) Cell invasion was determined by performing a
Transwell assay. Scale bar, 50 µm. (G) Huh-7 cells transfected with
DEPDC1 shRNA exhibited a significantly reduced tumor volume (5 per
group). *P<0.05, **P<0.01. DEPDC1, DEP domain containing 1;
HCC, hepatocellular carcinoma; NC, negative control; siRNA, small
interfering RNA; shRNA, short hairpin RNA; RT-qPCR, reverse
transcription-quantitative PCR. |
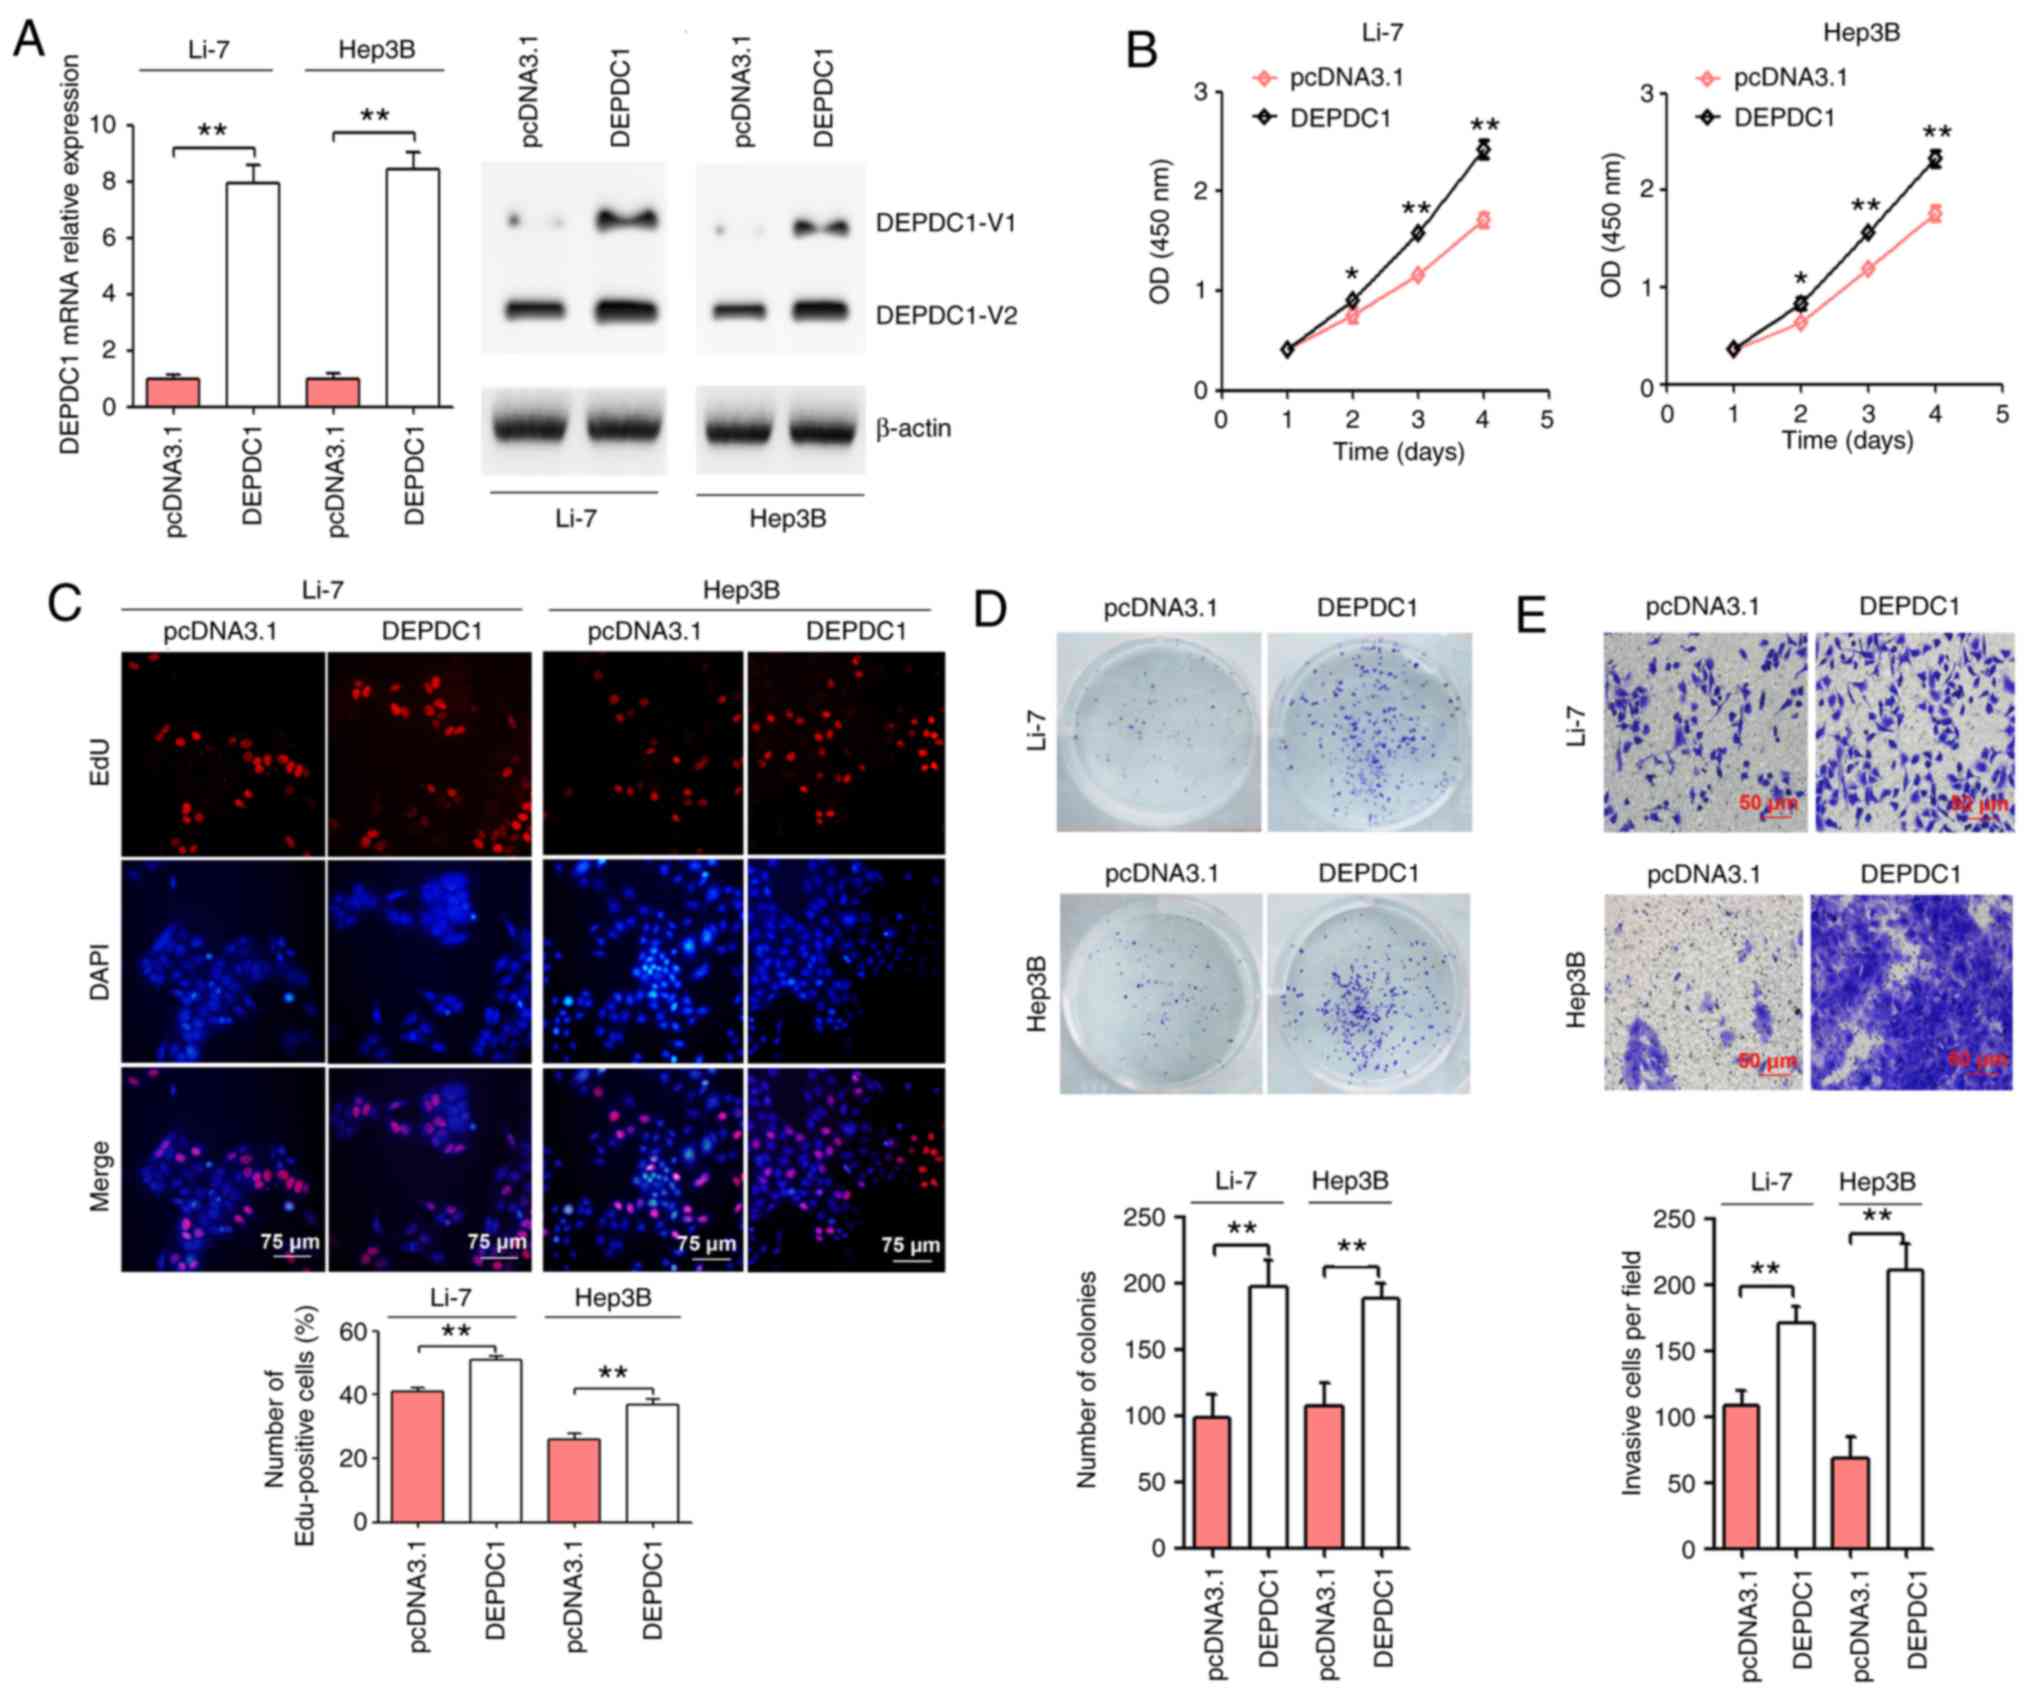
DEPDC1 upregulation promotes HCC cell
progression
To further confirm the molecular role of DEPDC1 in
HCC, Li-7 and Hep3B cells were transfected with pcDNA3.1 and the
pcDNA3.1 DEPDC1 expression vector. As presented in Fig. 2A, treatment with the DEPDC1 expression
plasmid significantly upregulated DEPDC1 protein expression. The
results of the CCK-8 assay demonstrated that DEPDC1 upregulation
significantly induced Li-7 and Hep3B cell viability (Fig. 2B). Following the EdU assay, an
increased number of EdU-positive cells were observed in Li-7 and
Hep3B cells transfected with the pcDNA3.1 DEPDC1 expression vector
compared with those transfected with the pcDNA3.1 control (Fig. 2C). The results of the colony formation
and cell invasion assays revealed that DEPDC1 upregulation
significantly increased colony formation and cell invasion in Li-7
and Hep3B cells (Fig. 2D and E).
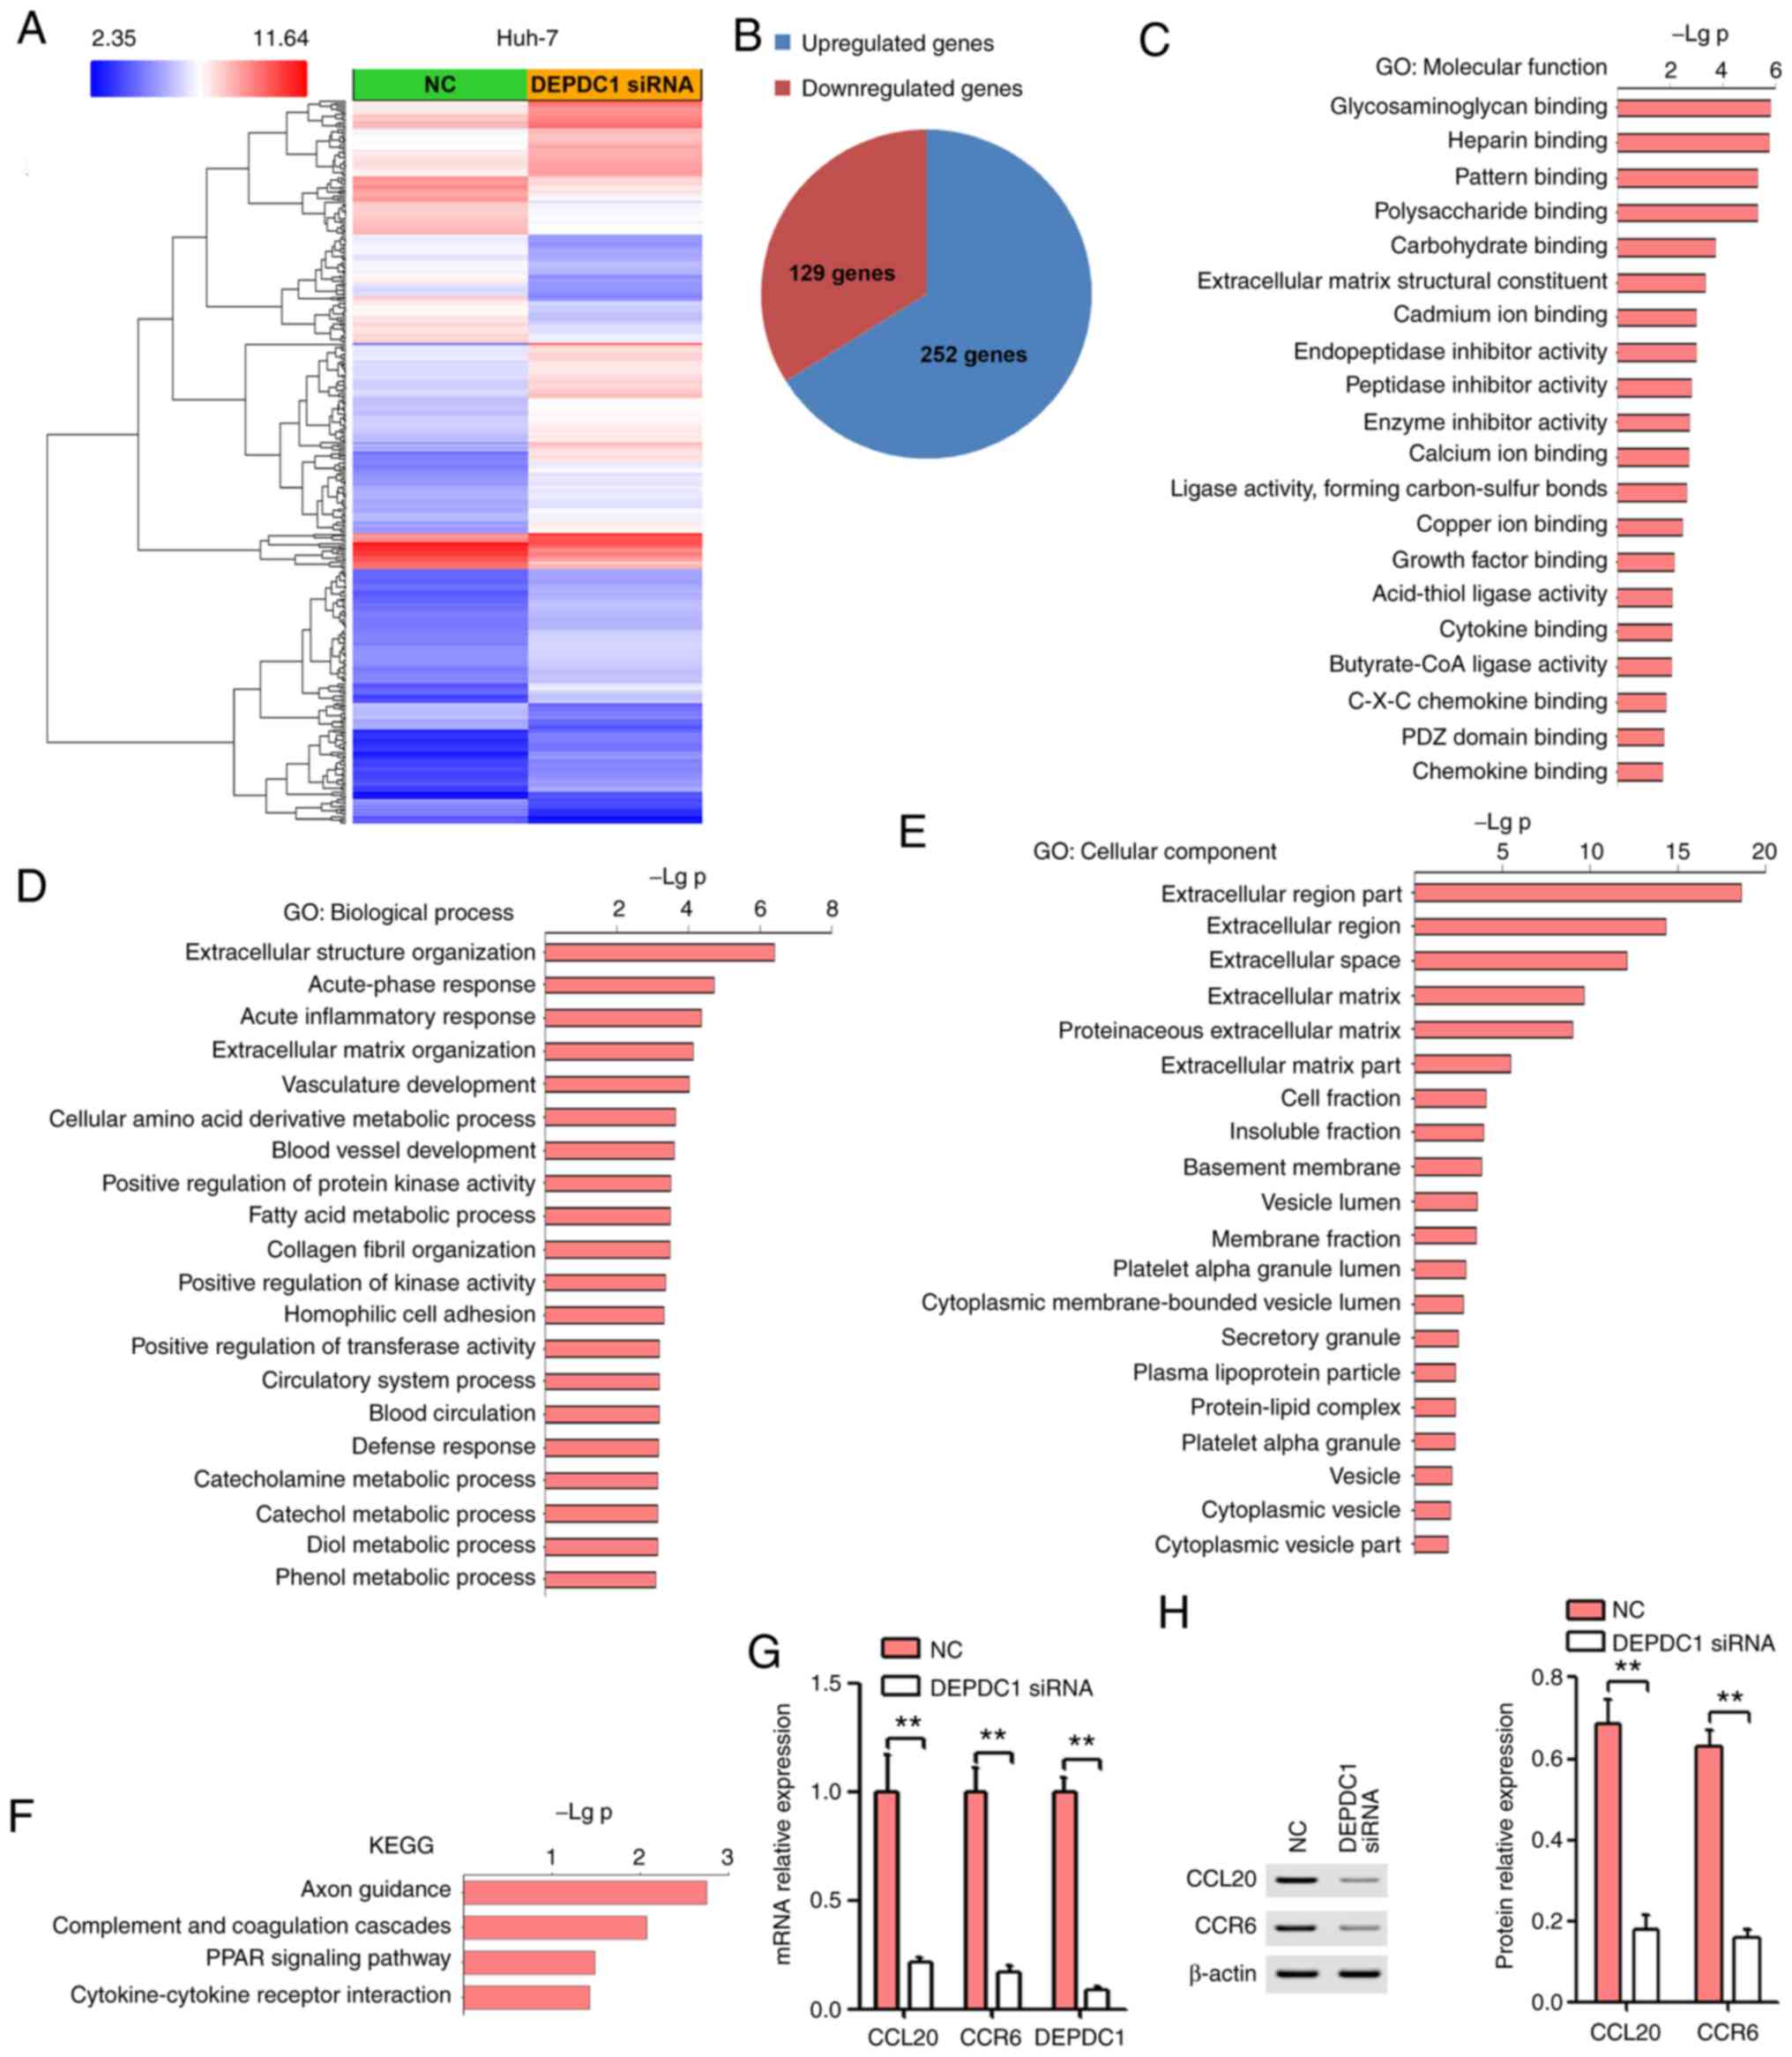
DEPDC1 downregulation affects gene
expression at a global level
To assess the possible mechanisms of DEPDC1 in HCC
progression, microarray analysis was performed using RNA isolated
from NC or DEPDC1 siRNA-transfected Huh-7 cells. As presented in
Fig. 3A and B, a total of 129 genes
were downregulated (fold change, <-2-fold) and 252 genes were
upregulated (fold change, >2-fold). In addition, GO annotation
and KEGG pathway analysis were performed using the DAVID
Bioinformatics Resource 6.7 (https://david.ncifcrf.gov/). The results of GO
analysis revealed that DEPDC1 was involved in C-X-C chemokine
binding (Fig. 3C), vasculature
development (Fig. 3D), blood vessel
development (Fig. 3D) and
extracellular matrix (Fig. 3E). KEGG
pathway analysis determined that downregulated and upregulated
genes significantly enriched in cytokine-cytokine receptor
interaction (Fig. 3F). According to
the functional results of DEPDC1, GO analysis and KEGG pathway
analysis, the CCL20/CCR6 axis was selected for further study. In
recent years, the CCL20/CCR6 axis has been implicated in the growth
and invasion of HCC cells and in HCV-associated HCC hepatic
angiogenesis (14–16). Thus, the CCL20/CCR6 axis may serve a
vital role in the DEPDC1-mediated progression of HCC. RT-qPCR was
performed to validate the expression of CCL20 and CCR6. In
congruence with microarray results, the expression of CCL20 and
CCR6 in Huh-7 cells treated with DEPDC1 siRNA was significantly
lower compared with the NC group (Fig.
3G). In addition, DEPDC1 knockdown significantly inhibited the
protein expression of CCL20 and CCR6 (Fig. 3H).
CCL20 and CCR6 expression is
significantly increased in HCC tissue and cell lines
To verify the expression of DEPDC1, CCL20 and CCR6
mRNA in HCC tissue, RT-qPCR analysis was performed. The results
revealed that DEPDC1, CCL20 and CCR6 mRNA was significantly
upregulated in HCC tissue compared with matched adjacent normal
liver tissue (Fig. 4A). In addition,
CCL20 and CCR6 mRNA expression were positively correlated with that
of DEPDC1 (Fig. 4B). Furthermore, IHC
revealed that DEPDC1, CCL20 and CCR6 protein expression was
significantly upregulated in HCC tissue compared with matched
adjacent normal liver tissue (Fig. 4C and
D). CCL20 and CCR6 protein expression were also positively
correlated with DEPDC1 protein expression (Fig. 4E). To determine whether CCL20 and CCR6
protein was also upregulated in HCC cell lines, western blotting
was performed. As presented in Fig.
4F, CCL20 and CCR6 protein expression were significantly
upregulated in four human HCC cell lines (Li-7, Huh-7, SNU-387 and
Hep3B) when compared with L02 cells.
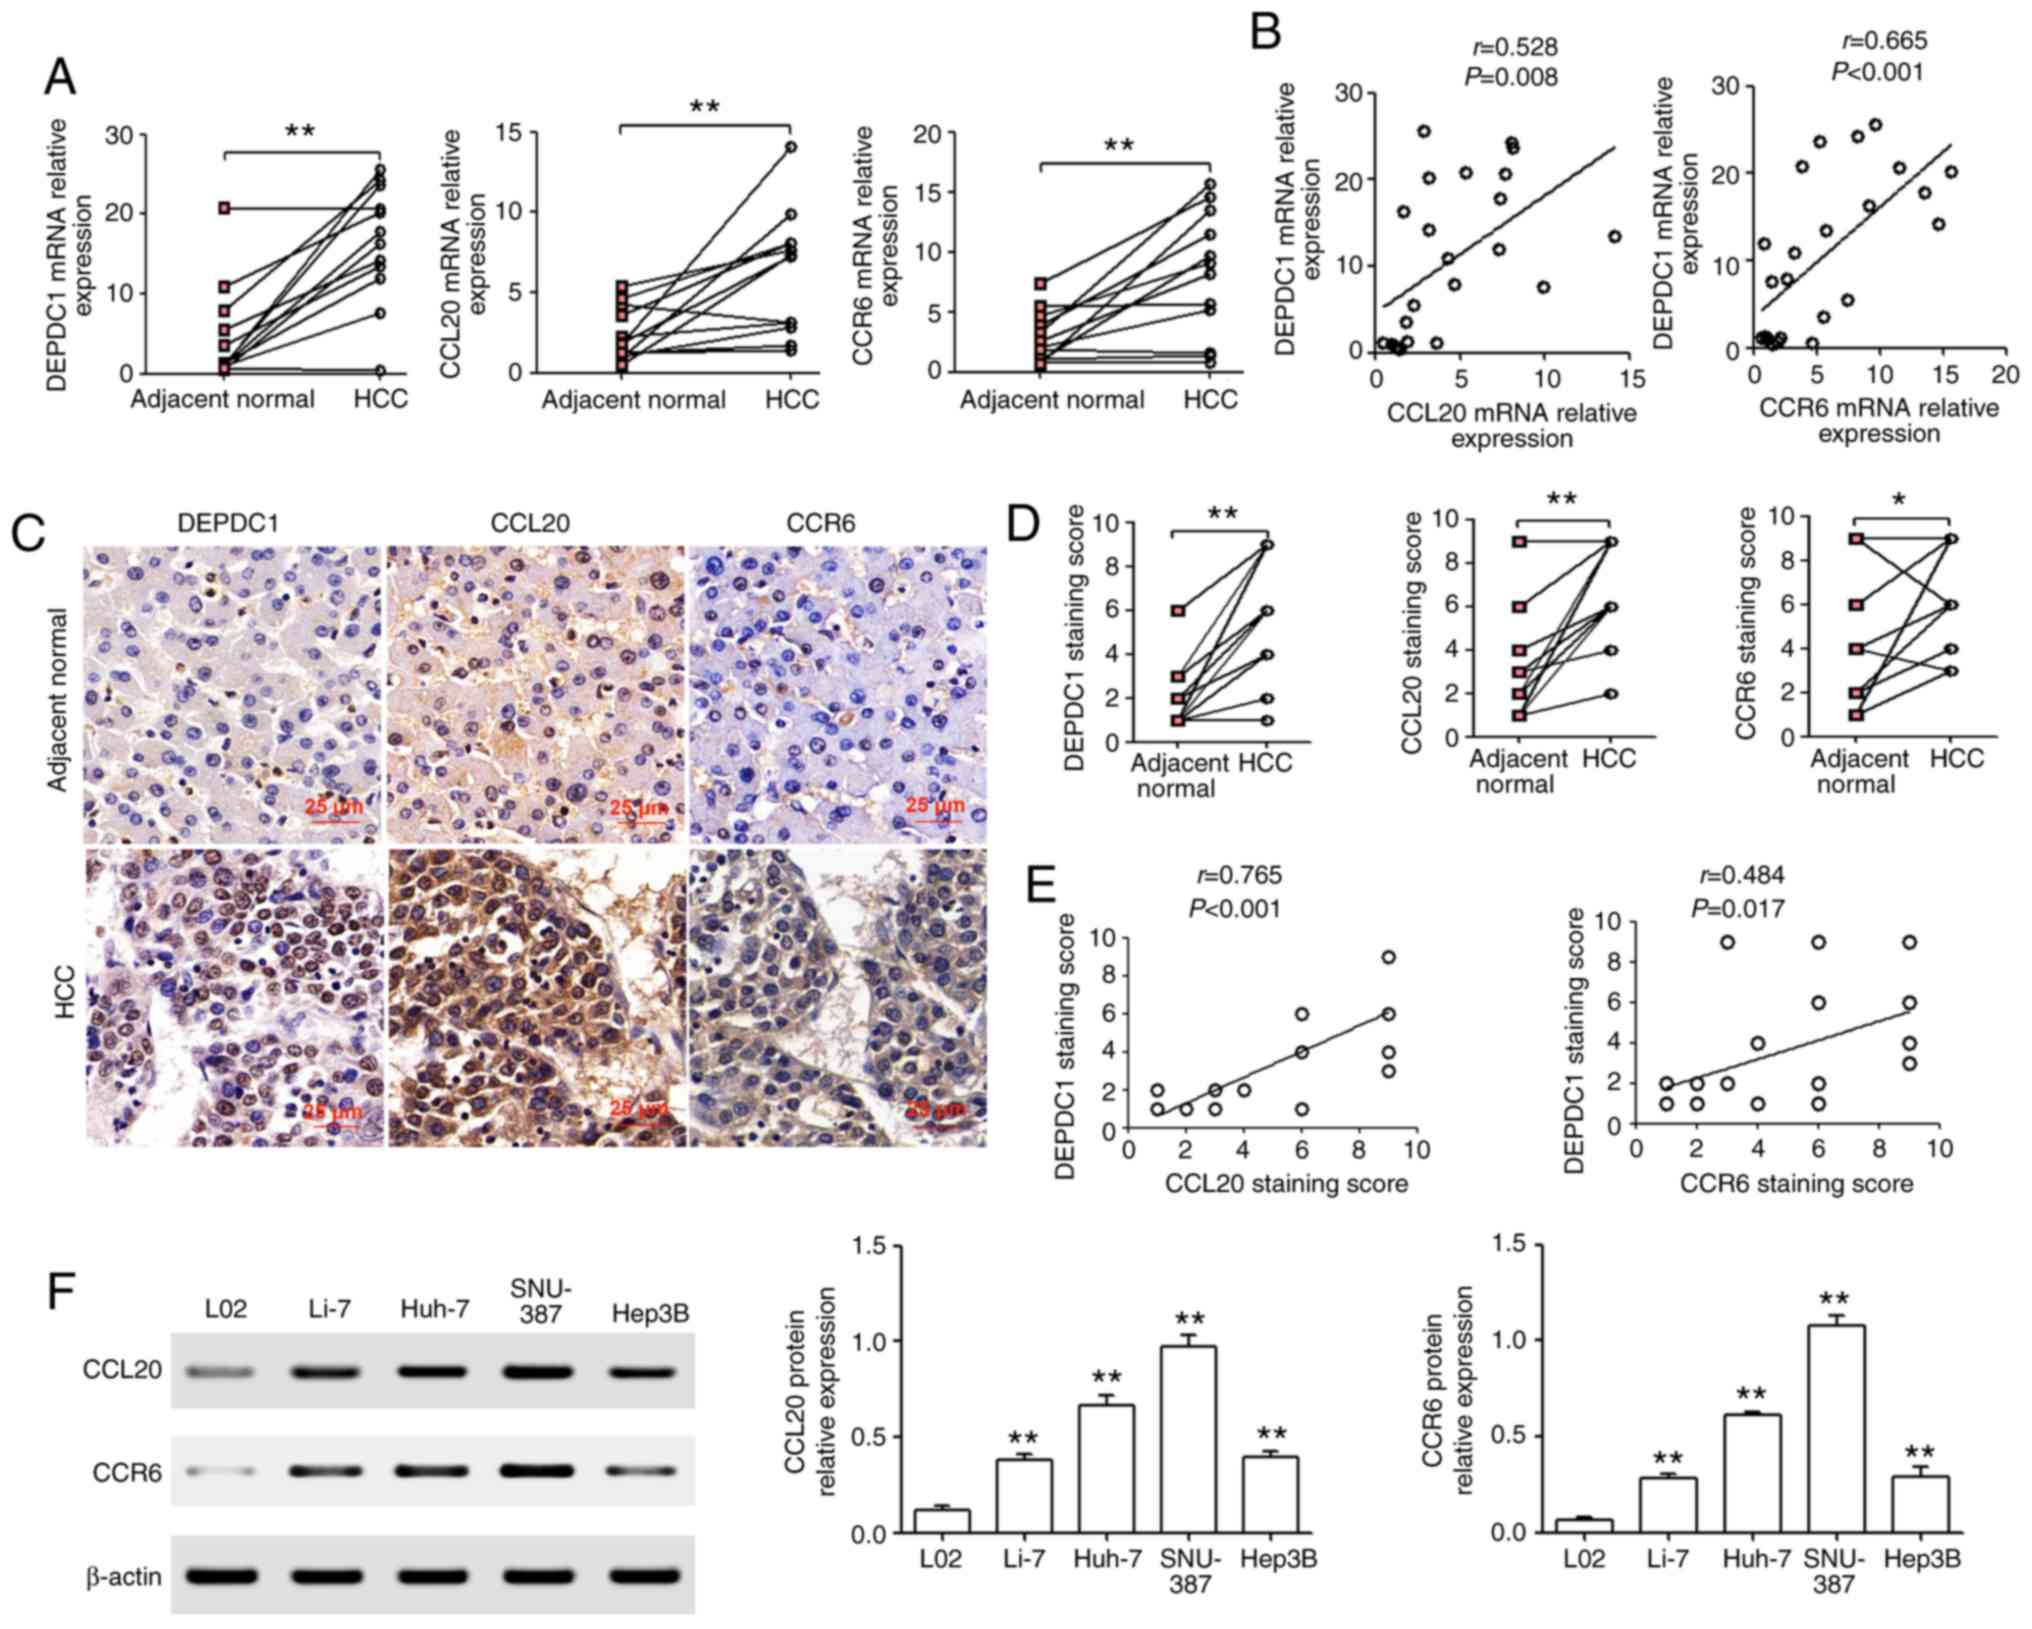 | Figure 4.CCL20 and CCR6 are significantly
increased in HCC tissues and cell lines. (A) RT-qPCR analysis of
DEPDC1, CCL20 and CCR6 mRNA in HCC tissue and matched adjacent
normal liver tissue. (B) Analysis of RT-qPCR results with
significant Pearson correlation analysis of DEPDC1 with CCL20 and
DEPDC1 with CCR6 in HCC. (C and D) Immunohistochemistry assays were
used to determine the protein expression of DEPDC1, CCL20 and CCR6.
Scale bar, 25 µm. (E) The correlation of DEPDC1 with CCL20 and CCR6
was determined via Pearson's correlation analysis. (F) Western
blotting was performed to determine the protein expression of CCL20
and CCR6 in four human HCC cell lines (Li-7, Huh-7, SNU-387 and
Hep3B) and one normal human hepatic cell line (L02). *P<0.05,
**P<0.01. CCL20, chemokine (C-C motif) ligand 20; CCR6,
chemokine (C-C motif) receptor 6; HCC, hepatocellular carcinoma;
RT-qPCR, reverse transcription-quantitative PCR; DEPDC1, DEP domain
containing 1. |
CCL20 or CCR6 knockdown by siRNA
reverses the effect of DEPDC1 overexpression in HCC cells
To confirm the effect of DEPDC1 upregulation on
CCL20 and CCR6, the protein expression of CCL20 and CCR6 in Li-7
and Hep3B cells transfected with pcDNA3.1 and DEPDC1 expression
vectors were confirmed via western blotting. As presented in
Fig. S1, DEPDC1 upregulation in Li-7
and Hep3B cells significantly induced CCL20 and CCR6 protein
expression. Furthermore, CCL20 knockdown via siRNA reversed the
effect of DEPDC1 overexpression on CCL20 and CCR6 expression in
Li-7 and Hep3B cells (Fig. S2).
Additionally, CCR6 knockdown via siRNA reversed the effect of
DEPDC1 overexpression on the expression of CCR6 in Li-7 and Hep3B
cells (Fig. S2). To ascertain
whether DEPDC1 regulated HCC progression by mediating the
CCL20/CCR6 axis, CCL20 and CCR6 were inhibited using siRNA in Li-7
and Hep3B cells transfected with DEPDC1 expression vectors. As
presented in Fig. 5A, CCL20 or CCR6
knockdown reversed the increase in cell viability caused by DEPDC1
upregulation. In addition, the results revealed that CCL20 or CCR6
knockdown reversed the increase in the number of EdU-positive cells
caused by DEPDC1 upregulation (Fig.
5B). As presented in Fig. 5C and
D, CCL20 or CCR6 knockdown reversed the DEPDC1-mediated
increase of colony formation and invasion. In normal breast cells,
the CCL20/CCR6 axis may induce the expression of cell
cycle-associated proteins (c-myc, c-Fos and cyclin E1) by inducing
the activation of the PI3K/Akt pathway (23). The results of the present study
revealed that DEPDC1 upregulation induced the expression of p-Akt,
c-Myc and cyclin E1, while CCL20 or CCR6 knockdown reversed this
effect (Fig. 5E).
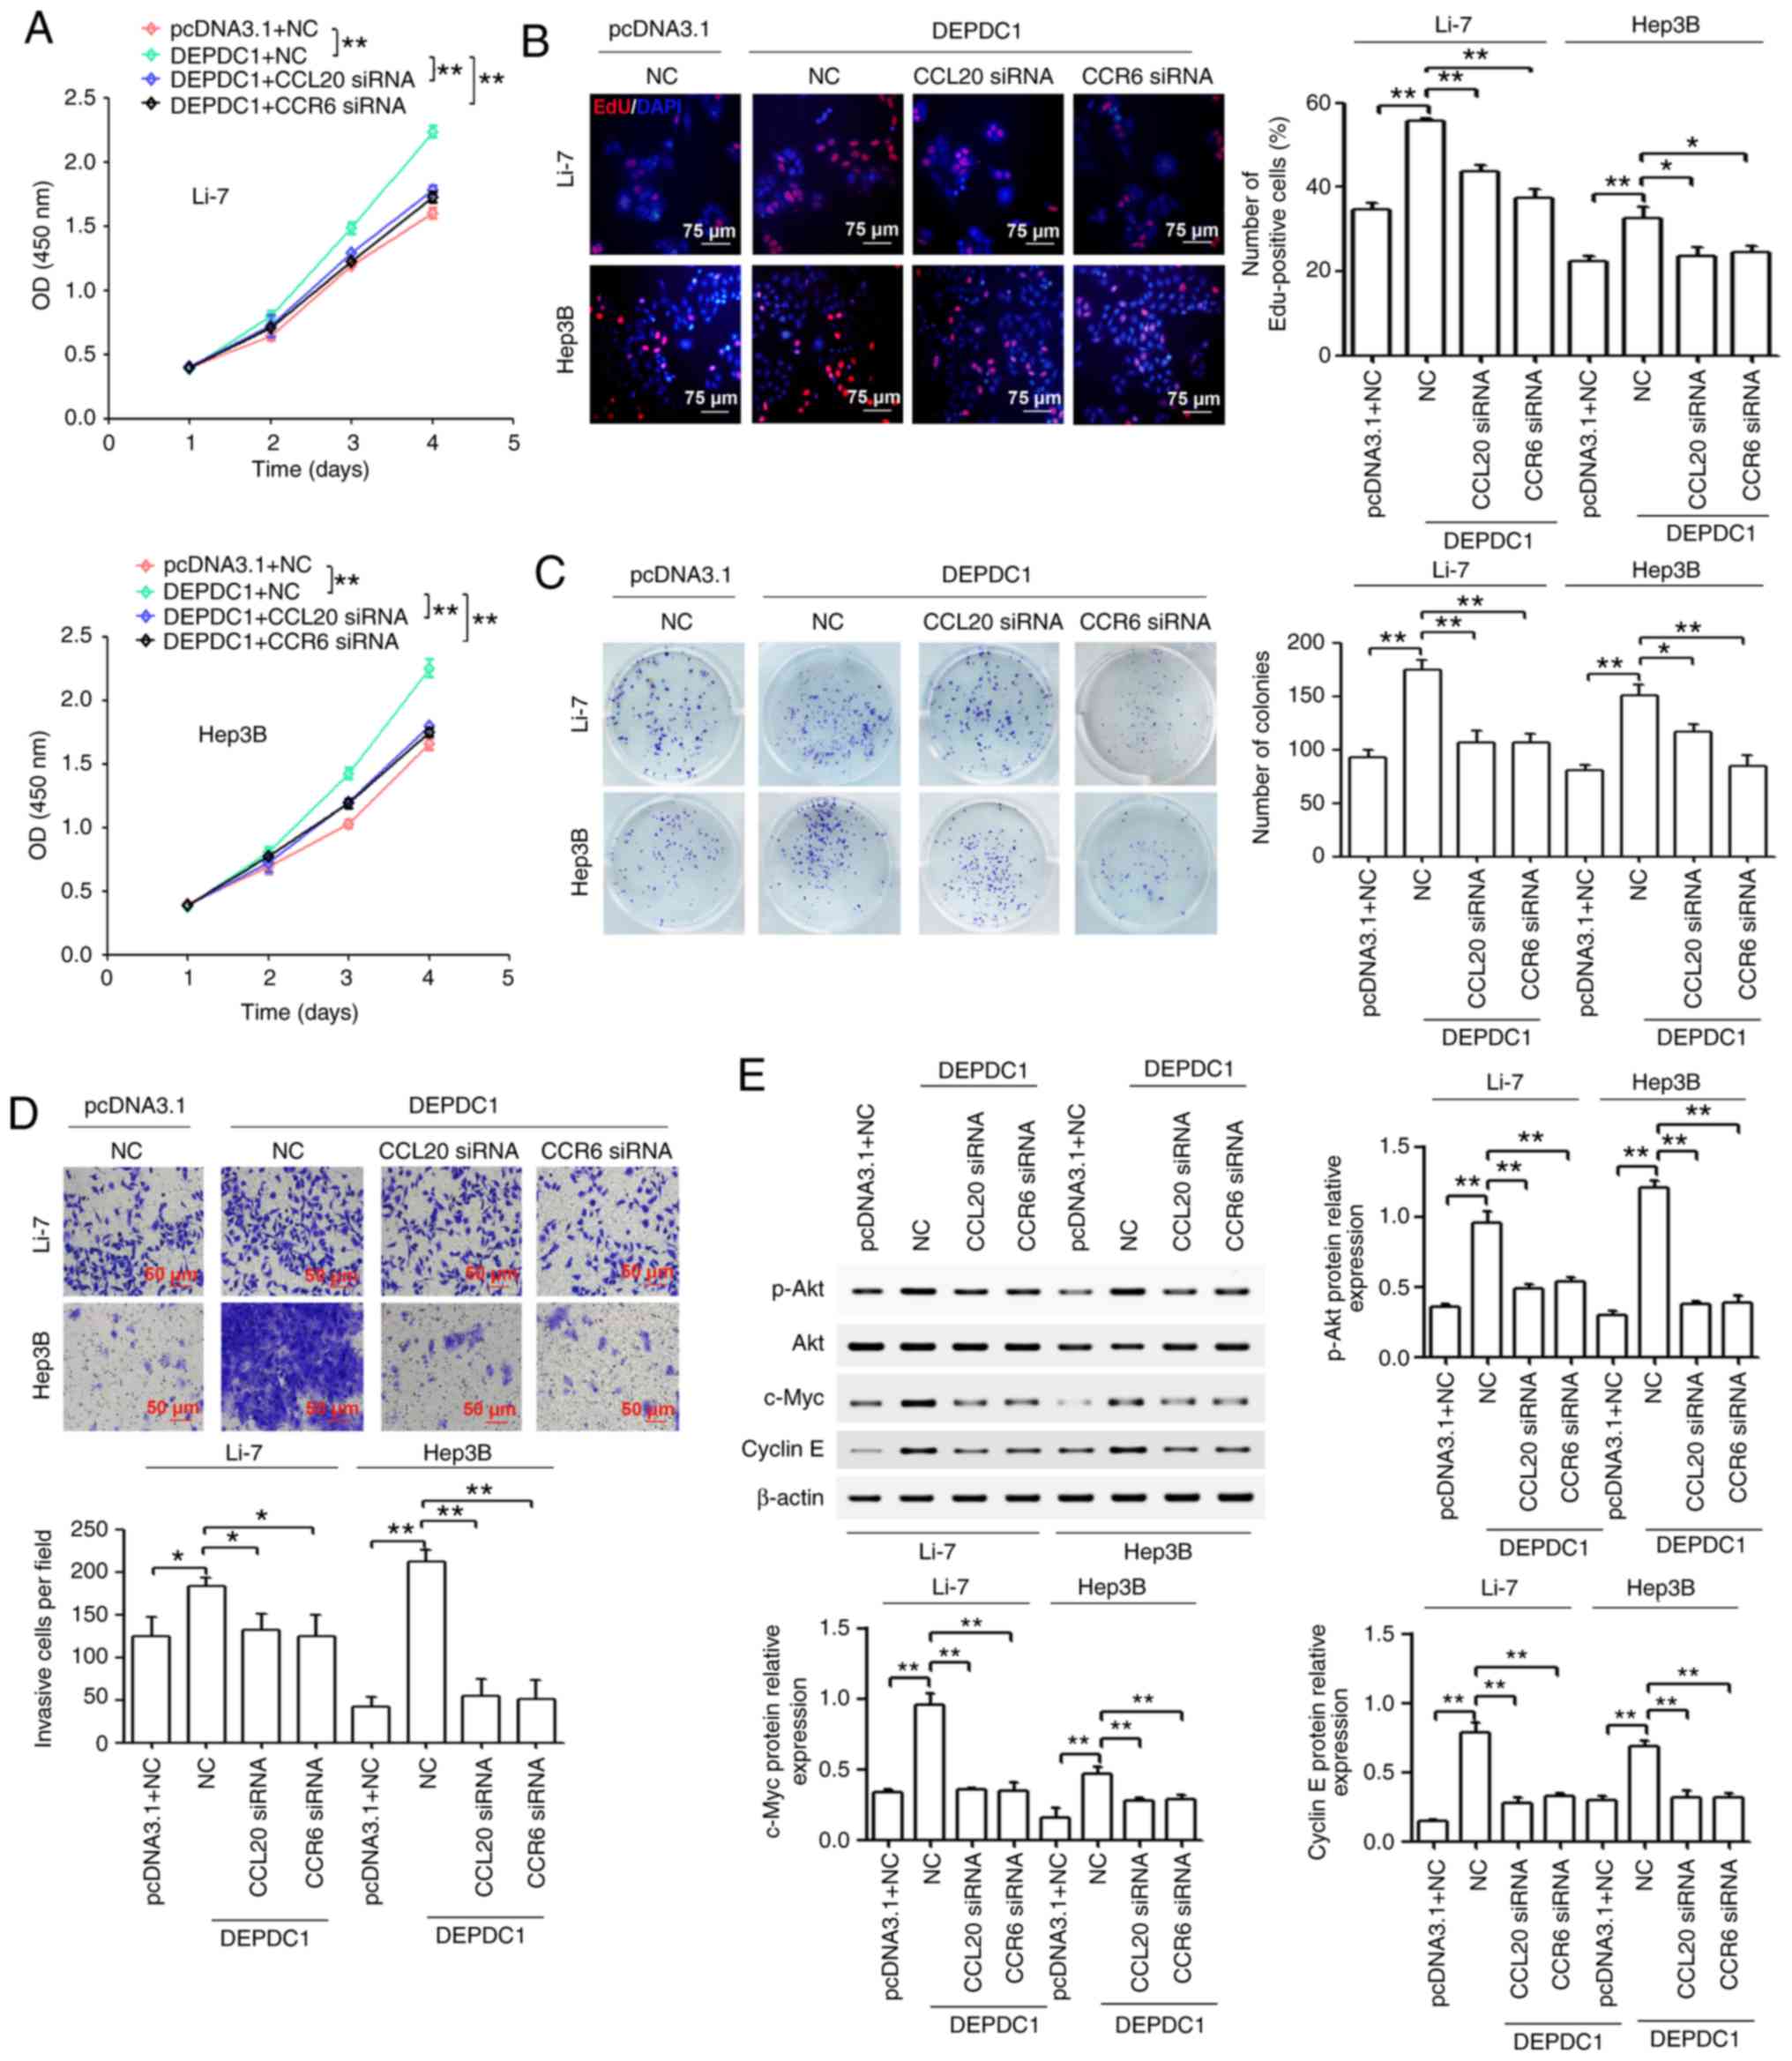 | Figure 5.CCL20 or CCR6 knockdown partially
reverses the effect of DEPDC1 overexpression on HCC cell
proliferation, colony formation and invasion in vitro. Li-7 and
Hep3B cells were treated with a combination of pcDNA3.1 and NC
plasmids or a combination of DEPDC1 expression vectors with NC,
CCL20 siRNA or CCR6 siRNA. (A) Cell Counting Kit-8 and (B) EdU
assays were performed to determine cell proliferation. Scale bar,
75 µm. (C) Foci formation assays were utilized to observe colony
formation. (D) Cell invasion was determined via a Transwell assay.
Scale bar, 50 µm. (E) Western blotting was performed to detect the
protein expression of p-Akt, Akt, c-myc and cyclin E. Each
experiment was performed in triplicate. *P<0.05, **P<0.01.
CCL20, chemokine (C-C motif) ligand 20; CCR6, chemokine (C-C motif)
receptor 6; DEPDC1, DEP domain containing 1; HCC, hepatocellular
carcinoma; NC, negative control; siRNA, small interfering RNA; p-,
phosphorylated. |
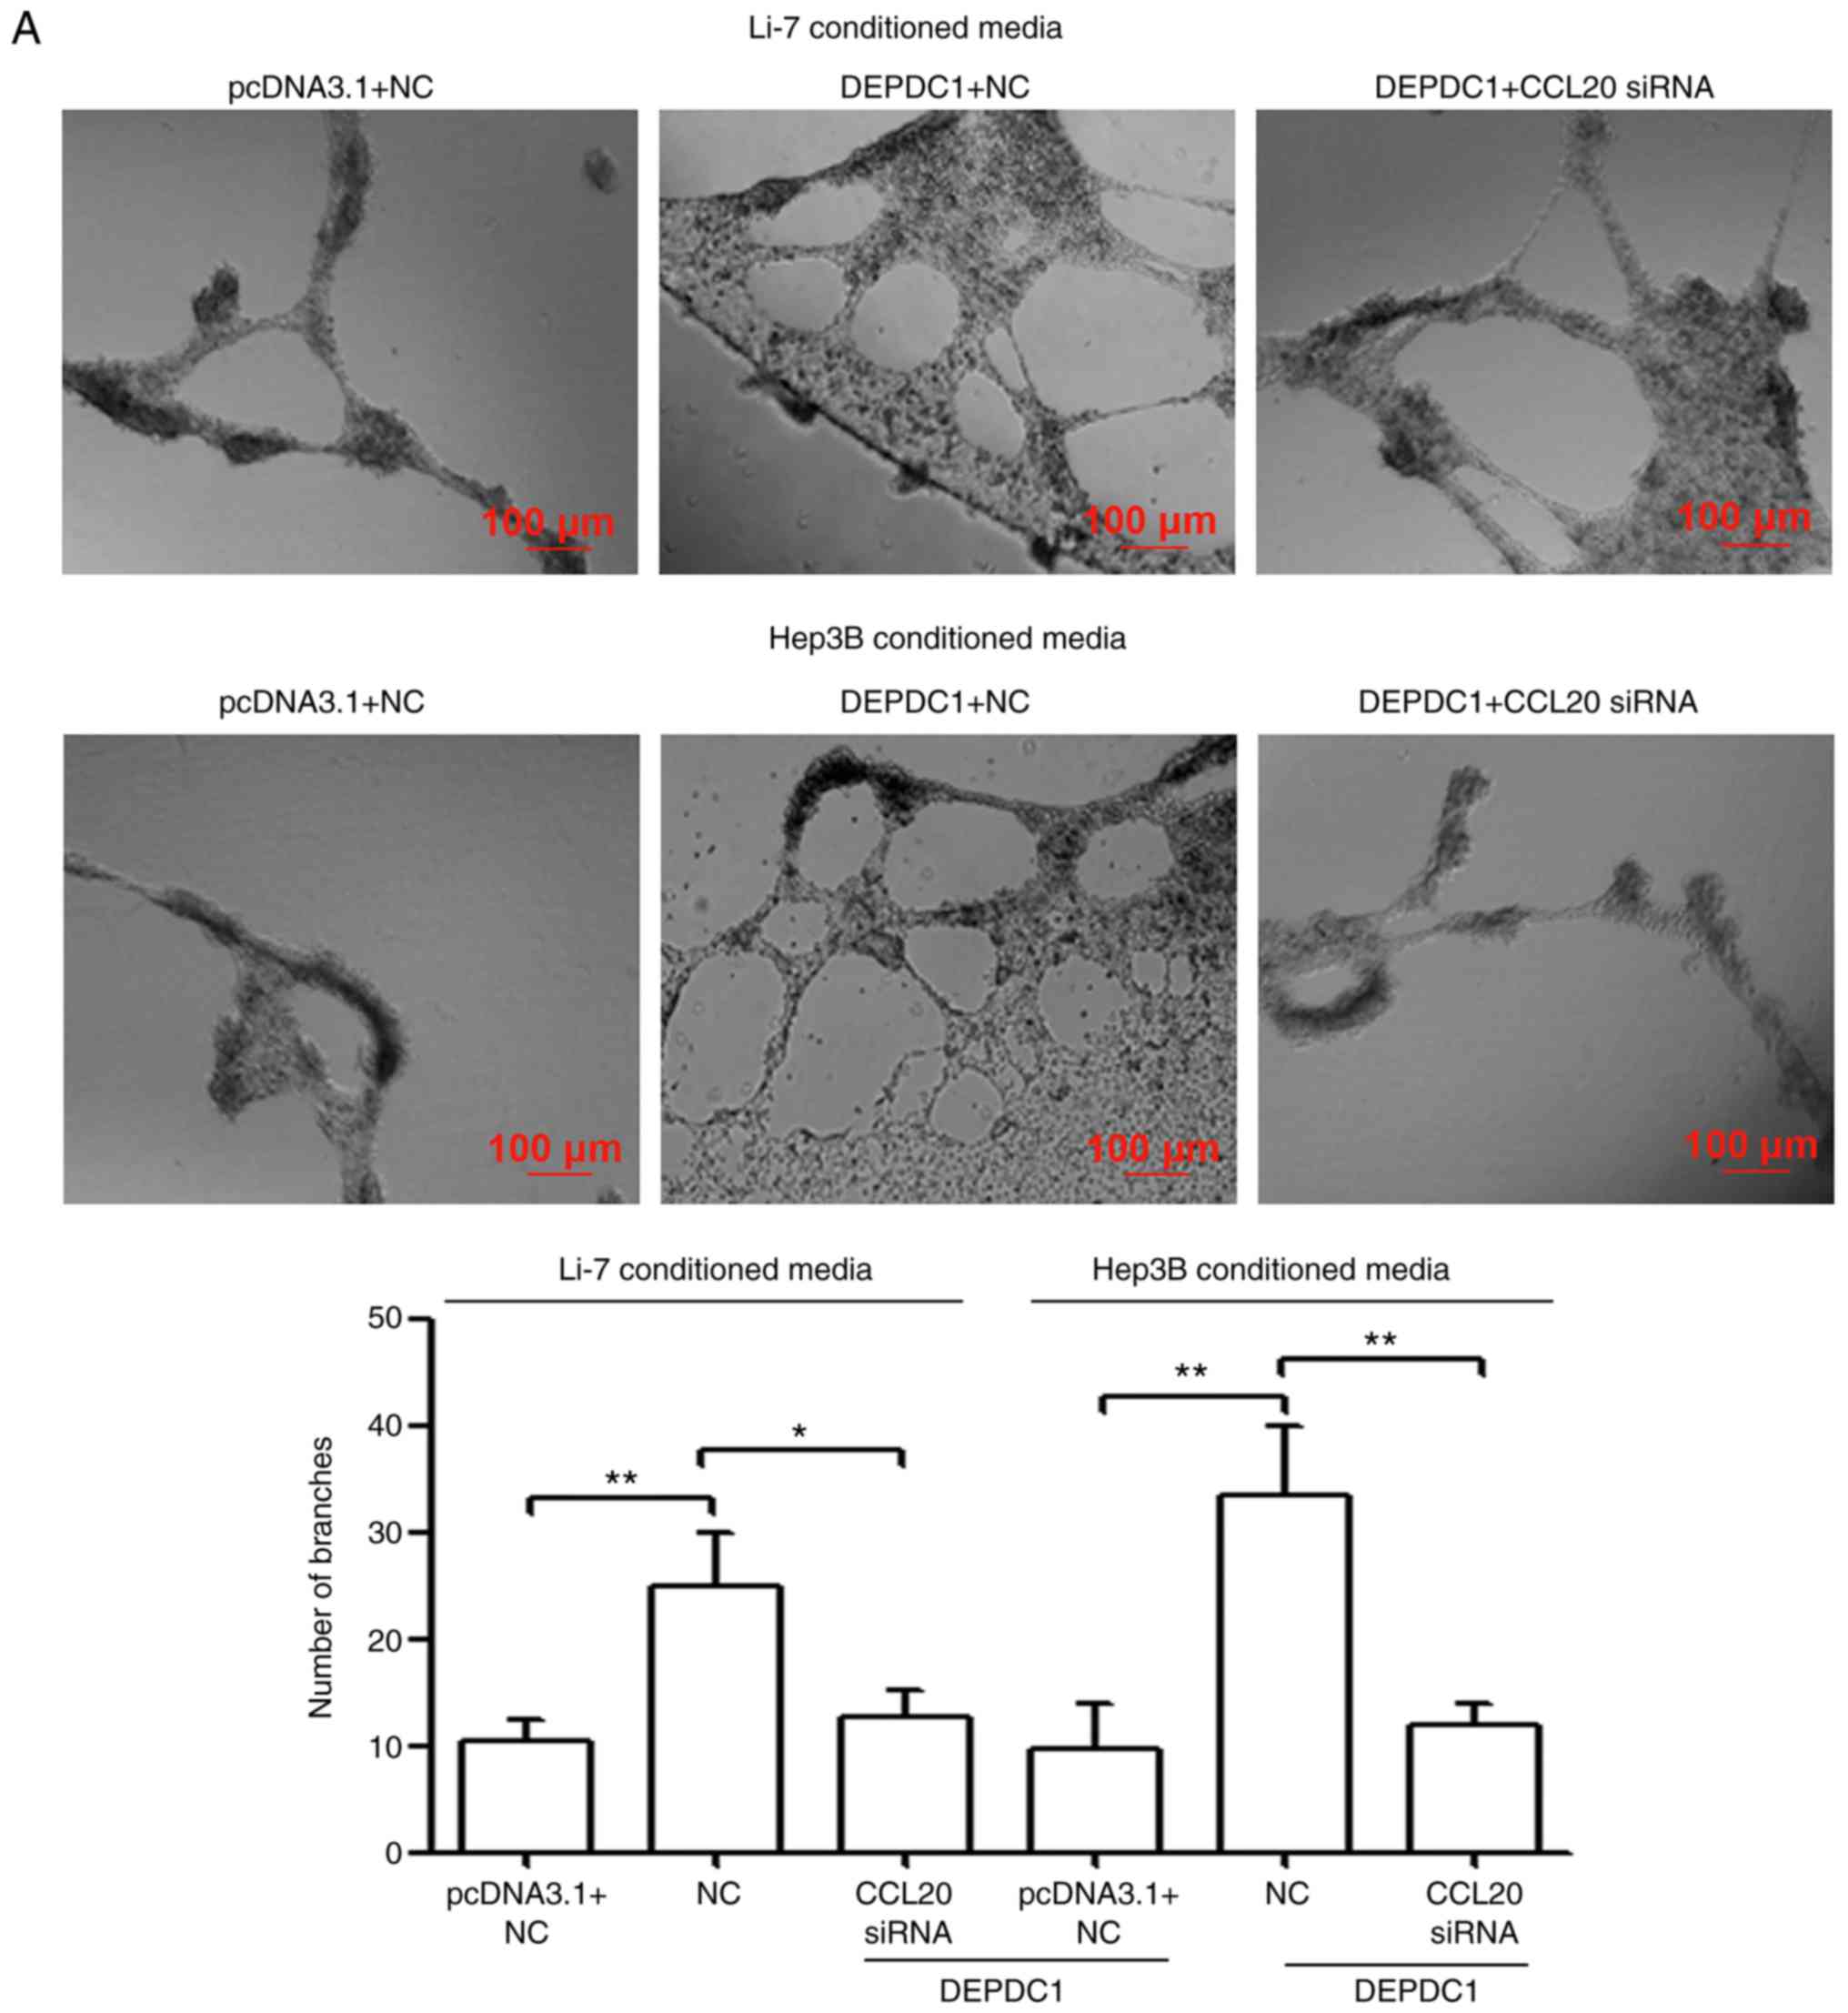
DEPDC1 promotes HUVEC invasion and
tube formation by regulating CCL20 in vitro
A capillary tube formation assay was performed in
the present study to determine the biological significance of
DEPDC1 in tumor angiogenesis. As presented in Fig. 6A and B, HUVECs incubated with TCM from
DEPDC1-transfected Li-7 and Hep3B cells developed more
capillary-like structures and displayed an increased invasive
tendency compared with those cultured in pcDNA3.1-transfected TCM.
To confirm whether DEPDC1 regulates HUVEC invasion and tube
formation by mediating CCL20 activity, TCM was collected from Li-7
and Hep3B cells co-transfected with DEPDC1 expression vectors and
CCL20 siRNA. The results demonstrated that CCL20 knockdown reversed
the effect of DEPDC1 upregulation on HUVEC angiogenesis and
invasion (Fig. 6A and B).
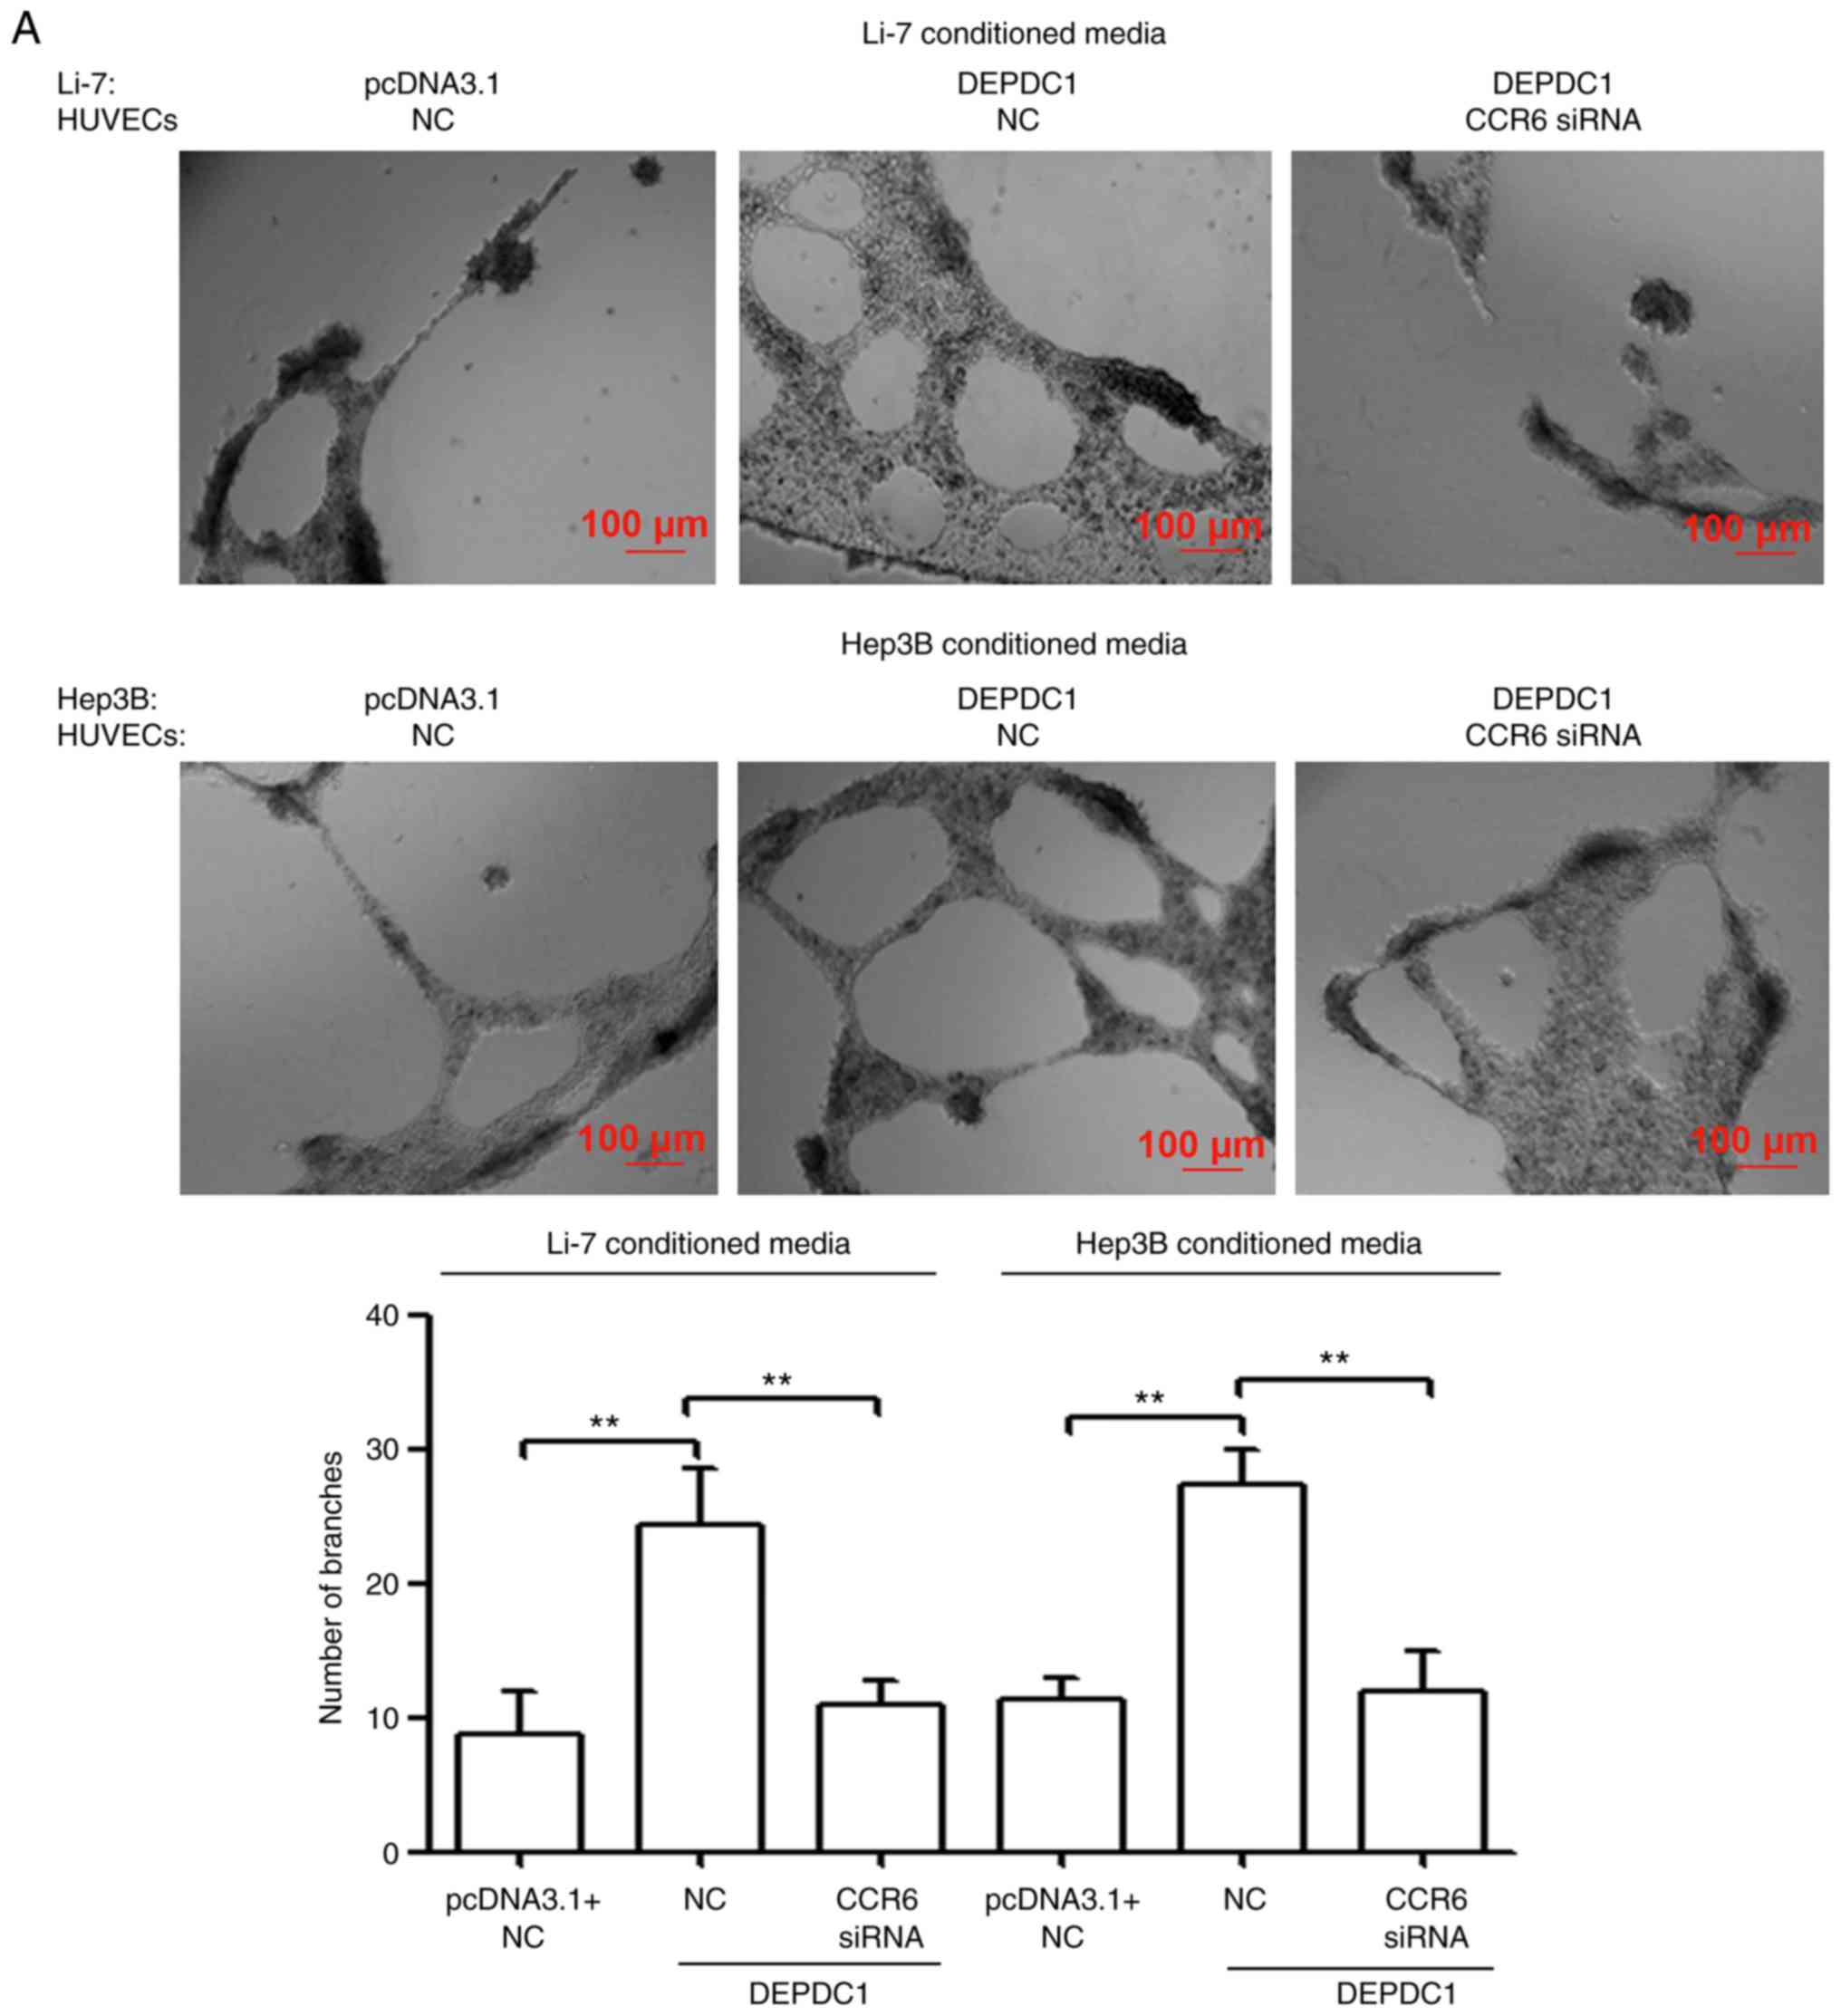
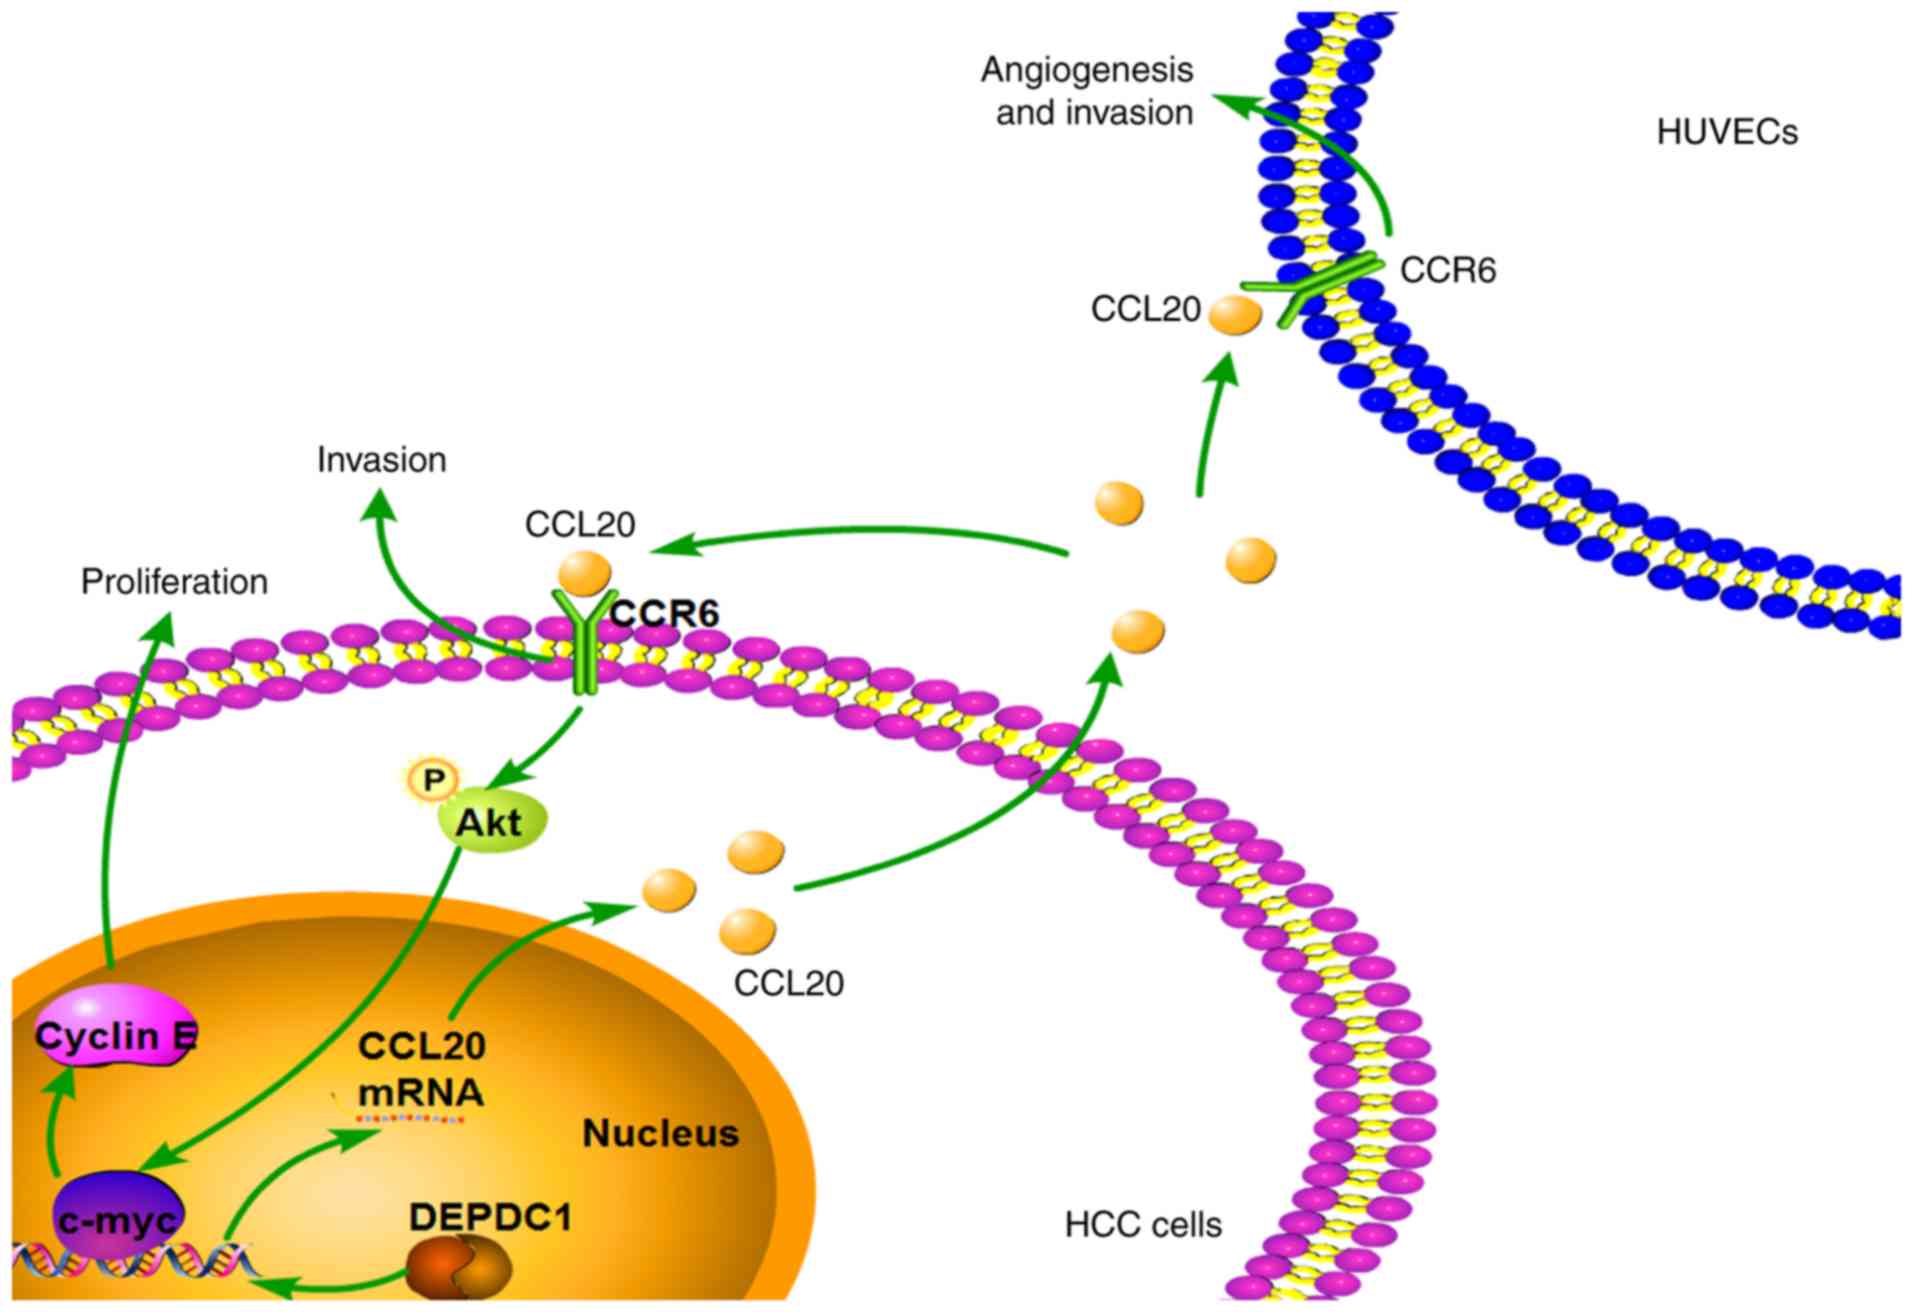
CCR6 knockdown in HUVECs reverses the
effect of DEPDC1 overexpression on angiogenesis and invasion
It has been previously revealed that endothelial
CCR6 serves an important role in CCL20-induced blood vessel
formation and invasion induced in HCC (16). Therefore, the present study assessed
whether CCR6 knockdown in HUVECs affected the function of DEPDC1.
As presented in Fig. 7A and B, HUVECs
incubated with TCM from DEPDC1-transfected Li-7 and Hep3B cells
developed more capillary-like structures and displayed an increased
invasive tendency compared with those cultured in
pcDNA3.1-transfected TCM. However, CCR6 knockdown in HUVECs
reversed these effects. The results therefore indicated that DEPDC1
may promote HCC progression by regulating the CCL20/CCR6 axis
(Fig. 8).
Discussion
Previous studies have indicated that DEPDC1 is
elevated in several types of cancer and is implicated in
tumorigenesis (6–10). It has also been revealed that DEPDC1
is upregulated in HCC tissue and may therefore be an independent
predictor of HCC (11). Furthermore,
DEPDC1 was revealed to be involved in the miR-130a-induced
apoptosis and inhibition of proliferation in HepG2 cells (12). Qu et al (13) revealed that DEPDC1 promoted HCC cell
proliferation and neoplasm metastasis. The present study also
determined that DEPDC1 was positively correlated with the K-RAS
signaling pathway, certain cancer-associated pathways and the
WNT/β-catenin signaling pathway. However, the mechanism of DEPDC1
in the regulation of HCC progression remains largely unknown.
Therefore, further studies are required to assess the regulation
and function of DEPDC1 to the benefit or patients with HCC.
The present study determined the expression of
DEPDC1 in HCC cell lines. The results revealed that DEPDC1 was
significantly upregulated in HCC cell lines. However, decreased
expression of DEPDC1 was detected in the normal human hepatic cells
(L02). Furthermore, DEPDC1 knockdown significantly suppressed
proliferation, colony formation and invasion of Huh-7 and SNU-387
cells. In addition, DEPDC1 upregulation enhanced the proliferation,
colony formation and invasion capability of Li-7 and Hep3B cells.
DEPDC1 downregulation also significantly inhibited tumourigenesis
in xenograft mouse models, which may be due to the inhibition of
cell proliferation and colony formation. Consistent with these
results, Qu et al (13)
demonstrated that DEPDC1 knockdown inhibited HCC cell
proliferation, colony formation, migration and invasion. In
addition, DEPDC1 silencing via siRNA reduced the viability and
invasion capability of prostate cancer cell lines (24), while DEPDC1 upregulation promoted
prostate cancer cell proliferation and metastases (25). Collectively, the data indicated that
DEPDC1 may serve an important oncogenic role in HCC
progression.
To elucidate the underlying molecular mechanism of
DEPDC1 in the regulation of HCC progression, gene microarray
analysis was performed. GO analysis results revealed that
differentially expressed genes induced by DEPDC1 knockdown were
enriched in C-X-C chemokine binding, vasculature development, blood
vessel development and the extracellular matrix. KEGG pathway
analysis revealed that differentially expressed genes induced by
DEPDC1 knockdown were significantly enriched in cytokine-cytokine
receptor interactions. Gene microarray data also demonstrated that
genes associated Cytokine-cytokine receptor interactions, such as
CCL20 and CCR6, were significantly downregulated in Huh-7 cells
transfected with DEPDC1 siRNA. CCL20 and its physiological sole
receptor, CCR6, have been determined to be involved in the
proliferation and metastasis of normal cells and tumor cells
(23,26–31). For
instance, in breast epithelial cells, CCL20/CCR6 increased cell
migration via protein kinase C-α-activate Src, thereby inducing the
activation of Akt, JNK, and NF-kB pathways, and inducing cell
proliferation via the ERK1/2/mitogen-activated protein kinase
pathway (23). In colorectal cancer
cells, CCL20/CCR6 induced cell proliferation and migration by
activating of ERK1/2, stress-activated protein kinase/JNK and Akt
signaling (26). In addition, CCL20
and CCR6 have been demonstrated to be upregulated in HCC tissue
(15,32), and a high expression of CCL20 was
associated with poorer survival and recurrence-free survival rates
(33). Furthermore, the CCL20/CCR6
axis induced HCC cell proliferation, adhesion and chemotactic
migration (14). The CCL20/CCR6 axis
also contributes to hepatic angiogenesis in HCV-associated HCC
(16). Active angiogenesis and
metastasis are responsible for poor patient survival rates and the
rapid recurrence of HCC (34). In the
present study, RT-qPCR and western blotting revealed that DEPDC1
downregulation significantly suppressed the expression of CCL20 and
CCR6 mRNA, which was consistent with gene microarray data. In
addition, the results of the present study demonstrated that CCL20
and CCR6 mRNA and protein expression were significantly increased
in HCC tissue when compared with matched adjacent normal liver
tissue, and were positively correlated with the expression of
DEPDC1. These results indicated that the CCL20/CCR6 axis may be an
important intermediary of DEPDC1-mediated HCC progression. To
verify this hypothesis, CCL20 protein was inhibited via CCL20 siRNA
in HCC cells pretreated with the DEPDC1 expression vector. The
results revealed that CCL20 knockdown reversed the effects of
DEPDC1 overexpression on the cell proliferation, colony formation
and invasion of HCC cells. Furthermore, CCR6 knockdown via siRNA
also rescued the effects of DEPDC1 overexpression on HCC cell
proliferation, colony formation and invasion. In normal breast
cells, the CCL20/CCR6 axis is known to induce the expression of
cell cycle-associated proteins (c-myc, c-Fos and cyclin E1) by
activating the PI3K/Akt pathway. The present study revealed that
DEPDC1 upregulation induced the expression of p-Akt, c-myc and
cyclin E1, while CCL20 or CCR6 knockdown reversed these effects.
Thus, the results of the present study indicated that DEPDC1
promoted HCC cell proliferation, colony formation and invasion by
regulating the CCL20/CCR6 axis. In addition, the present study
demonstrated that DEPDC1 overexpression resulted in the enhanced
angiogenesis and invasion of HCC cells. Conversely, CCL20 knockdown
was revealed to reverse the effects of DEPDC1 overexpression. It
has been previously demonstrated that CCL20 induces HUVEC blood
vessel formation and invasion by mediating endothelial CCR6
(16). Thus, the present study
hypothesized that endothelial CCR6 may be critical for
DEPDC1-CCL20-angiogenesis. To confirm this, CCR6 expression was
inhibited in HUVECs. The results revealed that CCR6 knockdown
reversed the effects of DEPDC1 overexpression on angiogenesis and
invasion of HUVECs. These results indicated that activation of
CCL20/CCR6 axis induced by DEPDC1 may be one of the mechanisms that
underlie DEPDC1-mediated HCC progression.
In conclusion, the present study confirmed the
effect of DEPDC1 in HCC cell proliferation, colony formation and
invasion. Furthermore, the results revealed that DEPDC1 promoted
HUVEC angiogenesis and invasion. DEPDC1-mediated HCC progression
was also determined to be at least partially dependent on the
CCL20/CCR6 axis. The results of the present study may provide a new
prospective on the role and mechanism of DEPDC1 in HCC.
Supplementary Material
Supporting Data
Acknowledgements
Not applicable.
Funding
The present study was supported by the National
Natural Science Foundation of China (grant no. 81802398).
Availability of data and materials
The datasets used and analyzed during the present
study are available from the corresponding author on reasonable
request.
Authors' contributions
WG, ZW and SY designed the present study. WG, HLi
and HLiu performed the IHC and the RT-qPCR examinations of clinical
tissues. HLi and WG collected patient samples and patient
information and performed the statistical analysis and the
interpretation of the clinical data. WG, HLiu and XM performed the
cell experiments and animal experiments and contributed to the
statistical analysis and the interpretation of the data. WG wrote
the manuscript. ZW and SY reviewed and edited the manuscript. ZW
and SY supervised the work of the research group. All authors read
and approved the final version of the manuscript.
Ethics approval and consent to
participate
The present study was approved by the Ethical
Committee of the First Affiliated Hospital of Chongqing Medical
University (Chongqing, China). All patients provided written
informed consent.
Patient consent for publication
Not applicable.
Competing interests
The authors declare that they have no competing
interests.
References
|
1
|
Siegel R, Naishadham D and Jemal A: Cancer
statistics, 2013. CA Cancer J Clin. 63:11–30. 2013. View Article : Google Scholar : PubMed/NCBI
|
|
2
|
Forner A, Llovet JM and Bruix J:
Hepatocellular carcinoma. Lancet. 379:1245–1255. 2012. View Article : Google Scholar : PubMed/NCBI
|
|
3
|
Bellissimo F, Pinzone MR, Cacopardo B and
Nunnari G: Diagnostic and therapeutic management of hepatocellular
carcinoma. World J Gastroenterol. 21:12003–12021. 2015. View Article : Google Scholar : PubMed/NCBI
|
|
4
|
Intaraprasong P, Siramolpiwat S and
Vilaichone RK: Advances in management of hepatocellular carcinoma.
Asian Pac J Cancer Prev. 17:3697–3703. 2016.PubMed/NCBI
|
|
5
|
Bruix J, Gores GJ and Mazzaferro V:
Hepatocellular carcinoma: Clinical frontiers and perspectives. Gut.
63:844–855. 2014. View Article : Google Scholar : PubMed/NCBI
|
|
6
|
Tosi A, Dalla Santa S, Cappuzzello E,
Marotta C, Walerich D, Del Sal G, Zanovello P, Sommaggio R and
Rosato A: Identification of a HLA-A*0201-restricted immunogenic
epitope from the universal tumor antigen DEPDC1. Oncoimmunology.
6:e13133712017. View Article : Google Scholar : PubMed/NCBI
|
|
7
|
Kanehira M, Harada Y, Takata R, Shuin T,
Miki T, Fujioka T, Nakamura Y and Katagiri T: Involvement of
upregulation of DEPDC1 (DEP domain containing 1) in bladder
carcinogenesis. Oncogene. 26:6448–6455. 2007. View Article : Google Scholar : PubMed/NCBI
|
|
8
|
Kikuchi R, Sampetrean O, Saya H, Yoshida K
and Toda M: Functional analysis of the DEPDC1 oncoantigen in
malignant glioma and brain tumor initiating cells. J Neurooncol.
133:297–307. 2017. View Article : Google Scholar : PubMed/NCBI
|
|
9
|
Feng X, Zhang C, Zhu L, Zhang L, Li H, He
L, Mi Y, Wang Y, Zhu J and Bu Y: DEPDC1 is required for cell cycle
progression and motility in nasopharyngeal carcinoma. Oncotarget.
8:63605–63619. 2017. View Article : Google Scholar : PubMed/NCBI
|
|
10
|
Mi Y, Zhang C, Bu Y, Zhang Y, He L, Li H,
Zhu H, Li Y, Lei Y and Zhu J: DEPDC1 is a novel cell cycle related
gene that regulates mitotic progression. BMB Rep. 48:413–418. 2015.
View Article : Google Scholar : PubMed/NCBI
|
|
11
|
Yuan SG, Liao WJ, Yang JJ, Huang GJ and
Huang ZQ: DEP domain containing 1 is a novel diagnostic marker and
prognostic predictor for hepatocellular carcinoma. Asian Pac J
Cancer Prev. 15:10917–10922. 2014. View Article : Google Scholar : PubMed/NCBI
|
|
12
|
Li A, Wang Q, He G, Jin J and Huang G: DEP
domain containing 1 suppresses apoptosis via inhibition of A20
expression, which activates the nuclear factor κB signaling pathway
in HepG2 cells. Oncol Lett. 16:949–955. 2018.PubMed/NCBI
|
|
13
|
Qu D, Cui F, Lu D, Yang Y and Xu Y: DEP
domain containing 1 predicts prognosis of hepatocellular carcinoma
patients and regulates tumor proliferation and metastasis. Cancer
Sci. 110:157–165. 2019.PubMed/NCBI
|
|
14
|
Du D, Liu Y, Qian H, Zhang B, Tang X,
Zhang T and Liu W: The effects of the CCR6/CCL20 biological axis on
the invasion and metastasis of hepatocellular carcinoma. Int J Mol
Sci. 15:6441–6452. 2014. View Article : Google Scholar : PubMed/NCBI
|
|
15
|
Huang F and Geng XP: Chemokines and
hepatocellular carcinoma. World J Gastroenterol. 16:1832–1836.
2010. View Article : Google Scholar : PubMed/NCBI
|
|
16
|
Benkheil M, Van Haele M, Roskams T,
Laporte M, Noppen S, Abbasi K, Delang L, Neyts J and Liekens S:
CCL20, a direct-acting pro-angiogenic chemokine induced by
hepatitis C virus (HCV): Potential role in HCV-related liver
cancer. Exp Cell Res. 372:168–177. 2018. View Article : Google Scholar : PubMed/NCBI
|
|
17
|
Berretta M, Rinaldi L, Di Benedetto F,
Lleshi A, De Re V, Facchini G, De Paoli P and Di Francia R:
Angiogenesis inhibitors for the treatment of hepatocellular
carcinoma. Front Pharmaco. 7:4282016.
|
|
18
|
Zhu H, Gan X, Jiang X, Diao S, Wu H and Hu
J: ALKBH5 inhibited autophagy of epithelial ovarian cancer through
miR-7 and BCL-2. J Exp Clin Cancer Res. 38:1632019. View Article : Google Scholar : PubMed/NCBI
|
|
19
|
Livak KJ and Schmittgen TD: Analysis of
relative gene expression data using real-time quantitative PCR and
the 2(-Delta Delta C(T)) method. Methods. 25:402–408. 2001.
View Article : Google Scholar : PubMed/NCBI
|
|
20
|
Chen XY, Wang Q, Gu K, Li A, Fu X, Wang Y,
Gu W and Wen Y: Effect of YAP on an immortalized periodontal
ligament stem cell line. Stem Cells Int. 2019:68040362019.
View Article : Google Scholar : PubMed/NCBI
|
|
21
|
Fang JH, Zhou HC, Zeng C, Yang J, Liu Y,
Huang X, Zhang JP, Guan XY and Zhuang SM: MicroRNA-29b suppresses
tumor angiogenesis, invasion, and metastasis by regulating matrix
metalloproteinase 2 expression. Hepatology. 54:1729–1740. 2011.
View Article : Google Scholar : PubMed/NCBI
|
|
22
|
Yang C, Xu Y, Cheng F, Hu Y, Yang S, Rao J
and Wang X: miR-1301 inhibits hepatocellular carcinoma cell
migration, invasion, and angiogenesis by decreasing Wnt/β-catenin
signaling through targeting BCL9. Cell Death Dis. 8:e29992017.
View Article : Google Scholar : PubMed/NCBI
|
|
23
|
Marsigliante S, Vetrugno C and Muscella A:
CCL20 induces migration and proliferation on breast epithelial
cells. J Cell Physiol. 228:1873–1883. 2013. View Article : Google Scholar : PubMed/NCBI
|
|
24
|
Ramalho-Carvalho J, Martins JB, Cekaite L,
Sveen A, Torres-Ferreira J, Graça I, Costa-Pinheiro P, Eilertsen
IA, Antunes L, Oliveira J, et al: Epigenetic disruption of miR-130a
promotes prostate cancer by targeting SEC23B and DEPDC1. Cancer
Lett. 385:150–159. 2017. View Article : Google Scholar : PubMed/NCBI
|
|
25
|
Huang L, Chen K, Cai ZP, Chen FC, Shen HY,
Zhao WH, Yang SJ, Chen XB, Tang GX and Lin X: DEPDC1 promotes cell
proliferation and tumor growth via activation of E2F signaling in
prostate cancer. Biochem Biophys Res Commun. 490:707–712. 2017.
View Article : Google Scholar : PubMed/NCBI
|
|
26
|
Brand S, Olszak T, Beigel F, Diebold J,
Otte JM, Eichhorst ST, Göke B and Dambacher J: Cell differentiation
dependent expressed CCR6 mediates ERK-1/2, SAPK/JNK, and Akt
signaling resulting in proliferation and migration of colorectal
cancer cells. J Cell Biochem. 97:709–723. 2006. View Article : Google Scholar : PubMed/NCBI
|
|
27
|
Frick VO, Rubie C, Keilholz U and Ghadjar
P: Chemokine/chemokine receptor pair CCL20/CCR6 in human colorectal
malignancy: An overview. World J Gastroenterol. 22:833–841. 2016.
View Article : Google Scholar : PubMed/NCBI
|
|
28
|
Zhang XP, Hu ZJ, Meng AH, Duan GC, Zhao QT
and Yang J: Role of CCL20/CCR6 and the ERK signaling pathway in
lung adenocarcinoma. Oncol Lett. 14:8183–8189. 2017.PubMed/NCBI
|
|
29
|
Han G, Wu D, Yang Y, Li Z, Zhang J and Li
C: CrkL meditates CCL20/CCR6-induced EMT in gastric cancer.
Cytokine. 76:163–169. 2015. View Article : Google Scholar : PubMed/NCBI
|
|
30
|
Ghadjar P, Rubie C, Aebersold DM and
Keilholz U: The chemokine CCL20 and its receptor CCR6 in human
malignancy with focus on colorectal cancer. Int J Cancer.
125:741–745. 2009. View Article : Google Scholar : PubMed/NCBI
|
|
31
|
Nandi B, Pai C, Huang Q, Prabhala RH,
Munshi NC and Gold JS: CCR6, the sole receptor for the chemokine
CCL20, promotes spontaneous intestinal tumorigenesis. PLoS One.
9:e975662014. View Article : Google Scholar : PubMed/NCBI
|
|
32
|
Rubie C, Frick VO, Wagner M, Rau B, Weber
C, Kruse B, Kempf K, Tilton B, König J and Schilling M: Enhanced
expression and clinical significance of CC-chemokine MIP-3 alpha in
hepatocellular carcinoma. Scand J Immunol. 63:468–477. 2006.
View Article : Google Scholar : PubMed/NCBI
|
|
33
|
Hou KZ, Fu ZQ and Gong H: Chemokine ligand
20 enhances progression of hepatocellular carcinoma via
epithelial-mesenchymal transition. World J Gastroenterol.
21:475–483. 2015. View Article : Google Scholar : PubMed/NCBI
|
|
34
|
Fernandez M, Semela D, Bruix J, Colle I,
Pinzani M and Bosch J: Angiogenesis in liver disease. J Hepatol.
50:604–620. 2009. View Article : Google Scholar : PubMed/NCBI
|