Introduction
Colon cancer (CRC) is the fourth leading cause of
cancer-related deaths throughout the world after lung, breast, and
prostate cancer. Based on the GLOBOCAN data, more than 1.8 million
newly diagnosed carcinoma cases and 881,000 deaths related to this
disease occurred in 2018 worldwide (1). Colon adenocarcinoma (COAD) is one of the
most common pathological types of colon cancer (2). In recent years, colon adenocarcinoma has
a significant upward trend in morbidity and mortality (3), especially in Western developed countries
and Asian developing countries (4).
Although, there are many treatments, including surgery and
chemotherapy, the five-year survival rate of COAD is still not
promising (5). Late diagnosis,
unreliable biomarkers and therapeutic targets have become major
obstacles in the treatment of colon adenocarcinoma (6). Therefore, early diagnosis and treatment
are essential for the improvement of the prognosis and quality of
life of the patients. Finding new targets in COAD may provide new
alternatives and insights for comprehensive management strategies
for COAD patients.
Integrins belong to heterodimeric surface receptors,
which are composed of non-covalently associated α and β subunits,
and as far as we know, the integrin family consists of 18α and 8β
members (7–11). ITGA, a subfamily of integrins,
has an α subunit composed of a seven-bladed β-propeller, a thigh,
and two calf domains (12). There is
an I domain (also called A domain), composed of ~200 amino acids
inserted between blades 2 and 3 in the β-propeller, and contained
in nine of the 18 integrin α chains (13). There are also domains that bind
Ca2+ on the lower side of the blades facing away from
the ligand-binding surface which are contained in the last three or
four blades of the β propeller. Ligand binding is influenced by
Ca2+ binding to these sites allosterically (14,15).
Previous research has revealed that the integrin family mediates
signal transduction by binding to the extracellular matrix via
adhesion receptors on its surface (16). Each integrin has multiple activation
states (12), and exerts effects
through cascaded amplification of various paths (17). Extensive studies have revealed that
integrins could function as signaling molecules through the cell
membrane in either direction: ‘inside-out signaling’ caused by
extracellular stimulation that causes intracellular linin and
kindlin to bind to the cytoskeleton, leaving the extracellular
domain in a high affinity state (8,18–20); and ‘outside-in signaling’, a
complicated process in which the heterodimeric adhesion receptors
of the integrins mediate cell adhesion to the extracellular matrix
(ECM), then activate integrins to engage and interact with the
cytoskeleton in order to activate a variety of intracellular
signaling pathways (12), which
enhance binding of activated integrin ligands and allow for the
perception of the intracellular environment (9,20,21). These integrins could control cell
attachment, movement, growth and differentiation, as well as
survival (12,22).
Integrins modulate muititudinal human pathologies
including thrombotic diseases, infectious diseases, inflammation,
fibrosis, and cancer (17). In
cancer, members of the integrin family of pattern recognition
receptors participate in many cellular processes in the body,
including adhesion, metastatic spread of tumor cells, and
identification (22). In addition to
altering the interaction of cells with the surrounding environment,
the proliferation, survival and differentiation of cancer cells can
be promoted by integrins through growth factors such as EGFR, VEGFR
interaction, or tyrosine kinase receptors (23). Integrins, as cell adhesion receptors,
are also observed and have been reported in various types of
cancer, such as multiple myeloma (24), NSCLC (25), glioma (26), ovarian cancer (27) and oral squamous cell carcinoma
(28). However, the potential
mechanism and application value of ITGA genes remain
elusive. Therefore, the aim of the present study was to explore the
potential application of ITGA genes of COAD in the
perspective of diagnosis and prognosis by using an RNA-sequencing
(RNA-Seq) dataset from The Cancer Genome Atlas (TCGA; http://tcga-data.nci.nih.gov/).
Materials and methods
Patient information
TCGA databases were accessed on October 30, 2018,
and a total of 456 COAD patient clinical parameters which consisted
of 480 tumor and 41 adjacent normal tissue samples were collected.
Clinical parameter information including sex, age, survival time
(days), survival status and tumor-node-metastasis (TNM) stage were
obtained.
Bioinformatics analysis of ITGA
genes
To study the biological enrichment function of the
ITGA subfamily, the online tool Database for Annotation,
Visualization, and Integrated Discovery (DAVID) (https://david.ncifcrf.gov/; version 6.8; accessed
January 5, 2019) (29,30), containing gene ontology (GO)
enrichment functional analysis and Kyoto Encyclopedia of Genes and
Genomes (KEGG) pathway analysis (31,32) was
used. An enrichment P-value <0.05 was considered as significant
from a statistical perspective. Gene ontology includes 3
independent modules, biological processes (BP), molecular functions
(MF), and cellular components (CC) (31). GO terms of ITGA genes were also
obtained using the Biological Networks Gene Ontology tool (BiNGO)
in Cytoscape_version 3.6.1 (33).
Gene-gene interactions of ITGA genes were then investigated
using Gene Multiple Association Network Integration Algorithm
(GeneMANIA, http://www.genemania.org/, accessed
December 25, 2018) (34).
Protein-protein interactions (PPI) of ITGA genes were
performed using the Search Tool for the Retrieval of Interacting
Genes (STRING; https://string-db.org/, accessed
November 19, 2018) (35,36).
mRNA expression levels of ITGA genes
and diagnostic receiver operating characteristic (ROC) curves
The mRNA expression levels of ITGA genes were
presented by box plots and scatter plots. A box plot of ITGA
genes was downloaded from the Metabolic gEne RApid Visualizer
(MEARV) (http://merav.wi.mit.edu/, accessed
January 21, 2019) (37), while a
scatter plot was generated from the TCGA dataset to integrate
cancer and adjacent normal tissues of mRNA expression levels at 75%
cut-off values. Diagnostic ROC curves investigated the
statistically significant expression of tumor tissues and adjacent
normal tissues in TCGA cohort.
Verification of the first affiliated
hospital of Guangxi medical university cohort
COAD patient tissue samples
COAD patient tissues, 30 in all, including tumor
tissues and paired adjacent normal tissues, were collected (from
April to June 2018) at the Department of Colorectal and Anal
Surgery of The First Affiliated Hospital of Guangxi Medical
University (Nanning, China). All patients signed an informed
consent form, and the experimental protocol was approved by the
Ethics Committee of the First Affiliated Hospital of Guangxi
Medical University. [No. 2019(KY-E-001)]. Immediately after
surgery, the tissue was placed in RNA protection solution and
transferred to a −80°C refrigerator for preservation. The
postoperative pathological diagnosis was COAD.
Detection of ITGA8 expression by
reverse transcription- quantitative polymerase chain reaction
(RT-qPCR)
RT-qPCR was performed to assess ITGA8
expression in COAD tissue samples, including tumor and adjacent
normal tissues. TRIzol® reagent (15596026; Invitrogen;
Thermo Fisher Scientific, Inc.) was used to extract total RNA from
tissues. Total RNA concentration was detected by NanoDrop One
(Thermo Fisher Scientific, Inc.). And the RNA was
reverse-transcribed (20-µl reaction system) applying a reverse
transcription kit (Applied Biosystems; Thermo Fisher Scientific,
Inc.) to create cDNA. Then in accordance with the FastStart
Universal SYBR Green Master (ROX) kit (Roche Diagnostics) and the
Applied Biosystems Quantsudio™ Real-Time PCR System (Q6) operation
guide (Applied Biosystems; Thermo Fisher Scientific, Inc.), the
reaction procedure was set up. The reaction conditions used were as
follows: Pre-denaturation at 95°C for 10 min; then denaturation at
95°C for 15 sec, 60°C extension for 60 sec, 40 cycles; finally
denaturation at 95°C for 15 sec, 60°C for 1 min, 95°C for 30 sec,
and 60°C for 15 sec. GAPDH was used as an internal reference gene,
and the primer sequences of ITGA8 and GAPDH were synthesized
by Sangon Biotech Co., Ltd. The primer sequences were as follows:
GAPDH forward, 5′-TGGTCCCTGCTCCTCTAAC-3′ and reverse,
5′-GGCTCAATGGCGTACTCTC-3′; and ITGA8 forward,
5′-GCTGCTGGGGAGTTTACTGG-3′ and reverse,
5′-GATGCCATCTGTTCTCCCGTG-3′. The gene expression level in the
present study was calculated using the 2−∆∆Cq method
(38).
Survival analysis
In TCGA database, 438 COAD patients were categorized
into two groups namely a high and low-expression group, which were
based on the 75% cut-off value of gene expression. Kaplan-Meier
survival analysis was performed for sex, age, and stage,
respectively. Then overall survival (OS) was determined to evaluate
the prognostic value of COAD patients. Furthermore, sex, age, and
TNM stage were adjusted using Cox proportional hazards regression
model in TCGA database.
Gene set enrichment analysis
(GSEA)
To further explore the potential value of biological
processes and pathways, multivariate prognostic significance of the
ITGA5 gene was grouped into low and high expression
categories based on the 75% cut-off value of the expression levels.
GSEA (http://software.broadinstitute.org/gsea/index.jsp,
downloaded January 20, 2018) (39,40) was
conducted to investigate underlying mechanisms by using the
Molecular Signatures Database (MSigDB) c2
(c2.cp.kegg.v6.2.symbols.gmt) and c5 (c5.all.v6.2.symbols.gmt)
(41). The enrichment gene sets in
GSEA were identified as statistically significant when a nominal
P-value <0.05 and a false discovery rate (FDR) <0.25 were
attained.
Statistical analysis
Kaplan-Meier survival analysis and the log-rank test
were conducted to assess different subgroups categorized by
clinical and gene variables. Adjusted hazard ratios (HRs) and 95%
confidence intervals (CIs) were obtained using univariate and
multivariate Cox proportional hazards models. TNM stage was
selected to set up a Cox proportional hazard regression model. The
paired t-test was applied for comparison of data between COAD
tumors and adjacent normal tissues. A P<0.05 indicated that the
differences exhibited statistical significance. The FDR in GSEA was
adjusted for multiple testing according to the Benjamini-Hochberg
procedure (42,43). All of the aforementioned statistical
analyses were performed with SPSS Statistics software version 20.0
(IBM Corp.). Vertical scatter plots, ROC and survival curves were
plotted using GraphPad Prism v.7.0 (GraphPad Software, Inc.).
Results
Baseline patient characteristics in
TCGA
The expression of the ITGA subfamily of
related genes was included from the TCGA RNAseq database. Firstly,
information concerning tumor and adjacent normal tissues was
isolated. Then clinical information was integrated with gene
expression. In addition, cases that had no clinical prognostic
information and people who had a survival time of 0 were excluded.
Finally, information on the 438 COAD patient tumor samples and 41
adjacent normal tissue samples was obtained. Detailed baseline
characteristics of the 438 COAD patients from the TCGA database are
summarized in Table I. It was
revealed that sex and age were not correlated with OS (all
P>0.05). However, TNM stage was notably associated with OS
(log-rank test P<0.001, adjusted P<0.001).
 | Table I.Baseline patient characteristics in a
TCGA cohort. |
Table I.
Baseline patient characteristics in a
TCGA cohort.
|
|
| OS |
|---|
|
|
|
|
|---|
| Variables | Patients
(n=438) | No. of events | MST (months) | HR (95% CI) | Log-rank
P-value |
|---|
| Age (years) |
|
|
|
|
|
|
<65 | 168 | 30 | NA | 1 | 0.17 |
|
≥65 | 268 | 67 | 82.5 | 1.353
(0.879–2.081) |
|
|
Missinga | 2 |
|
|
|
|
| Sex |
|
|
|
|
|
|
Male | 234 | 54 | 82.5 | 1 | 0.545 |
|
Female | 204 | 44 | NA | 0.884
(0.593–1.318) |
|
| Stage |
|
|
|
|
|
| 1 and
2 | 240 | 34 | 101.4 | 1 | <0.001 |
| 3 and
4 | 187 | 59 | 62.7 | 2.684
(1.758–4.099) |
|
|
Missingb | 11 |
|
|
|
|
Analysis of ITGA subfamily mRNA
expression levels in TCGA databases
The 75% cut-off value of gene expression levels was
used to categorize COAD patients into low-level groups and
high-level groups. Then TNM stage was used for adjustment of these
genes. Multivariate analysis indicated that ITGA5 exhibited
statistical significance [P=0.016; HR (95% CI)=1.681 (1.100–2.570)]
(Table II).
| Table II.Prognostic values of ITGA
subfamily gene expression in COAD of a TCGA cohort. |
Table II.
Prognostic values of ITGA
subfamily gene expression in COAD of a TCGA cohort.
|
|
| OS |
|---|
|
|
|
|
|---|
| Gene | Patients
(n=438) | No. of events | MST (days) | HR (95% CI) | Adjusted
P-valuea |
|---|
| ITGA1 |
|
|
|
|
|
|
Low | 329 | 77 | 3,042 | 1 | 0.303 |
|
High | 109 | 21 | 2,134 | 0.775
(0.477–1.259) |
|
| ITGA2 |
|
|
|
|
|
|
Low | 329 | 78 | 2,532 | 1 | 0.176 |
|
High | 109 | 20 | NA | 0.711
(0.434–1.165) |
|
| ITGA2B |
|
|
|
|
|
|
Low | 329 | 74 | 2,475 | 1 | 0.792 |
|
High | 109 | 24 | NA | 1.064
(0.670–1.691) |
|
| ITGA3 |
|
|
|
|
|
|
Low | 329 | 70 | 2,532 | 1 | 0.898 |
|
High | 109 | 28 | 2,047 | 0.971
(0.620–1.521) |
|
| ITGA4 |
|
|
|
|
|
|
Low | 329 | 73 | 2,821 | 1 | 0.434 |
|
High | 109 | 25 | 1,661 | 1.203
(0.757–1.912) |
|
| ITGA5 |
|
|
|
|
|
|
Low | 329 | 73 | 2,821 | 1 | 0.016 |
|
High | 109 | 25 | 2,047 | 1.681
(1.100–2.570) |
|
| ITGA6 |
|
|
|
|
|
|
Low | 329 | 77 | 2,532 | 1 | 0.284 |
|
High | 109 | 21 | NA | 0.767
(0.471–1.246) |
|
| ITGA7 |
|
|
|
|
|
|
Low | 329 | 73 | 2,532 | 1 | 0.763 |
|
High | 109 | 25 | 3,042 | 0.932
(0.59–1.472) |
|
| ITGA8 |
|
|
|
|
|
|
Low | 329 | 80 | 2,475 | 1 | 0.206 |
|
High | 109 | 18 | NA | 0.718
(0.430–1.199) |
|
| ITGA9 |
|
|
|
|
|
|
Low | 329 | 62 | 2,821 | 1 | 0.165 |
|
High | 109 | 36 | 2,047 | 1.340
(0.887–2.024) |
|
| ITGA10 |
|
|
|
|
|
|
Low | 329 | 69 | 2,821 | 1 | 0.069 |
|
High | 109 | 29 | 2,047 | 1.506
(0.969–2.343) |
|
| ITGA11 |
|
|
|
|
|
|
Low | 329 | 70 | 2,821 | 1 | 0.641 |
|
High | 109 | 28 | 1,910 | 1.111
(0.713–1.731) |
|
| ITGAD |
|
|
|
|
|
|
Low | 329 | 73 | 2,475 | 1 | 0.801 |
|
High | 109 | 25 | 3,042 | 1.060
(0.672–1.672) |
|
| ITGAE |
|
|
|
|
|
|
Low | 329 | 80 | 2,475 | 1 | 0.438 |
|
High | 109 | 18 | NA |
0.815(0.486–1.366) |
|
| ITGAL |
|
|
|
|
|
|
Low | 329 | 72 | 2,532 | 1 | 0.173 |
|
High | 109 | 26 | 2,134 | 1.370
(0.871–2.156) |
|
| ITGAM |
|
|
|
|
|
|
Low | 329 | 72 | 2,821 | 1 | 0.382 |
|
High | 109 | 26 | 2,134 | 1.222
(0.779–1.917) |
|
| ITGAV |
|
|
|
|
|
|
Low | 329 | 81 | 2,532 | 1 | 0.327 |
|
High | 109 | 17 | 2,047 |
0.768(0.452–1.303) |
|
| ITGAX |
|
|
|
|
|
|
Low | 329 | 76 | 2,532 | 1 | 0.665 |
|
High | 109 | 22 | 3,042 |
1.111(0.689–1.793) |
|
Bioinformatics analysis of the ITGA
genes
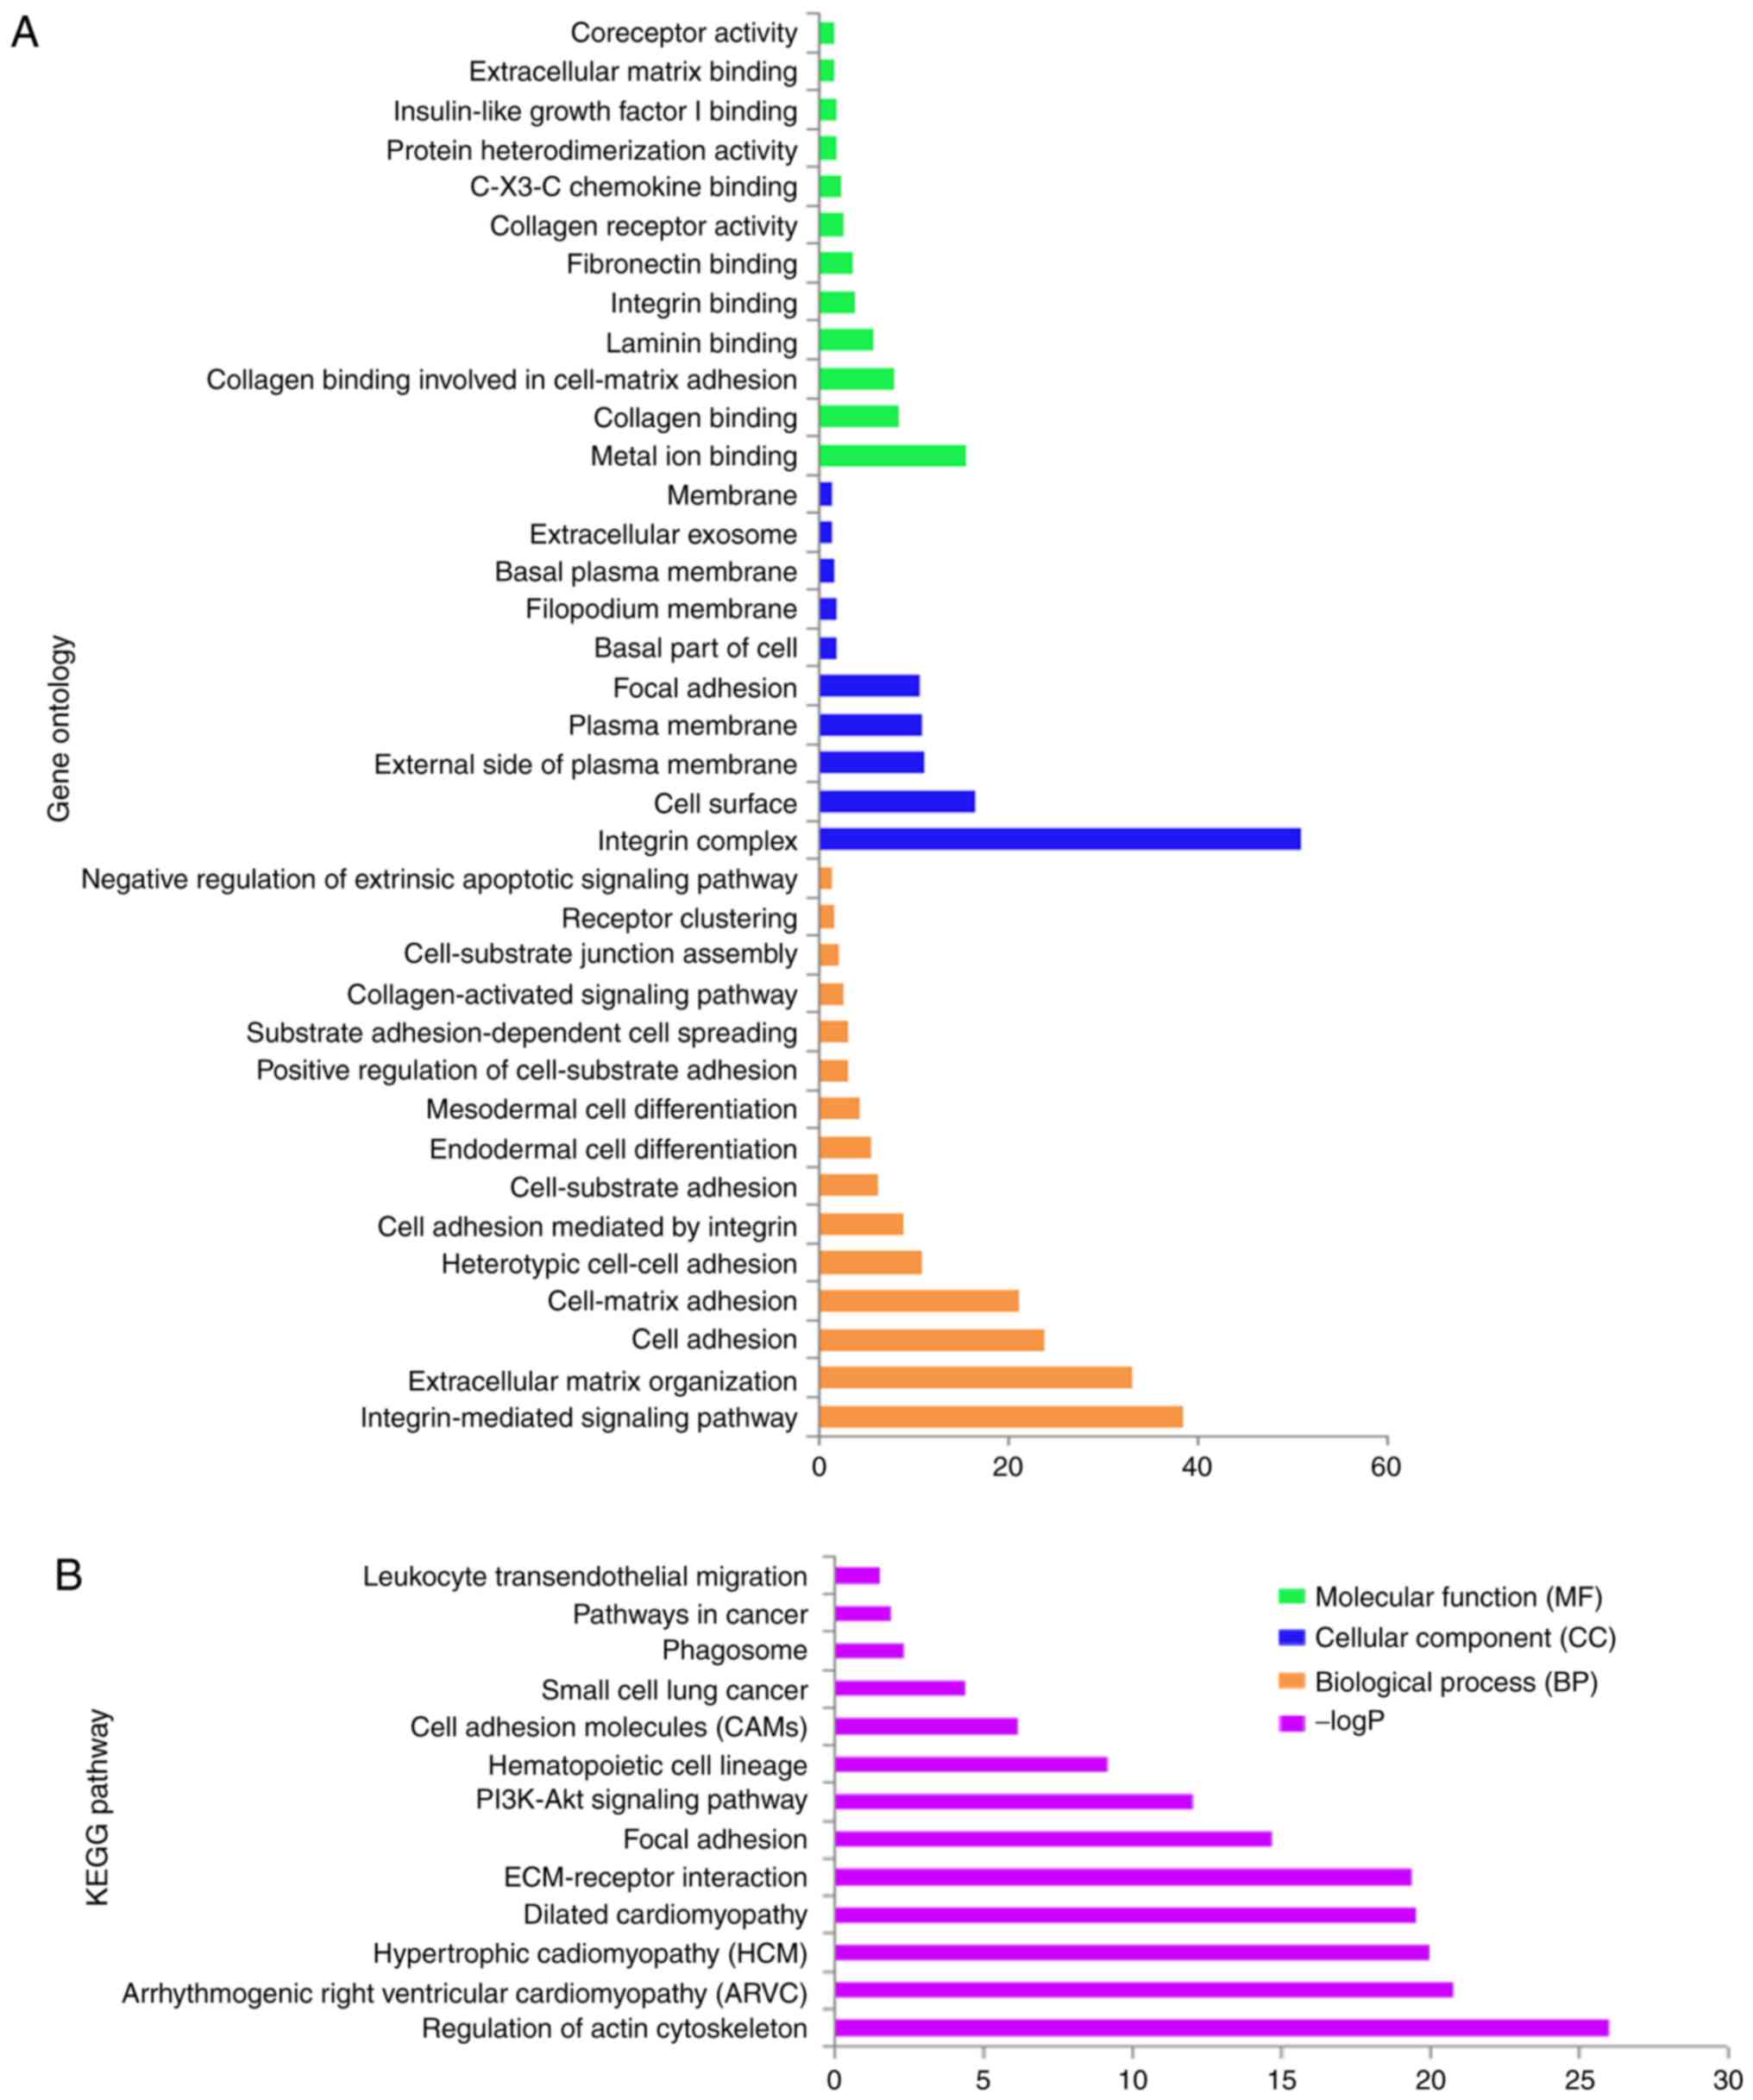
GO term enrichment analysis of ITGA genes
revealed that biological processes mainly involved cell adhesion
and the integrin-mediated signaling pathway (Fig. 1A and S1). KEGG pathway analysis mainly involved
focal adhesion, the PI3K/AKt signaling pathway and regulation of
actin cytoskeleton (Fig. 1B and
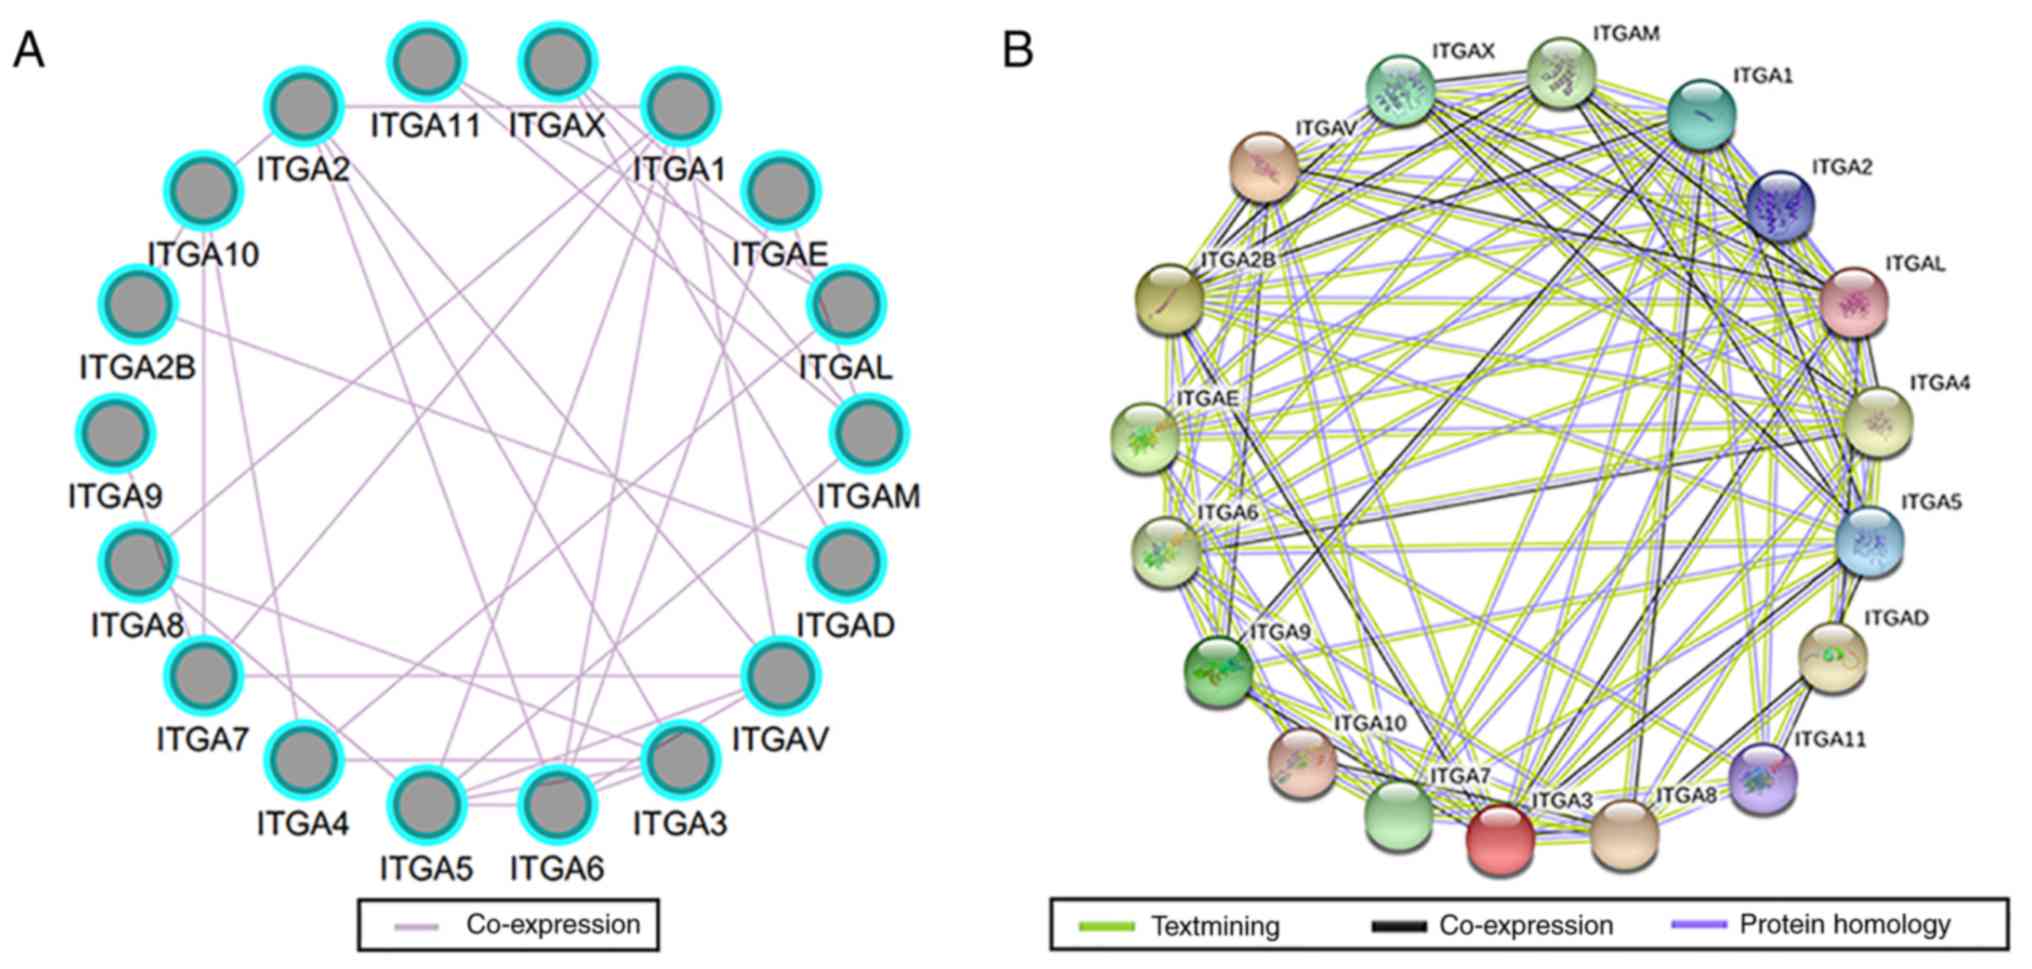
S2). The interaction networks of
gene-gene and protein-protein indicated that ITGA genes had
co-expression with each other and with complex gene-gene and
protein-protein interaction networks (Fig. 2A and B).
Analysis of ITGA subfamily gene
expression levels in tumor and adjacent normal tissues based on
TCGA
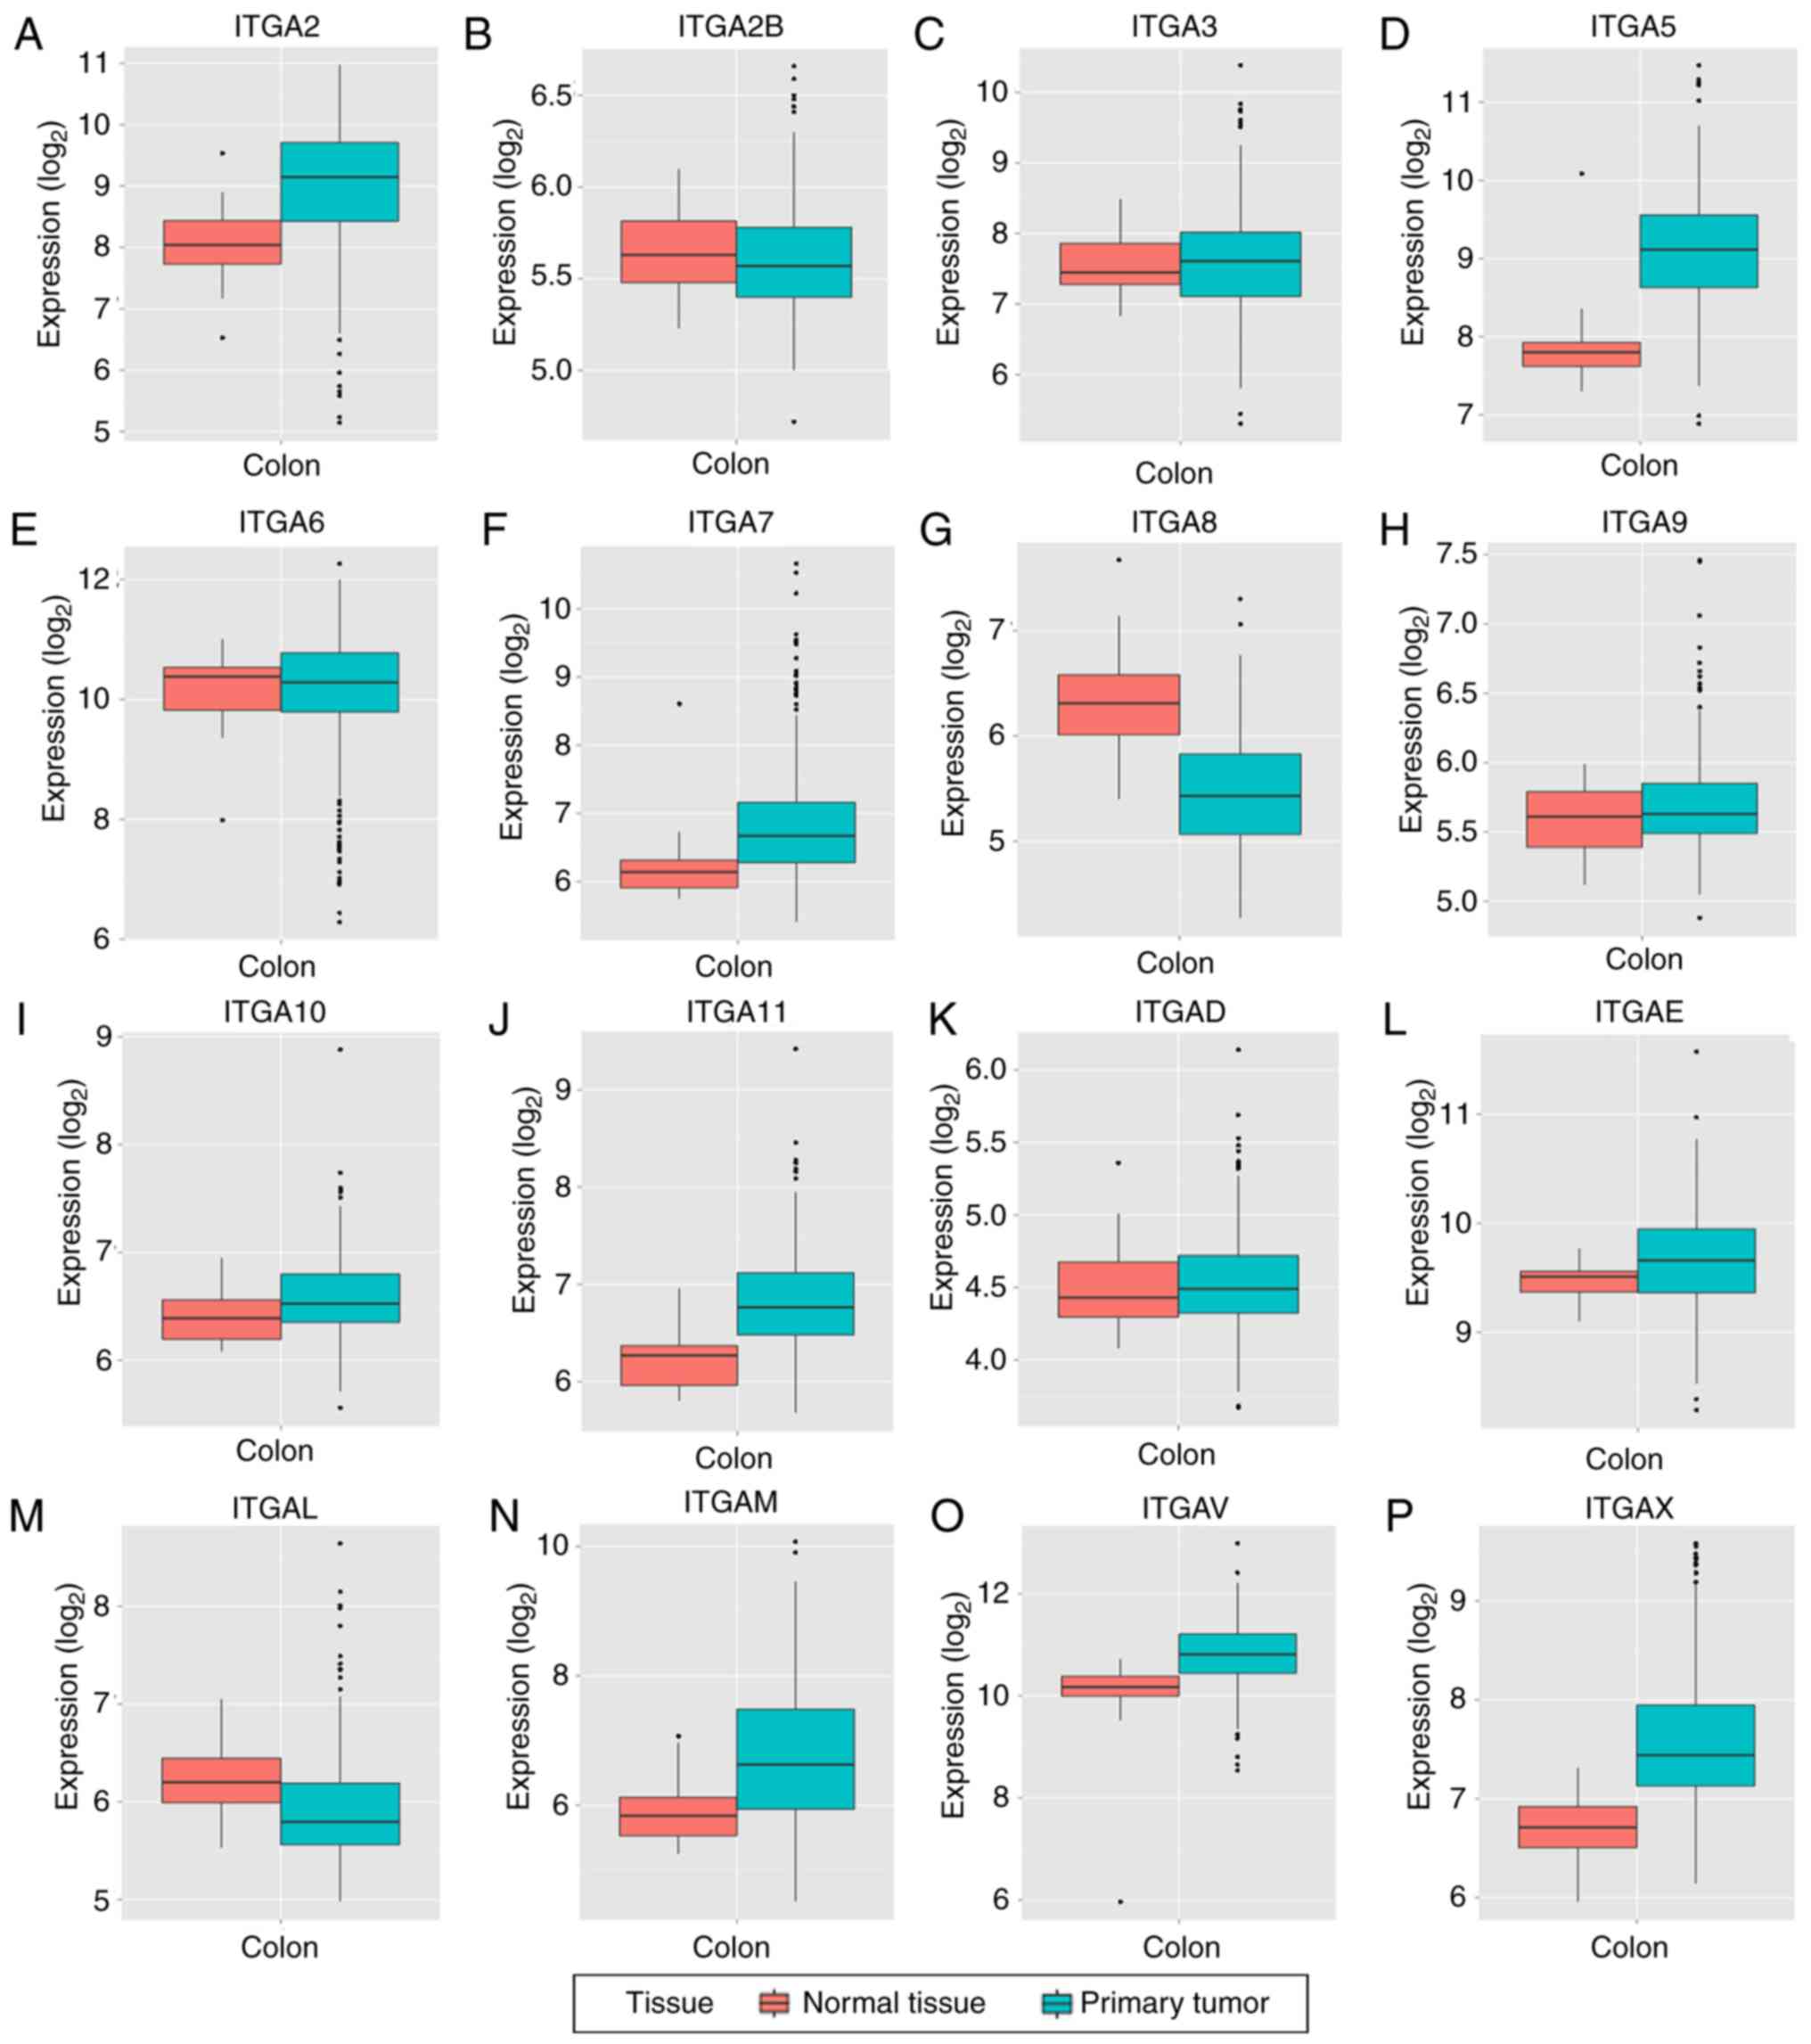
Box plots of the expression levels of 16 genes are
presented in Fig. 3 (ITGA1 and
ITGA4 are not presented). ITGA2B, ITGA6, ITGA8 and
ITGAL were high in expression in adjacent normal tissues
compared to tumor tissues, while the other 12 genes were high in
tumor tissues compared to normal tissues.
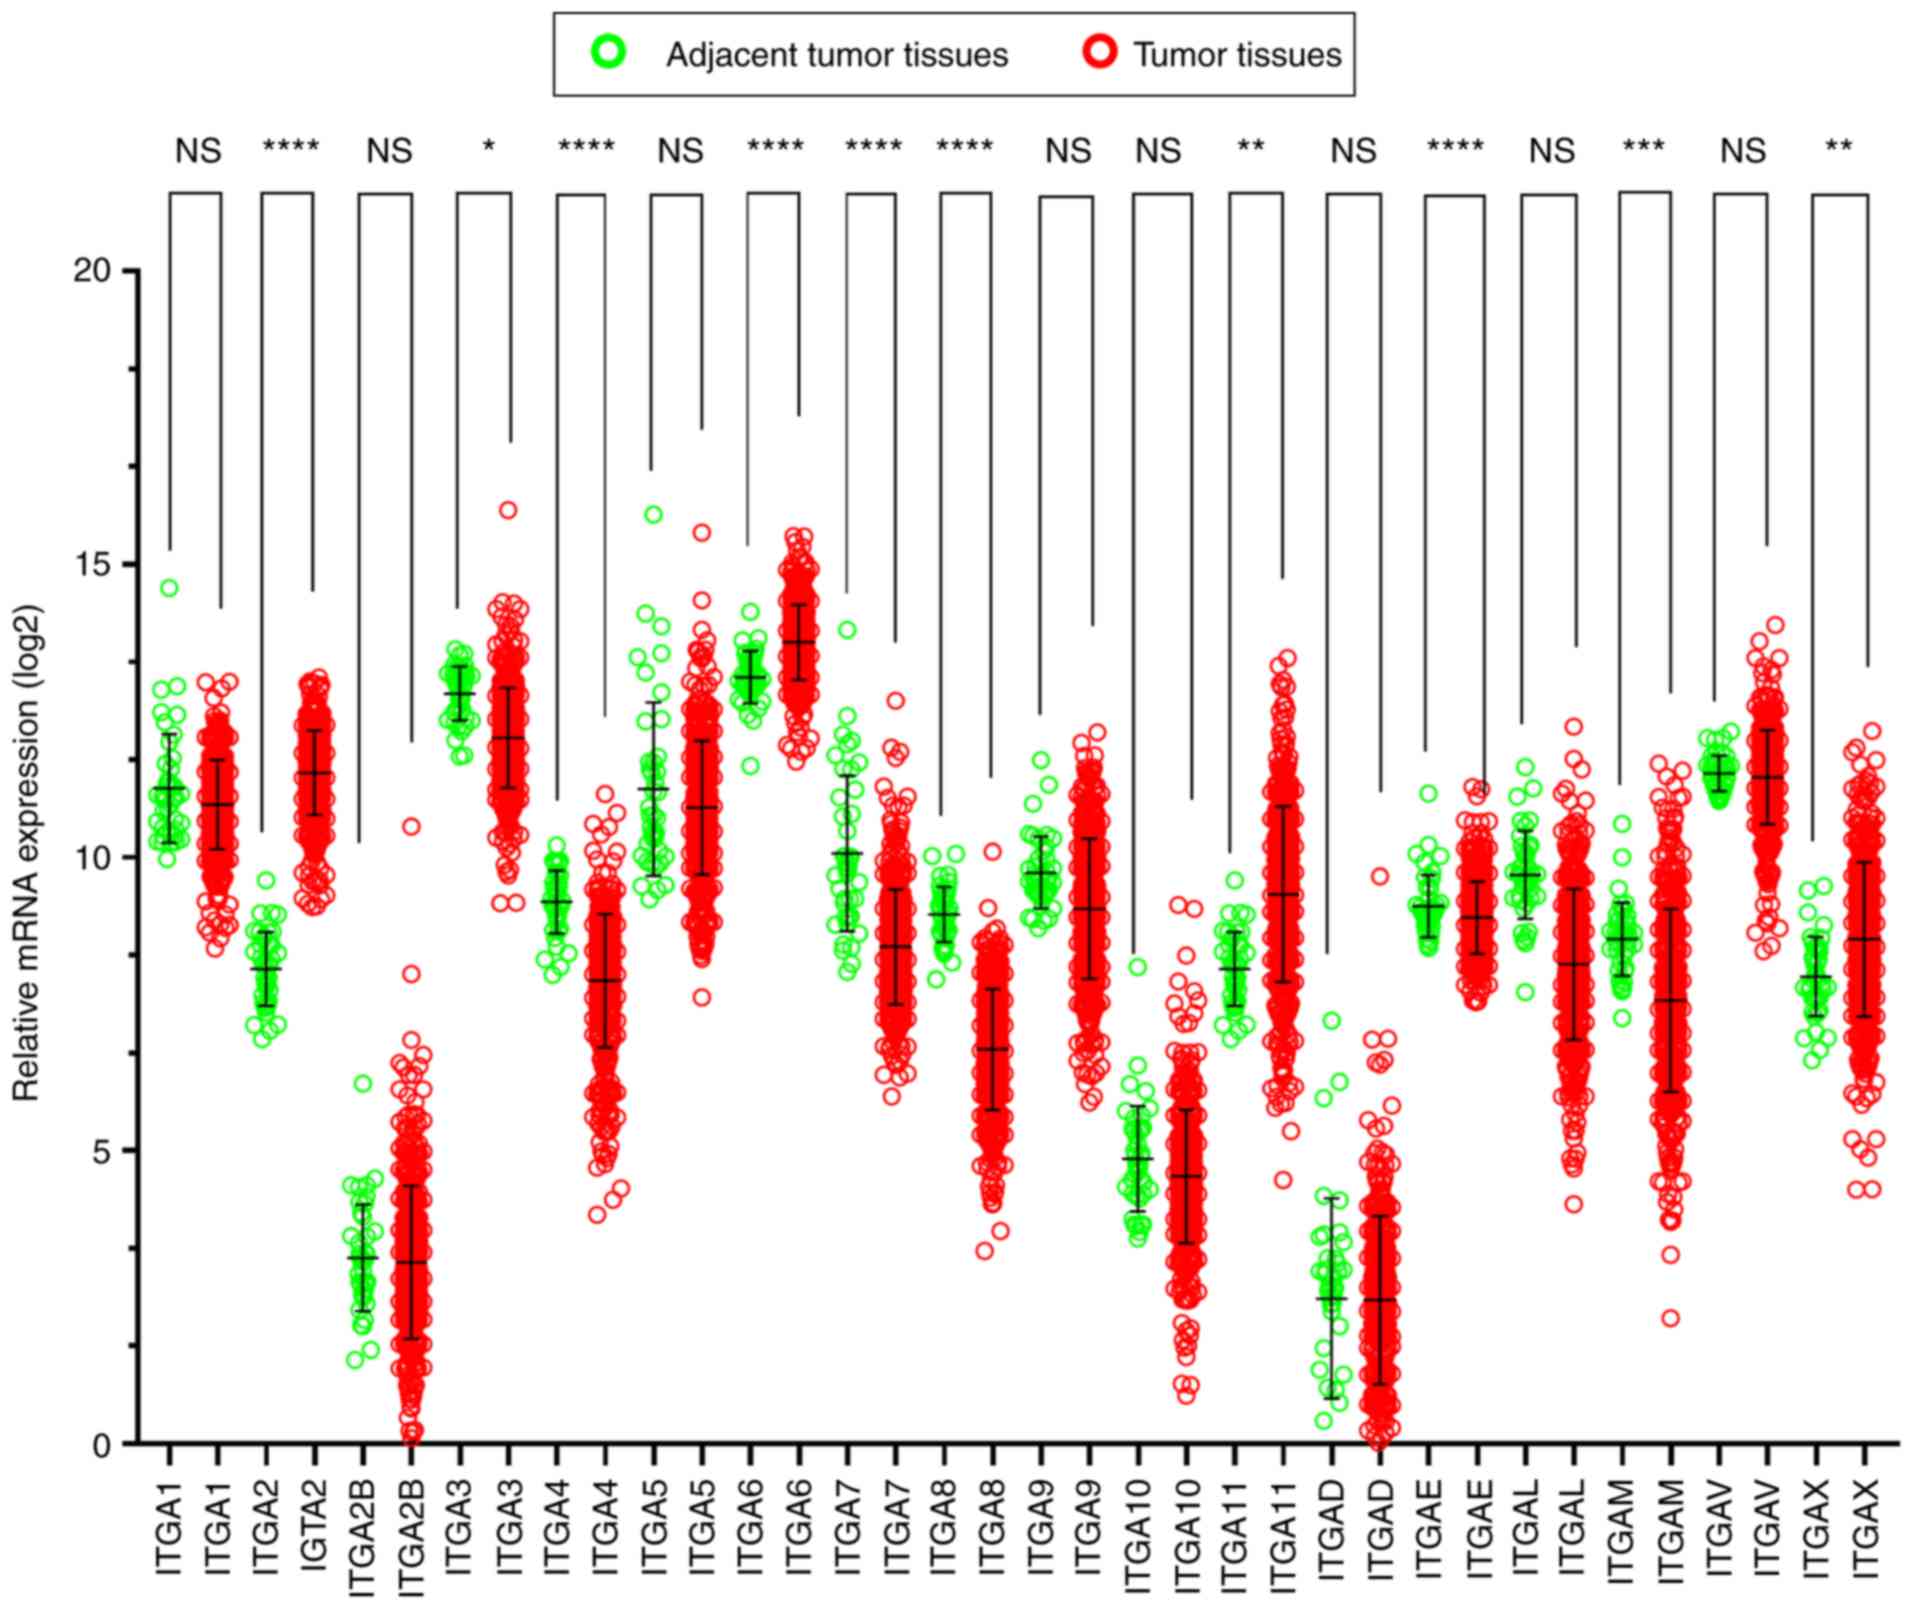
The scatter diagrams were used to present the
expression between the tumor and adjacent tissues (Fig. 4) and the results revealed that
ITGA2B, ITGA5, ITGA10, ITGAD, ITGAE and ITGAV
exhibited no statistical significant differences, however the other
genes significantly differed). It was also observed that the
majority of genes were expressed at a significantly low level in
tumor tissues, while the expression of adjacent normal tissues was
high.
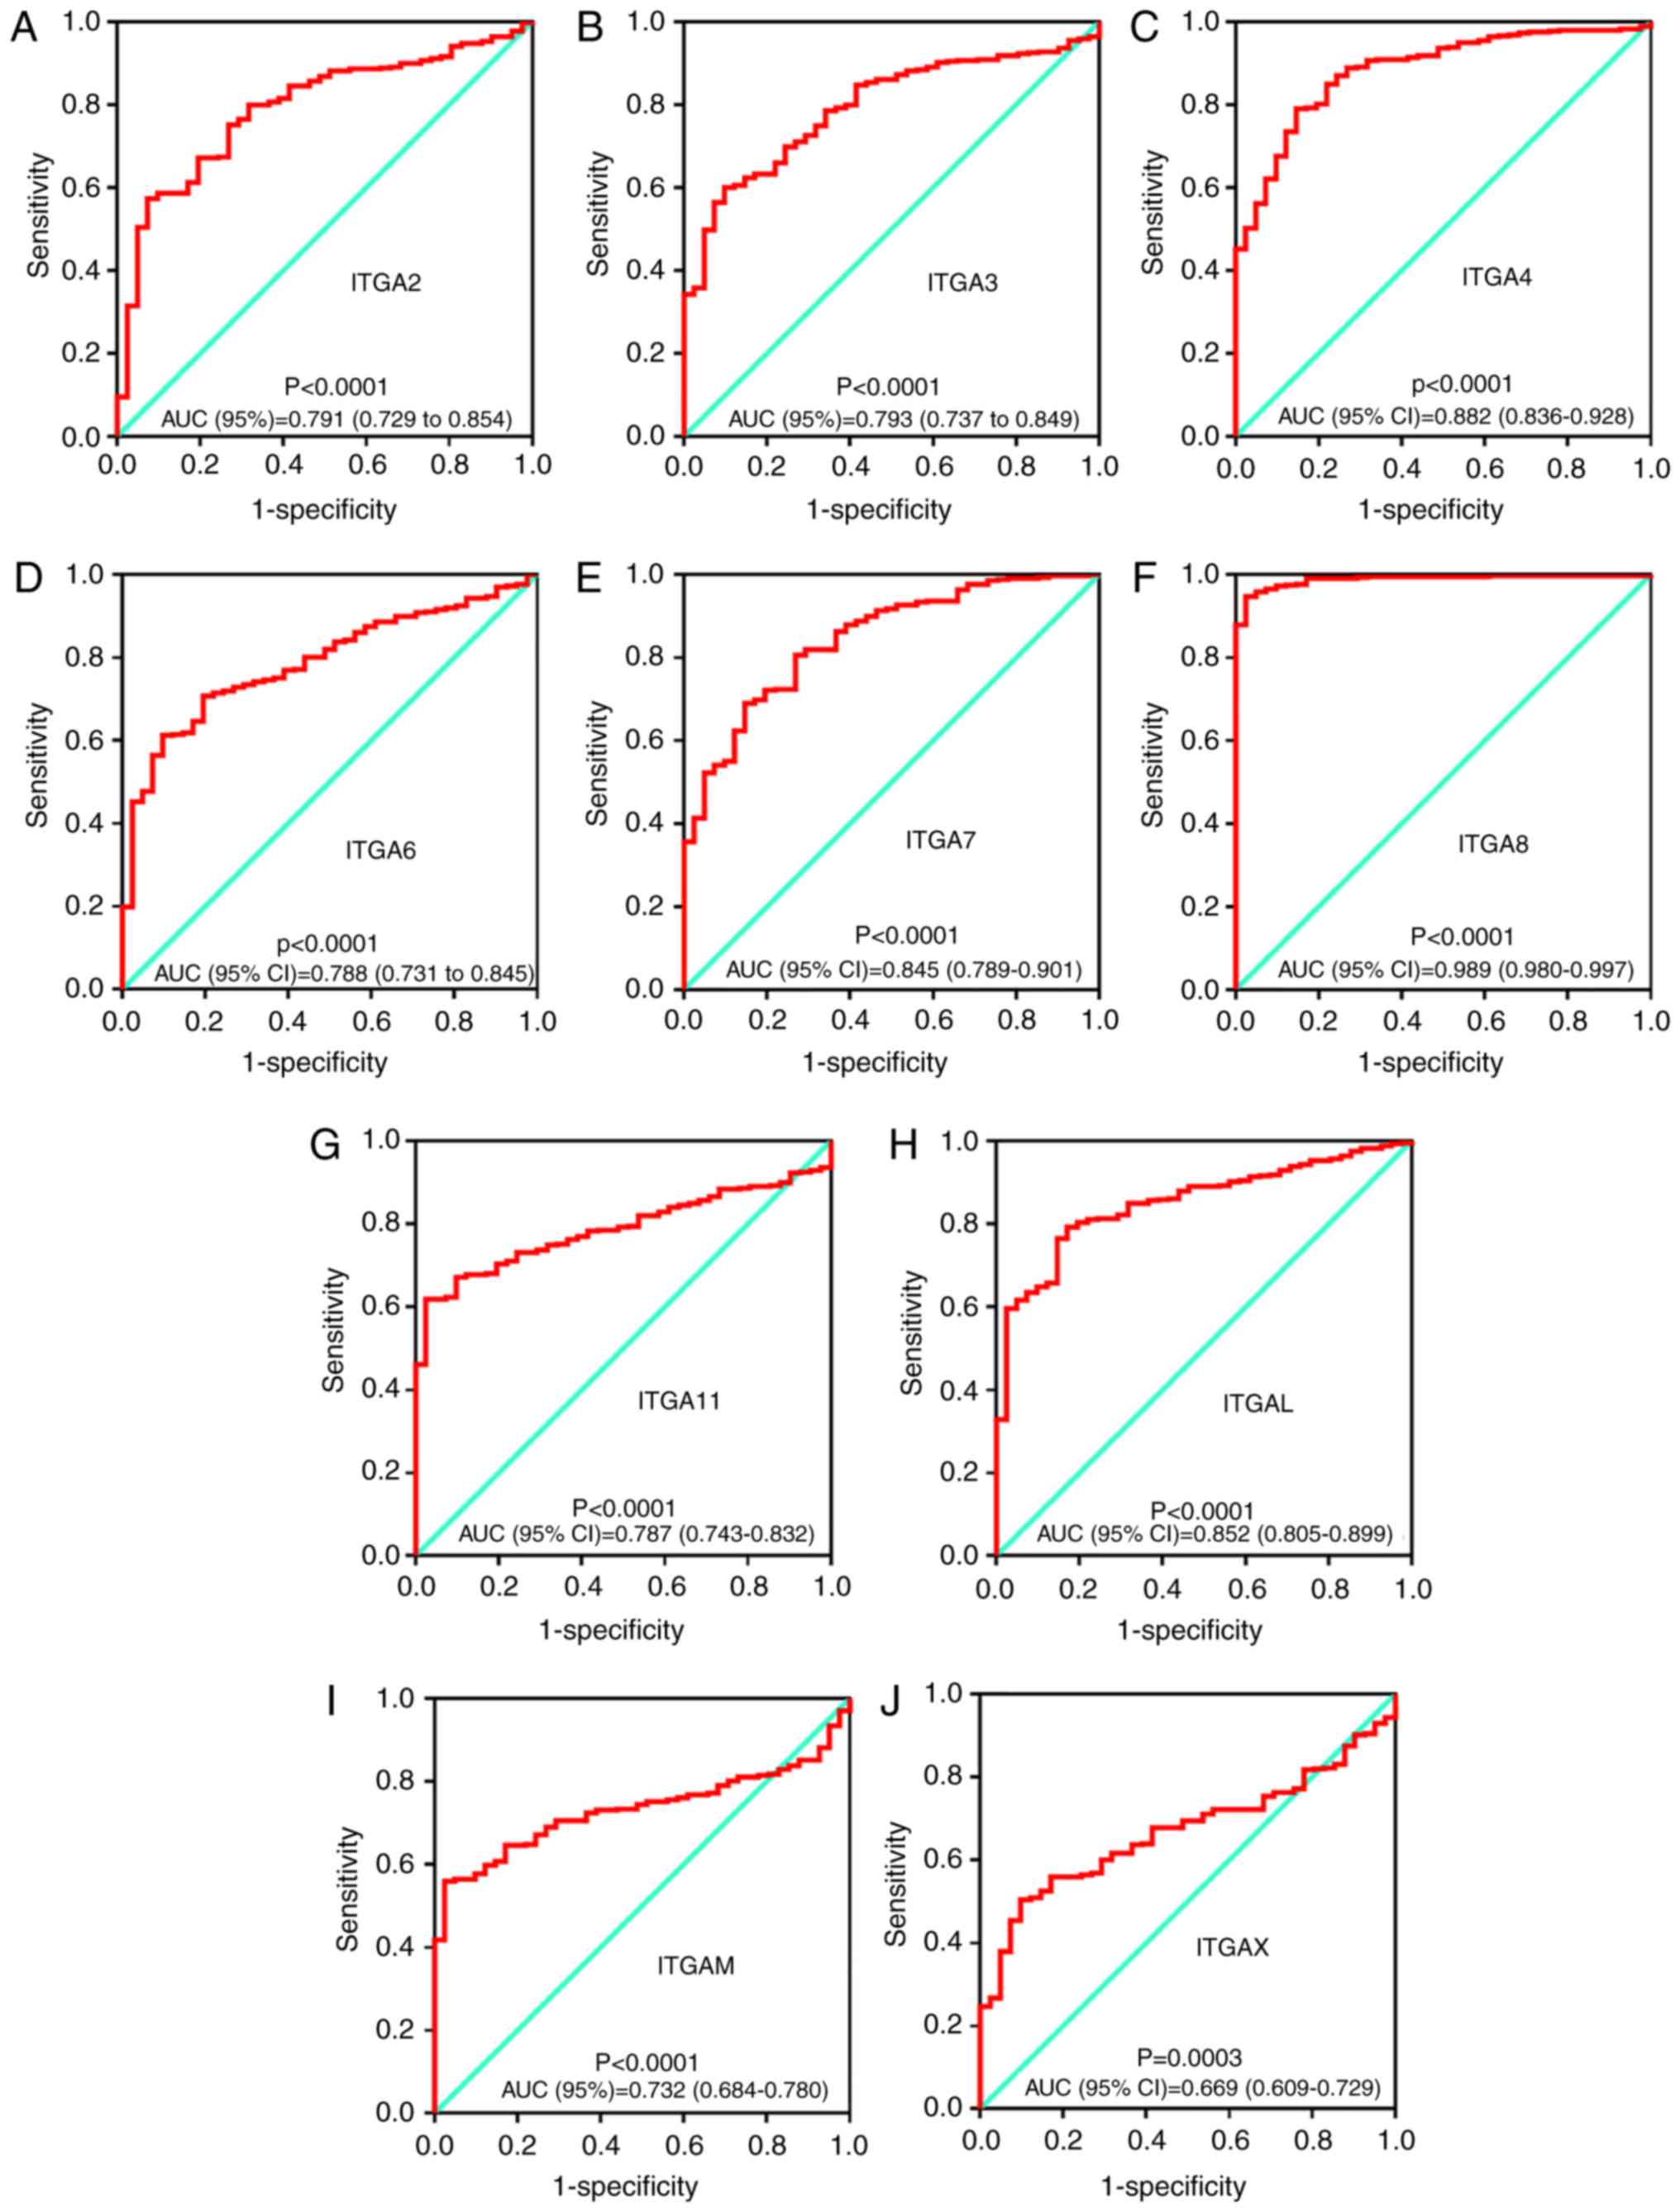
The possible potential application of ITGA
genes in COAD tumor and adjacent tissues was further explored. The
diagnostic ROC analysis of ITGA genes in the TCGA COAD
cohort showed that ITGA2, ITGA3, ITGA4, ITGA6, ITGA7, ITGA8,
ITGA11, ITGAL, ITGAM and ITGAX can serve as potential
diagnostic biomarker for COAD (all P<0.05). Notably,
ITGA8 [AUC (95% CI)=0.989 (0.980–0.997)] exhibited a high
diagnostic value distinguishing tumor tissues and adjacent normal
tissues of COAD (P<0.0001). All ROC curves are presented in
Fig. 5.
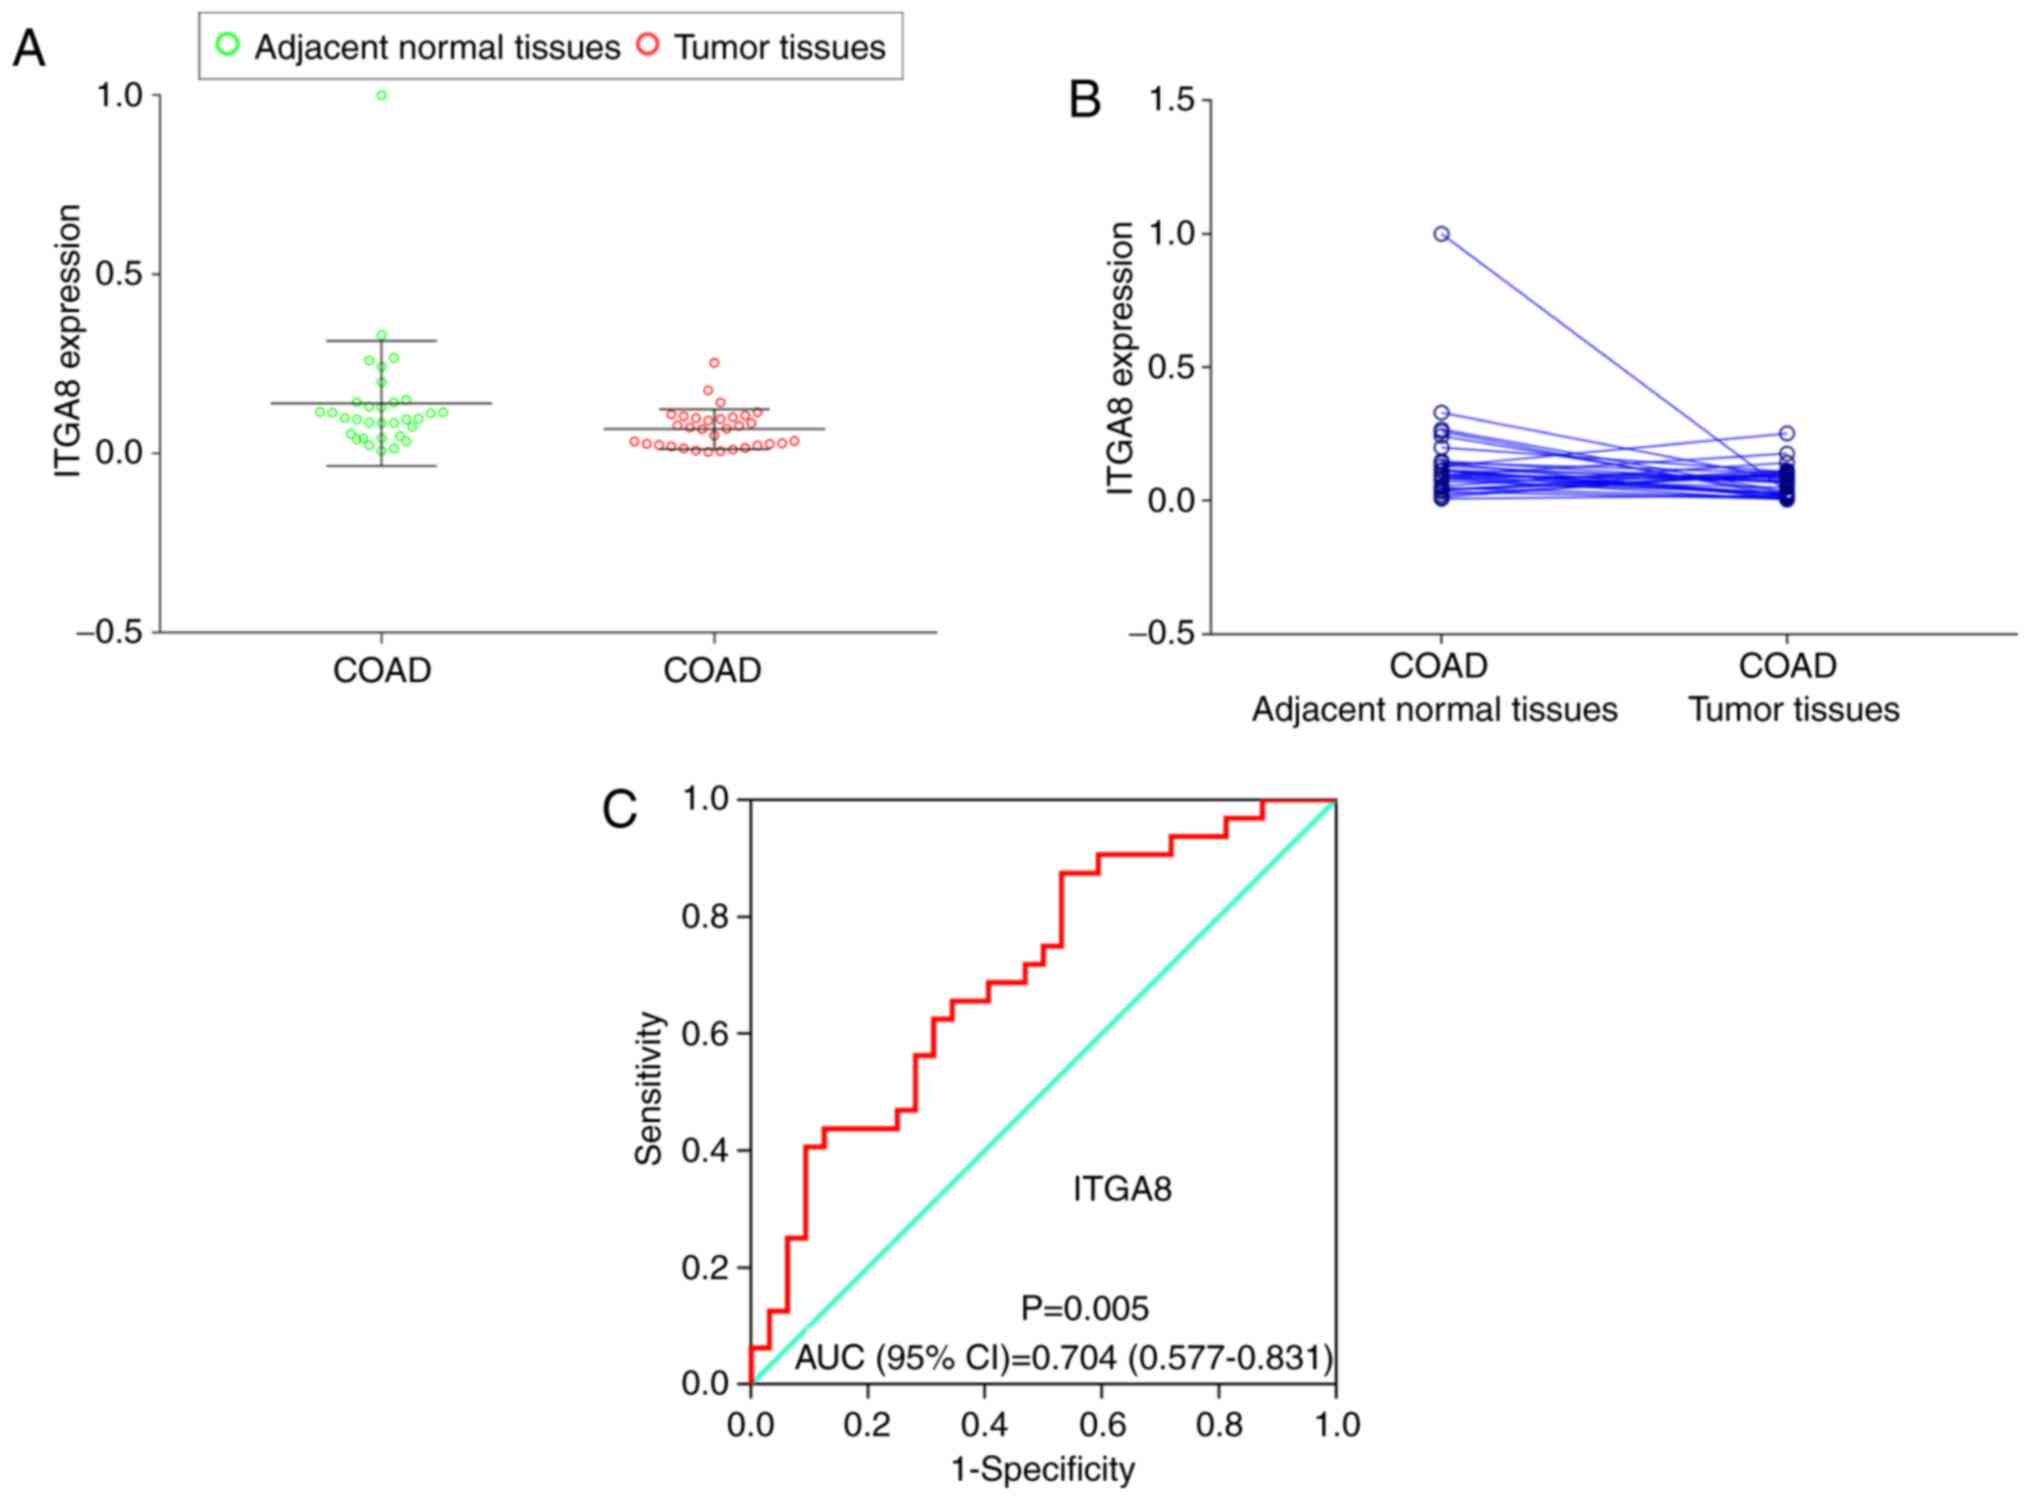
Validation of ITGA8 expression in
clinical samples
To investigate and further validate the possible
function of ITGA8 expression in the clinical sample cohort,
the paired t-test was performed between COAD tumors and adjacent
normal tissues (P=0.041), and a scatter diagram was selected to
compare the expression levels of the clinical sample cohort and
TCGA cohort (Fig. 6A and B). The
results indicated that both cohorts exhibited a significantly high
expression level in adjacent normal tissues. Then, the diagnostic
ROC curve was used to study the underlying role of ITGA8 in
clinical samples. The result revealed that ITGA8 had a
significant value [P=0.005, AUC (95% CI)=0.704 (0.577–0.831)];
(Fig. 6C).
Prognostic survival analysis
To further explore the survival values, survival
analysis curves were drawn according to gene expression (Fig. 7). Only ITGA5 and ITGA10
exhibited statistical significance (P<0.05). Consequently, it
was observed that a high level of ITGA5 and ITGA10
expression were linked with poor prognosis for OS (log-rank test,
P=0.0045 and P=0.0244).
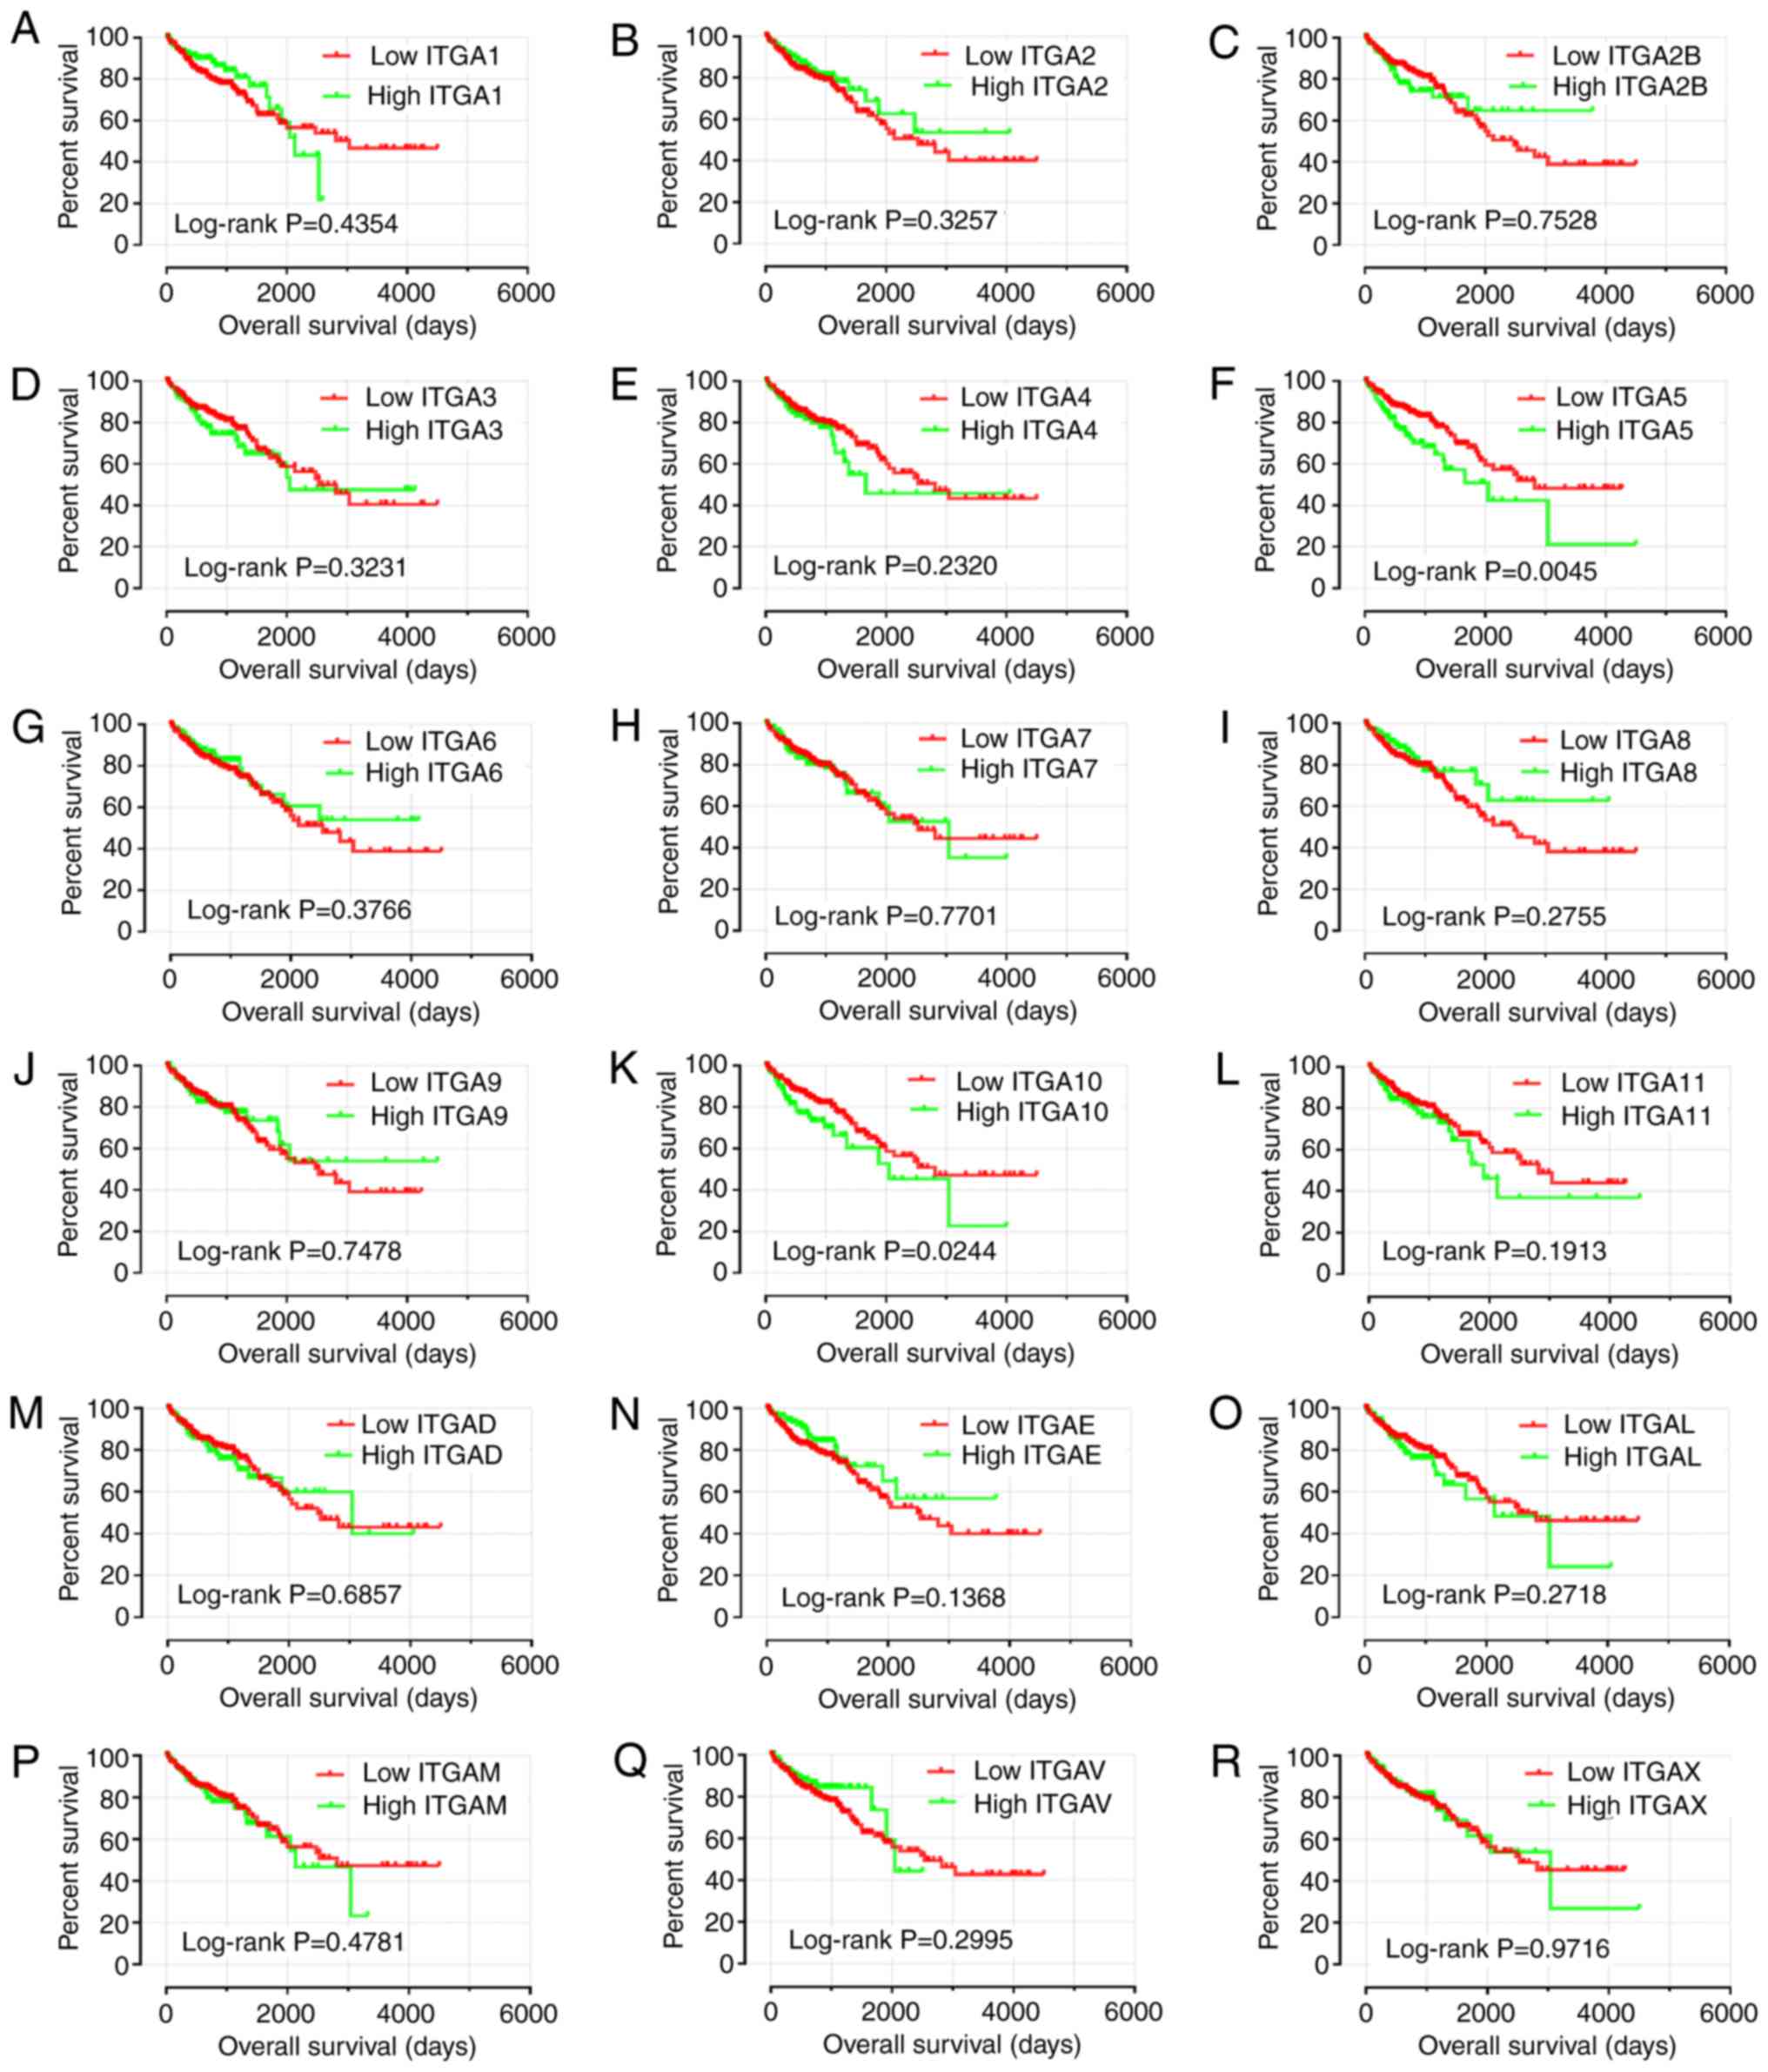 | Figure 7.Kaplan-Meier survival curves for ITGA
genes in COAD of TCGA cohort. OS stratified by (A) ITGA1,
(B) ITGA2, (C) ITGA2B, (D) ITGA3, (E)
ITGA4, (F) ITGA5, (G) ITGA6, (H) ITGA7,
(I) ITGA8, (J) ITGA9, (K) ITGA10, (L)
ITGA11, (M) ITGAD, (N) ITGAE, (O)
ITGAL, (P) ITGAM, (Q) ITGAV, and (R)
ITGAX. ITGA, integrin α; COAD, colon adenocarcinoma;
TCGA, The Cancer Genome Atlas; OS, overall survival. |
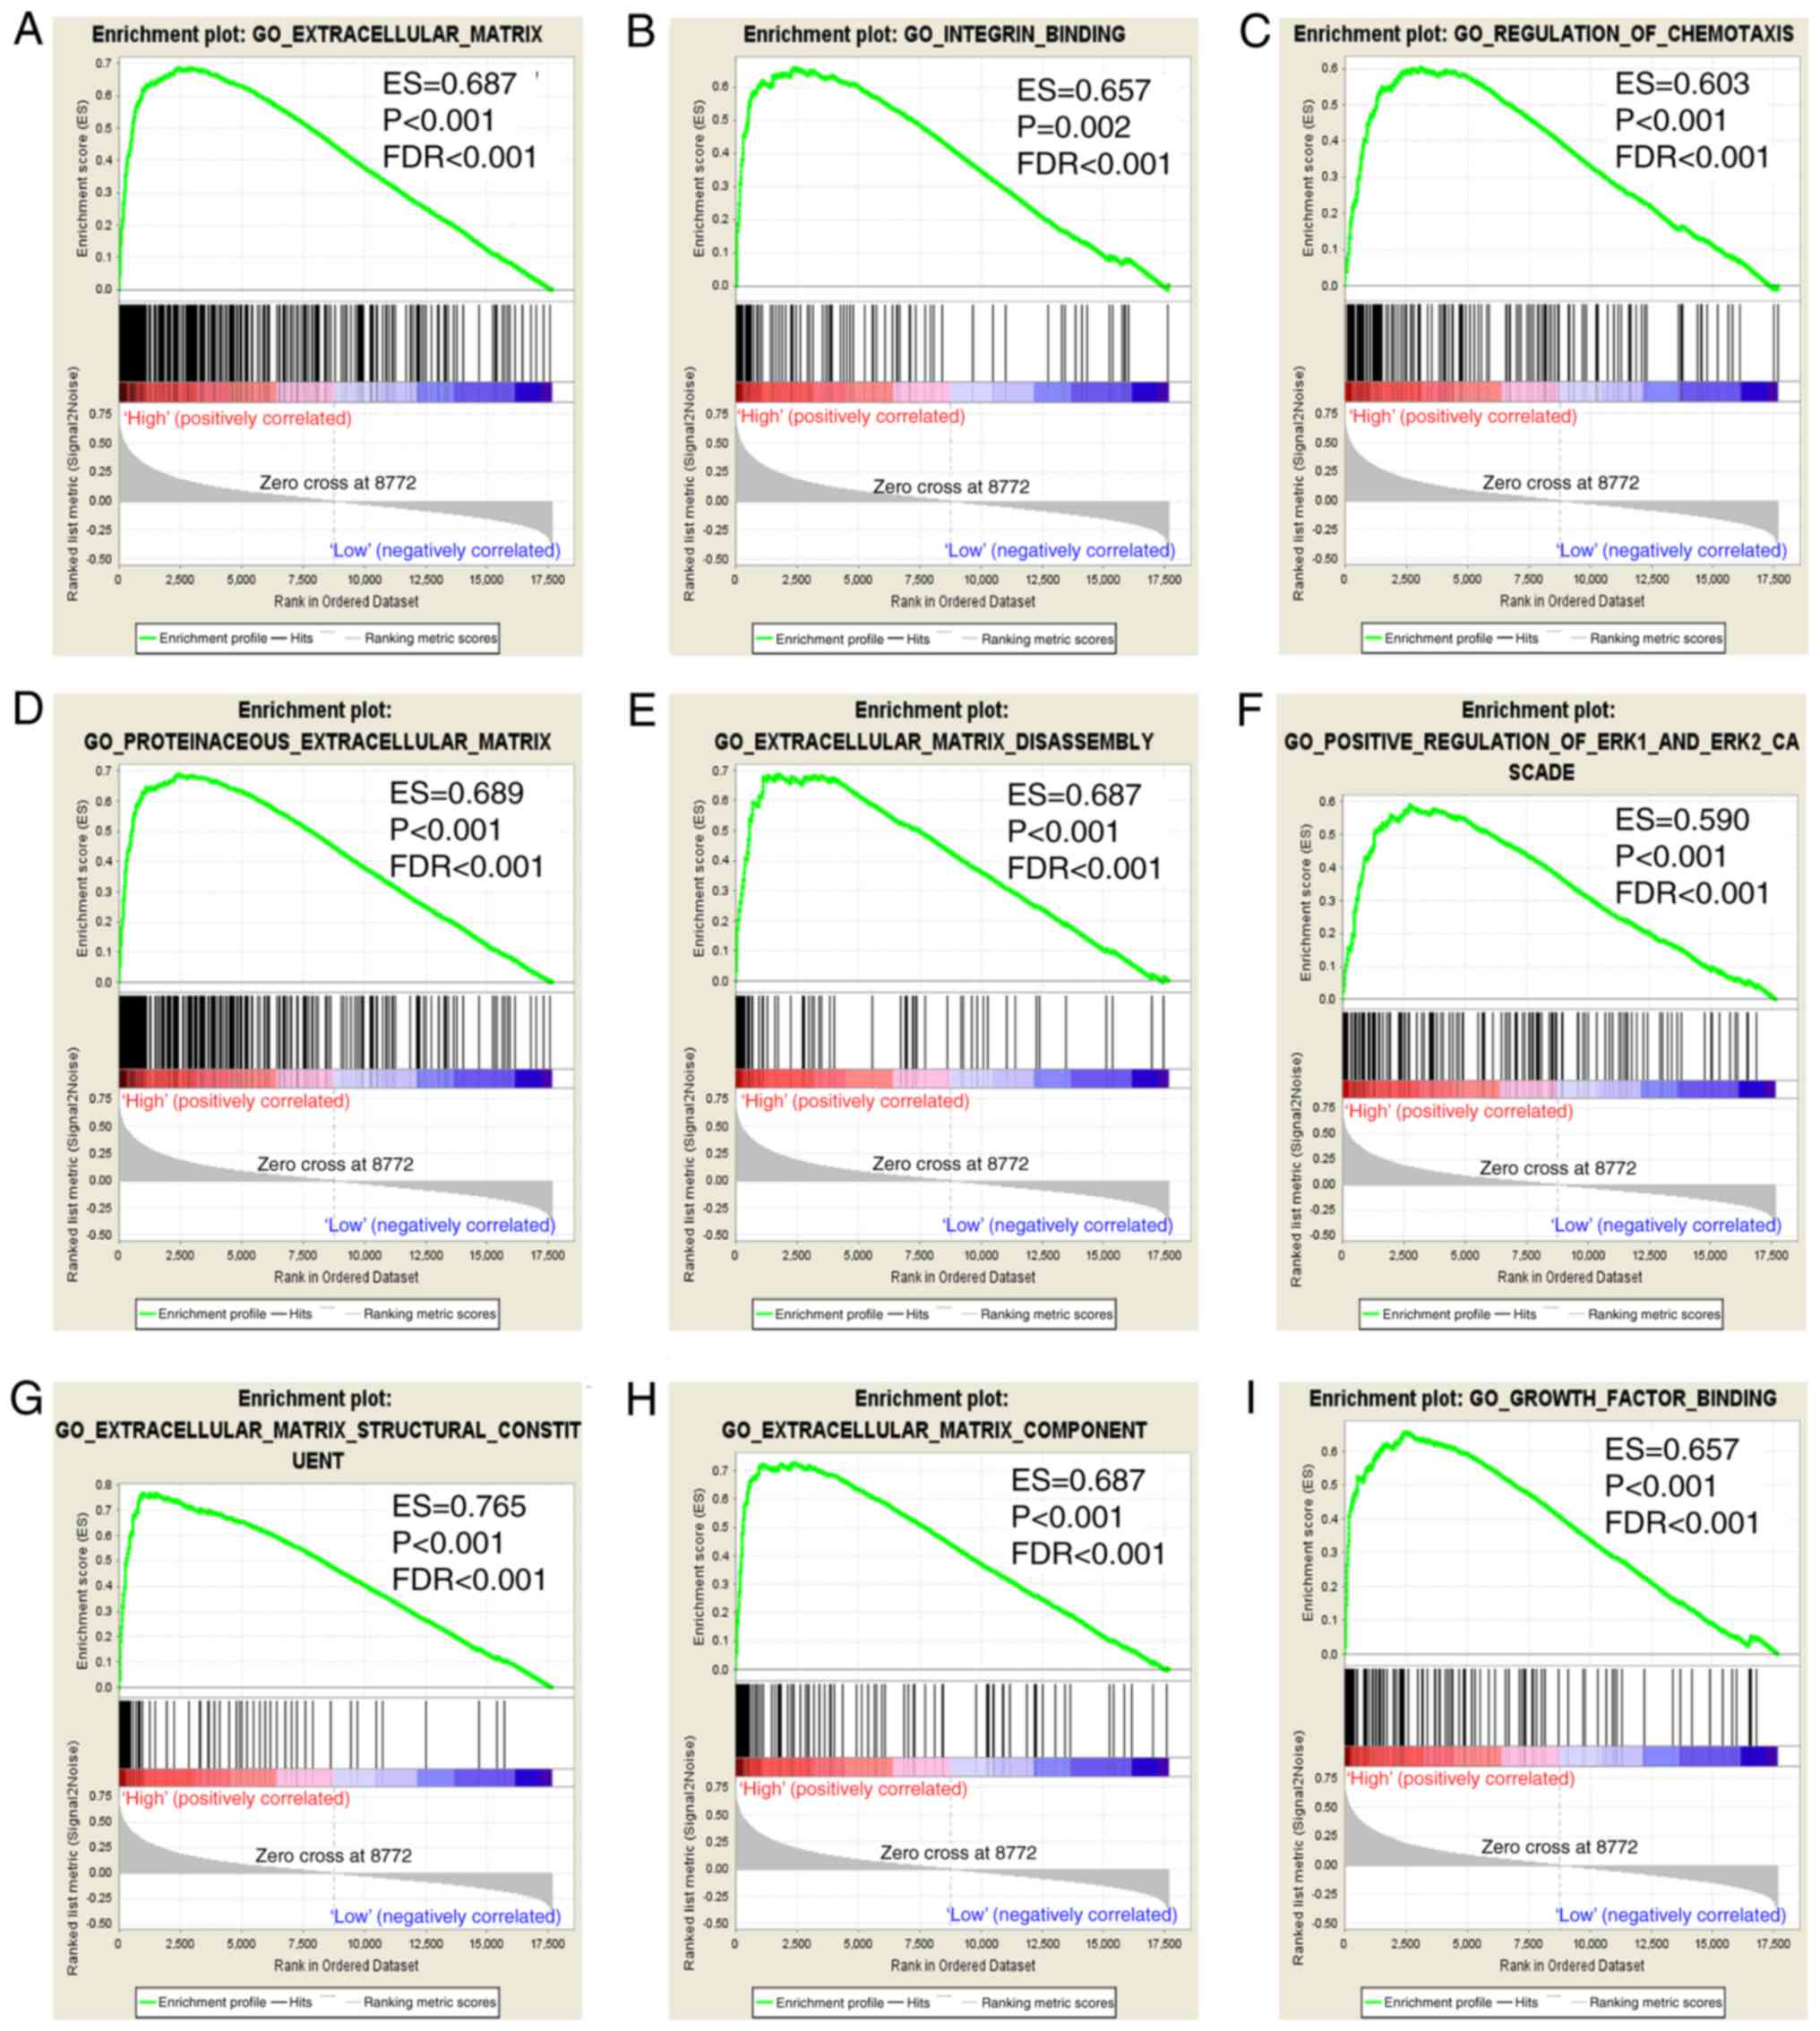
GSEA
In the present study, prognostic value of
ITGA5 was assessed to investigate its potential in GO terms
and KEGG pathways in COAD prognosis. GSEA revealed that the c5 gene
sets indicated that the high expression of ITGA5 may be
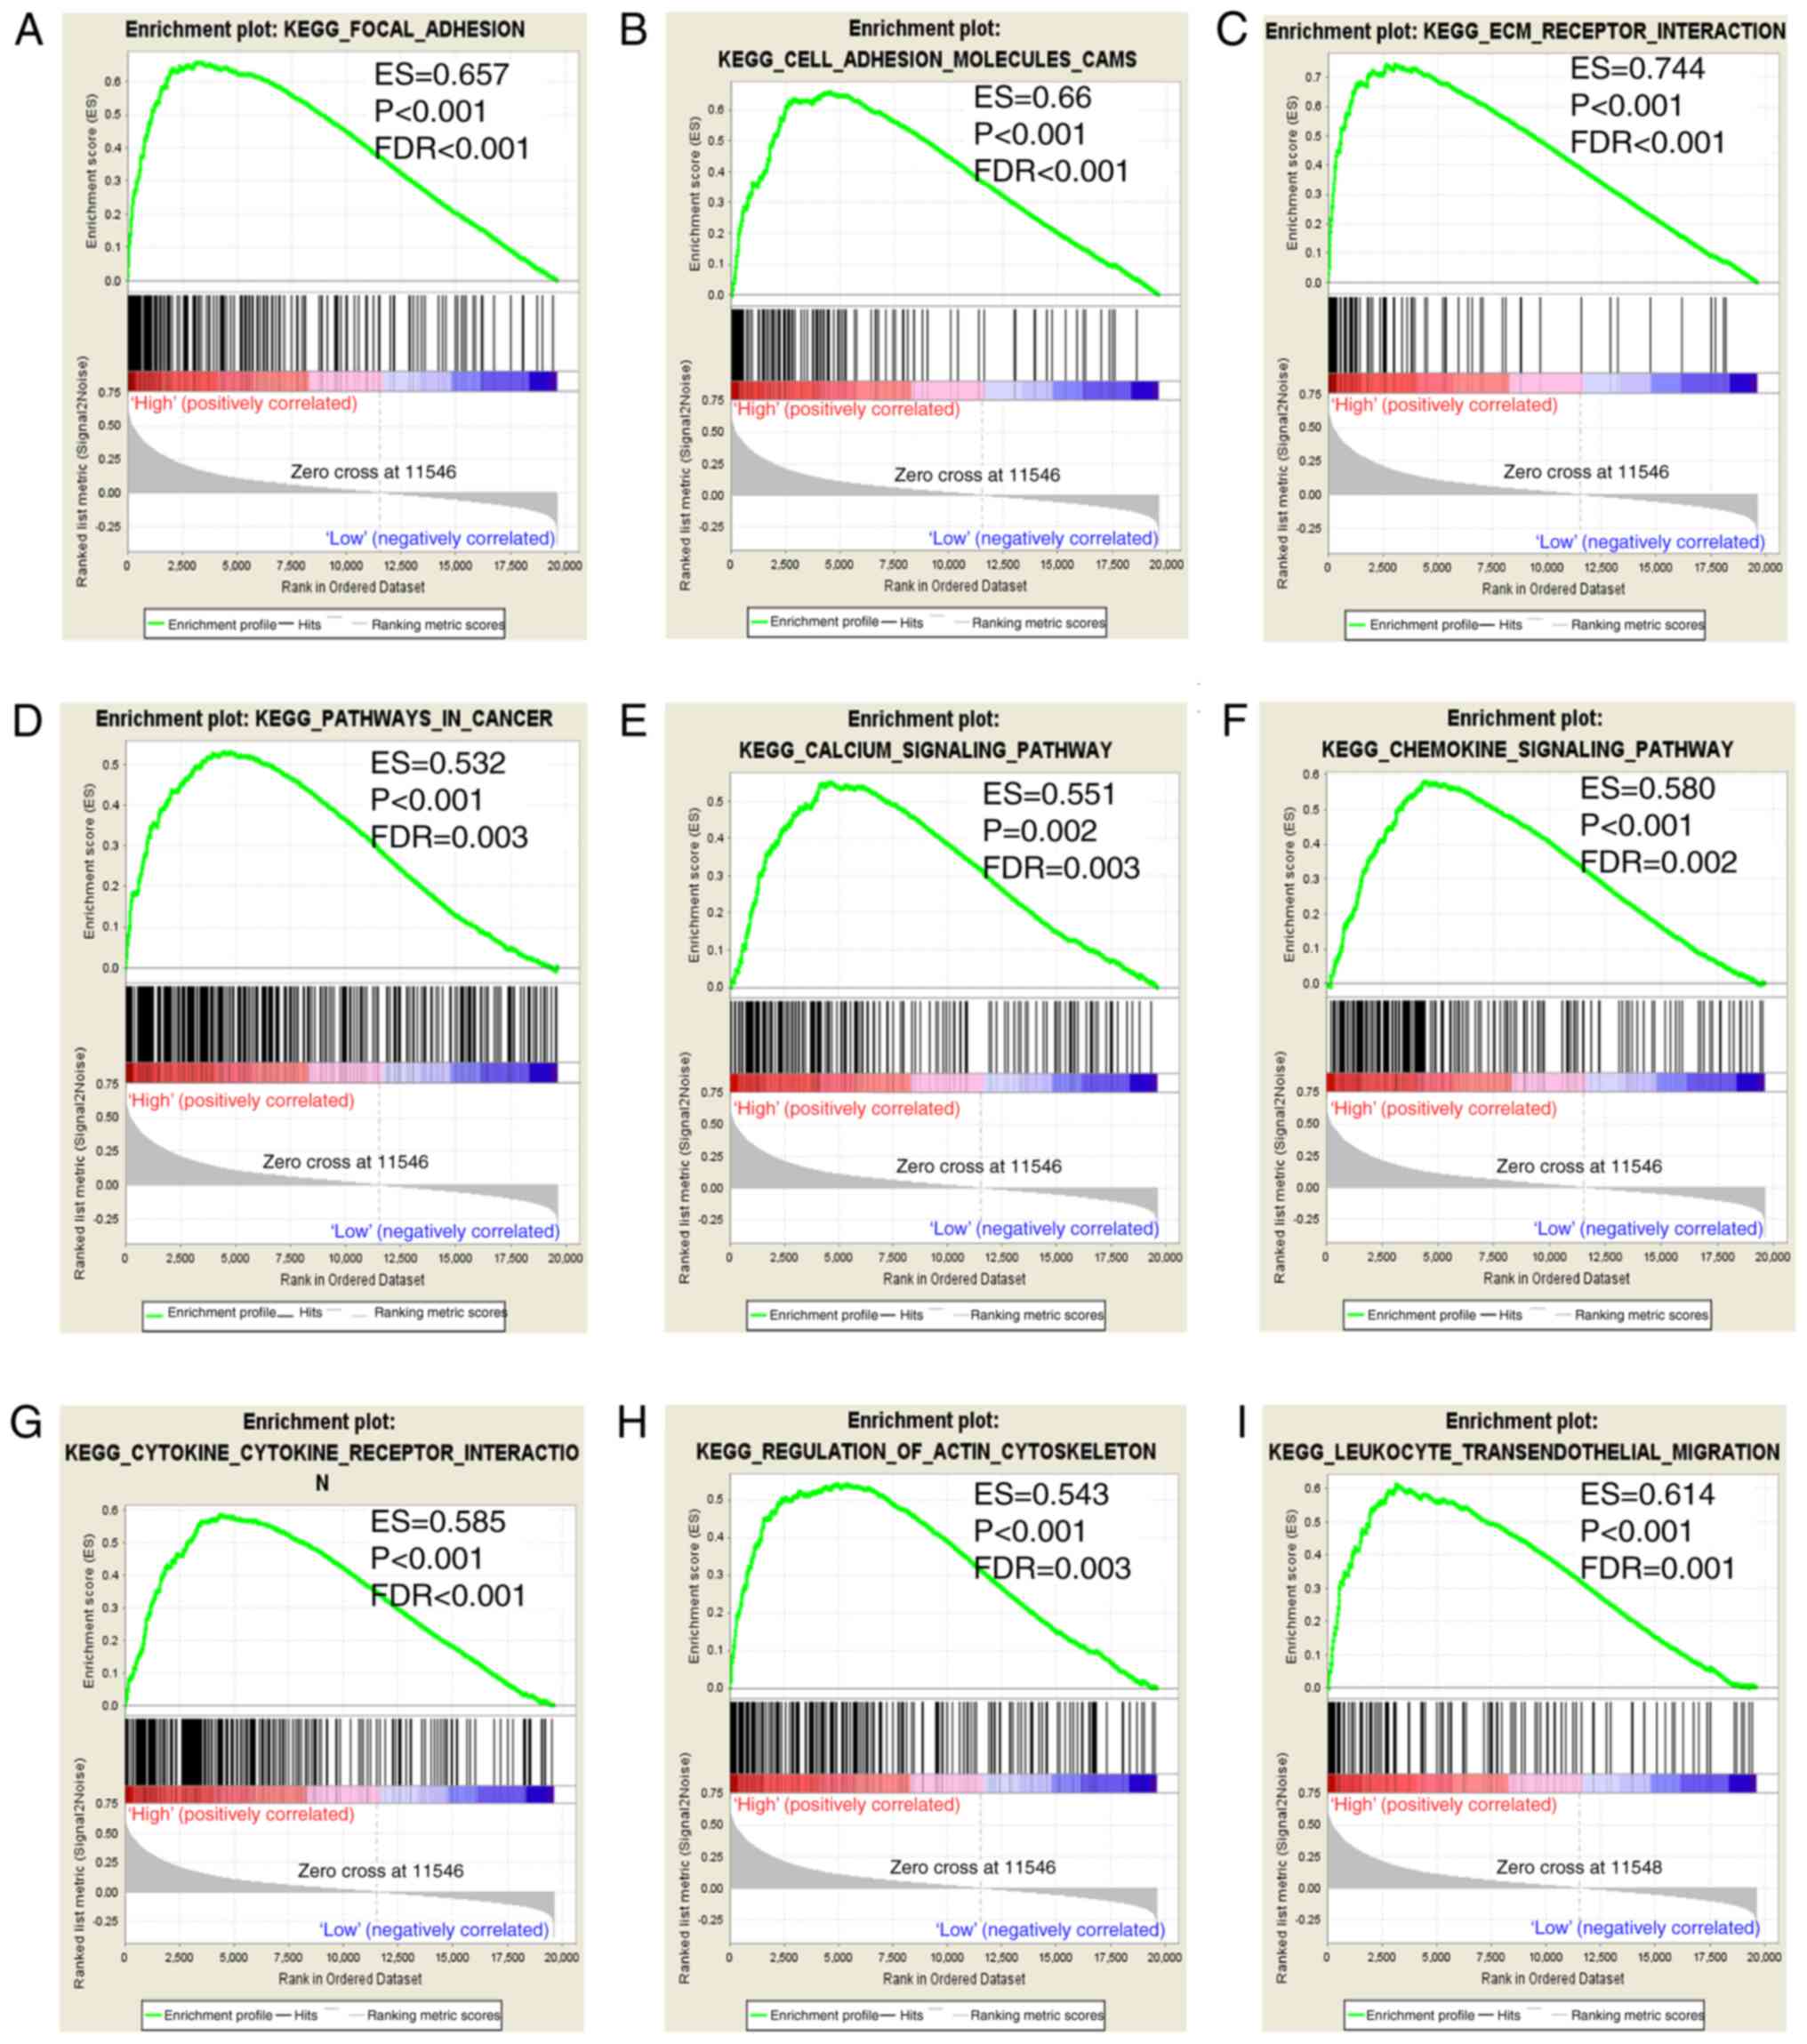
mostly enriched in ECM (Fig. 8A-I).
In addition, the c2 gene sets were significantly involved in focal
adhesion, the chemokine signaling pathway, pathways in cancer and
ECM receptor interaction (Fig.
9A-I).
Discussion
As is recognized, the occurrence and development of
tumors are caused by multiple factors, and the homeostasis of the
internal environment is crucial. Integrins are a family of cell
adhesion proteins that can mediate cell-cell, cell-extracellular
matrix (ECM), cell-pathogen interactions and signaling through
adhesion receptors (7,12,44,45). The
integrins are the main receptors for extracellular matrix proteins
like collagen, fibronectin and laminin. In addition, integrins play
a fundamental role in various biological processes via cellular
adhesion mechanisms (10,46). The ITGA family is a subfamily
of integrins, and certain previous studies had reported the
relationship between the ITGA subfamily genes and colorectal
cancer. Yang et al reported that ITGA2 was
significantly overexpressed in both primary colon tumors and liver
metastases with tissues from 43 patients as was determined by
western blotting, immunohistochemistry and tissue microarray
(47). The expression of ITGA3
was linked to other genes by cDNA Array and immunohistochemistry in
colorectal cancer. It was revealed that ITGA3 was
overexpressed in tumor tissues. In a study by Waisberg et
al, the expression of ITGAV was assessed by PCR and
immunohistochemistry in adult CRC patients (n=114), and the results
indicated that the overexpression of ITGAV was associated
with higher progression and spread of CRC (48). ITGA subfamily genes have also
been reported in other types of cancer. ITGA1 was recently
revealed to be associated with an invasive metastatic phenotype in
hepatocellular and prostate cancers (49,50). Other
studies revealed that ITGA2 was expressed in gastric cancer
(51), pancreatic cancer (52) and pancreatic ductal adenocarcinoma
(PDAC) (53). In addition,
ITGA10 was expressed in B-cell lymphoma (54) and ITGA11 was expressed in
breast cancer (55), lung squamous
cancer (56) and neck squamous cell
carcinoma (57).
However, there is little knowledge about the
relationship between the ITGA subfamily genes and COAD. To
the best of our knowledge, this was the first time that TCGA RNA
sequencing dataset and PCR detection were used to investigate
diagnostic and prognostic values of ITGA subfamily genes in
COAD. The present results indicated that the mRNA expression levels
of the ITGA subfamily genes were correlative with COAD in
diagnosis and prognosis. Gene function enrichment analysis revealed
that ITGA genes were significantly involved in biological
processes, pathways of cell adhesion and the integrin-mediated
signaling pathway. In addition, co-expression analysis revealed
that ITGA genes were co-expressed with each other at both
the gene and protein levels.
It was determined that ITGA2, ITGA6, ITGA11
and ITGAX were significantly expressed at a high level in
cancer tissues, while ITGA1, ITGA3, ITGA4, ITGA7, ITGA8, ITGA9,
ITGAL and ITGAM were significantly expressed at a high
level in adjacent normal tissues in a TCGA cohort. The results of
ROC curves revealed that ITGA8 had a high diagnostic value
[AUC (95% CI)=0.989 (0.980–0.997)]. Kok-Sin et al reported
that ITAGA8 was considered as a potential diagnostic marker,
serving as a tumor suppressor gene as determined via DNA
methylation and gene expression profiling assays, in colorectal
cancer (58). In a study by Yang
et al, the ITGA8 mRNA and protein levels were
assessed in 483 LUAD tissues and 59 adjacent tissues, and the
results indicated that the expression of ITGA8 was
downregulated in LUAD (59). Then, to
further validate the expression of the ITGA8 gene in cancer
and adjacent tissues of COAD, RT-qPCR was performed, and the
results revealed that ITGA8 was significantly expressed at a
high level in adjacent normal tissues of COAD. Thus, it was
hypothesized that ITGA8 may be a potential diagnostic marker
in COAD.
Survival prognosis analysis results revealed that
the high expression levels of ITGA5 and ITGA10 were
associated with poor prognosis, while Kaplan-Meier curves from
multivariate survival analysis revealed that the low expression of
ITGA5 was linked to favorable prognosis of COAD OS in the
TCGA cohort. Especially ITGA5 was an independent prognosis
factor for OS of COAD patients. However, previous studies revealed
that overexpression of ITGA5 indicated poor prognosis. A
study by Shang et al revealed that low expression of
ITGA5 indicated a good overall survival (OS) or relapse-free
survival (RFS) of HBV-related HCC patients (60). Research by Haider et al
revealed that high expression of ITGA5 was associated with a
short survival time of pancreatic ductal adenocarcinoma (PDAC)
patients (61). In addition, the
results from a study by Yan et al indicated that the
upregulated expression of ITGA5 reduced the overall survival
of gastric cancer (GC) patients (62). Similar results were also reported in
non-small cell lung cancer (NSCLC) (63) and glioblastoma cell invasion (64).
The results of GSEA in the present study indicated
that ITGA5 (also known as FNRA, CD49e, VLA-5 and
VLA5A) was markedly associated with the survival and
progression of COAD, and the underlying mechanism of focal
adhesion, ECM receptor interaction and extracellular matrix (ECM)
were associated with its biological functions. Integrin α subunit
and β subunit form heterodimeric integral membrane proteins that
function in cell surface adhesion and signaling (16). Previous studies have reported that
ITGA5 mediated cell adhesion and migration in human
hepatocarcinoma cells by activating focal adhesion kinase (FAK)
(65). A study by Yang and Wang
revealed that ITGA5 participated in pathways involving focal
adhesion and ECM-receptor interaction in osteosarcoma (66). In addition, ITGA5 may be
involved in bladder cancer progression by extracellular
matrix-receptor interaction and focal adhesion (67). In the present study, the results of
GSEA indicated that ITGA5 may serve as an important adhesion
molecule through its adhesion mechanism in COAD. To be specific,
ITGA5 may act on COAD via the FAK signaling pathway and ECM
receptor signaling pathway. However, these results require further
research to be confirmed.
Although the present study was the first to reveal
the role of the ITGA subfamily in the diagnosis and
prognosis of COAD, it still has certain limitations. First, all the
information was obtained from open databases, and the medical
parameters were incomplete. Other potential influencing factors
like tumor location, tumor size, lymphatic metastasis, and venous
metastasis were not included. Second, disease-free survival should
be listed as a factor to assess COAD prognosis. Third, the study
required a larger multi-center and multi-regional as well as a
multi-ethnic sample population. Fourth, the present study required
further investigation at the protein level and COAD prognosis
prediction, as well as further in vivo and in vitro
experimental validation.
In conclusion, the present study revealed that the
ITGA subfamily mRNA expression was associated with the
diagnosis and prognosis of COAD. Combined with ROC curves and
RT-qPCR verification, the ITGA8 expression level may be a
potential diagnostic marker of COAD. In addition, survival analysis
indicated that the expression of ITGA5 may serve as a
prognostic biomarker of COAD. However, the present results still
require further exploration and verification in the future.
Supplementary Material
Supporting Data
Acknowledgements
The authors would like to acknowledge the support of
the National Key Clinical Specialty Programs (General Surgery and
Oncology) and the Key Laboratory of Early Prevention and Treatment
for Regional High-Incidence-Tumor (Guangxi Medical University),
Ministry of Education, China. We would also like to thank The
Cancer Genome Atlas (https://cancergenome.nih.gov/) for sharing the COAD
dataset on open access.
Funding
The present study was sponsored in part by the 2018
Innovation Project of Guangxi Graduate Education (YCBZ2018036) and
the Innovation Project of Guangxi Graduate Education
(JGY2018037).
Availability of data and materials
The analyzed datasets generated during the study are
available from The Cancer Genome Atlas (https://portal.gdc.cancer.gov/).
Authors' contributions
YZG and GTR wrote the manuscript. YZG and FG made
substantial contributions to the conception, design and
intellectual content of the studies. YZG, GTR, XWL, XKW, CL and SW
made key contributions to the analysis and interpretation of data.
All authors read and approved the final manuscript and agree to be
accountable for all aspects of the research in ensuring that the
accuracy or integrity of any part of the work are appropriately
investigated and resolved.
Ethics approval and consent to
participate
All patients signed an informed consent form, and
the experimental protocol was approved by the Ethics Committee of
the First Affiliated Hospital of Guangxi Medical University [no.
2019(KY-E-001)].
Patient consent for publication
Not applicable.
Competing interests
The authors declare that they have no competing
interests.
References
|
1
|
Bray F, Ferlay J, Soerjomataram I, Siegel
RL, Torre LA and Jemal A: Global cancer statistics 2018: GLOBOCAN
estimates of incidence and mortality worldwide for 36 cancers in
185 countries. CA Cancer J Clin. 68:394–424. 2018. View Article : Google Scholar : PubMed/NCBI
|
|
2
|
Zhang Z, Qian W, Wang S, Ji D, Wang Q, Li
J, Peng W, Gu J, Hu T, Ji B, et al: Analysis of lncRNA-Associated
ceRNA network reveals potential lncRNA biomarkers in human colon
adenocarcinoma. Cell Physiol Biochem. 49:1778–1791. 2018.
View Article : Google Scholar : PubMed/NCBI
|
|
3
|
Thrumurthy SG, Thrumurthy SS, Gilbert CE,
Ross P and Haji A: Colorectal adenocarcinoma: Risks, prevention and
diagnosis. BMJ. 354:i35902016. View Article : Google Scholar : PubMed/NCBI
|
|
4
|
Jiang H, Du J, Gu J, Jin L, Pu Y and Fei
B: A 65 gene signature for prognostic prediction in colon
adenocarcinoma. Int J Mol Med. 41:2021–2027. 2018.PubMed/NCBI
|
|
5
|
Yang Y, Li XJ, Li P and Guo XT:
MicroRNA-145 regulates the proliferation, migration and invasion of
human primary colon adenocarcinoma cells by targeting MAPK1. Int J
Mol Med. 42:3171–3180. 2018.PubMed/NCBI
|
|
6
|
Tsukuda K, Tanino M, Soga H, Shimizu N and
Shimizu K: A novel activating mutation of the K-ras gene in human
primary colon adenocarcinoma. Biochem Biophys Res Commun.
278:653–658. 2000. View Article : Google Scholar : PubMed/NCBI
|
|
7
|
Arnaout MA: Integrin structure: New twists
and turns in dynamic cell adhesion. Immunol Rev. 186:125–140. 2002.
View Article : Google Scholar : PubMed/NCBI
|
|
8
|
Tadokoro S, Shattil SJ, Eto K, Tai V,
Liddington RC, de Pereda JM, Ginsberg MH and Calderwood DA: Talin
binding to integrin beta tails: A final common step in integrin
activation. Science. 302:103–106. 2003. View Article : Google Scholar : PubMed/NCBI
|
|
9
|
Ginsberg MH, Partridge A and Shattil SJ:
Integrin regulation. Curr Opin Cell Biol. 17:509–516. 2005.
View Article : Google Scholar : PubMed/NCBI
|
|
10
|
Takada Y, Ye X and Simon S: The integrins.
Genome Biol. 8:2152007. View Article : Google Scholar : PubMed/NCBI
|
|
11
|
Campbell ID and Humphries MJ: Integrin
structure, activation, and interactions. Cold Spring Harb Perspect
Biol. 3:a0049942011. View Article : Google Scholar : PubMed/NCBI
|
|
12
|
Hynes RO: Integrins: Bidirectional,
allosteric signaling machines. Cell. 110:673–687. 2002. View Article : Google Scholar : PubMed/NCBI
|
|
13
|
Larson RS, Corbi AL, Berman L and Springer
T: Primary structure of the leukocyte function-associated
molecule-1 alpha subunit: An integrin with an embedded domain
defining a protein superfamily. J Cell Biol. 108:703–712. 1989.
View Article : Google Scholar : PubMed/NCBI
|
|
14
|
Humphries JD, Byron A and Humphries MJ:
Integrin ligands at a glance. J Cell Sci. 119:3901–3903. 2006.
View Article : Google Scholar : PubMed/NCBI
|
|
15
|
Oxvig C and Springer TA: Experimental
support for a beta-propeller domain in integrin alpha-subunits and
a calcium binding site on its lower surface. Proc Natl Acad Sci
USA. 95:4870–4875. 1998. View Article : Google Scholar : PubMed/NCBI
|
|
16
|
Desgrosellier JS and Cheresh DA: Integrins
in cancer: Biological implications and therapeutic opportunities.
Nat Rev Cancer. 10:9–22. 2010. View Article : Google Scholar : PubMed/NCBI
|
|
17
|
Goodman SL and Picard M: Integrins as
therapeutic targets. Trends Pharmacol Sci. 33:405–412. 2012.
View Article : Google Scholar : PubMed/NCBI
|
|
18
|
Shattil SJ, Kim C and Ginsberg MH: The
final steps of integrin activation: The end game. Nat Rev Mol Cell
Biol. 11:288–300. 2010. View Article : Google Scholar : PubMed/NCBI
|
|
19
|
Moser M, Nieswandt B, Ussar S, Pozgajova M
and Fassler R: Kindlin-3 is essential for integrin activation and
platelet aggregation. Nat Med. 14:325–330. 2008. View Article : Google Scholar : PubMed/NCBI
|
|
20
|
Shen B, Delaney MK and Du X: Inside-out,
outside-in, and inside-outside-in: G protein signaling in
integrin-mediated cell adhesion, spreading, and retraction. Curr
Opin Cell Biol. 24:600–606. 2012. View Article : Google Scholar : PubMed/NCBI
|
|
21
|
Legate KR, Wickstrom SA and Fassler R:
Genetic and cell biological analysis of integrin outside-in
signaling. Genes Dev. 23:397–418. 2009. View Article : Google Scholar : PubMed/NCBI
|
|
22
|
Schwartz MA and Ginsberg MH: Networks and
crosstalk: Integrin signalling spreads. Nat Cell Biol. 4:E65–E68.
2002. View Article : Google Scholar : PubMed/NCBI
|
|
23
|
Hehlgans S, Haase M and Cordes N:
Signalling via integrins: Implications for cell survival and
anticancer strategies. Biochim Biophys Acta. 1775:163–180.
2007.PubMed/NCBI
|
|
24
|
Ryu J, Koh Y, Park H, Kim DY, Kim DC, Byun
JM, Lee HJ and Yoon SS: Highly expressed integrin-alpha8 induces
epithelial to mesenchymal transition-like features in multiple
myeloma with early relapse. Mol Cells. 39:898–908. 2016. View Article : Google Scholar : PubMed/NCBI
|
|
25
|
Guo WH, Bian JJ, Tian GF, Lyu ZX, Gui YX
and Ye L: Expression of fermintin family homologous protein 2 in
non-small cell lung cancer and its clinical significance. Zhonghua
Bing Li Xue Za Zhi. 47:780–783. 2018.(In Chinese; Abstract
available in Chinese from the publisher). PubMed/NCBI
|
|
26
|
Haas TL, Sciuto MR, Brunetto L, Valvo C,
Signore M, Fiori ME, di Martino S, Giannetti S, Morgante L, Boe A,
et al: Integrin alpha7 is a functional marker and potential
therapeutic target in glioblastoma. Cell stem cell. 21:35–50.e9.
2017. View Article : Google Scholar : PubMed/NCBI
|
|
27
|
Gong L, Zheng Y, Liu S and Peng Z:
Fibronectin regulates the dynamic formation of ovarian cancer
multicellular aggregates and the expression of integrin receptors.
Asian Pac J Cancer Prev. 19:2493–2498. 2018.PubMed/NCBI
|
|
28
|
Chang HW, Yen CY, Chen CH, Tsai JH, Tang
JY, Chang YT, Kao YH, Wang YY, Yuan SF and Lee SY: Evaluation of
the mRNA expression levels of integrins alpha3, alpha5, beta1 and
beta6 as tumor biomarkers of oral squamous cell carcinoma. Oncol
Lett. 16:4773–4781. 2018.PubMed/NCBI
|
|
29
|
Ji J, Chen H, Liu XP, Wang YH, Luo CL,
Zhang WW, Xie W and Wang FB: A miRNA combination as promising
biomarker for hepatocellular carcinoma diagnosis: A study based on
bioinformatics analysis. J Cancer. 9:3435–3446. 2018. View Article : Google Scholar : PubMed/NCBI
|
|
30
|
Huang da W, Sherman BT and Lempicki RA:
Bioinformatics enrichment tools: Paths toward the comprehensive
functional analysis of large gene lists. Nucleic Acids Res.
37:1–13. 2009. View Article : Google Scholar
|
|
31
|
Ashburner M, Ball CA, Blake JA, Botstein
D, Butler H, Cherry JM, Davis AP, Dolinski K, Dwight SS, Eppig JT,
et al: Gene ontology: Tool for the unification of biology. The Gene
Ontology Consortium. Nat Genet. 25:25–29. 2000. View Article : Google Scholar : PubMed/NCBI
|
|
32
|
Gene Ontology Consortium, . The Gene
Ontology (GO) project in 2006. Nucleic Acids Res. 34:D322–D326.
2006. View Article : Google Scholar : PubMed/NCBI
|
|
33
|
Maere S, Heymans K and Kuiper M: BiNGO: A
cytoscape plugin to assess overrepresentation of gene ontology
categories in biological networks. Bioinformatics. 21:3448–3449.
2005. View Article : Google Scholar : PubMed/NCBI
|
|
34
|
Mostafavi S, Ray D, Warde-Farley D,
Grouios C and Morris Q: GeneMANIA: A real-time multiple association
network integration algorithm for predicting gene function. Genome
Biol. 9 (Suppl 1):S42008. View Article : Google Scholar : PubMed/NCBI
|
|
35
|
Szklarczyk D, Morris JH, Cook H, Kuhn M,
Wyder S, Simonovic M, Santos A, Doncheva NT, Roth A, Bork P, et al:
The STRING database in 2017: Quality-controlled protein-protein
association networks, made broadly accessible. Nucleic Acids Res.
45:D362–D368. 2017. View Article : Google Scholar : PubMed/NCBI
|
|
36
|
Franceschini A, Szklarczyk D, Frankild S,
Kuhn M, Simonovic M, Roth A, Lin J, Minguez P, Bork P, von Mering C
and Jensen LJ: STRING v9.1: Protein-protein interaction networks,
with increased coverage and integration. Nucleic Acids Res.
41:D808–D815. 2013. View Article : Google Scholar : PubMed/NCBI
|
|
37
|
Wang X, Yu T, Liao X, Yang C, Han C, Zhu
G, Huang K, Yu L, Qin W, Su H, et al: The prognostic value of CYP2C
subfamily genes in hepatocellular carcinoma. Cancer Med. 7:966–980.
2018. View Article : Google Scholar : PubMed/NCBI
|
|
38
|
Livak KJ and Schmittgen TD: Analysis of
relative gene expression data using real-time quantitative PCR and
the 2(-Delta Delta C(T)) method. Methods. 25:402–408. 2001.
View Article : Google Scholar : PubMed/NCBI
|
|
39
|
Subramanian A, Tamayo P, Mootha VK,
Mukherjee S, Ebert BL, Gillette MA, Paulovich A, Pomeroy SL, Golub
TR, Lander ES and Mesirov JP: Gene set enrichment analysis: A
knowledge-based approach for interpreting genome-wide expression
profiles. Proc Natl Acad Sci USA. 102:15545–15550. 2005. View Article : Google Scholar : PubMed/NCBI
|
|
40
|
Mootha VK, Lindgren CM, Eriksson KF,
Subramanian A, Sihag S, Lehar J, Puigserver P, Carlsson E,
Ridderstrale M, Laurila E, et al: PGC-1alpha-responsive genes
involved in oxidative phosphorylation are coordinately
downregulated in human diabetes. Nat Genet. 34:267–273. 2003.
View Article : Google Scholar : PubMed/NCBI
|
|
41
|
Liberzon A, Birger C, Thorvaldsdottir H,
Ghandi M, Mesirov JP and Tamayo P: The molecular signatures
database (MSigDB) hallmark gene set collection. Cell Syst.
1:417–425. 2015. View Article : Google Scholar : PubMed/NCBI
|
|
42
|
Reiner A, Yekutieli D and Benjamini Y:
Identifying differentially expressed genes using false discovery
rate controlling procedures. Bioinformatics. 19:368–375. 2003.
View Article : Google Scholar : PubMed/NCBI
|
|
43
|
Benjamini Y, Drai D, Elmer G, Kafkafi N
and Golani I: Controlling the false discovery rate in behavior
genetics research. Behav Brain Res. 125:279–284. 2001. View Article : Google Scholar : PubMed/NCBI
|
|
44
|
Caswell PT and Norman JC: Integrin
trafficking and the control of cell migration. Traffic. 7:14–21.
2006. View Article : Google Scholar : PubMed/NCBI
|
|
45
|
Xiong J, Balcioglu HE and Danen EH:
Integrin signaling in control of tumor growth and progression. Int
J Biochem Cell Biol. 45:1012–1015. 2013. View Article : Google Scholar : PubMed/NCBI
|
|
46
|
Felding-Habermann B, Mueller BM, Romerdahl
CA and Cheresh DA: Involvement of integrin alpha V gene expression
in human melanoma tumorigenicity. J Clin Invest. 89:2018–2022.
1992. View Article : Google Scholar : PubMed/NCBI
|
|
47
|
Yang Q, Bavi P, Wang JY and Roehrl MH:
Immuno-proteomic discovery of tumor tissue autoantigens identifies
olfactomedin 4, CD11b, and integrin alpha-2 as markers of
colorectal cancer with liver metastases. J Proteomics. 168:53–65.
2017. View Article : Google Scholar : PubMed/NCBI
|
|
48
|
Waisberg J, De Souza Viana L, Affonso
Junior RJ, Silva SR, Denadai MV, Margeotto FB, De Souza CS and
Matos D: Overexpression of the ITGAV gene is associated with
progression and spread of colorectal cancer. Anticancer Res.
34:5599–5607. 2014.PubMed/NCBI
|
|
49
|
Liu X, Tian H, Li H, Ge C, Zhao F, Yao M
and Li J: Derivate Isocorydine (d-ICD) suppresses migration and
invasion of hepatocellular carcinoma cell by downregulating ITGA1
expression. Int J Mol Sci. 18(pii): E5142017. View Article : Google Scholar : PubMed/NCBI
|
|
50
|
Rosenberg EE, Prudnikova TY, Zabarovsky
ER, Kashuba VI and Grigorieva EV: D-glucuronyl C5-epimerase cell
type specifically affects angiogenesis pathway in different
prostate cancer cells. Tumour Biol. 35:3237–3245. 2014. View Article : Google Scholar : PubMed/NCBI
|
|
51
|
Chuang YC, Wu HY, Lin YL, Tzou SC, Chuang
CH, Jian TY, Chen PR, Chang YC, Lin CH, Huang TH, et al: Blockade
of ITGA2 induces apoptosis and inhibits cell migration in gastric
cancer. Biol Proced Online. 20:102018. View Article : Google Scholar : PubMed/NCBI
|
|
52
|
Gong J, Lu X, Xu J, Xiong W, Zhang H and
Yu X: Coexpression of UCA1 and ITGA2 in pancreatic cancer cells
target the expression of miR-107 through focal adhesion pathway. J
Cell Physiol. 234:12884–12896. 2019. View Article : Google Scholar : PubMed/NCBI
|
|
53
|
Lu Y, Li C, Chen H and Zhong W:
Identification of hub genes and analysis of prognostic values in
pancreatic ductal adenocarcinoma by integrated bioinformatics
methods. Mol Biol Rep. 45:1799–1807. 2018. View Article : Google Scholar : PubMed/NCBI
|
|
54
|
Lemma SA, Kuusisto M, Haapasaari KM,
Sormunen R, Lehtinen T, Klaavuniemi T, Eray M, Jantunen E, Soini Y,
Vasala K, et al: Integrin alpha 10, CD44, PTEN, cadherin-11 and
lactoferrin expressions are potential biomarkers for selecting
patients in need of central nervous system prophylaxis in diffuse
large B-cell lymphoma. Carcinogenesis. 38:812–820. 2017. View Article : Google Scholar : PubMed/NCBI
|
|
55
|
Pan Y, Liu G, Yuan Y, Zhao J, Yang Y and
Li Y: Analysis of differential gene expression profile identifies
novel biomarkers for breast cancer. Oncotarget. 8:114613–114625.
2017. View Article : Google Scholar : PubMed/NCBI
|
|
56
|
Zhang R, Zhang TT, Zhai GQ, Guo XY, Qin Y,
Gan TQ, Zhang Y, Chen G, Mo WJ and Feng ZB: Evaluation of the
HOXA11 level in patients with lung squamous cancer and insights
into potential molecular pathways via bioinformatics analysis.
World J Surg Oncol. 16:1092018. View Article : Google Scholar : PubMed/NCBI
|
|
57
|
Parajuli H, The MT, Abrahamsen S,
Christoffersen I, Neppelberg E, Lybak S, Osman T, Johannessen AC,
Gullberg D, Skarstein K and Costea DE: Integrin alpha11 is
overexpressed by tumour stroma of head and neck squamous cell
carcinoma and correlates positively with alpha smooth muscle actin
expression. J Oral Pathol Med. 46:267–275. 2017. View Article : Google Scholar : PubMed/NCBI
|
|
58
|
Kok-Sin T, Mokhtar NM, Ali Hassan NZ,
Sagap I, Mohamed Rose I, Harun R and Jamal R: Identification of
diagnostic markers in colorectal cancer via integrative epigenomics
and genomics data. Oncol Rep. 34:22–32. 2015. View Article : Google Scholar : PubMed/NCBI
|
|
59
|
Yang X, Deng Y, He RQ, Li XJ, Ma J, Chen G
and Hu XH: Upregulation of HOXA11 during the progression of lung
adenocarcinoma detected via multiple approaches. Int J Mol Med.
42:2650–2664. 2018.PubMed/NCBI
|
|
60
|
Shang L, Ye X, Zhu G, Su H, Su Z, Chen B,
Xiao K, Li L, Peng M and Peng T: Prognostic value of integrin
variants and expression in post-operative patients with HBV-related
hepatocellular carcinoma. Oncotarget. 8:76816–76831. 2017.
View Article : Google Scholar : PubMed/NCBI
|
|
61
|
Haider S, Wang J, Nagano A, Desai A,
Arumugam P, Dumartin L, Fitzgibbon J, Hagemann T, Marshall JF,
Kocher HM, et al: A multi-gene signature predicts outcome in
patients with pancreatic ductal adenocarcinoma. Genome Med.
6:1052014. View Article : Google Scholar : PubMed/NCBI
|
|
62
|
Yan P, He Y, Xie K, Kong S and Zhao W: In
silico analyses for potential key genes associated with gastric
cancer. PeerJ. 6:e60922018. View Article : Google Scholar : PubMed/NCBI
|
|
63
|
Zheng W, Jiang C and Li R: Integrin and
gene network analysis reveals that ITGA5 and ITGB1 are prognostic
in non-small-cell lung cancer. Onco Targets Ther. 9:2317–2327.
2016. View Article : Google Scholar : PubMed/NCBI
|
|
64
|
Mallawaaratchy DM, Buckland ME, McDonald
KL, Li CC, Ly L, Sykes EK, Christopherson RI and Kaufman KL:
Membrane proteome analysis of glioblastoma cell invasion. J
Neuropathol Exp Neurol. 74:425–441. 2015. View Article : Google Scholar : PubMed/NCBI
|
|
65
|
Maschler S, Wirl G, Spring H, Bredow DV,
Sordat I, Beug H and Reichmann E: Tumor cell invasiveness
correlates with changes in integrin expression and localization.
Oncogene. 24:2032–2041. 2005. View Article : Google Scholar : PubMed/NCBI
|
|
66
|
Yang J and Wang N: Analysis of the
molecular mechanism of osteosarcoma using a bioinformatics
approach. Oncol Lett. 12:3075–3080. 2016. View Article : Google Scholar : PubMed/NCBI
|
|
67
|
Fang ZQ, Zang WD, Chen R, Ye BW, Wang XW,
Yi SH, Chen W, He F and Ye G: Gene expression profile and
enrichment pathways in different stages of bladder cancer. Genet
Mol Res. 12:1479–1489. 2013. View Article : Google Scholar : PubMed/NCBI
|