Introduction
The incidence of pancreatic cancer, primarily
pancreatic ductal adenocarcinoma (PDAC), is continuing to grow
globally (1–3). PDAC is a highly fatal disease with a
5-year survival rate of ~10% (2).
Notably, the higher mortality associated with PDAC is often
attributed to the inability to detect its presence until advanced
stages (4). In addition,
resistance to chemotherapy, invasiveness of cancer cells, and the
existence of a stromal barrier are factors contributing to the high
mortality rate of PDAC (5).
Combination chemotherapy, modified FOLFIRINOX (5-fluorouracil,
leucovorin, irinotecan and oxaliplatin), or gemcitabine plus
nab-paclitaxel is often used to treat patients with distant
metastasis (6,7). Notably, current chemotherapeutic
strategies involve a combination of conventionally used antimitotic
and genotoxic agents, which can moderately improve the survival
rate; however, severe side effects and acquired cancer cell drug
resistance contribute to poor clinical outcomes (8). Therefore, there is an urgent need to
develop more efficacious and less toxic therapeutic strategies.
PDAC is a poorly vascularized tumor embedded within
a thick desmoplastic stroma (5),
which utilizes high levels of basal autophagy and macropinocytosis
to support its metabolism and maintain tumor growth (9). Notably, KRAS is the most
frequently mutated gene in PDAC, and autophagy and macropinocytosis
are upregulated by mutant KRAS to assist PDAC survival
(10–12). Autophagy is an intracellular
catabolic pathway activated under nutrient-starved conditions to
induce the bulk turnover of cytoplasmic contents, including
proteins and organelles, via double-membrane autophagosomes
(13). Reportedly, PDAC cells
activate autophagy of pancreatic stellate cells, which comprise the
PDAC tumor stroma, and utilize them for the survival and
proliferation of PDAC cells (14).
Macropinocytosis is another nutrient acquisition pathway that
permits the internalization of extracellular fluid via large
endocytic vesicles, termed macropinosomes (15). Both autophagosomes and
macropinosomes fuse with lysosomes to digest their contents, and
the acquired nutrients are used to maintain cellular homeostasis
and tumor growth (13,15,16).
Therefore, functional lysosomes play a pivotal role in nutrient
acquisition via autophagy and macropinocytosis (16,17)
and are promising targets for developing suitable therapeutic
strategies for pancreatic cancer.
We have previously reported that fingolimod
(FTY720), a sphingosine analog and Food and Drug Administration
(FDA)-approved drug for multiple sclerosis, sensitizes non-small
cell lung cancer (NSCLC) cells to molecular-targeted drugs, such as
lapatinib and sorafenib, and induces cell cycle arrest (18). In addition, FTY720 can reportedly
modulate autophagy. Although some studies have documented the
induction of autophagy by FTY720 (19–22),
others have reported autophagy suppression (23–27).
In our previous study, we reported that FTY720 could inhibit
lysosomal function and autophagic flux in NSCLC cells (18). Additionally, FTY720 has been
reported to induce lysosomal membrane permeabilization (LMP) and
non-apoptotic death in human glioma cells (28). In the present study, the effects of
combination treatment with lapatinib and FTY720 on PDAC cells were
evaluated and the molecular mechanisms underlying these effects
were examined.
Materials and methods
Reagents
Lapatinib, FTY720, hydroxychloroquine (HCQ), U18666A
and gefitinib were purchased from Cayman Chemical Company and
dissolved in dimethyl sulfoxide (DMSO) at a concentration of 20 mM
to obtain stock solutions. Abemaciclib and z-VAD-FMK, pan-caspase
inhibitors, were purchased from AdooQ BioScience. E64d and
pepstatin A, inhibitors of lysosomal proteases, were purchased from
Peptide Institute, Inc. Necrostatin-1, a specific inhibitor of
receptor-interacting serine/threonine-protein kinase 1 (RIPK1), was
purchased from Enzo Life Sciences, Inc., and N-acetyl-L-cysteine,
staurosporine, bafilomycin A1 and Hanks' balanced salt
solution (HBSS) were obtained from FUJIFILM Wako Pure Chemical
Corporation. Hoechst 33342 was obtained from Nacalai Tesque, Inc.,
and DAPI was purchased from Sigma-Aldrich (Merck KGaA).
Antibodies
The following primary antibodies were used in the
present study: Anti-caspase-3 (CASP3; cat. no. 9662), anti-cleaved
CASP3 (cat. no. 9661), anti-poly [ADP-ribose] polymerase 1 (PARP1;
cat. no. 9542), anti-histone H2A.X (H2AX; cat. no. 7631),
anti-cathepsin B (CTSB; cat. no. 31718), anti-galectin-3 (LGALS3;
cat. no. 87985), anti-cytochrome c oxidase subunit 4 (COX IV; cat.
no. 11967), anti-calreticulin (CALR; cat. no. 12238), anti-HER2
(cat. no. 4290) and anti-phosphorylated (p)-HER2 (Tyr1221/1222;
cat. no. 2243) were procured from Cell Signaling Technologies,
Inc.; anti-lysosome-associated membrane protein 2 (LAMP2; cat. no.
sc-18822), anti-glyceraldehyde-3-phosphate dehydrogenase (GAPDH;
cat. no. sc-32233), anti-β-actin (ACTB; cat. no. sc-47778),
anti-EGFR (cat. no. sc-03) and anti-p-EGFR (Tyr1173; cat. no.
sc-101668) were from Santa Cruz Biotechnology, Inc.; anti-p-H2AX
(Ser139; cat. no. 05-636) was from Merck KGaA; and anti-trans-Golgi
network integral membrane protein 2 (TGOLN2/TGN46; cat. no.
AHP500G) was purchased from Bio-Rad Laboratories, Inc.
Cell lines and culture conditions
Human PDAC cell lines BxPC-3 (KRAS wild-type),
PANC-1 (KRAS G12D mutation) and MIA PaCa-2 (KRAS G12C mutation)
were purchased from the American Type Culture Collection. The human
embryonic cell line, 293, and HER2-positive breast cancer cell
line, BT-474, were purchased from the American Type Culture
Collection. KP-4 (KRAS G12D mutation), KP-3 (KRAS G12V mutation)
and KP-2 (KRAS G12R mutation) were obtained from the Japanese
Collection of Research Bioresources Cell Bank. The human bone
marrow stromal cell line LP101 was a gift from Dr S. Aizawa (Nihon
University School of Medicine, Tokyo, Japan) (29). All procured cell lines were
cultured in RPMI-1640 medium (Sigma-Aldrich; Merck KGaA),
supplemented with 10% heat-inactivated fetal bovine serum (Gibco;
Thermo Fisher Scientific, Inc.) and 1% penicillin/streptomycin
solution (FUJIFILM Wako Pure Chemical Corporation) at 37°C in a 5%
CO2 atmosphere.
Establishment of stable cell
lines
To generate stable cell lines, PANC-1 cells were
plated (1×10⁵ cells/well) in a 24-well plate for 24 h.
Cells were then transfected with plasmid DNA using
Lipofectamine® 3000 (Thermo Fisher Scientific, Inc.)
according to the manufacturer's instructions. As previously
described (30), the
pEZ-F-X-box-binding protein 1 (XBP1)-Venus plasmid used in the
present study was recombined with the pCAX-F-XBP1-Venus plasmid, a
gift from Dr M. Miura (University of Tokyo, Tokyo, Japan) (31). After selecting transfected cells
using puromycin (2 µg/ml), single clones of cells were isolated.
The expression of XBP1-Venus fusion protein in response to 300 nM
thapsigargin (Nacalai Tesque, Inc.) was confirmed by examining
fluorescence intensities derived from spliced XBP1-Venus using the
IncuCyte® ZOOM cell imaging system (Essen Bioscience).
After cloning and expansion, PANC-1/XBP1-Venus cells were cultured
under the same conditions as PANC-1 cells, except for the addition
of puromycin (1 µg/ml). PANC-1/green fluorescent protein
(GFP)-LC3-red fluorescent protein (RFP)-LC3ΔG cells were
established using the pMRX–IP-GFP-LC3-RFP-LC3ΔG plasmid, a gift
from Dr N. Mizushima (University of Tokyo, Tokyo, Japan) (32), similar to PANC-1/XBP1-Venus
cells.
Cell viability assay
The number of viable cells was assessed using the
CellTiter-Blue Cell Viability Assay Kit (Promega Corporation),
according to the manufacturer's instructions. Briefly, cells
(BxPC-3, 8×10³ cells/well; KP-4, 8×10³
cells/well; PANC-1, 6×10³ cells/well; MIA PaCa-2,
1.5×10⁴ cells/well; KP-2, 8×10³ cells/well;
KP-3, 1.2×10⁴ cells/well; 293, 2×10⁴
cells/well; LP101, 6×10³ cells/well) were plated in
96-well flat-bottom culture plates and incubated with test reagents
(lapatinib, FTY720, abemaciclib and HCQ, or a combination of these
reagents) for 24 or 48 h at 37°C in a 5% CO2 atmosphere.
To determine the mode of cell death, BxPC-3 and KP-4 cells were
incubated with the test reagents in the presence of z-VAD-FMK (25
or 50 µM), necrostatin-1 (25 µM), N-acetyl-L-cysteine (5 µM), or a
combination of lysosome protease inhibitors E64d (30 µM) and
pepstatin A (15 µM) at 37°C for 24 or 48 h. As a positive control
for the induction of apoptosis, staurosporine (0.3, 1 or 3 µM) was
added to BxPC-3 cells and KP-4 cells, and the cells were cultured
at 37°C for 24 or 48 h. As a positive control for the induction of
necroptosis (33), gefitinib (25
or 50 µM) was added to BxPC-3 cells and KP-4 cells under amino acid
starvation conditions using Dulbecco's modified Eagle's medium
without amino acid (FUJIFILM Wako Pure Chemical Corporation), and
the cells were cultured at 37°C for 24 or 48 h. Then, 1 h after the
addition of the CellTiter-Blue reagent, fluorescence (560 nm
excitation, 590 nm emission) was measured using a POWERSCAN HT
96-well plate reader (BioTek Instruments, Inc.). These experiments
were performed multiple times (at least twice) on different days.
The means and standard deviations presented in the graphs are from
two independent experiments performed in triplicate.
Lactate dehydrogenase (LDH) release
assay
Cytotoxicity was assessed using the LDH Assay
Kit-WST (Dojindo Laboratories, Inc.). Briefly, cells (BxPC-3,
8×10³ cells/well; KP-4, 8×10³ cells/well;
PANC-1, 6×10³ cells/well; MIA PaCa-2, 1.5×10⁴
cells/well) were plated in 96-well flat-bottom culture plates and
incubated with test reagents (lapatinib, FTY720 and abemaciclib, or
combination of these reagents) for 24 or 48 h at 37°C in a 5%
CO2 atmosphere. Then, cell lysis buffer was added to
half of the wells to release intracellular LDH into the culture
medium. After 30 min, the developing solution was added to all
wells, and the absorbance was measured at 490 nm using a SpectraMax
iD3 microplate reader (Molecular Devices, LLC). The rate of cell
death was calculated from the fluorescence ratio of wells, with and
without the cell lysis buffer. These experiments were performed
multiple times (at least twice) on different days. The means and
standard deviations presented in graphs are from two independent
experiments performed in triplicate.
Annexin V-propidium iodide (PI)
staining
Cell death (early apoptotic, late apoptotic and
necroptotic cell death) was assessed using the Annexin V-FITC
Apoptosis Detection Kit (Nacalai Tesque, Inc.), according to the
manufacturer's instructions. Briefly, cells (BxPC-3, KP-4 and
PANC-1) treated with lapatinib (10 µM), FTY720 (5, 10 or 15 µM) or
both at 37°C for 24 h were suspended in Annexin V binding buffer
(1×10⁶ cells/ml), and stained with Annexin V-FITC and PI
for 15 min at room temperature in the dark. After washing, cells
were analyzed by flow cytometry using an Attune™ Acoustic Focusing
Cytometer (Thermo Fisher Scientific, Inc.). Data analysis was
performed using the Attune Cytometric software v2.1 (Thermo Fisher
Scientific, Inc.).
May-Grünwald-Giemsa staining
Briefly, cells (BxPC-3, 4×10⁵ cells/well;
KP-4, 4×10⁵ cells/well; PANC-1, 3×10⁵
cells/well) were seeded and cultured for 24 h in 60 mm-dishes,
followed by treatment with lapatinib (10 µM) and FTY720 (10 or 15
µM) at 37°C for 24 h. To detect adherent and detached cells,
floating cells in culture medium and trypsin-treated adherent cells
were collected. Then, cells were spread onto glass slides using a
Cytospin 4 centrifuge (Thermo Fisher Scientific, Inc.) and
air-dried. These cells were stained with May-Grünwald's stain
solution (Muto Pure Chemicals Co., Ltd.) for 3 min at room
temperature. The glass slides were allowed to stand for another 3
min after adding the same phosphate-buffered saline (PBS) volume.
After removing the May-Grünwald's stain solution, the cells were
stained with diluted (1:20 with water) Giemsa's stain solution
(Muto Pure Chemicals Co., Ltd.) for 20 min at room temperature.
After washing and drying, the cells were observed using a BZ-X810
digital light microscope (Keyence Corporation) featuring PlanApo
60× NA1.40 (Nikon Corporation).
Immunoblotting
Total proteins were extracted from cells (BxPC-3,
KP-4, PANC-1, MIA PaCa-2 and BT-474) with lysis buffer containing
50 mM Tris-HCl (pH 8.0), 150 mM NaCl, 1.0% NonidetP-40, 0.5% sodium
deoxycholate, 0.1% sodium dodecyl sulfate (SDS) and a protease
inhibitor cocktail (Nacalai Tesque, Inc.). Each sample was
sonicated continuously on ice for 20 pulses (0.5 sec on/off) to
solubilize aggregated proteins using a Branson 450D Sonifier
(Emerson Electric Co.). Protein concentrations were determined
using a bicinchoninic acid protein assay kit (Pierce; Thermo Fisher
Scientific, Inc.). Cellular proteins (10 µg) were resolved via
SDS-PAGE (5–20% gradient gel) and subsequently transferred onto
Immobilon-P membranes (MilliporeSigma). The membranes were blocked
with 5% non-fat milk for 1 h at room temperature and probed with
primary antibodies at 4°C overnight. The primary antibodies used
for immunoblotting were as follows: Anti-CASP3 (1:1,000),
anti-cleaved CASP3 (1:1,000), anti-PARP1 (1:1,000), anti-p-H2AX
(1:2,000), anti-H2AX (1:1,000), anti-CTSB (1:1,000), anti-GAPDH
(1:1,000) and anti-ACTB (1:1,000). The membranes were incubated
with horseradish peroxidase-conjugated secondary antibodies
[anti-mouse immunoglobulin G (IgG; cat. no. 115-035-003; 1:20,000)
or anti-rabbit IgG (cat. no. 711-035-152; 1:20,000); both from
Jackson ImmunoResearch Laboratories, Inc.] for 1 h at room
temperature. Immunoreactive proteins were detected using an
enhanced chemiluminescence reagent (Immobilon Western
Chemiluminescent HRP Substrate; MilliporeSigma). Densitometry was
performed using the WSE-6300 Luminograph III molecular imager (ATTO
Corporation) and ATTO CS Analyzer 4 densitograph software (version
2.3.1, ATTO Corporation).
Immunofluorescence analysis
Briefly, BxPC-3 (3×10⁴ cells/well) and
KP-4 (2×10⁴ cells/well) cells were seeded onto cover
glasses in 24-well plates for 24 h. Cells were then treated with
either lapatinib (10 µM), FTY720 (5 or 10 µM) or both at 37°C for
4, 10 or 24 h. Cells on cover glasses were washed twice with PBS,
fixed in 2% paraformaldehyde for 10 min at room temperature, and
then permeabilized by incubation with 0.1% Triton X-100 for 5 min
(room temperature). For staining with LAMP2 antibody, cells on
cover glasses were washed twice with PBS and fixed in 2% methanol
for 15 min at −30°C. The cover glasses were then blocked with 10%
newborn calf serum (Gibco; Thermo Fisher Scientific, Inc.) for 1 h
at room temperature, followed by incubation with a primary antibody
at 4°C overnight. The primary antibodies used for
immunofluorescence analysis were as follows: Anti-LAMP2 (1:100),
anti-LGALS3 (1:200), anti-COX IV (1:200), anti-CALR (1:400) and
anti-TGOLN2 (1:400). After washing three times, cover glasses were
incubated with Alexa Fluor 488-conjugated anti-Rabbit IgG (cat. no.
A-11034; 1:1,000) and/or Alexa Fluor 555-conjugated anti-Mouse IgG
(cat. no. A-21424; 1:1,000) (Molecular Probes; Thermo Fisher
Scientific, Inc.) at 37°C for 1 h. Next, the cover glasses were
washed three times and mounted in ProLong Diamond Antifade Mountant
(Thermo Fisher Scientific, Inc.). Cells were visualized using an
LSM 700 confocal laser scanning fluorescence microscope (Zeiss
GmbH) equipped with a Plan-Apochromat 63×/1.4 oil DIC (Zeiss GmbH).
All images were acquired and processed using the ZEN 2012 software
(version 8.1.0.484; Zeiss GmbH). Object-based fluorescence
intensity, lysosome size and colocalization of fluorescence signals
were measured using ImageJ software (1.50i; National Institutes of
Health). Images used to compare different treatments were acquired
with the same instrument settings and exposure times and were
processed equally. The results are presented in graphs for the
DMSO-treated sample as 1. In experiments with glass bottoms
(immunofluorescence analysis, LysoTracker staining, JC-1 staining
and Fluo-8-AM staining), FTY720 was used at 5 µM for combination
treatment with 10 µM lapatinib, as PDAC cells are easily detached
from the glass bottom following combination treatment with 10 µM
FTY720 and 10 µM lapatinib.
LysoTracker staining to assess
lysosomal function
Briefly, cells (BxPC-3, 3×10⁴ cells/well
and KP-4, 2×10⁴ cells/well) were seeded into CELLview
35-mm glass-bottom cell culture dishes with four compartments (cat.
no. 627870; Greiner Bio-One International GmbH) for 24 h. Cells
were then treated with either lapatinib (10 µM), FTY720 (5 or 10
µM) or both at 37°C for 1, 2, 4 or 10 h. LysoTracker Red DND-99 (50
nM; Molecular Probes; Thermo Fisher Scientific, Inc.) was added
during the last 1 h at 37°C. Next, cells were visualized using an
LSM 700 confocal laser scanning fluorescence microscope (Zeiss
GmbH) equipped with a Plan-Apochromat 63×/1.4 oil DIC (Zeiss GmbH).
All images were acquired and processed using ZEN 2012. The
object-based fluorescence intensity was measured using ImageJ
software.
JC-1 staining to assess mitochondrial
function
Briefly, cells (BxPC-3, 3×10⁴ cells/well
and KP-4, 2×10⁴ cells/well) were seeded into CELLview
35-mm glass-bottom cell culture dishes with four compartments for
24 h. These cells were treated with a combination of lapatinib (10
µM) and FTY720 (5 µM) at 37°C for 1 or 4 h. JC-1 dye (5 µM;
FUJIFILM Wako Pure Chemical Corporation) was added during the last
30 min at 37°C. Next, the cells were visualized using an LSM 700
confocal laser scanning fluorescence microscope (Zeiss GmbH)
equipped with a Plan-Apochromat 63×/1.4 oil DIC (Zeiss GmbH). All
images were acquired and processed using ZEN 2012. The object-based
fluorescence intensity was measured using ImageJ software.
Fluo-8-AM staining to assess
intracellular calcium (Ca2+) concentrations
Briefly, cells (BxPC-3, 3×10⁴ cells/well
and KP-4, 2×10⁴ cells/well) were seeded into CELLview
35-mm glass-bottom cell culture dishes with four compartments.
Then, 2 days after seeding, the culture medium was replaced with
fresh medium containing 5 µM Fluo-8-AM (AAT Bioquest, Inc.) and
cultured at 37°C for 1 h. After washing, the cells were treated
with a combination of lapatinib (10 µM) and FTY720 (5 µM) at 37°C
for 1 h. Cells were then visualized using an LSM 700 confocal laser
scanning fluorescence microscope (Zeiss GmbH) equipped with a
Plan-Apochromat 40×/1.4 oil DIC (Zeiss GmbH). All images were
acquired and processed using ZEN 2012. The object-based
fluorescence intensity was measured using ImageJ software.
Gene expression analysis
Total RNA was extracted from BxPC-3, KP-4, PANC-1
and MIA PaCa-2 cells using the NucleoSpin RNA kit (Takara Bio,
Inc.). The RNA was reverse transcribed to cDNA using PrimeScript RT
Master Mix (Takara Bio, Inc.) at 37°C for 15 min. The expression of
endoplasmic reticulum (ER) stress-associated gene, DNA
damage-inducible transcript 3 (DDIT3/CHOP), was determined
by quantitative polymerase chain reaction (qPCR) using SYBR Premix
Ex Taq II Tli RNase H Plus (Takara Bio, Inc.). The primer sequences
employed were as follows: 5′-AAATCAGAGCTGGAACCTGAGGA-3′ and
5′-CCATCTCTGCAGTTGGATCAGTC-3′ for DDIT3;
5′-GCACCGTCAAGGCTGAGAAC-3′ and 5′-TGGTGAAGACGCCAGTGGA-3′ for
GAPDH. qPCR was performed using Thermal Cycler Dice
Real-Time System TP800 (Takara Bio, Inc.) under the following
conditions: Initial denaturation at 95°C for 30 sec, followed by 40
cycles of denaturation at 95°C for 5 sec, and annealing and
extension at 60°C for 30 sec. Data were analyzed using Thermal
Cycler Dice Real-Time System Software (Takara Bio, Inc.) and
standardized to GAPDH as an internal control. The
comparative Cq method (2−ΔΔCq) was used for the relative
quantification of gene expression (34).
Assessment of ER stress using the
spliced XBP1-Venus system
PANC-1/XBP1-Venus cells (1×10⁴
cells/well) were plated in a 96-well plate 24 h prior to treatment.
Fluorescence intensities derived from spliced XBP1-Venus were
monitored during the 24 h-culture under various conditions, using
an IncuCyte ZOOM cell imaging system (Essen Bioscience). Cell
confluency in each imaging field was monitored by simultaneously
capturing phase-contrast images using IncuCyte ZOOM. In addition,
ER stress was measured as alterations in the Venus fluorescence
intensity per cell confluency.
Assessment of autophagic flux using
GFP-LC3-RFP-LC3ΔG system
Prior to treatment, PANC-1/GFP-LC3-RFP-LC3ΔG cells
(9×10³ cells/well) were plated in a 96-well plate for 24
h. Fluorescence intensities derived from GFP-LC3 and RFP-LC3ΔG were
monitored during the 24 h-culture at 37°C with 5% CO2
using IncuCyte ZOOM. The cells were treated with lapatinib (10 or
20 µM) or FTY720 (10 or 20 µM) at 37°C for 24 h in 96-well plates
in quadruplicate. As a positive control for the induction of
autophagic flux, the cells were cultured under starvation
conditions using HBSS at 37°C for 24 h. As a positive control for
the suppression of autophagic flux, the cells were treated with
bafilomycin A1 (10 nM) at 37°C for 24 h. Autophagic flux
was presented as alterations in the relative intensities of
GFP/RFP, calculated from the measured fluorescence intensities of
GFP and RFP.
Assessment of cell death
Cells (BxPC-3, 8×10³ cells/well; KP-4,
8×10³ cells/well; PANC-1, 6×10³ cells/well)
were plated in 96-well flat-bottom culture plates and pretreated
with U18666A (0.1, 0.3, 1 or 3 µM) at 37°C for 24 h. Cells were
then treated with a combination of lapatinib (10 µM) and FTY720 (10
or 15 µM) in the presence of PI (2.5 µg/ml; Sigma-Aldrich; Merck
KGaA) at 37°C for 24 or 48 h. Cell death was assessed by counting
the number of PI-stained red fluorescent signals using IncuCyte
ZOOM.
DNA fragmentation assay
Extraction and separation of fragmented DNA were
performed as previously described (35). Briefly, cells (BxPC-3,
4×10⁵ cells/well; KP-4, 4×10⁵ cells/well; MIA
PaCa-2, 7.5×10⁵ cells/well) were seeded and cultured for
24 h in 60 mm-dishes. Cells were then treated with a combination of
lapatinib (10 µM) and FTY720 (10 µM) at 37°C for 24 h and lysed in
a buffer containing 10 mM Tris-HCl (pH 8.0), 1 mM EDTA and 0.5%
Triton X-100. The lysate was centrifuged at 15,000 × g for 15 min
at 4°C to separate fragmented DNA in the supernatant from intact
chromatin in the pellet. DNA in the supernatant was treated with
RNase A at 37°C for 1 h, followed by proteinase K at 50°C for 2 h.
DNA was purified using silica-based spin columns,
NucleoSpin® Gel and PCR Clean-up (Takara Bio, Inc.) and
separated by electrophoresis on a 2% agarose gel with the DNA
fluorescence dye, Midori Green Direct (Nippon Gene Co., Ltd.).
Then, DNA was visualized using an LED illuminator (Fas-Digi; Nippon
Gene Co., Ltd.).
Filipin III staining to assess
cholesterol accumulation
Briefly, KP-4 cells (2×10⁴ cells/well)
were seeded into CELLview 35-mm glass-bottom cell culture dishes
with four compartments for 24 h, and the cells were treated in the
presence (1 µM) or absence of U18666A at 37°C for 24 h. Next, cells
were washed with PBS and fixed with 3% paraformaldehyde for 1 h at
room temperature, followed by incubation with 20 mM glycine for 10
min to quench the paraformaldehyde. For cholesterol staining, the
cells were incubated with 25 µg/ml filipin III (Santa Cruz
Biotechnology, Inc.) for 2 h at room temperature. After washing
with PBS, the cells were observed using a BZ-X810 digital
microscope (Keyence Corporation) featuring PlanApo 60× NA1.40
(Nikon Corporation).
Statistical analysis
Data are presented as the mean ± standard deviation
or median with interquartile ranges. All data presented in the
graphs are from at least two independent experiments. Statistical
analyses were performed by using parametric, unpaired two-tailed
Student's t-test and analysis of variance (ANOVA), or
non-parametric, Mann Whitney U test and Kruskal-Wallis test,
methods where appropriate. The Student's t-test and Mann Whitney U
test were performed using Microsoft Excel version 16.51 (Microsoft
Corporation) with the add-in software, Excel Statistical Program
File ystat2008 (Igakutosho-shuppan Ltd.). One-way ANOVA followed by
Tukey's post hoc test, two-way ANOVA followed by Bonferroni's post
hoc test, and Kruskal-Wallis with Dunn's post hoc test were
performed using SPSS software version 28 (IBM Corp.). P<0.05 was
considered to indicate a statistically significant difference.
Results
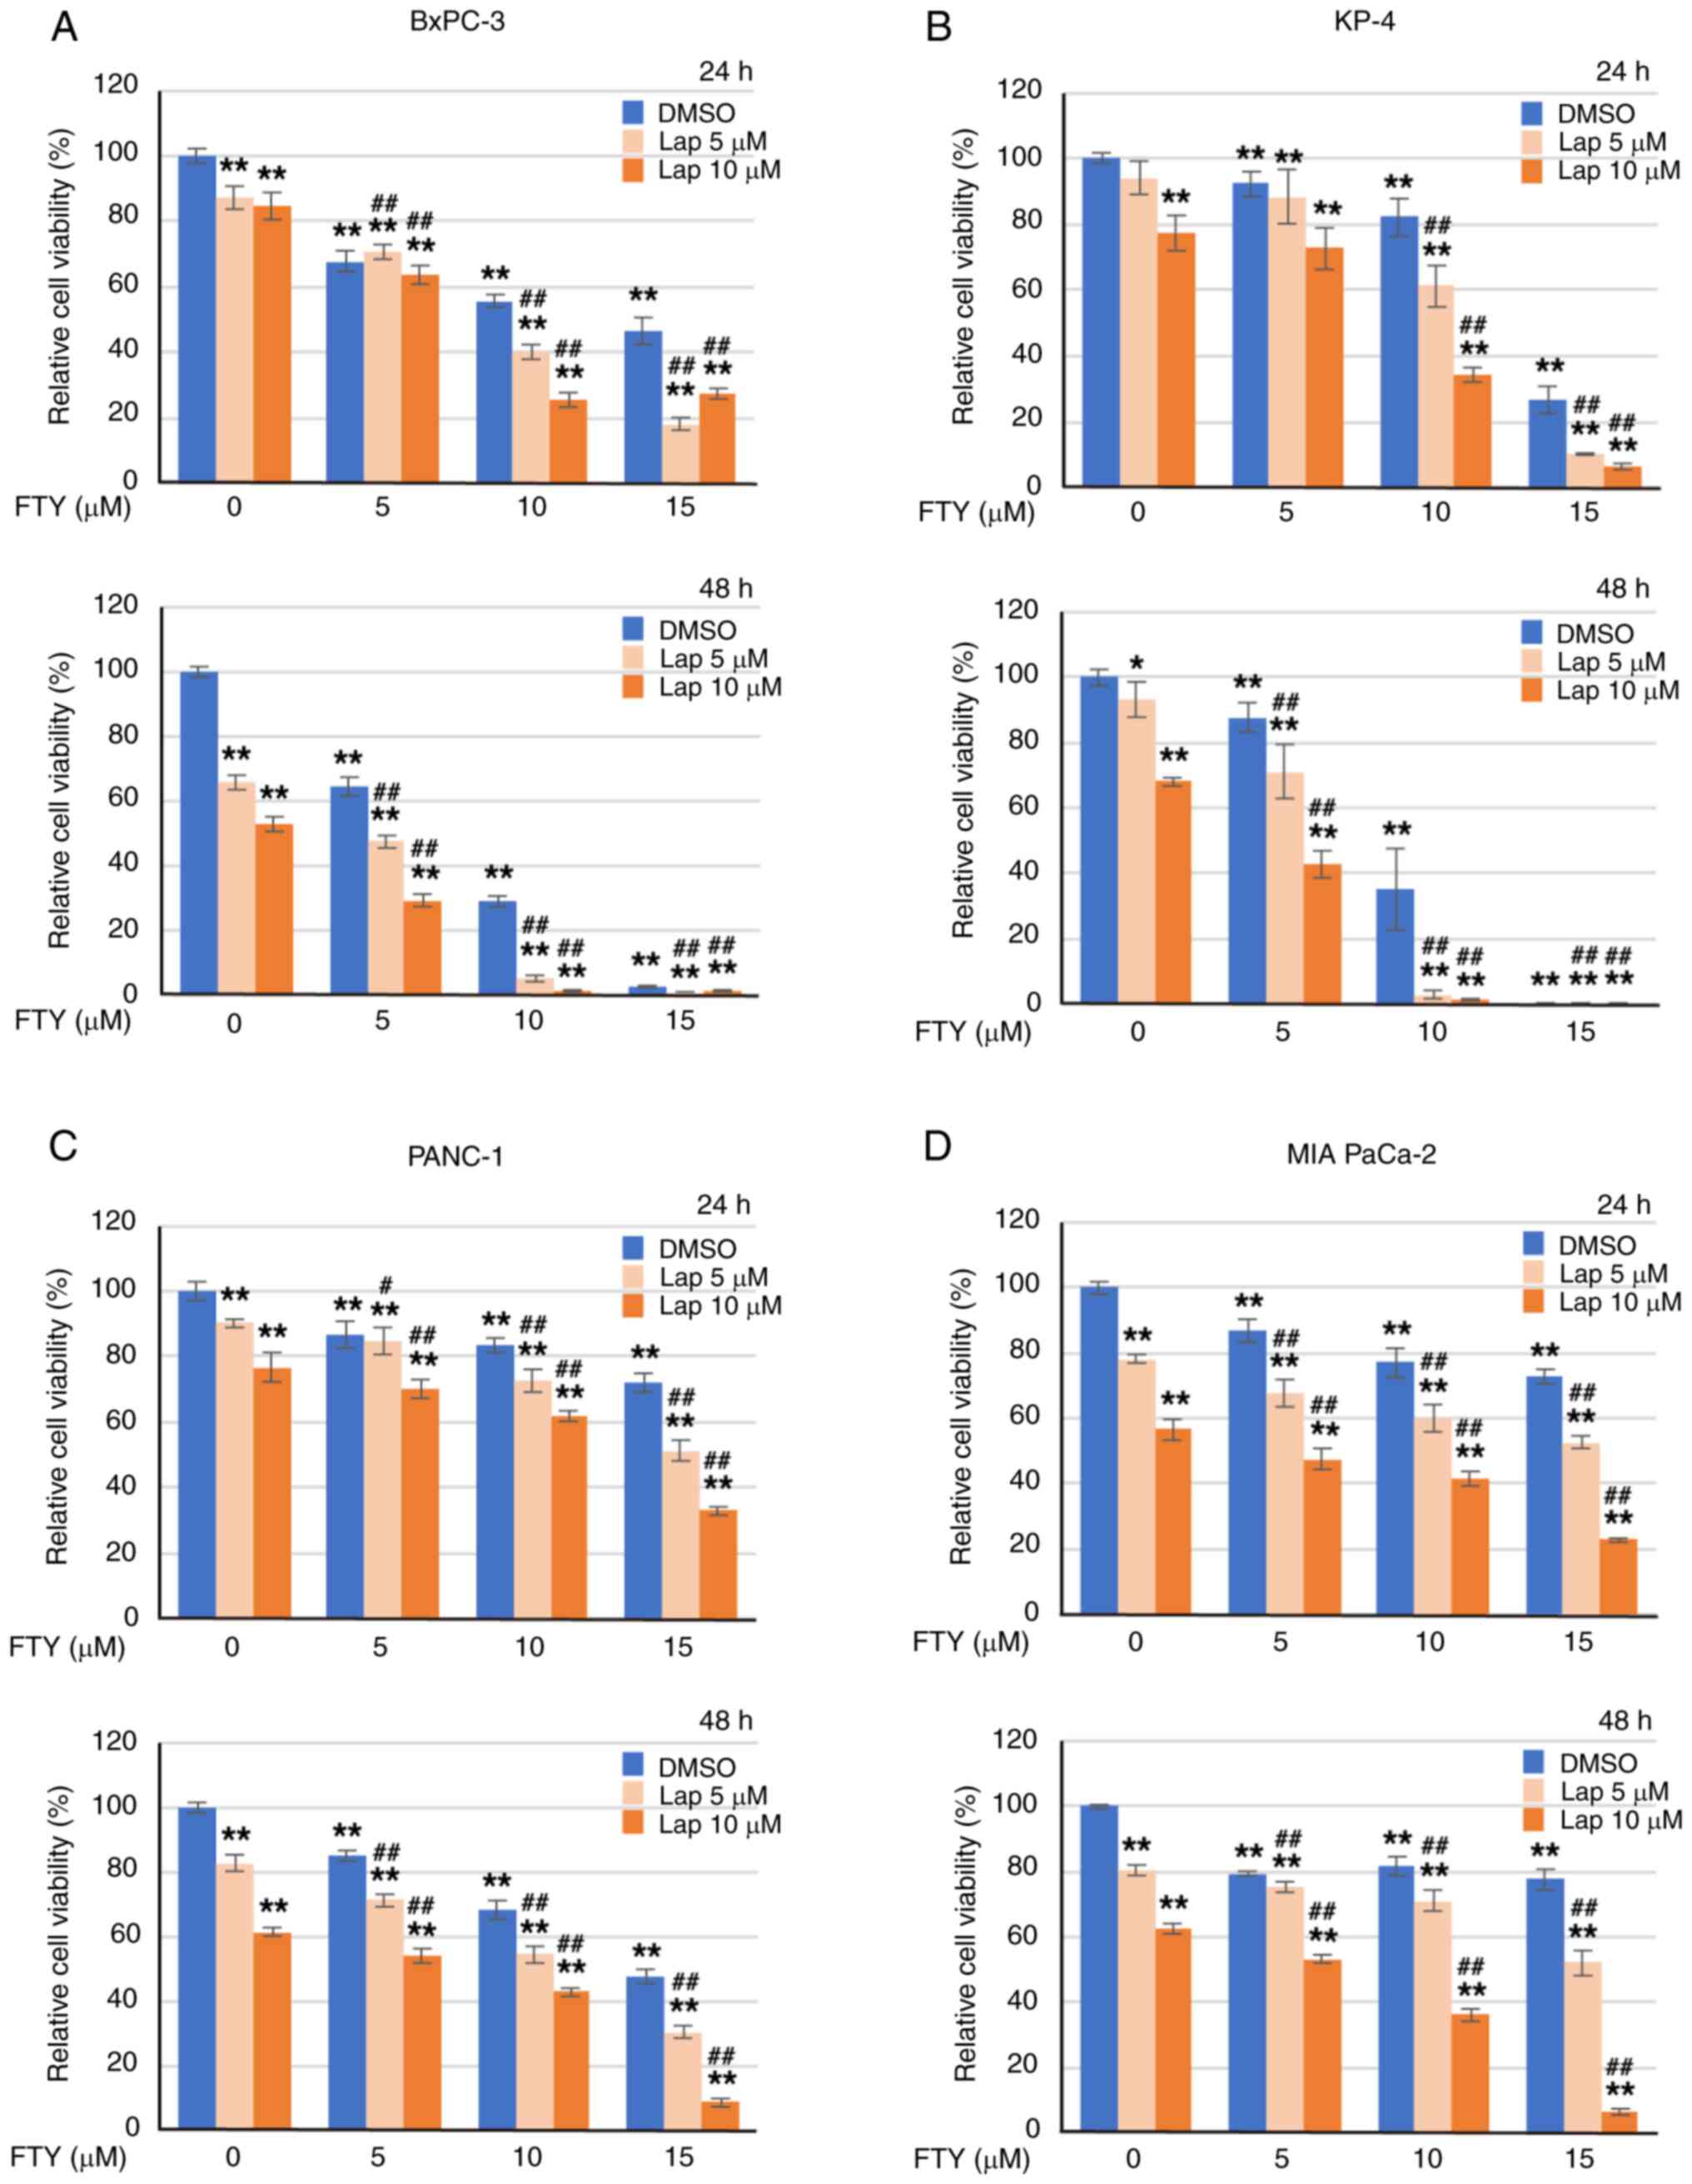
Combination treatment with lapatinib
and FTY720 enhances growth inhibition in PDAC cells
Previously, we reported that combination treatment
with FTY720 and the EGFR/HER2 inhibitor lapatinib or multikinase
inhibitor sorafenib can show prominent growth inhibitory activity
in NSCLC cells (18). In the
present study, we focused on lysosomotropic drugs (36). Accordingly, PDAC cells, including
BxPC-3, KP-4, PANC-1, MIA PaCa-2, KP-3 and KP-2, were treated with
lapatinib, FTY720 or a combination of these drugs. It was observed
that the growth inhibitory effect of lapatinib was significantly
enhanced following combination treatment with FTY720 in all cell
lines (Figs. 1 and S1–S3).
Table I presents the values of the
half-maximal inhibition concentration (IC50) and
combination index (CI) of lapatinib and FTY720. Specifically, CI
<1, CI=1 and CI >1 indicate synergistic, additive and
antagonistic effects, respectively (37). It was noted that FTY720
synergistically enhanced the growth inhibitory effect of lapatinib
in BxPC-3, MIA PaCa-2 and KP-2 cells. The combined effect of these
two drugs was nearly additive in KP-4 cells and antagonistic in the
non-cancerous cell line LP101.
 | Table I.IC50 and combination index
values of lapatinib and FTY720. |
Table I.
IC50 and combination index
values of lapatinib and FTY720.
| Cell lines | IC50 for
lapatinib, µM | IC50 for
FTY720, µM | Combination
index |
|---|
| BxPC-3 | 15.0 | 8.6 | 0.69 |
| KP-4 | 18.9 | 10.3 | 0.98 |
| PANC-1 | >40.0 | 18.2 | ND |
| MIA PaCa-2 | 15.1 | 17.9 | 0.79 |
| KP-2 | 31.0 | 18.0 | 0.70 |
| KP-3 | >40.0 | 21.8 | ND |
| 293 | 18.3 | 8.6 | ND |
| LP101 | 12.3 | 14.4 | 1.11 |
One of the biological effects of FTY720 can be
attributed to its phosphorylated form, FTY720-P, which strongly
binds to sphingosine 1-phosphate receptor 1 (S1PR1), inducing the
internalization and degradation of S1PR1 at submicromolar
concentrations (38,39). However, in the current study, the
growth inhibitory effect of FTY720 on PDAC cells was observed only
at micromolar concentrations (Fig.
S1). Therefore, FTY720-mediated growth inhibition in PDAC cells
was not attributed to its phosphorylated form, FTY720-P.
Additionally, the major effect of lapatinib is typically attributed
to the inhibition of EGFR and HER2 phosphorylation (40). However, the expression of p-EGFR
and p-HER2 was scarcely detected in PDAC cells (Fig. S4). Therefore, lapatinib-mediated
cytostatic effects in PDAC cells were not attributed to the
inhibition of EGFR/HER2 signaling.
In the present study, lapatinib was used at 10 µM,
which was less than the IC50 value, and FTY720 was
primarily used at a 10 or 15 µM concentration, at which the two
reagents acted synergistically. However, in experiments with glass
bottoms, 5 µM FTY720 was combined with 10 µM lapatinib to prevent
PDAC cells from detaching from the glass bottom.
Combination treatment with lapatinib
and FTY720 induces death in PDAC cells
Next, it was investigated whether combination
treatment with lapatinib and FTY720 induced death in PDAC cells,
along with the growth inhibitory effect. As shown in Fig. 2A-D, combination treatment with
lapatinib and FTY720 promoted LDH release, an indicator of cell
death (41), in PDAC cells.
Furthermore, combination treatment with lapatinib and FTY720
increased the Annexin V and/or PI-positive population in PDAC
cells, another indicator of cell death (42) (Fig.
2E-J). In addition, May-Grünwald-Giemsa staining exhibited
various forms of cell death, including chromatin condensation,
vacuole formation and plasma membrane disruption (Fig. 2K-M).
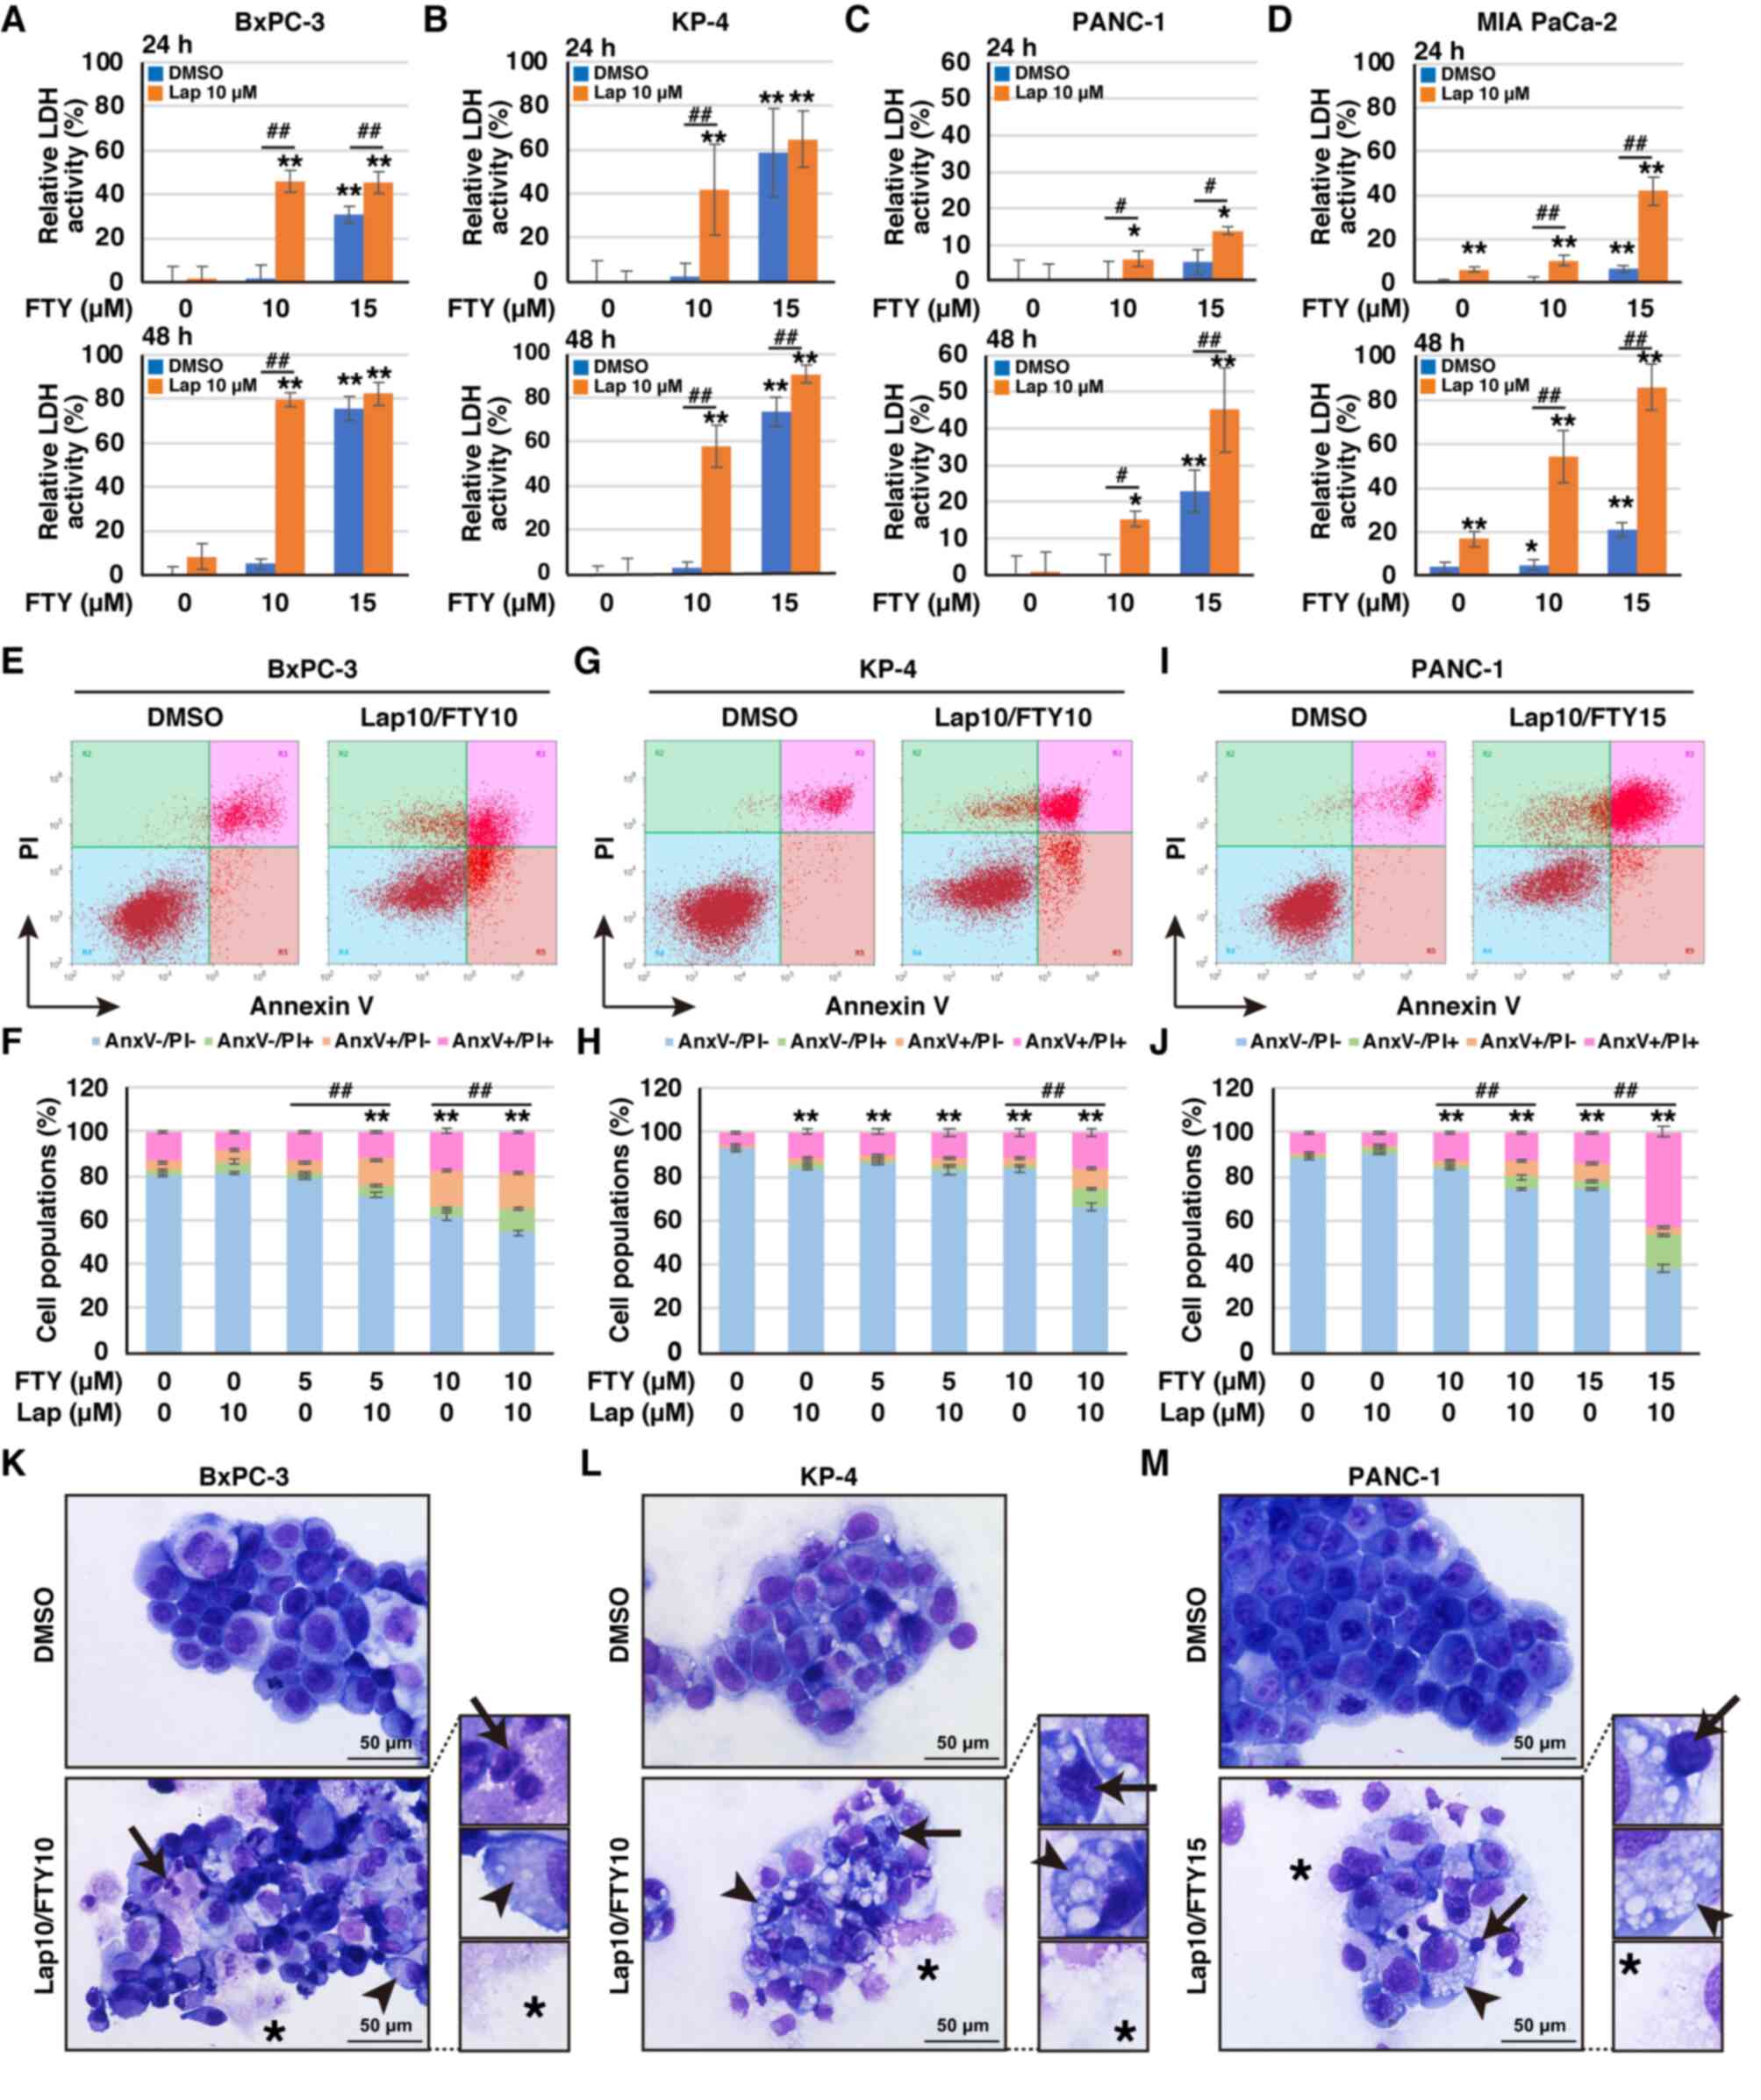 | Figure 2.Induction of pancreatic ductal
adenocarcinoma cell death. (A-D) Cytotoxicity was assessed at 24
and 48 h following treatment with Lap and/or FTY using the LDH
release assay in (A) BxPC-3, (B) KP-4, (C) PANC-1 and (D) MIA
PaCa-2 cells. Data were analyzed using one-way ANOVA followed by
Tukey's post hoc test. Data are shown as the mean ± standard
deviation, n=6 *P<0.05 and **P<0.01 vs. FTY 0 µM/Lap 0 µM.
#P<0.05 and ##P<0.01 vs. DMSO. (E-J)
Cell death was assessed 24 h following treatment with Lap and/or
FTY by Annexin V-FITC and PI staining. Representative flow
cytometry plots of (E) BxPC-3, (G) KP-4 and (I) PANC-1 cells are
presented. The cell population of (F) BxPC-3, (H) KP-4 and (J)
PANC-1 cells are presented as the mean ± standard deviation, n=3.
Data were analyzed using one-way ANOVA followed by Tukey's post hoc
test. **P<0.01 vs. FTY 0 µM/Lap 0 µM. ##P<0.01 vs.
Lap 0 µM. (K-M) Cell morphology was assessed 24 h after combination
treatment with lapatinib and FTY720 using May-Grünwald-Giemsa
staining in (K) BxPC-3, (L) KP-4 and (M) PANC-1 cells. Arrows,
arrowheads and asterisks indicate chromatin condensation, vacuole
formation and plasma membrane disruption, respectively. Scale bar,
50 µm. LDH, lactate dehydrogenase; Lap, lapatinib; FTY, FTY720;
AnxV, Annexin V; PI, propidium iodide; DMSO, dimethyl
sulfoxide. |
Combination treatment with lapatinib
and FTY720 induces non-canonical death in PDAC cells
Next, this study investigated the types of cell
death induced by combination treatment with lapatinib and FTY720.
It was observed that combination treatment with lapatinib and
FTY720 markedly increased proteolytic cleavage of PARP1, a
signature for apoptosis (43), and
elevated levels of p-H2AX, a DNA damage marker (44,45);
however, lapatinib or FTY720 alone barely induced these markers
(Fig. 3A). Combination treatment
with lapatinib and FTY720 also induced DNA fragmentation (Fig. S5). However, cleaved CASP3, the
active enzyme form responsible for PARP1 cleavage (46), was barely detected following
combination treatment with lapatinib and FTY720 (Fig. 3A). Additionally, cell viability was
slightly, but not significantly improved after combination
treatment with lapatinib and FTY720 in the presence of z-VAD-FMK, a
pan-caspase inhibitor, which clearly improved cell viability after
treatment with staurosporine (Figs. 3B
and C and S6A and B).
Therefore, these findings indicated that combination treatment with
lapatinib and FTY720 induced caspase-dependent apoptosis in some
populations of PDAC cells, although the effect was not substantial.
Furthermore, necrostatin-1, which inhibits RIPK1, a central
regulator of necroptosis (47),
did not improve cell viability after combination treatment with
lapatinib and FTY720, although necrostatin-1 significantly improved
cell viability after gefitinib treatment under starvation
conditions that induce necroptosis. (Figs. 3D and E and S6C and D). Additionally,
N-acetyl-L-cysteine, known to inhibit reactive oxygen species
(ROS)-induced cell death by acting as a ROS scavenger (48), improved the viability of KP-4
cells, but not BxPC-3 cells. (Fig.
S7A and B). Furthermore, E64d and pepstatin A, which inhibit
autophagic cell death as lysosomal protease inhibitors (49), did not improve cell viability
(Fig. S7C and D). In addition,
autophagic flux, which was induced by HBSS and suppressed by
bafilomycin A1, was suppressed by lapatinib and FTY720
in the PDAC cell line PANC-1, as previously reported in the NSCLC
cell line A549 (18) (Fig. S7E). Collectively, combination
treatment with lapatinib and FTY720 elicited non-canonical death in
PDAC cells, which was not apoptotic, necroptotic or autophagic cell
death and was ROS-mediated depending on the cell line.
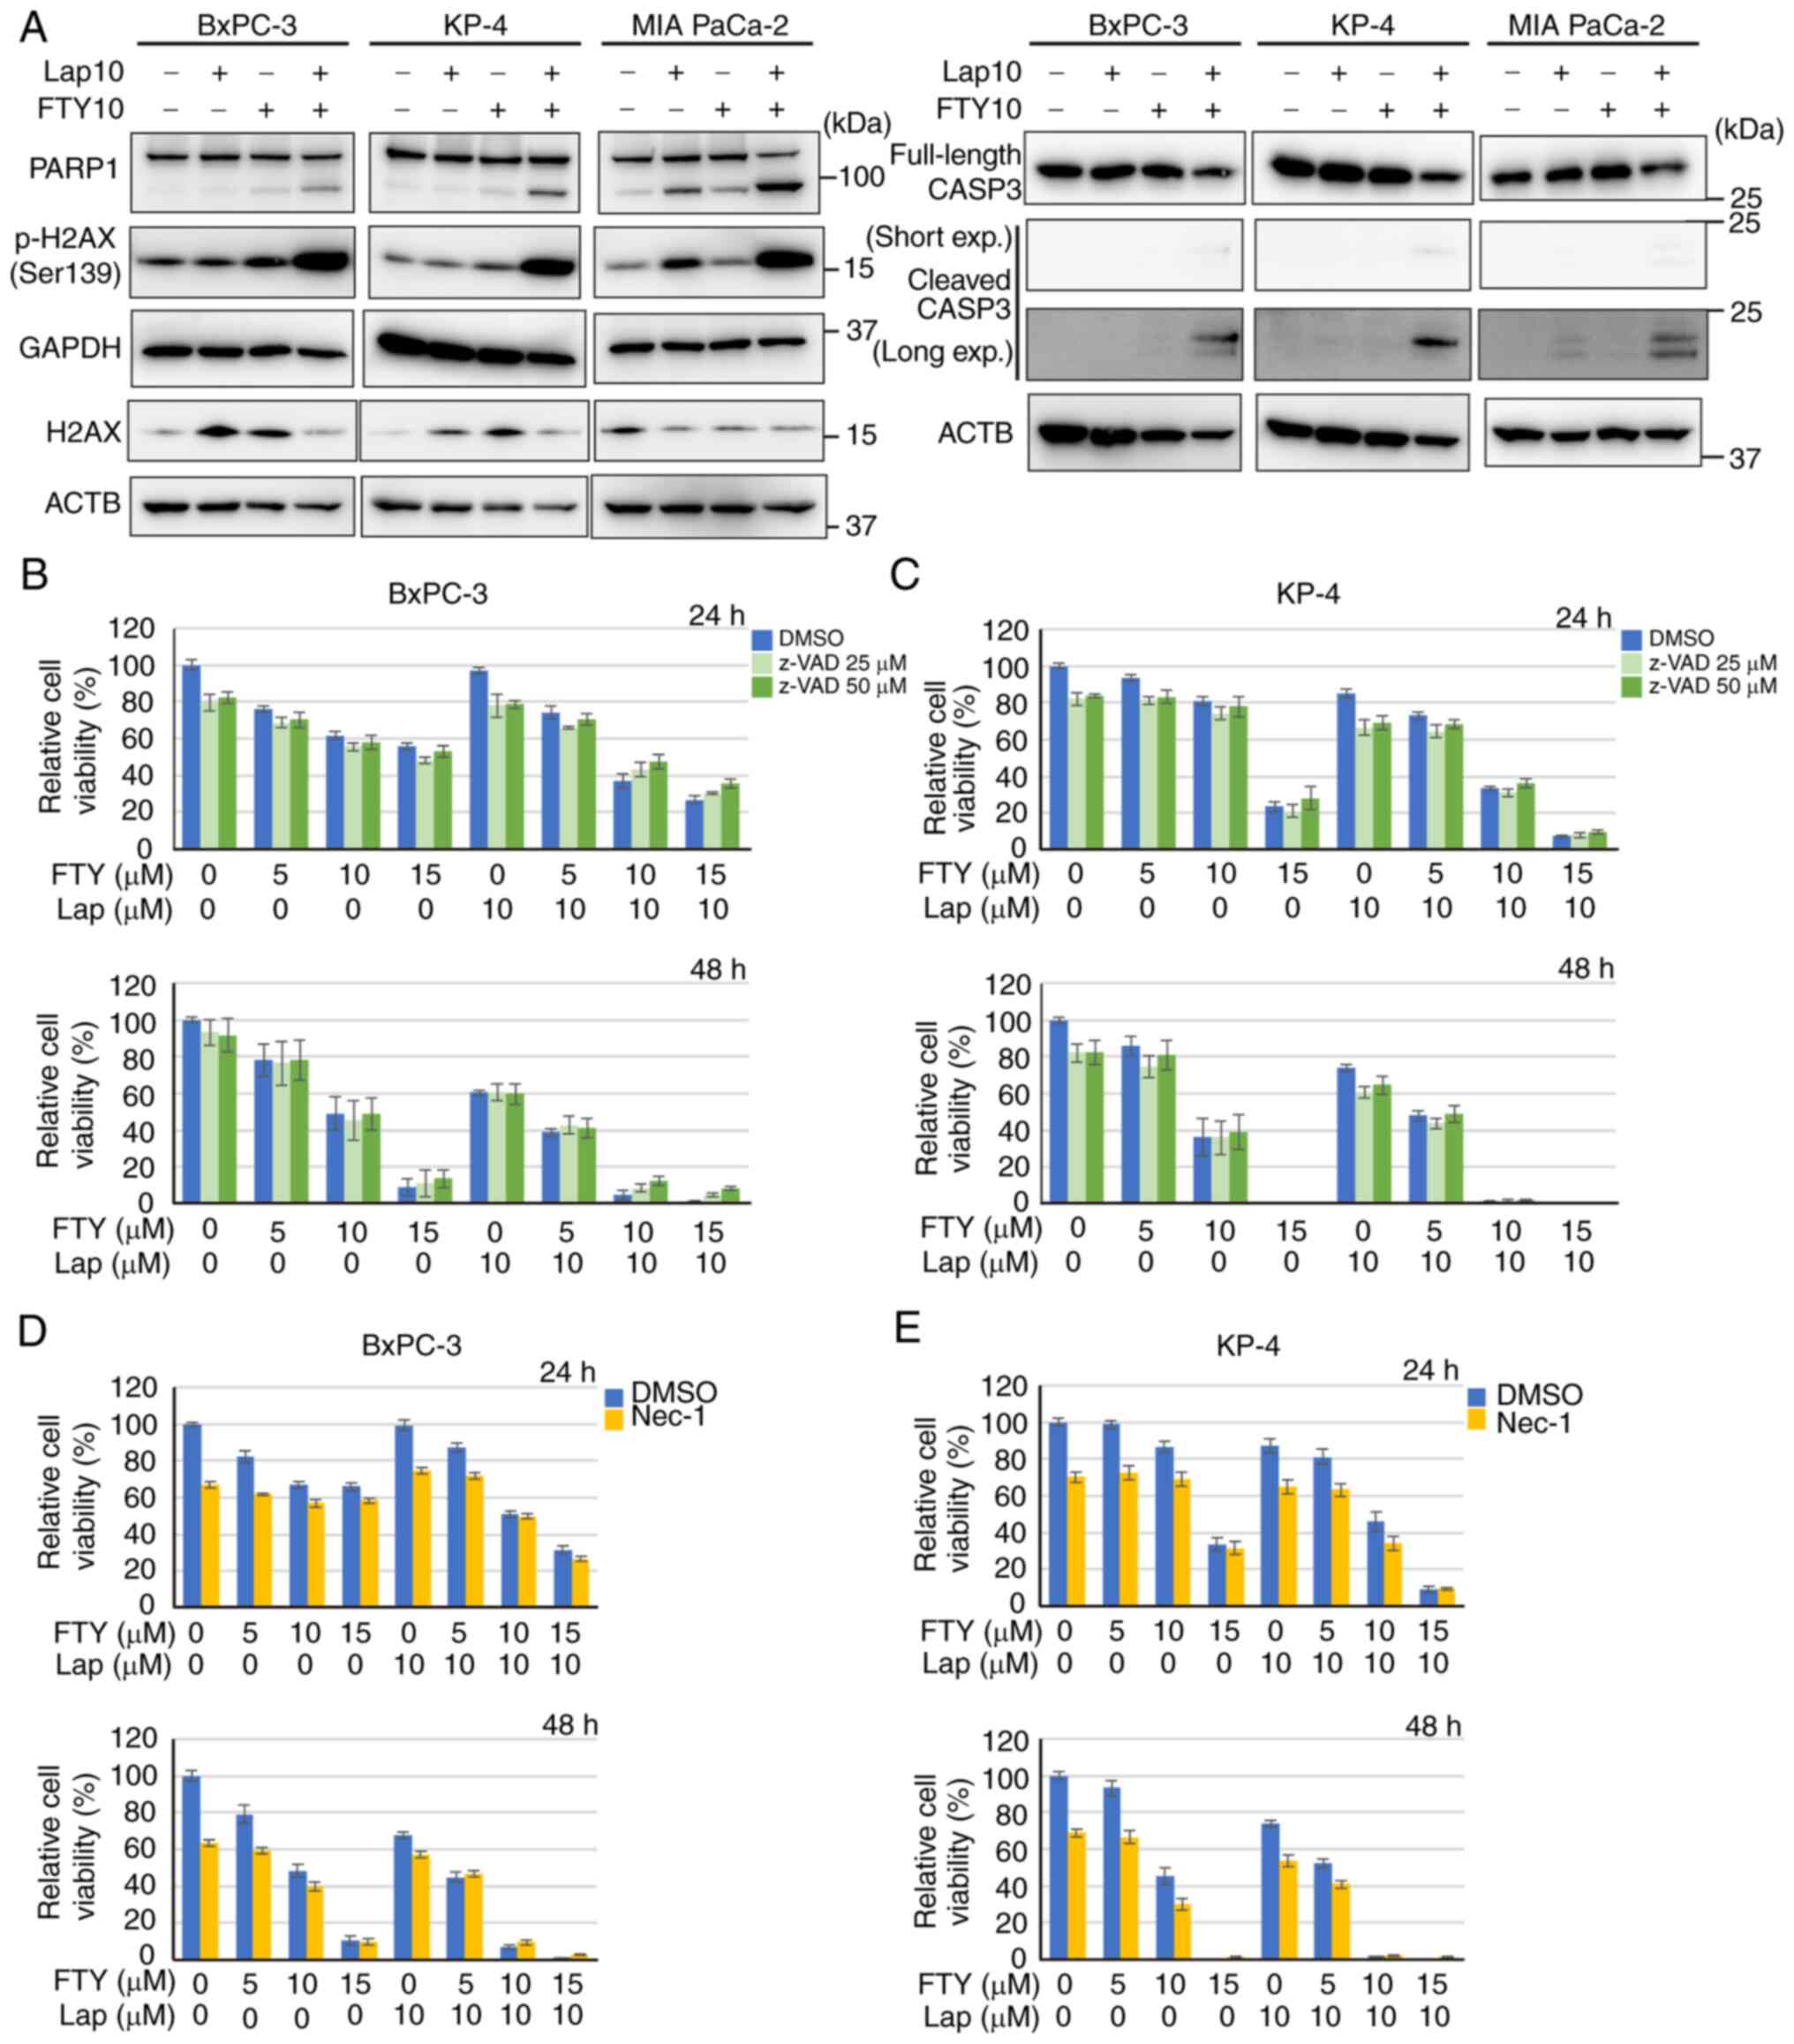 | Figure 3.Non-canonical death in pancreatic
ductal adenocarcinoma cells. (A) Immunoblot analysis of cleaved
CASP3, PARP1 and p-H2AX expression 24 h after treatment with Lap
(10 µM) and/or FTY (10 µM) in BxPC-3, KP-4 and MIA PaCa-2 cells.
ACTB and GAPDH were used as loading controls. (B and C) Cell
viability was assessed 24 and 48 h following treatment with Lap
and/or FTY in the presence (25 or 50 µM) or absence of z-VAD in (B)
BxPC-3 and (C) KP-4 cells. Data were analyzed using one-way ANOVA
followed by Tukey's post hoc test. Data are presented as the mean ±
standard deviation, n=6. (D and E) Cell viability was assessed 24
and 48 h after treatment with Lap and/or FTY in the presence (25
µM) or absence of Nec-1 in (D) BxPC-3 and (E) KP-4 cells. Data were
analyzed using one-way ANOVA followed by Tukey's post hoc test.
Data are presented as the mean ± standard deviation, n=6. CASP3,
caspase-3; PARP1, poly [ADP-ribose] polymerase 1; p-,
phosphorylated; H2AX, histone H2A.X; Lap, lapatinib; FTY, FTY720;
z-VAD, z-VAD-FMK; Nec-1, necrostatin-1; DMSO, dimethyl
sulfoxide |
Combination treatment with lapatinib
and FTY720 impairs lysosomal function in PDAC cells
We have previously reported that FTY720 notably
reduces LysoTracker staining in NSCLC cells, indicating that FTY720
inhibits the acidification of lysosome-related organelles (18). Accordingly, the present study
assessed the effects of lapatinib and FTY720 on lysosomes in PDAC
cells. Enlargement of LAMP2-positive vesicles, including lysosomes
and endosomes, was observed in BxPC-3 and KP-4 cells (Fig. 4A-D). In addition, lapatinib and
FTY720 reduced LysoTracker staining of BxPC-3 and KP-4 cells
(Fig. 4E and F); combination
treatment with these two drugs enhanced this effect, which was
exhibited only 1 h after drug treatment (Figs. 4E and F and S8A and B). In addition, combination drug
treatment increased the colocalization of LGALS3 and LAMP2, an
indicator of enhanced lysosomal membrane permeability (50) (Figs.
5A and B and S9A and B), and
suppressed the expression and maturation of the lysosomal enzyme
cathepsin B (Fig. 5C). Moreover,
increased LMP can disturb intracellular Ca2+ homeostasis
(51). 1 h after combination
treatment with lapatinib and FTY720, increased intracellular
Ca2+ concentration was observed in BxPC-3 and KP-4 cells
(Fig. 5D and E). These findings
suggested that combination treatment with lapatinib and FTY720
induced LMP, which decreased lysosomal function and increased the
intracellular Ca2+ concentration.
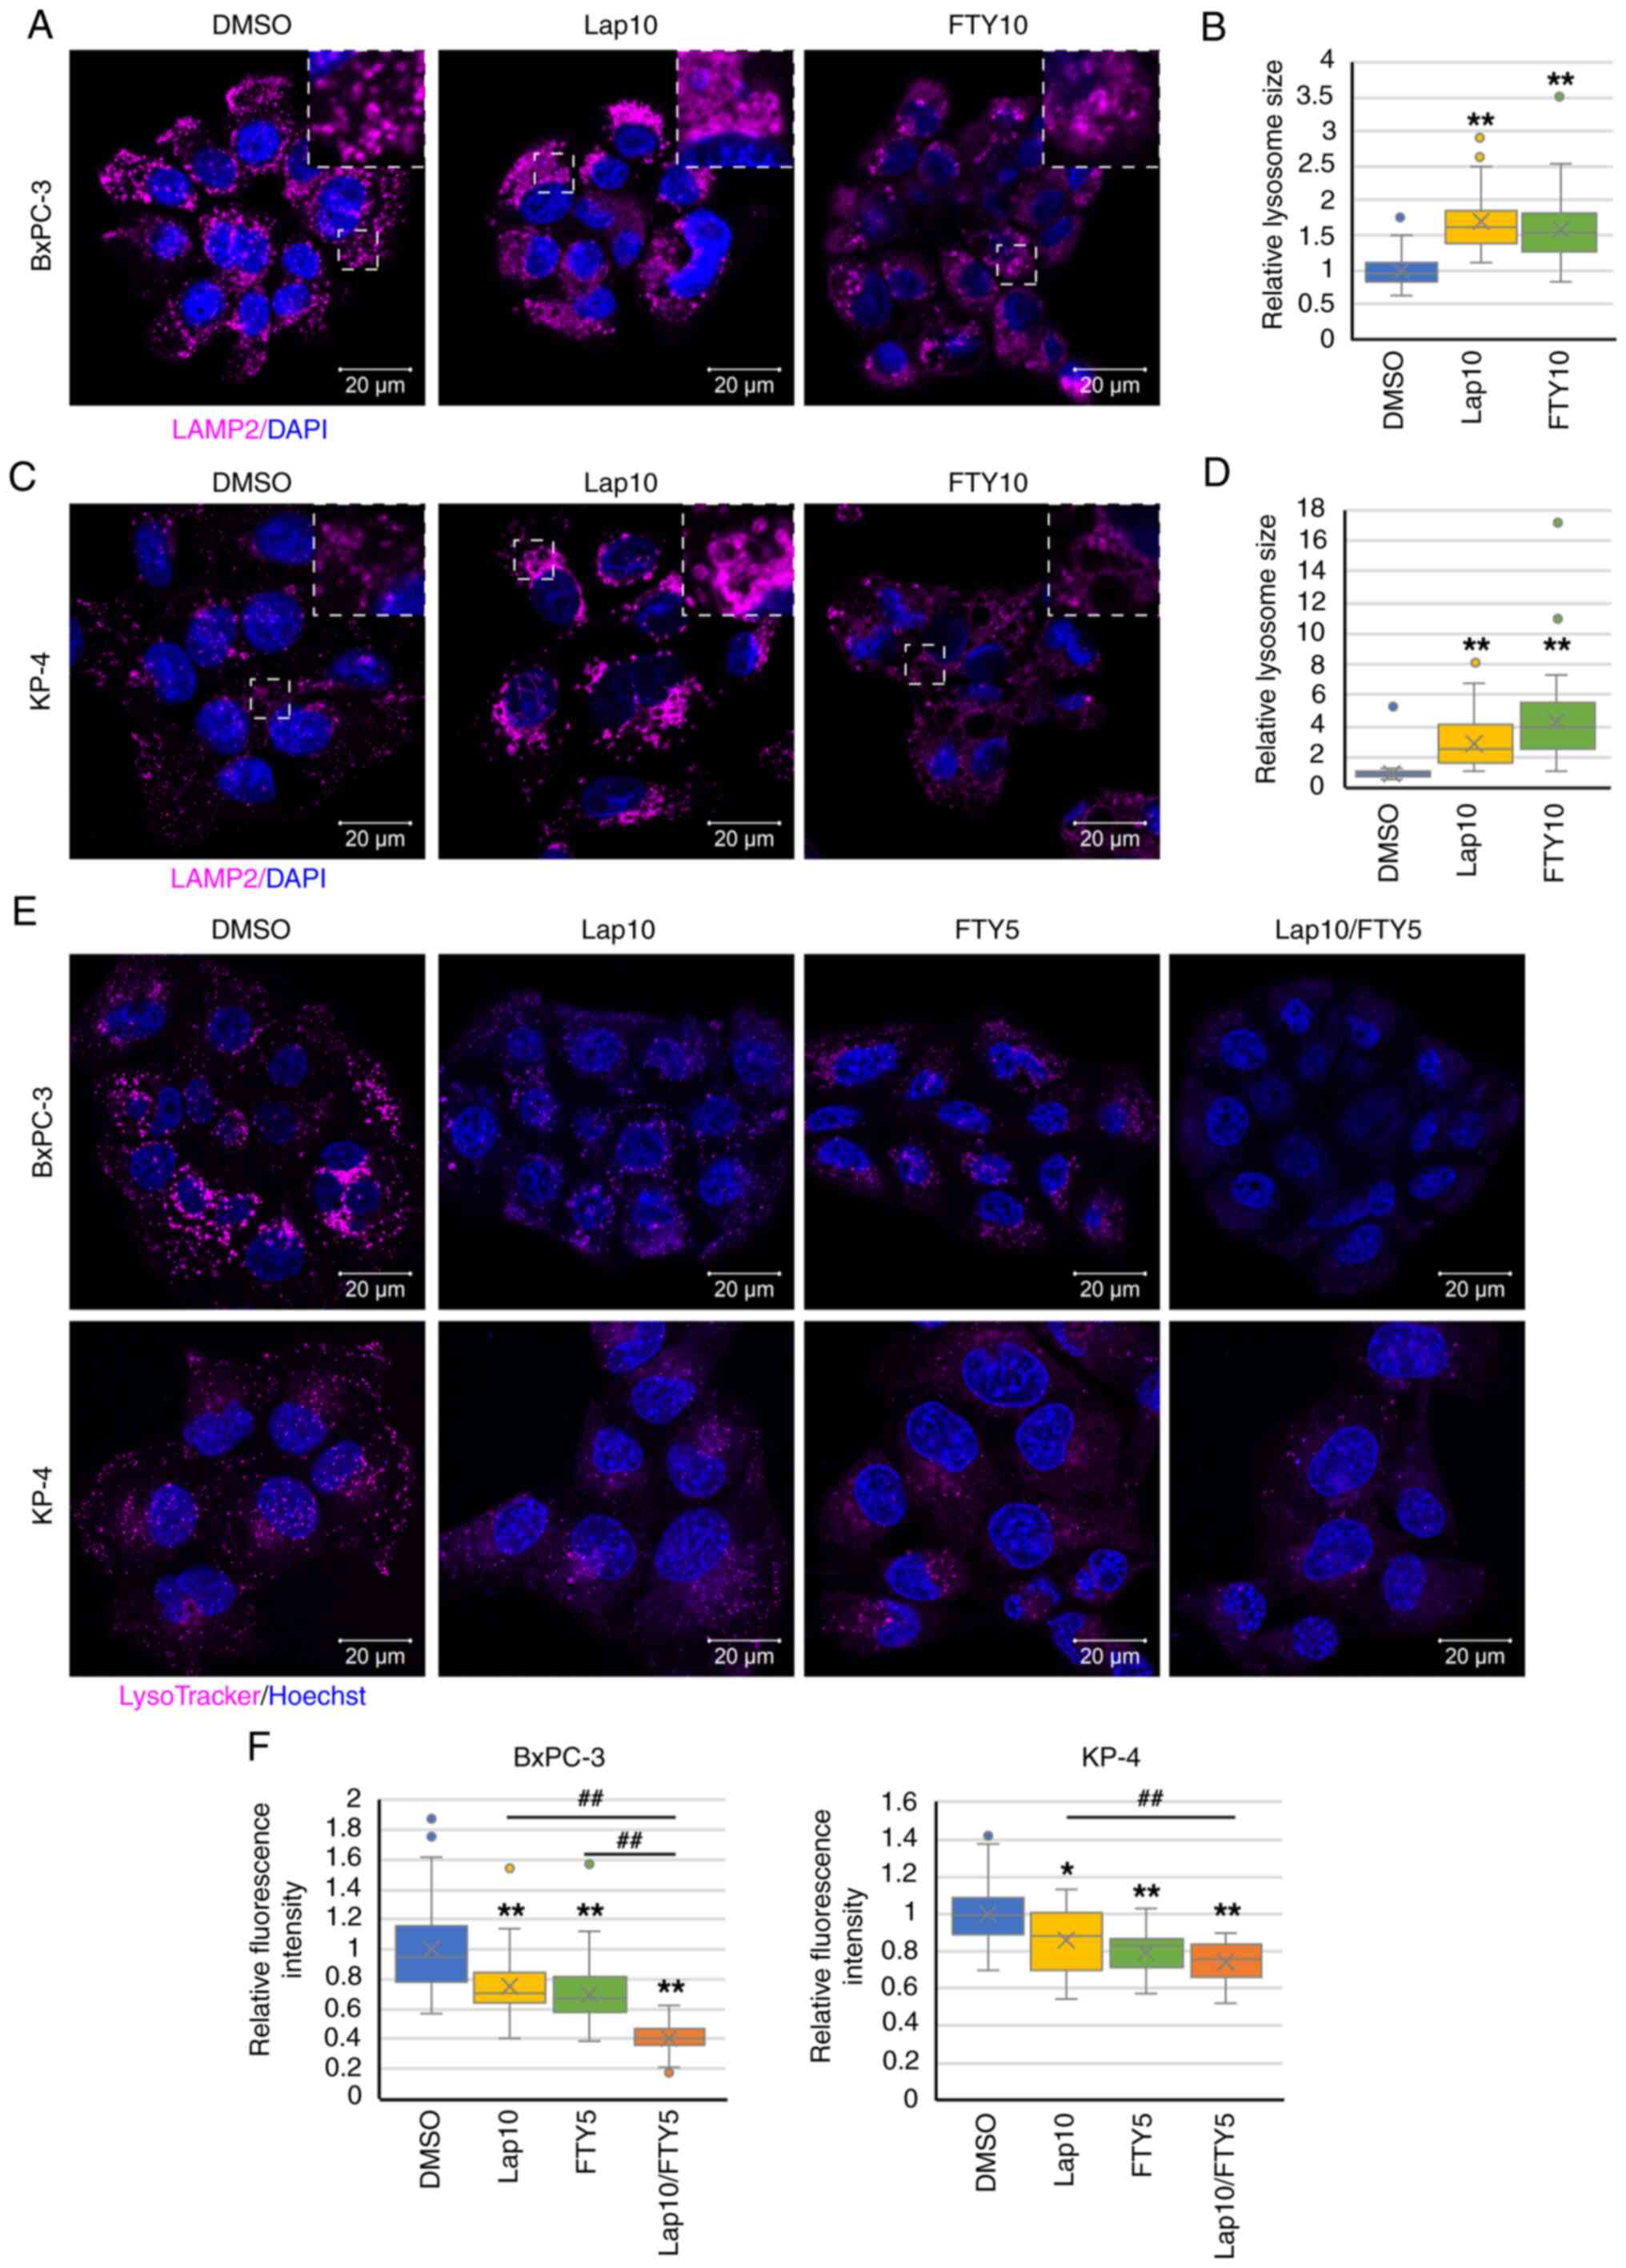 | Figure 4.Impact of Lap and FTY treatment on
lysosomal morphology and functions. (A) Immunofluorescence analysis
of LAMP2 (magenta) 10 h after treatment with Lap (10 µM) or FTY (10
µM) in BxPC-3 cells. Dashed boxed regions are shown at high
magnification in the inset. Scale bar, 20 µm. (B) Relative
lysosomal sizes in each condition of BxPC-3 cells from (A) are
shown. Data were analyzed using Kruskal-Wallis with Dunn's post hoc
test. The box extends from the lower to upper quartiles. The middle
line represents the median value. X indicates the mean value. The
whiskers represent the minimum to maximum values, except for
outliers, which are indicated by dots. n=50. **P<0.01 vs. DMSO.
(C) Immunofluorescence analysis of LAMP2 (magenta) 10 h after
treatment with Lap (10 µM) or FTY (10 µM) in KP-4 cells. Dashed
boxed regions are shown at high magnification in the inset. Scale
bar, 20 µm. (D) Relative lysosomal sizes in each condition of KP-4
cells from (C) are presented. Data were analyzed using
Kruskal-Wallis with Dunn's post hoc test. The box extends from the
lower to upper quartiles. The middle line represents the median
value. X indicates the mean value. The whiskers represent the
minimum to maximum values, except for outliers, which are indicated
by dots. n=50. **P<0.01 vs. DMSO. (E) LysoTracker staining
(magenta) 1 h after treatment with Lap (10 µM) and/or FTY (5 µM) in
BxPC-3 and KP-4 cells. Scale bar, 20 µm. (F) Relative mean
fluorescence intensities of LysoTracker in each condition of BxPC-3
and KP-4 cells from (E) are shown. Data were analyzed using
Kruskal-Wallis with Dunn's post hoc test. The box extends from the
lower to upper quartiles. The middle line represents the median
value. X indicates the mean value. The whiskers represent the
minimum to maximum values, except for outliers, which are indicated
by dots. BxPC-3, n=36; KP-4, n=23. *P<0.05 and **P<0.01 vs.
DMSO. ##P<0.01 vs. Lap10/FTY5. LAMP,
lysosome-associated membrane protein; Lap, lapatinib; FTY, FTY720;
DMSO, dimethyl sulfoxide. |
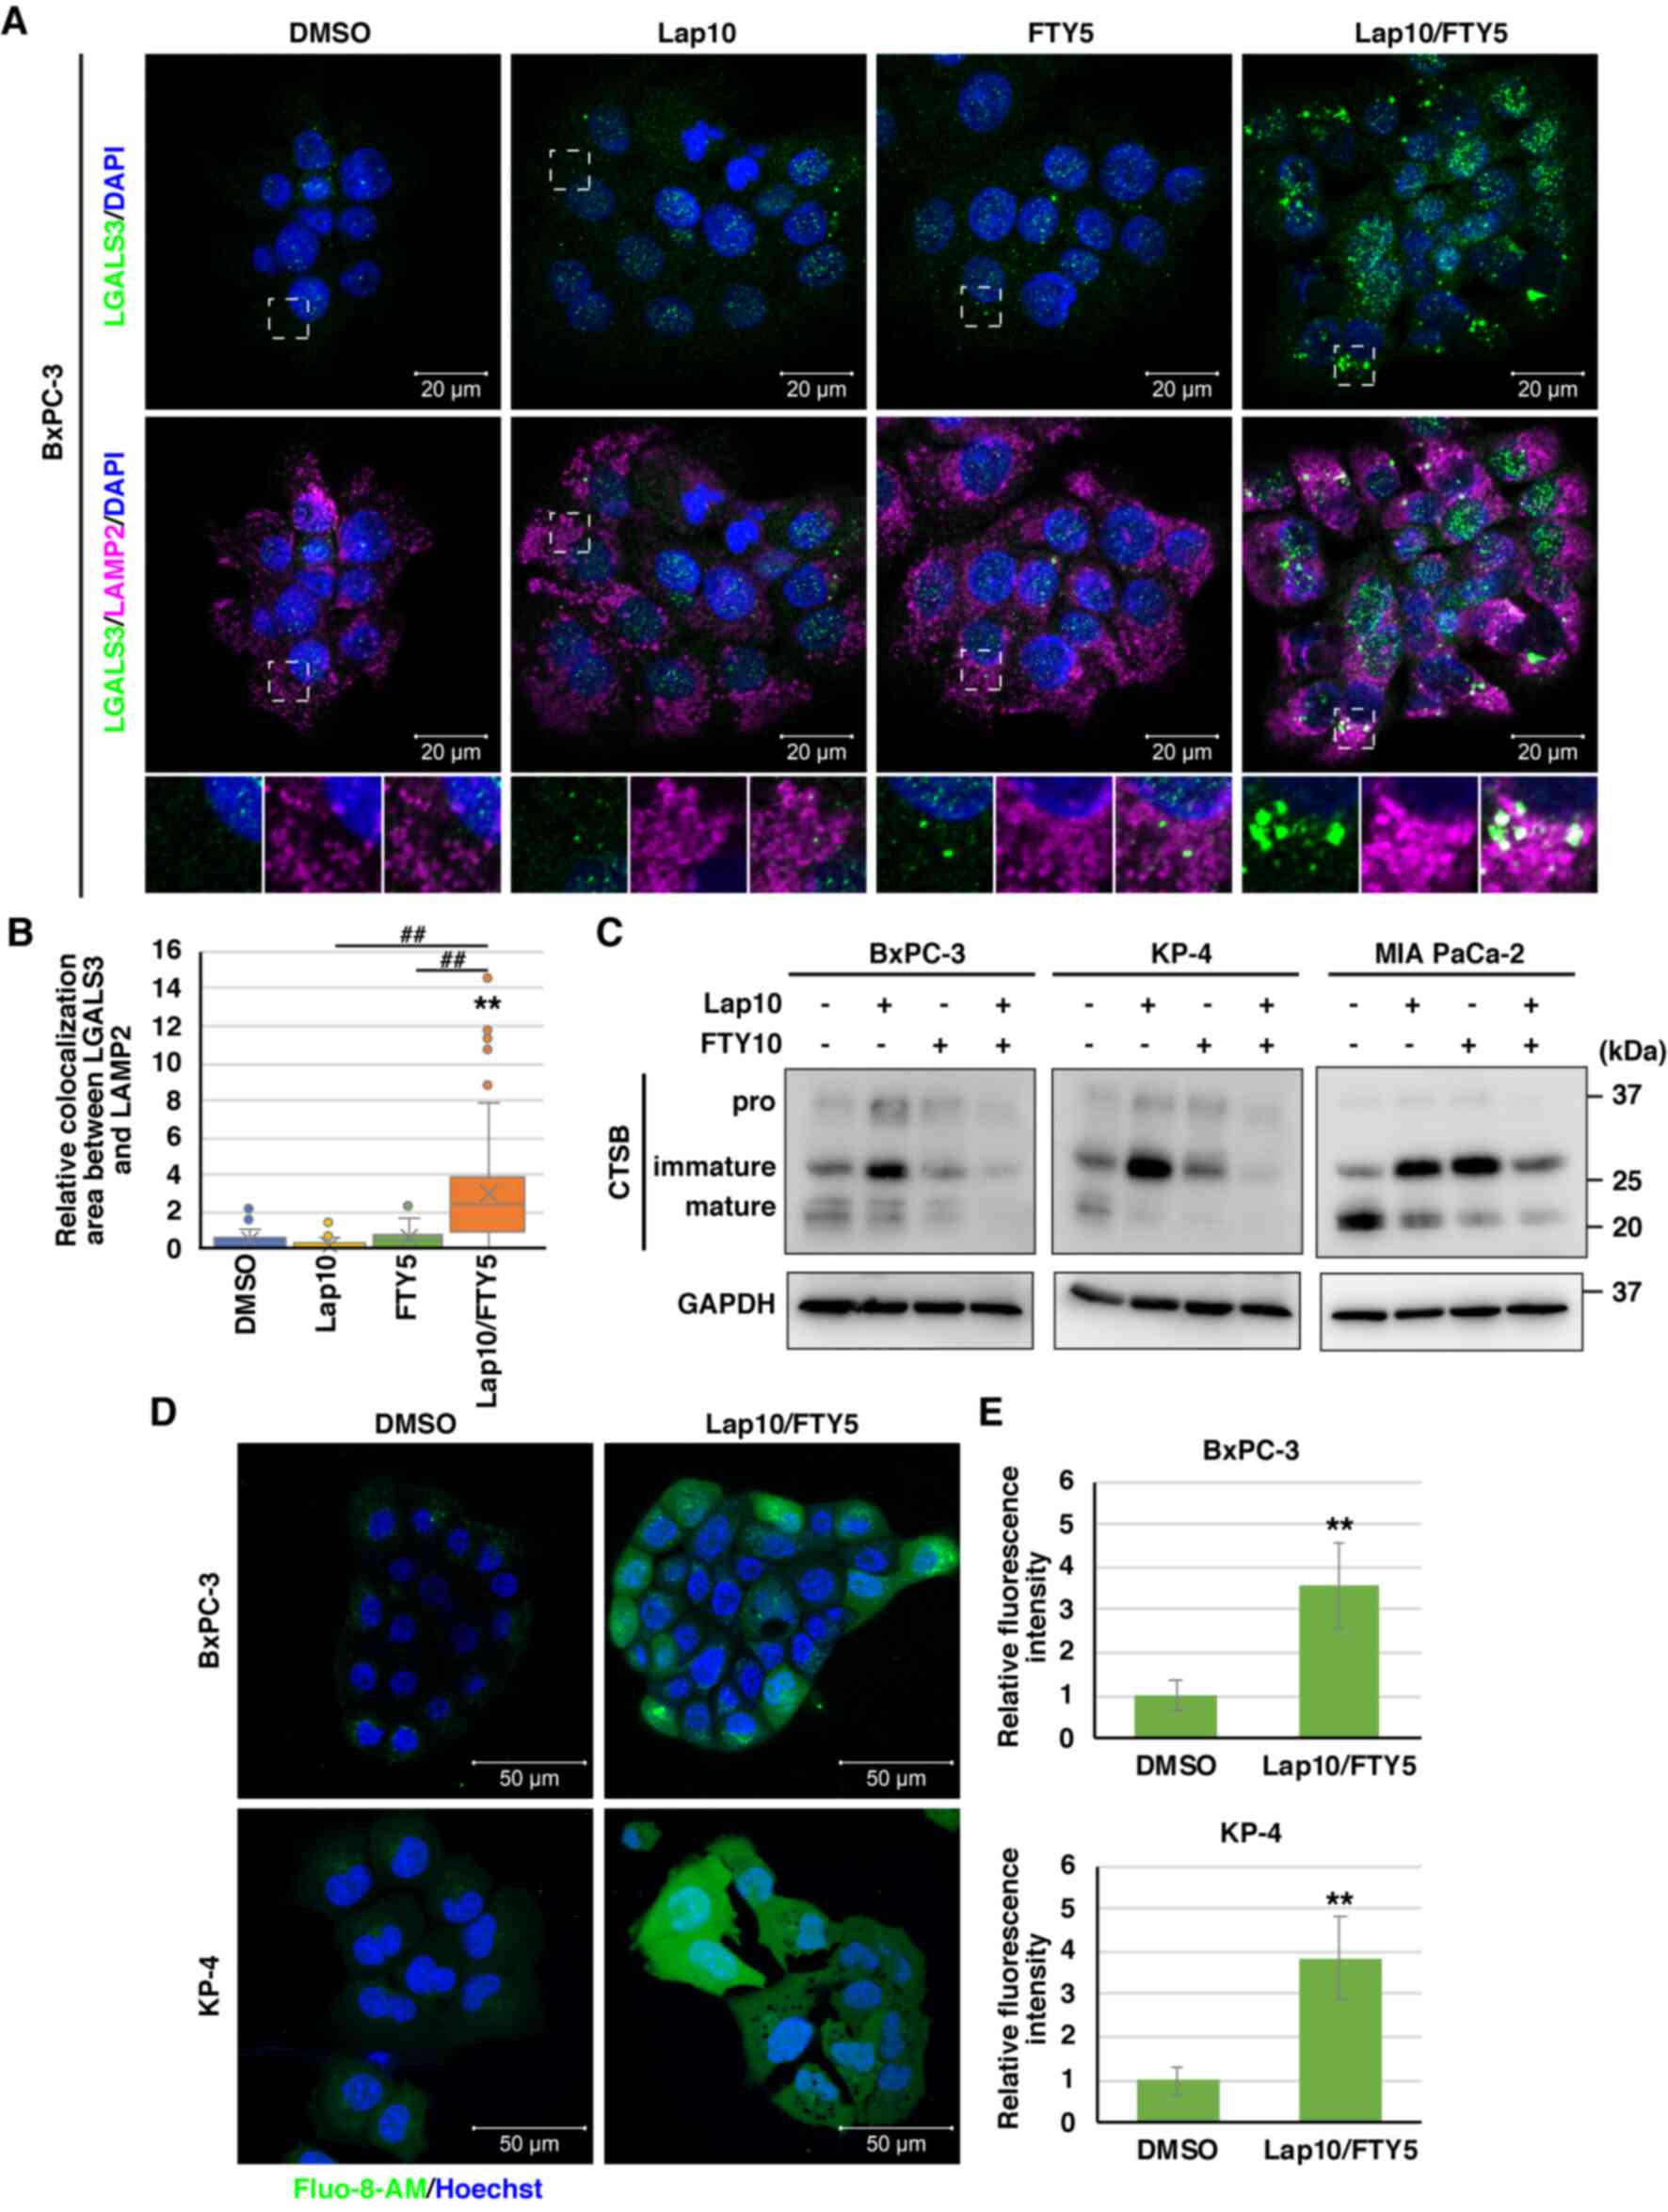 | Figure 5.Combination treatment with Lap and
FTY induces lysosomal membrane permeabilization. (A)
Immunofluorescence analysis of LAMP2 (magenta) and LGALS3 (green)
10 h after treatment with Lap (10 µM) and/or FTY (5 µM) in BxPC-3
cells. The dashed boxed regions are shown at high magnification at
the bottom. Scale bar, 20 µm. (B) Colocalization of fluorescence
between LGALS3 and LAMP2 in BxPC-3 cells from (A) was analyzed
using ImageJ. Data were analyzed using Kruskal-Wallis with Dunn's
post hoc test. The box extends from the lower to upper quartiles.
The middle line represents the median value. X indicates the mean
value. The whiskers represent the minimum to maximum values, except
for outliers, which are indicated by dots. n=26. **P<0.01 vs.
DMSO. ##P<0.01 vs. Lap 10 µM/FTY 5 µM. (C) Immunoblot
analysis of CTSB expression 24 h after treatment with Lap (10 µM)
and/or FTY (10 µM) in BxPC-3, KP-4 and MIA PaCa-2 cells. The
membrane for CTSB was stripped and reprobed for GAPDH as the
loading control. (D) Intracellular Ca2+ concentrations
were assessed 1 h after combination treatment with Lap (10 µM) and
FTY (5 µM) in BxPC-3 and KP-4 cells using Fluo-8-AM (green). Scale
bar, 50 µm. (E) Relative mean fluorescence intensities of Fluo-8-AM
in BxPC-3 and KP-4 cells from (D) are presented. Data were analyzed
using an unpaired two-tailed Student's t-test. Data are presented
as the mean ± standard deviation, BxPC-3, n=5; KP-4, n=4.
**P<0.01 vs. DMSO. LAMP, lysosome-associated membrane protein;
CTSB, cathepsin B; Lap, lapatinib; FTY, FTY720; LGALS3, galectin-3;
Ca2+, calcium. |
Combination treatment with lapatinib
and FTY720 induces mitochondrial depolarization and ER stress in
PDAC cells
Intracellular Ca2+ is exchanged among
organelles, including lysosomes, mitochondria and the ER (52). Therefore, LMP and subsequent
disturbance of intracellular Ca2+ homeostasis following
combination treatment with lapatinib and FTY720 could indirectly
impact additional organelles, including mitochondria and the ER.
Considering mitochondria, immunofluorescence staining of COX IV, a
mitochondrial inner membrane protein, was reduced and fragmented
after combination treatment with lapatinib and FTY720 (Fig. 6A and B). In addition, to examine
mitochondrial membrane potential, JC-1 dye was used, which displays
fluorescence changes from green to red (magenta) depending on the
mitochondrial membrane potential and reduced red/green fluorescence
intensity in depolarized mitochondria. Combination treatment
resulted in mitochondrial depolarization, a hallmark of damaged
mitochondria (53,54), in a time-dependent manner (Fig. 6C and D).
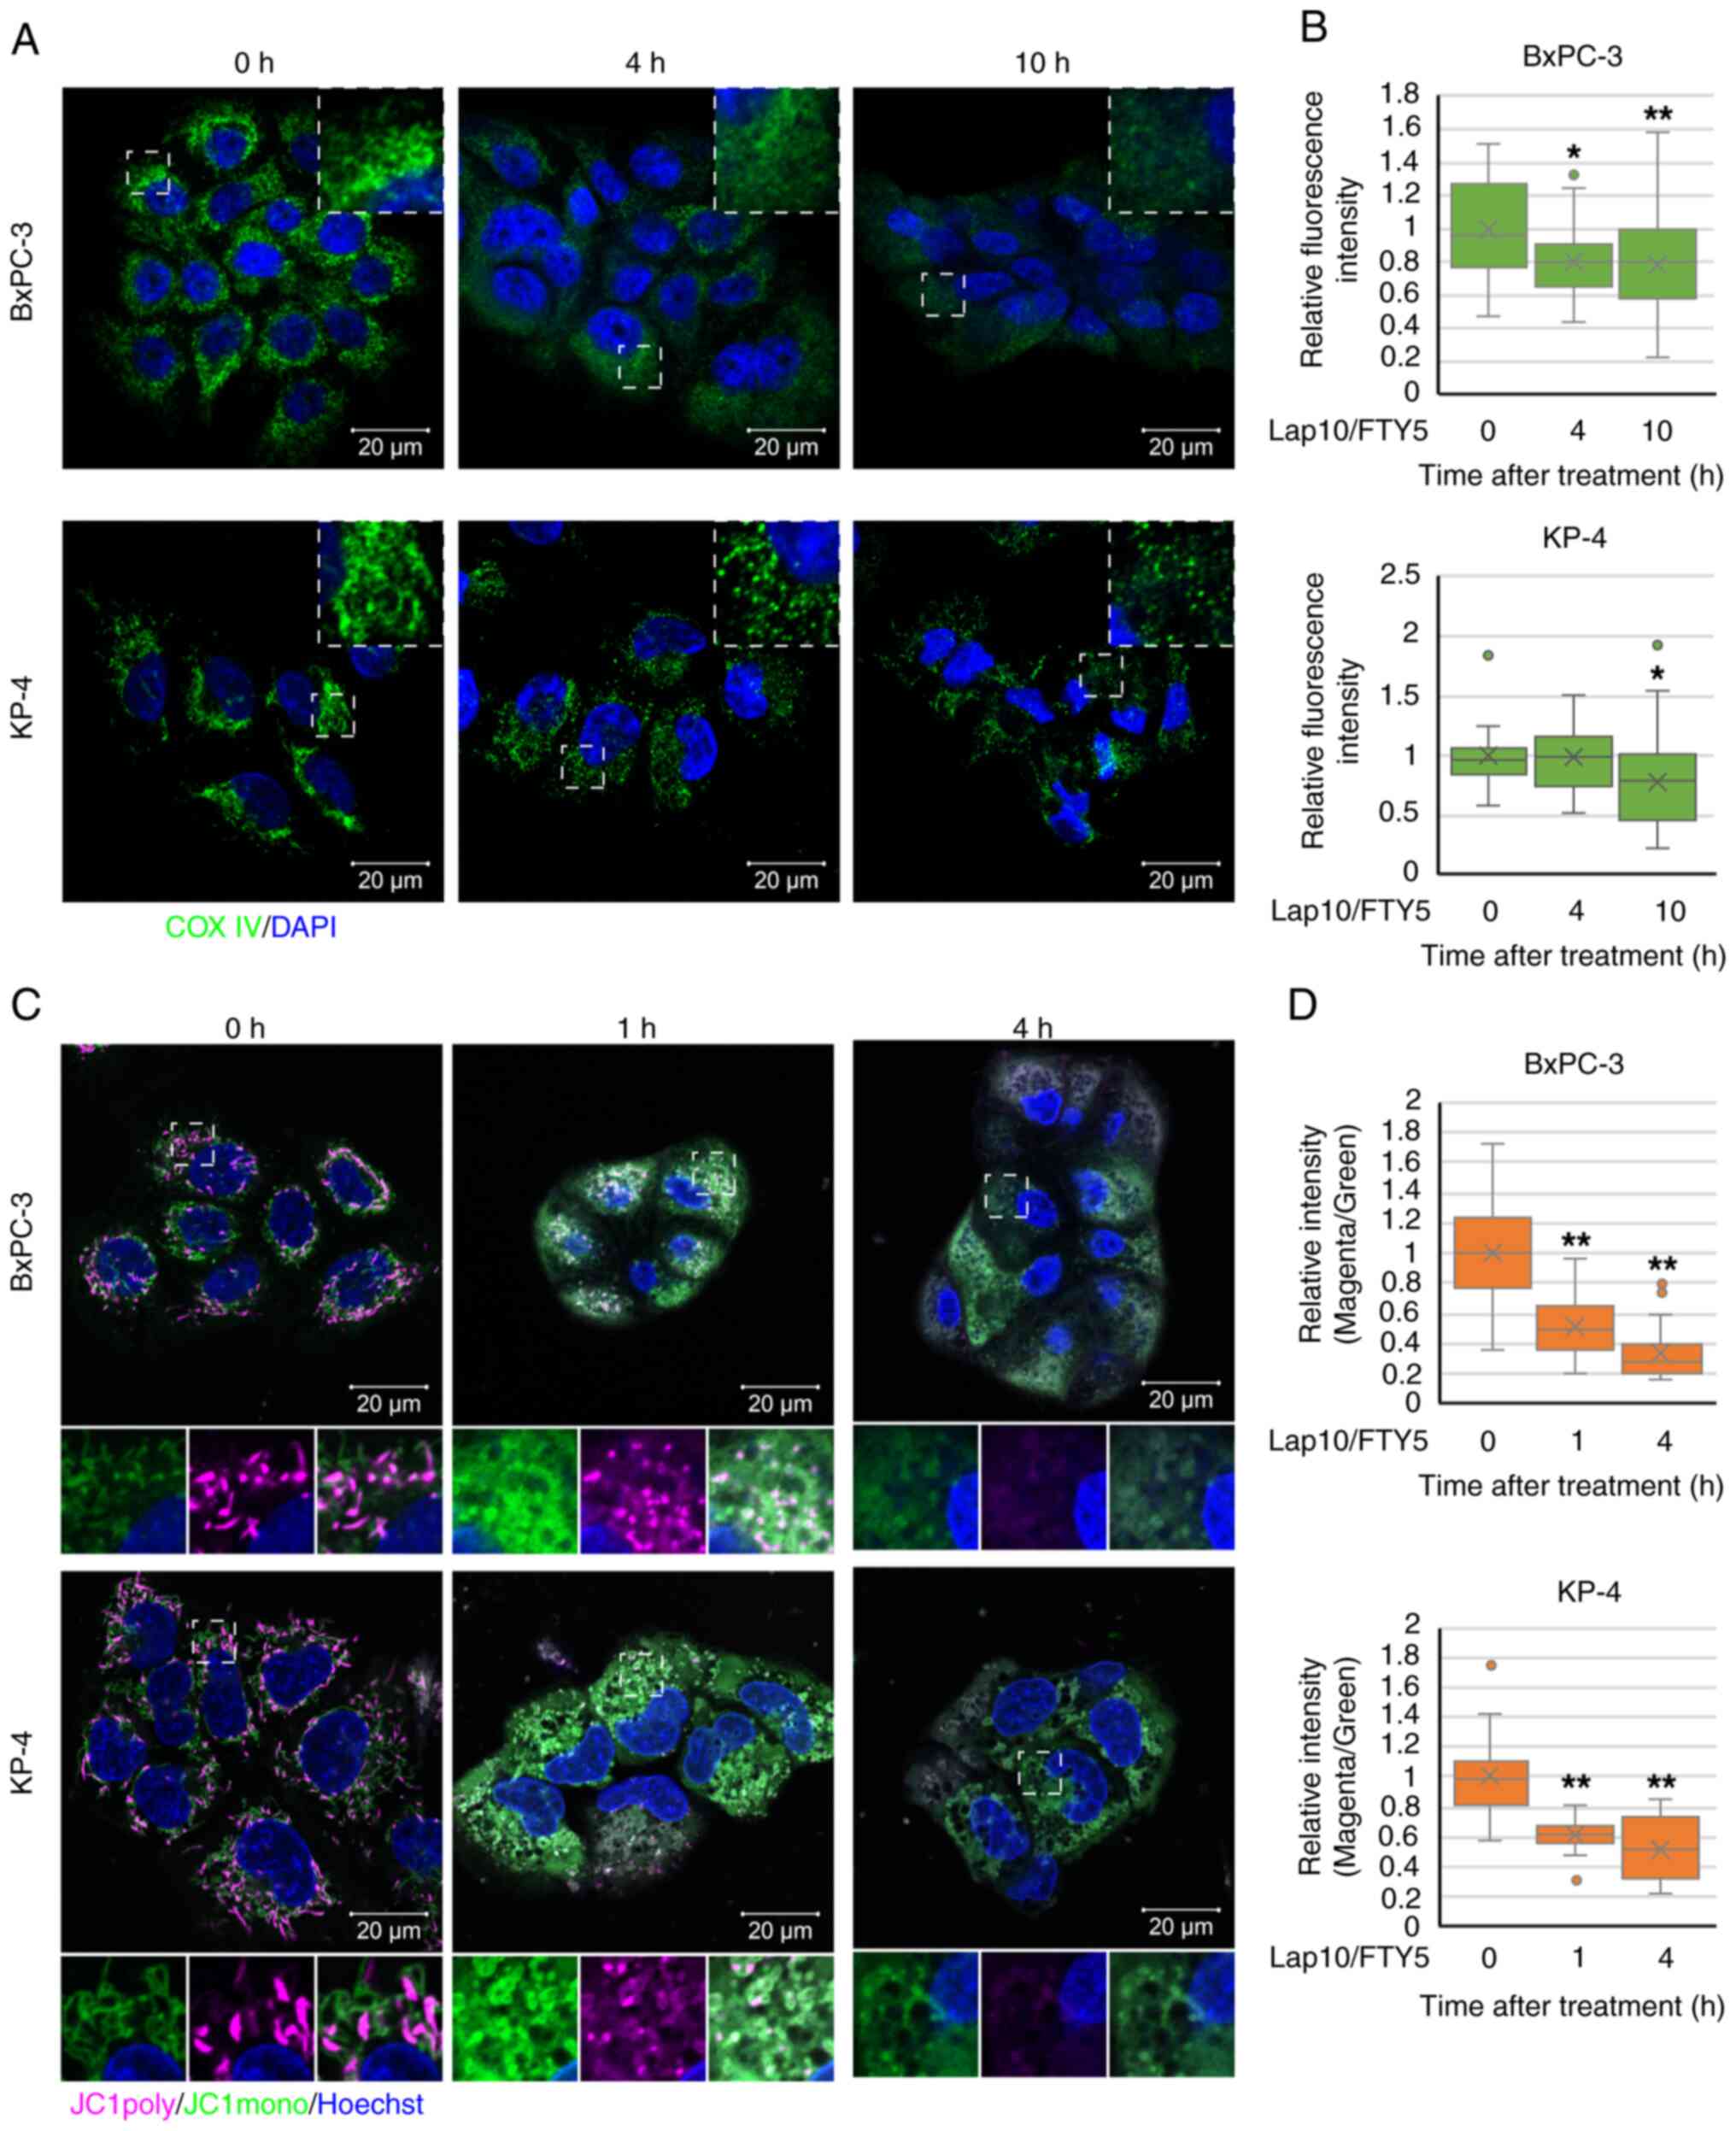 | Figure 6.Impact of combination treatment with
Lap and FTY on mitochondria. (A) Immunofluorescence analysis of COX
IV (green) at indicated time points (0, 4 and 10 h) following
combination treatment with Lap (10 µM) and FTY (5 µM) in BxPC-3 and
KP-4 cells. Dashed boxed regions are shown at high magnification in
the inset. Scale bar, 20 µm. (B) Relative mean fluorescence
intensities of COX IV at each time point for BxPC-3 and KP-4 cells
from (A) are shown. Data were analyzed using Kruskal-Wallis with
Dunn's post hoc test. The box extends from the lower to upper
quartiles. The middle line represents the median value. X indicates
the mean value. The whiskers represent the minimum to maximum
values, except for outliers, which are indicated by dots. BxPC-3,
n=37; KP-4, n=19. *P<0.05 and **P<0.01 vs. 0 h. (C)
Mitochondrial membrane potential was assessed 1 and 4 h after
combination treatment with Lap (10 µM) and FTY (5 µM) in BxPC-3 and
KP-4 cells using JC-1 (magenta and green). Scale bar, 20 µm. (D)
Relative mean fluorescence intensities (magenta/green) of JC-1 in
BxPC-3 and KP-4 cells from (C) are presented. Data were analyzed
using Kruskal-Wallis with Dunn's post hoc test. The box extends
from the lower to upper quartiles. The middle line represents the
median value. X indicates the mean value. The whiskers represent
the minimum to maximum values, except for outliers, which are
indicated by dots. BxPC-3, n=31; KP-4, n=26. **P<0.01 vs. 0 h.
COX IV, cytochrome c oxidase subunit 4; Lap, lapatinib; FTY,
FTY720. |
Meanwhile, 10 h after combination treatment with
lapatinib and FTY720, this study detected marked accumulation of
CALR, a Ca2+-binding chaperone protein in the ER,
suggesting the induction of ER stress (Fig. 7A and B). In addition, combination
treatment altered the fluorescence staining of TGOLN2, a marker
protein for the trans-Golgi network (55,56),
which plays an important role in vesicular trafficking from the ER
to other organelles (57).
Furthermore, combination treatment reduced the fluorescence
kurtosis of TGOLN2, indicating the disruption of the cisternal
structure of the trans-Golgi network (Fig. S10A and B). Furthermore, expression
of DDIT3, an ER stress-associated gene, was upregulated in
response to individual treatment with lapatinib or FTY720 and was
significantly enhanced following combination treatment with
lapatinib and FTY720 (Fig. 7C).
Additionally, real-time ER stress monitoring analysis, based on the
splicing of XBP1 mRNA and detection of the fluorescence intensity
of expressed XBP1-Venus, revealed that combination treatment with
lapatinib and FTY720 increased ER stress loading after 6 h of
treatment (Fig. 7D). Collectively,
these findings indicated that combination treatment with lapatinib
and FTY720 induced mitochondrial damage and ER stress in PDAC cells
exhibiting LMP induction.
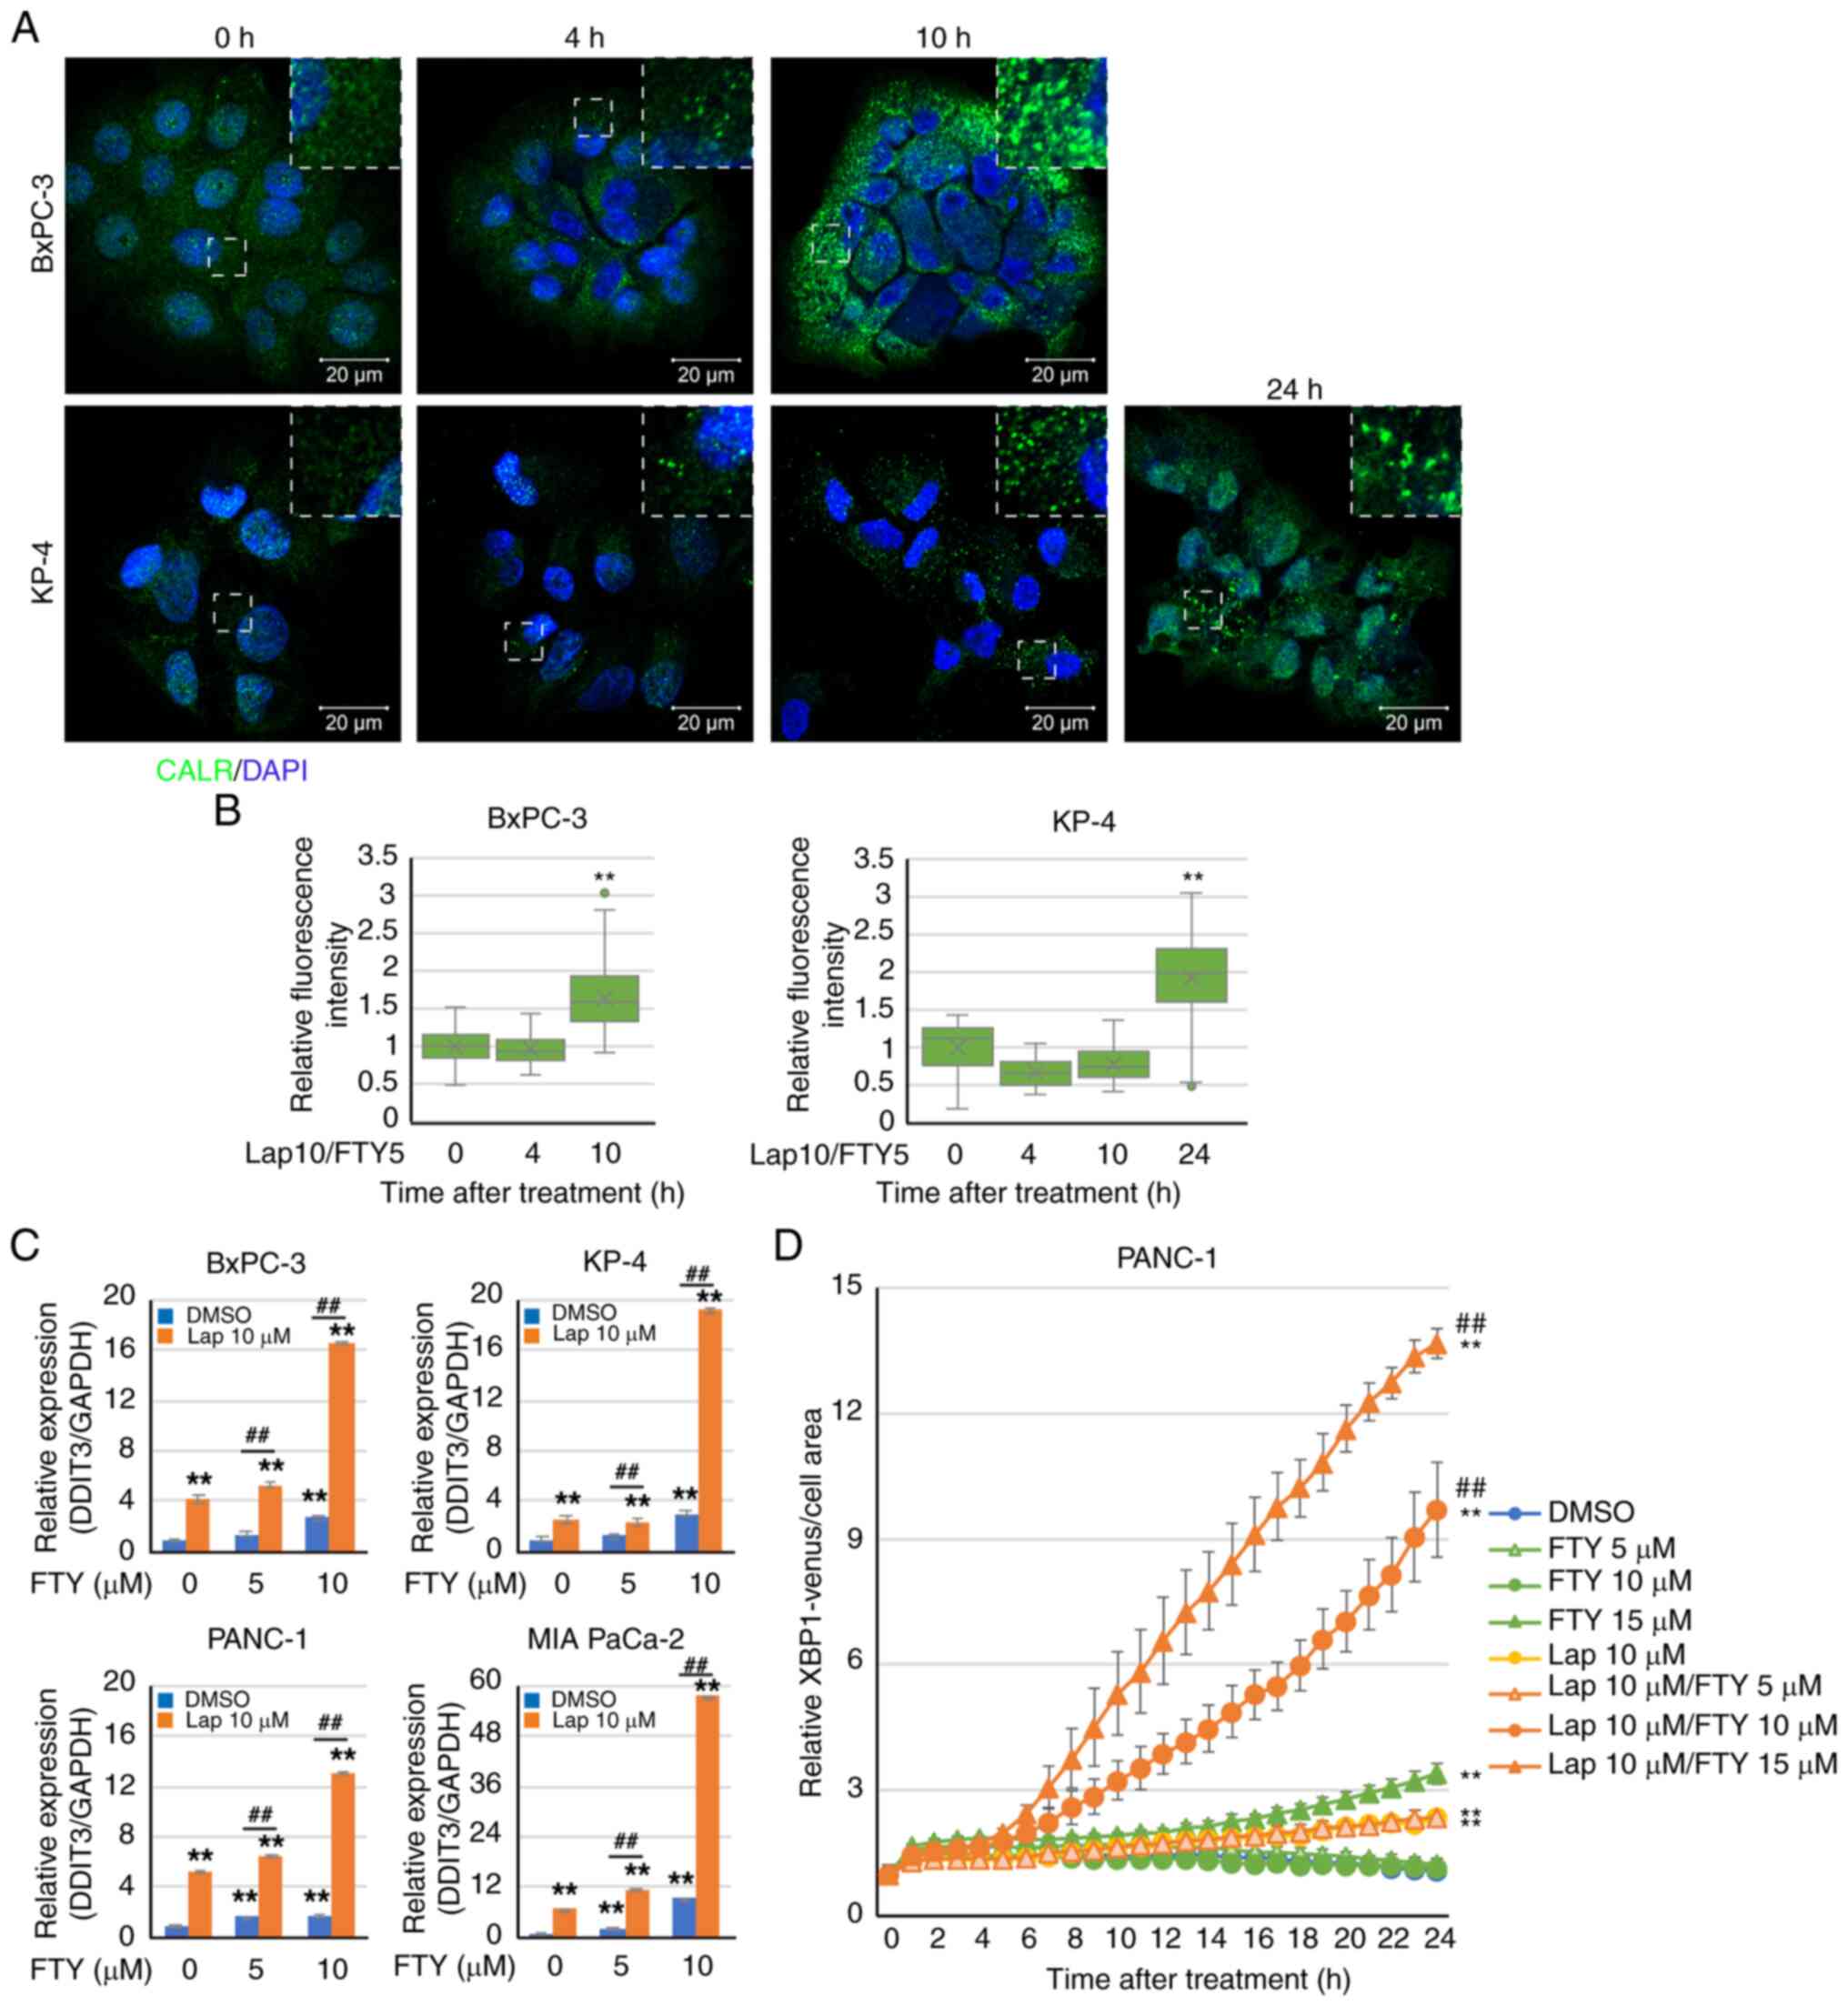 | Figure 7.Impact of combination treatment with
Lap and FTY on the endoplasmic reticulum. (A) Immunofluorescence
analysis of CALR (green) at indicated time points (0, 4, 10 and 24
h) after combination treatment with Lap (10 µM) and FTY (5 µM) in
BxPC-3 and KP-4 cells. Dashed boxed regions are shown at high
magnification in the inset. Scale bar, 20 µm. (B) Relative mean
fluorescence intensities of CALR at each time point in BxPC-3 and
KP-4 cells from (A) are shown. Data were analyzed using
Kruskal-Wallis with Dunn's post hoc test. The box extends from the
lower to upper quartiles. The middle line represents the median
value. X indicates the mean value. The whiskers represent the
minimum to maximum values, except for outliers, which are indicated
by dots. BxPC-3, n=37; KP-4, n=19. **P<0.01 vs. 0 h. (C) BxPC-3,
KP-4, PANC-1 and MIA PaCa-2 cells were treated with Lap and/or FTY
for 24 h. DDIT3 expression was determined via quantitative PCR and
normalized to GAPDH. Data were analyzed using one-way ANOVA
followed by Tukey's post hoc test. Data are presented as the mean ±
standard deviation, n=4. **P<0.01 vs. FTY 0 µM/Lap 0 µM.
##P<0.01 vs. DMSO. (D) PANC-1/XBP1-Venus cells were
treated with Lap and/or FTY. The fluorescence intensities derived
from XBP1-Venus were monitored over 24 h. Data were analyzed using
two-way ANOVA followed by Bonferroni's post hoc test. Data are
presented as the mean ± standard deviation, n=4. **P<0.01 vs.
DMSO. ##P<0.01 vs. Lap 10 µM. CALR, calreticulin;
Lap, lapatinib; FTY, FTY720; DMSO, dimethyl sulfoxide; DDIT3, DNA
damage inducible transcript 3. |
Combination treatment with
lysosome-targeted drugs elicits pronounced cytotoxic effects in
PDAC cells
These data indicated that combination treatment with
lapatinib and FTY720 effectively induced death in PDAC cells. To
further clarify the efficacy of the lysosome-targeted drug
combination, abemaciclib, an FDA-approved anticancer drug that
inhibits CDK4/6, and lapatinib, instead of FTY720, were
co-administered. We have previously reported that abemaciclib
causes lysosomal swelling, induces LMP and increases intracellular
Ca2+ in A549 cells and MCF-7 human breast cancer cells
(58). Abemaciclib inhibits CDK4/6
activity and cell proliferation at sub-micromolar concentrations,
inducing lysosomal dysfunction and cell death at micromolar
concentrations (58). In the
present study, it was observed that the growth inhibitory effect of
lapatinib on PDAC cells was significantly enhanced following
coadministration with abemaciclib (Fig. 8A-D), as well as after combined
treatment with FTY720 (Fig. 1).
Likewise, the growth inhibitory effect of lapatinib on PDAC cells
was significantly enhanced after coadministration with the
FDA-approved drug HCQ, which is known to induce the potent
basification of lysosomes (59,60)
(Fig. 8E and F). In addition,
coadministration of abemaciclib and FTY720 or abemaciclib and HCQ
enhanced the growth inhibitory effect on PDAC cells (Fig. S11A-D). Coadministration of
lapatinib and abemaciclib or lapatinib and HCQ also induced cell
death (Fig. 8G-J). Moreover,
coadministration of lapatinib and abemaciclib or lapatinib and HCQ
reduced LysoTracker staining (Fig.
9A-D), increased the colocalization of LGALS3 and LAMP2
(Fig. 9E-H) and enhanced the
intracellular Ca2+ concentration in BxPC-3 cells
(Fig. 9I-L), as observed following
coadministration of lapatinib and FTY720. These results further
suggested that the combination of lysosome-targeted drugs elicits
pronounced cytotoxic effects on PDAC cells.
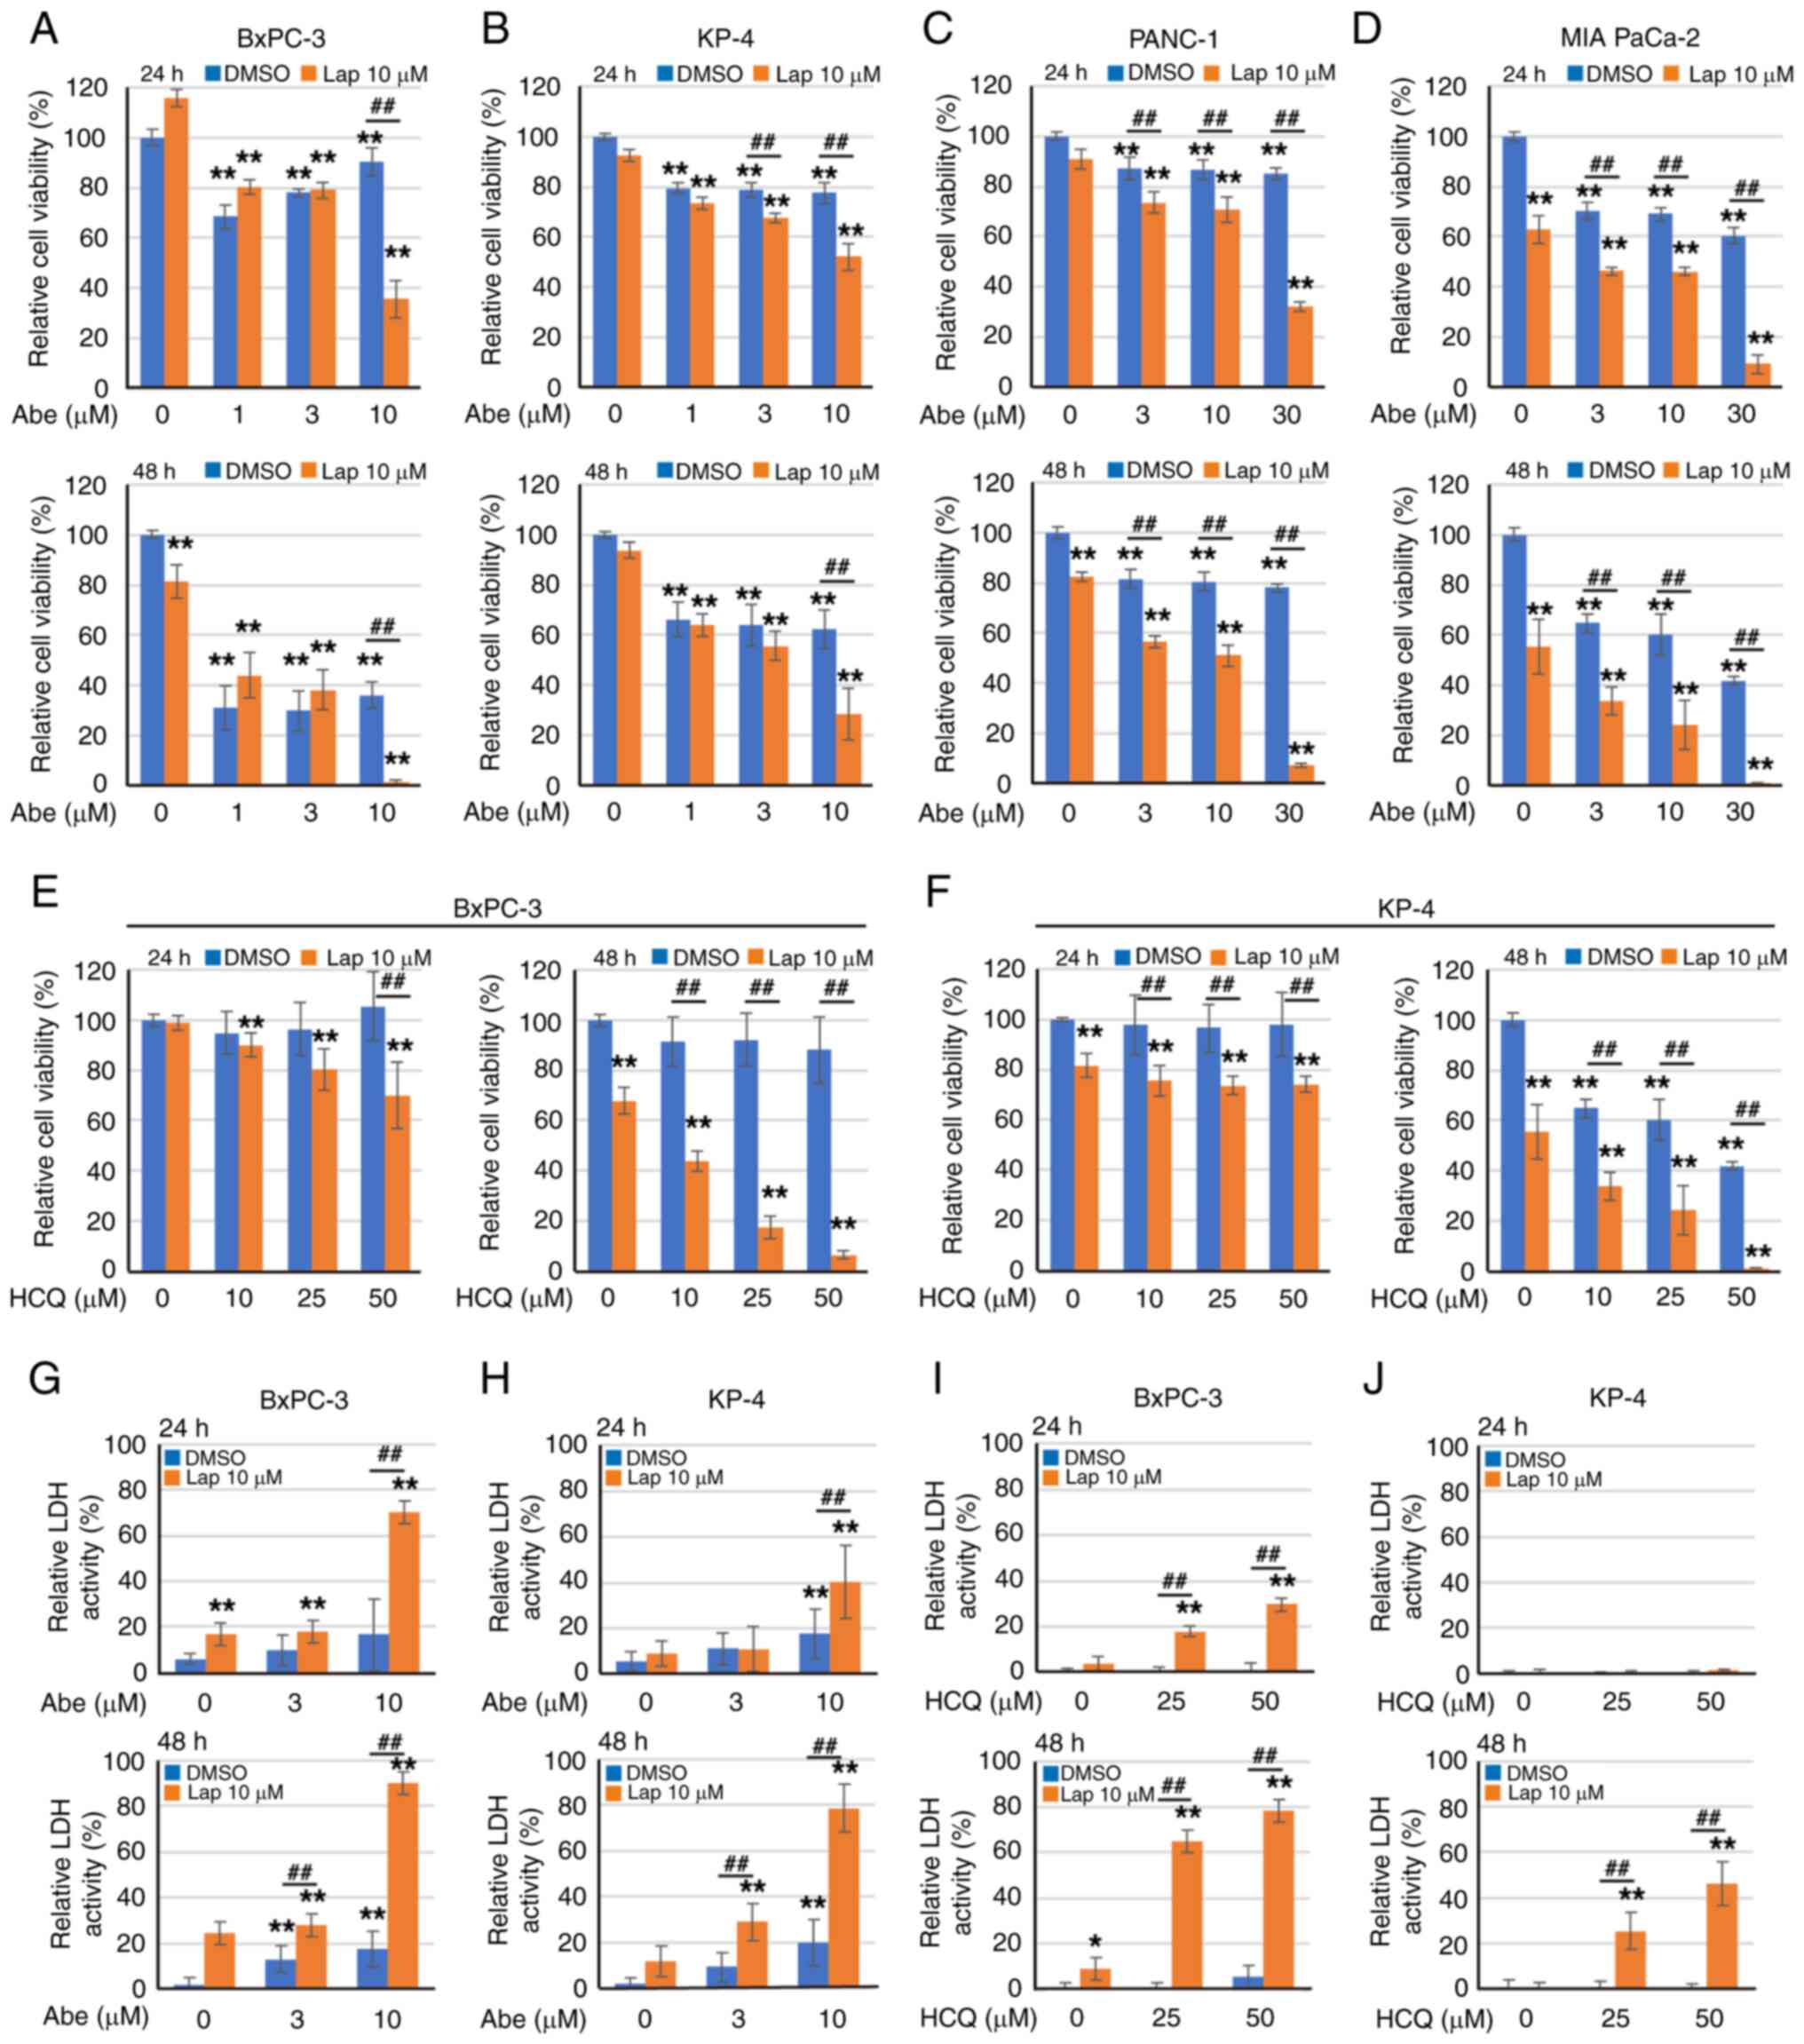 | Figure 8.Cytotoxic activity of the
lysosome-targeted drug combination in pancreatic ductal
adenocarcinoma cells. (A-D) Cell viability was assessed 24 and 48 h
after treatment with Lap and/or Abe in (A) BxPC-3, (B) KP-4, (C)
PANC-1 and (D) MIA PaCa-2 cells. Data were analyzed using one-way
ANOVA followed by Tukey's post hoc test. Data are presented as the
mean ± standard deviation, n=6. **P<0.01 vs. Abe 0 µM/Lap 0 µM.
##P<0.01 vs. DMSO. (E and F) Cell viability was
assessed 24 and 48 h after treatment with Lap and/or HCQ in (E)
BxPC-3 and (F) KP-4 cells. Data were analyzed using one-way ANOVA
followed by Tukey's post hoc test. Data are presented as the mean ±
standard deviation, n=6. **P<0.01 vs. HCQ 0 µM/Lap 0 µM.
##P<0.01 vs. DMSO. (G and H) Cytotoxicity was
assessed at 24 and 48 h following treatment with Lap and/or Abe
using the LDH release assay in (G) BxPC-3 and (H) KP-4 cells. Data
were analyzed using one-way ANOVA followed by Tukey's post hoc
test. Data are shown as the mean ± standard deviation, n=6.
**P<0.01 vs. Abe 0 µM/Lap 0 µM. ##P<0.01 vs. DMSO.
(I and J) Cytotoxicity was assessed at 24 and 48 h following
treatment with Lap and/or HCQ using the LDH release assay in (I)
BxPC-3 and (J) KP-4 cells. Data were analyzed using one-way ANOVA
followed by Tukey's post hoc test. Data are shown as the mean ±
standard deviation, n=6. *P<0.05 and **P<0.01 vs. HCQ 0
µM/Lap 0 µM. ##P<0.01 vs. DMSO. Lap, lapatinib; FTY,
FTY720; DMSO, dimethyl sulfoxide; HCQ, hydroxychloroquine; Abe,
abemaciclib; LDH, lactate dehydrogenase. |
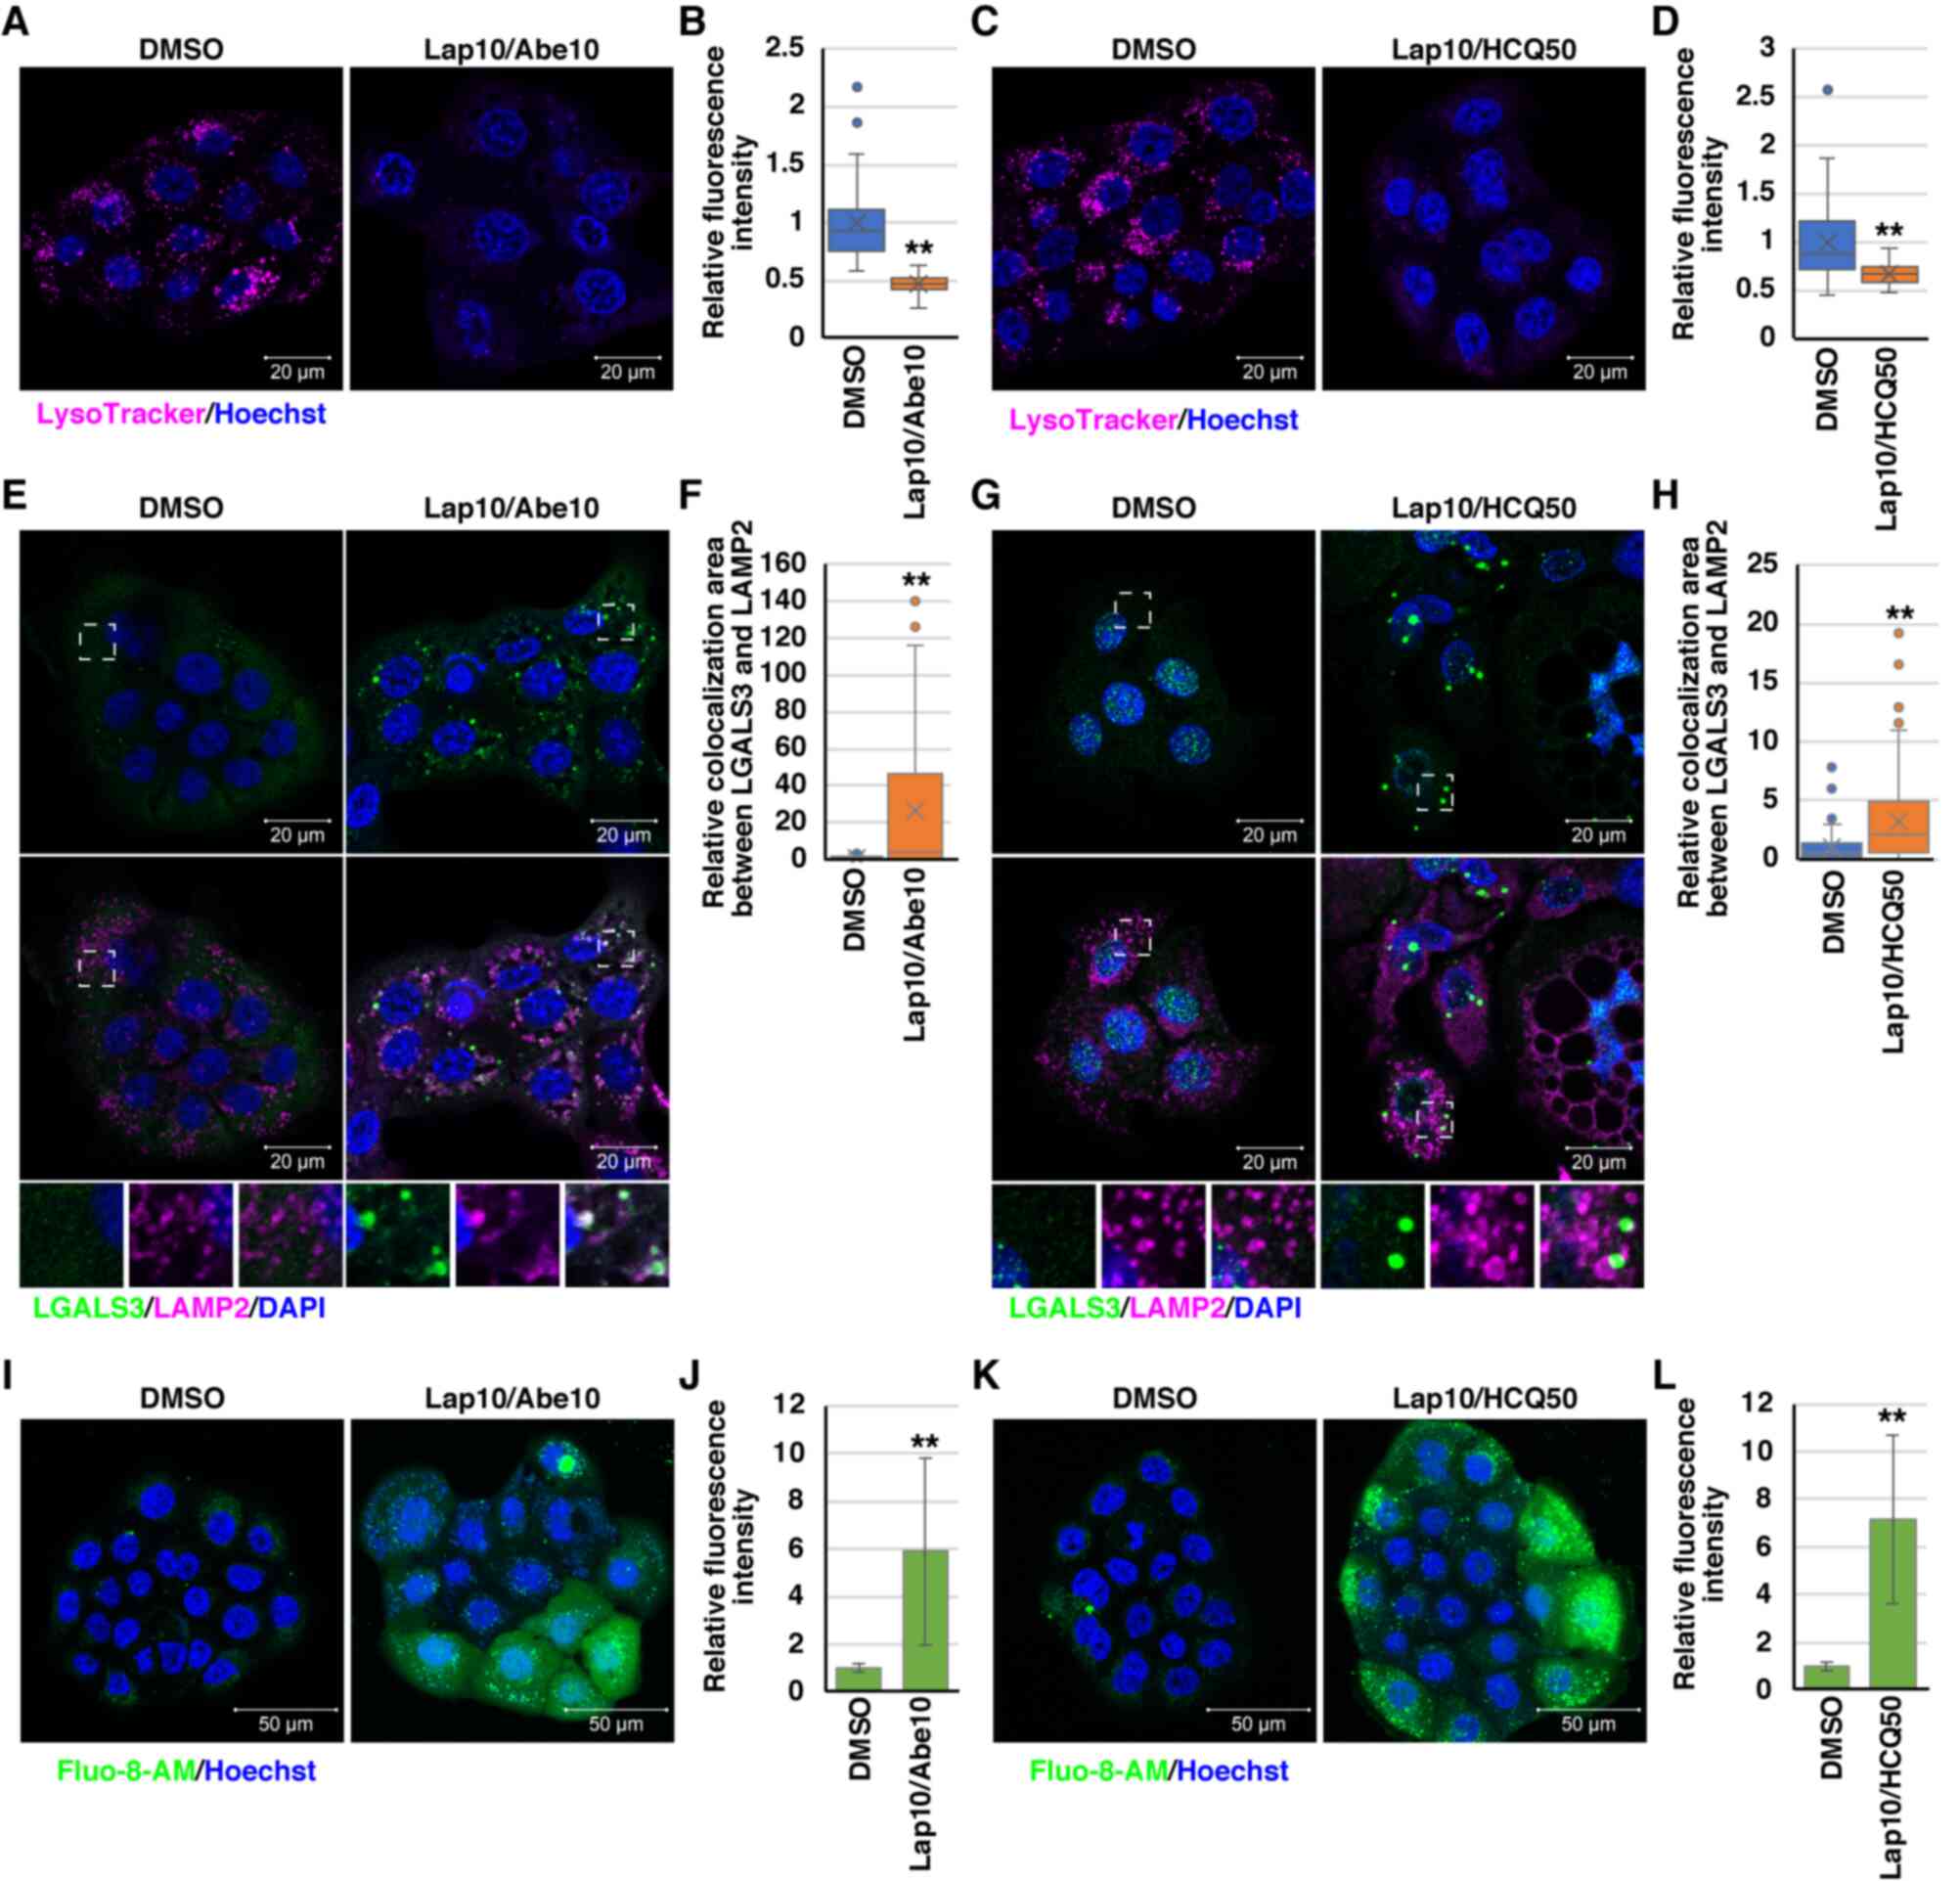 | Figure 9.Impact of the lysosome-targeted drug
combination on lysosomes in pancreatic ductal adenocarcinoma cells.
(A) LysoTracker staining (magenta) 1 h after treatment with Lap (10
µM) and Abe (10 µM) in BxPC-3 cells. Scale bar, 20 µm. (B) Relative
mean fluorescence intensities of LysoTracker in each condition of
BxPC-3 cells from (A) are shown. Data were analyzed using Mann
Whitney U test. The box extends from the lower to upper quartiles.
The middle line represents the median value. X indicates the mean
value. The whiskers represent the minimum to maximum values, except
for outliers, which are indicated by dots. n=33. **P<0.01 vs.
DMSO. (C) LysoTracker staining (magenta) 1 h after treatment with
Lap (10 µM) and HCQ (50 µM) in BxPC-3 cells. Scale bar, 20 µm. (D)
Relative mean fluorescence intensities of LysoTracker in each
condition of BxPC-3 cells from (C) are shown. Data were analyzed
using Mann Whitney U test. The box extends from the lower to upper
quartiles. The middle line represents the median value. X indicates
the mean value. The whiskers represent the minimum to maximum
values, except for outliers, which are indicated by dots. n=32.
**P<0.01 vs. DMSO. (E) Immunofluorescence analysis of LAMP2
(magenta) and LGALS3 (green) 10 h after treatment with Lap (10 µM)
and Abe (10 µM) in BxPC-3 cells. The dashed boxed regions are shown
at high magnification at the bottom. Scale bar, 20 µm. (F)
Colocalization of fluorescence between LGALS3 and LAMP2 in BxPC-3
cells from (E) was analyzed using ImageJ. Data were analyzed using
Mann Whitney U test. The box extends from the lower to upper
quartiles. The middle line represents the median value. X indicates
the mean value. The whiskers represent the minimum to maximum
values, except for outliers, which are indicated by dots. n=76.
**P<0.01 vs. DMSO. (G) Immunofluorescence analysis of LAMP2
(magenta) and LGALS3 (green) 10 h after treatment with Lap (10 µM)
and HCQ (50 µM) in BxPC-3 cells. The dashed boxed regions are shown
at high magnification at the bottom. Scale bar, 20 µm. (H) The
colocalization of fluorescence between LGALS3 and LAMP2 in BxPC-3
cells from (G) was analyzed using ImageJ. Data were analyzed using
Mann Whitney U test. The box extends from the lower to upper
quartiles. The middle line represents the median value. X indicates
the mean value. The whiskers represent the minimum to maximum
values, except for outliers, which are indicated by dots. n=92.
**P<0.01 vs. DMSO. (I) Intracellular Ca2+
concentrations were assessed 1 h after combination treatment with
Lap (10 µM) and Abe (10 µM) in BxPC-3 cells using Fluo-8-AM
(green). Scale bar, 50 µm. (J) Relative mean fluorescence
intensities of Fluo-8-AM in BxPC-3 cells from (I) are presented.
Data were analyzed using an unpaired two-tailed Student's t-test.
Data are presented as the mean ± standard deviation, n=18.
**P<0.01 vs. DMSO. (K) Intracellular Ca2+
concentrations were assessed 1 h after combination treatment with
Lap (10 µM) and HCQ (50 µM) in BxPC-3 cells using Fluo-8-AM
(green). Scale bar, 50 µm. (L) Relative mean fluorescence
intensities of Fluo-8-AM in BxPC-3 cells from (K) are presented.
Data were analyzed using an unpaired two-tailed Student's t-test.
Data are presented as the mean ± SD, n=12. **P<0.01 vs. DMSO.
Lap, lapatinib; Abe, abemaciclib; DMSO, dimethyl sulfoxide; HCQ,
hydroxychloroquine; LAMP2, lysosome-associated membrane protein 2;
LGALS3, galectin-3; Ca2+, calcium. |
Lysosomal cholesterol accumulation
suppresses non-canonical cell death induced by combination
treatment with lapatinib and FTY720 in PDAC cells
To determine whether lysosomal dysfunction can be
directly attributed to non-canonical death and multiple organelle
dysfunctions in PDAC cells, the effects of U18666A, which can
reportedly strengthen lysosomal membrane by accumulating
cholesterol in the lysosomal membrane (61,62),
were analyzed. U18666A-induced cholesterol accumulation was
confirmed by filipin staining in KP-4 cells (Fig. S12A). In PDAC cells, the growth
inhibitory effect of combination treatment with lapatinib and
FTY720 was effectively suppressed by U18666A (Fig. S12B-D). In addition, U18666A
restored the reduced LysoTracker staining after combination
treatment with lapatinib and FTY720 in KP-4 cells (Fig. 10A and B). In BxPC-3 cells, U18666A
did not restore the decreased LysoTracker staining after
combination treatment with lapatinib and FTY720 and failed to
suppress the growth inhibitory effect of the combination treatment
(Fig. S12E-G). In KP-4 cells,
U18666A suppressed the increased intracellular Ca2+
concentration and mitochondrial depolarization after combination
treatment with lapatinib and FTY720 (Fig. 10C-F). Additionally, real-time ER
stress monitoring analysis revealed that U18666A suppressed the
increase in ER stress after combination treatment with lapatinib
and FTY720 in PANC-1 cells (Fig.
10G). Furthermore, U18666A effectively suppressed cell death
induced by combination treatment with lapatinib and FTY720 in PDAC
cells (Figs. 10H and I and
S12H). These results suggested
that the combination of lysosome-targeted drugs induces
mitochondrial and ER dysfunction and non-canonical death in PDAC
cells, at least in part, directly due to lysosomal dysfunction
(Fig. S13).
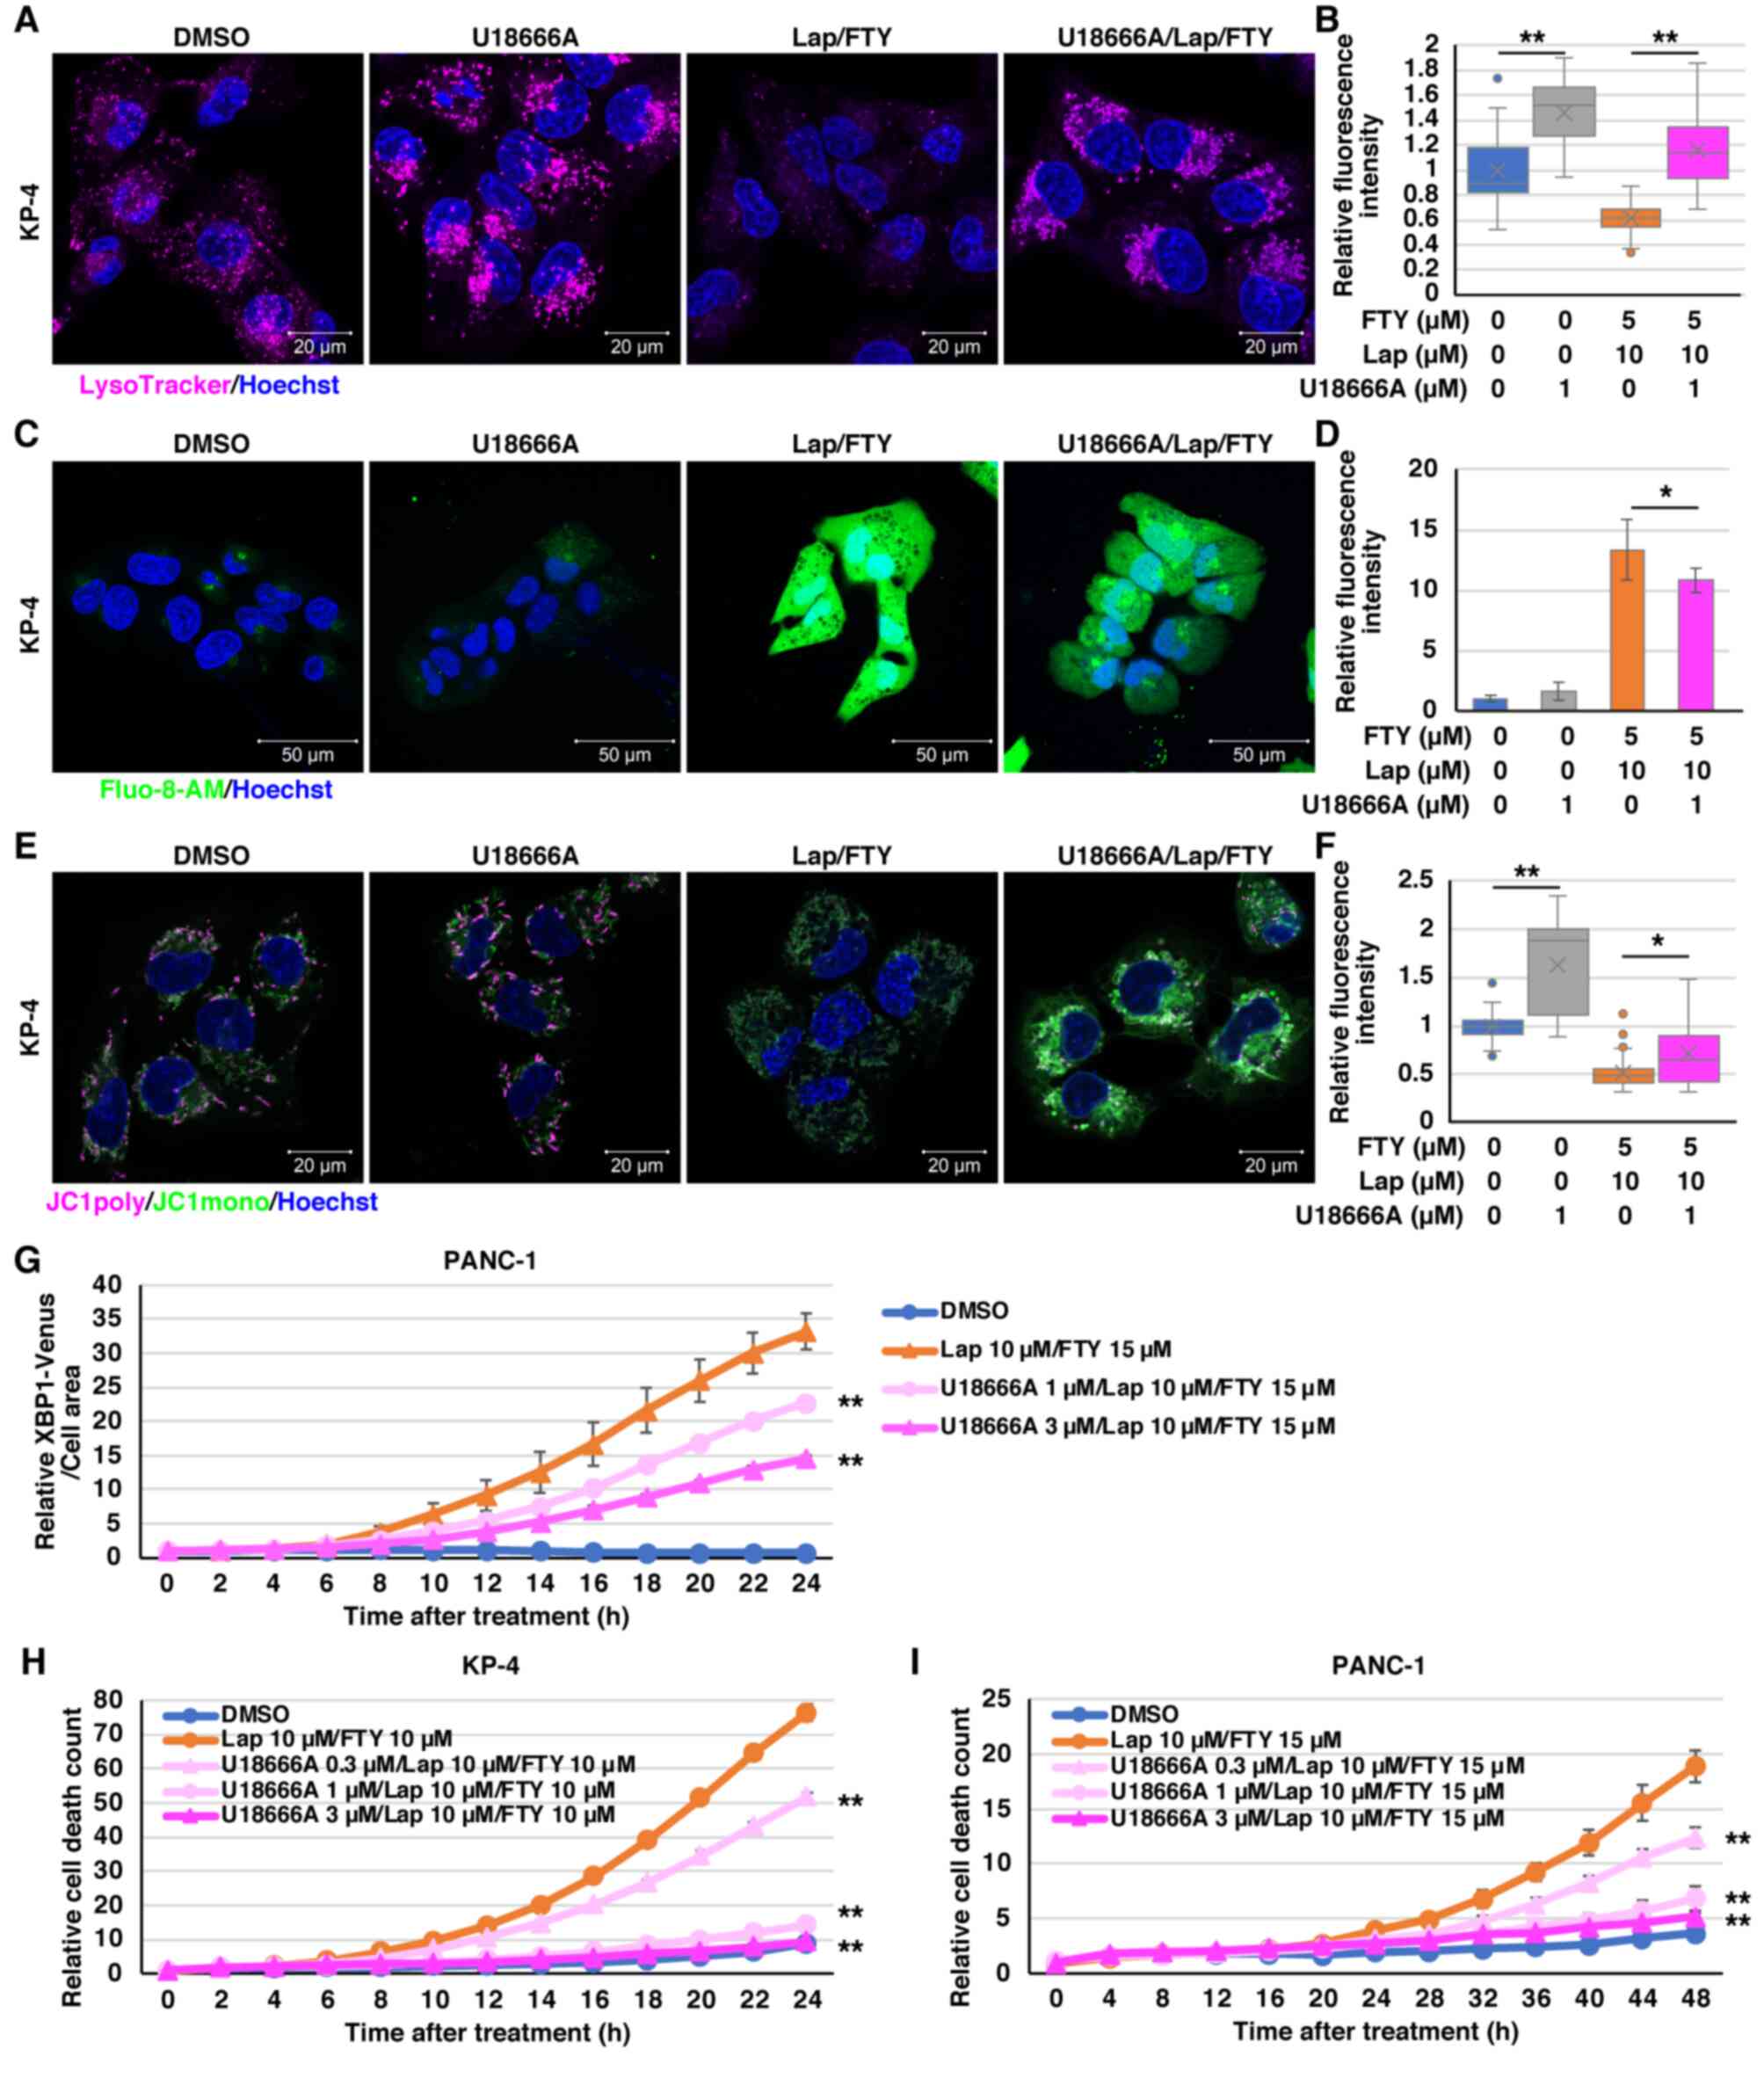 | Figure 10.U18666A mitigates the effects of
combination treatment with Lap and FTY in pancreatic ductal
adenocarcinoma cells. (A) LysoTracker staining (magenta) 1 h after
treatment with Lap (10 µM) and FTY (5 µM) in the presence (1 µM) or
absence of U18666A in KP-4 cells. Scale bar, 20 µm. (B) Relative
mean fluorescence intensities of LysoTracker in each condition of
KP-4 cells from (A) are shown. Data were analyzed using
Kruskal-Wallis with Dunn's post hoc test. The box extends from the
lower to upper quartiles. The middle line represents the median
value. X indicates the mean value. The whiskers represent the
minimum to maximum values, except for outliers, which are indicated
by dots. n=23. **P<0.01 vs. U18666A 0 µM. (C) Intracellular
Ca2+ concentrations were assessed 1 h after treatment
with Lap (10 µM) and FTY (5 µM) in the presence (1 µM) or absence
of U18666A in KP-4 cells using Fluo-8-AM (green). Scale bar, 50 µm.
(D) Relative mean fluorescence intensities of Fluo-8-AM in KP-4
cells from (C) are presented. Data were analyzed using one-way
ANOVA followed by Tukey's post hoc test. Data are presented as the
mean ± standard deviation, n=6. *P<0.05 vs. U18666A 0 µM. (E)
Mitochondrial membrane potential was assessed 1 h after treatment
with Lap (10 µM) and FTY (5 µM) in the presence (1 µM) or absence
of U18666A in KP-4 cells using JC-1 (magenta and green). Scale bar,
20 µm. (F) Relative mean fluorescence intensities (magenta/green)
of JC-1 in KP-4 cells from (E) are presented. Data were analyzed
using Kruskal-Wallis with Dunn's post hoc test. The box extends
from the lower to upper quartiles. The middle line represents the
median value. X indicates the mean value. The whiskers represent
the minimum to maximum values, except for outliers, which are
indicated by dots. n=32. *P<0.05 and **P<0.01 vs. U18666A 0
µM. (G) PANC-1/XBP1-Venus cells were treated with Lap (10 µM) and
FTY (15 µM) in the presence (1 or 3 µM) or absence of U18666A. The
fluorescence intensities derived from XBP1-Venus were monitored
over 24 h. Data were analyzed using two-way ANOVA followed by
Bonferroni's post hoc test. Data are presented as the mean ±
standard deviation, n=4. **P<0.01 vs. Lap 10 µM/FTY 15 µM. (H
and I) The PI fluorescence intensity obtained from dead cells was
monitored following combination treatment with Lap and FTY in the
presence (0.3, 1 or 3 µM) or absence of U18666A in (H) KP-4 and (I)
PANC-1 cells. Data were analyzed using two-way ANOVA followed by
Bonferroni's post hoc test. Data are presented as the mean ±
standard deviation, n=4. (H) **P<0.01 vs. Lap 10 µM/FTY 10 µM,
(I) **P<0.01 vs. Lap 10 µM/FTY 15 µM. Lap, lapatinib; FTY,
FTY720; DMSO, dimethyl sulfoxide; Ca2+, calcium. |
Discussion
In the present study, the findings revealed that
FTY720, an FDA-approved drug for multiple sclerosis, could enhance
the cytotoxic effect of lapatinib in various PDAC cell lines.
Apoptosis, necroptosis and autophagic cell death were not
determined as major factors mediating cell death induced by
combination treatment with lapatinib and FTY720 in PDAC cells,
albeit with partial contributions. Furthermore, ROS involvement in
cell death depended on the examined cell line and was not
considered a common key factor. Combination treatment with
lapatinib and FTY720 enhanced LMP, subsequently inducing
mitochondrial depolarization, ER stress and DNA damage, thus
resulting in non-canonical death in PDAC cells. The enhanced
cytotoxic effect of lapatinib on PDAC cells was exerted in
combination with FTY720, abemaciclib or HCQ, indicating that a
lysosome-targeted drug combination could be a useful therapeutic
strategy against pancreatic cancer. However, although the combined
effect of lapatinib and FTY720 was antagonistic in the
non-cancerous cell line LP101, its effect on normal cells needs to
be verified in an in vivo animal model.
Cationic amphiphilic drugs, known to contain a basic
moiety, exhibit lysosomotropism and accumulate within lysosomes
after drug protonation, often leading to LMP and lysosomal
dysfunction (63–66). Lapatinib has been identified as a
lysosomotropic compound using a high-content screening assay
(36). NBD-FTY720, a fluorescently
labeled FTY720 analog, has been shown to be mainly trapped in the
lysosomes of U251MG human glioma cells (28). Abemaciclib has been reported to
behave similarly to palbociclib, which can be trapped in the
lysosomes of SK-Mel-103 human melanoma cells (67). Previously, we reported that FTY720
impairs lysosomal function in NSCLC cells (18), and in the present study,
combination treatment with lapatinib and FTY720 induced LMP in PDAC
cells. LMP results in the leakage of lysosomal content into the
cytosol, causing so-called ‘lysosome-dependent cell death’
(51,68). Lysosome-dependent cell death is
primarily mediated by lysosomal hydrolases, such as cathepsin
proteases (51,68). In the current study, cell death
induced by combination treatment with lapatinib and FTY720 was not
repressed by E64d, an inhibitor of cysteine proteases, such as
cathepsin B and cathepsin L, and pepstatin A, an inhibitor of
aspartic proteases, such as cathepsin D, cathepsin E and pepsin.
Additionally, combination treatment suppressed the expression and
maturation of cathepsin B. Accordingly, these findings indicated
that cell death induced by combination treatment with lapatinib and
FTY720 cannot be attributed to LMP-induced proteolytic enzyme
leakage from the lysosome.
In addition, lysosomes, ER and mitochondria serve as
intracellular Ca2+ stores, while cytosolic
Ca2+ concentrations are maintained at low concentrations
(52,69–71).
Therefore, Ca2+ sequestered in lysosomes leaks out of
lysosomes owing to LMP (51). In
the present study, combination treatment with lapatinib and FTY720
increased the intracellular Ca2+ concentration.
Calpains, cytosolic Ca2+-activated neutral proteases,
are reportedly activated by LMP and are known to be involved in the
degradation of several lysosomal proteins, including HSP70.1 and
LAMP2 (72,73). These enzymes may also play a role
in cell death mediated by combination treatment with lapatinib and
FTY720. Moreover, intimate and dynamic communication occurs between
intracellular organelles via membrane contact sites (74,75).
Ca2+ release and influx are regulated between lysosomes,
ER and mitochondria via their respective channels, and
intracellular Ca2+ homeostasis is maintained in
conjunction with extracellular Ca2+ entry (52,71).
Therefore, LMP-induced Ca2+ leakage from lysosomes also
affects Ca2+ regulation in the ER and mitochondria,
resulting in ER stress and mitochondrial depolarization;
Ca2+ may be the key regulatory factor mediating cell
death induced by combination treatment with lapatinib and FTY720.
However, the increased intracellular Ca2+ concentration
can be, at least in part, directly attributed to lysosomal leakage;
however, the role of leakage from mitochondria, ER and
extracellular influx needs to be investigated in future
investigations.
FTY720 is a sphingosine analog that reportedly
inhibits sphingosine kinase 1 (76), sphingosine-1-phosphate lyase 1
(77), ceramide synthases
(78,79) and lysosomal acid sphingomyelinase
(80), all enzymes involved in
sphingolipid metabolism. FTY720 suppresses these enzymatic
activities at micromolar concentrations, thus altering
intracellular sphingolipid metabolism (81). De novo synthesis of
sphingolipids occurs in the ER, and the formed ceramide is
transported to the Golgi, further modified, and transported to
other membrane compartments, including the plasma membrane,
lysosomes and mitochondria (82,83).
In the present study, combination treatment with lapatinib and
FTY720 rapidly induced LMP in lysosomes, and ER stress loading was
observed as a subsequent response. In addition, PDAC cell death was
not only induced by the combination of lapatinib and FTY720, but
also by combining lapatinib and abemaciclib or lapatinib and HCQ.
Therefore, the direct action of FTY720 on the ER, the site of
sphingolipid synthesis, cannot be completely excluded; the
contribution of suppressed sphingolipid metabolism on cell death
induction is considered adjunctive, if any.
Several additional factors must be considered.
First, the combination of lysosome-targeted drugs, i.e., lapatinib,
FTY720, HCQ and abemaciclib, showed remarkable cytotoxic effects in
multiple pancreatic cancer cell lines. However, direct molecules
targeted by each drug, as well as cell death executing molecules,
mediating the pronounced cytotoxic effect of combination drug
treatment remain to be elucidated, and future studies are needed to
clarify the underlying downstream mediators. In addition to
clarifying the effects of these drugs on autophagic flux in the
present study, it is necessary to analyze the effects on the
macropinocytosis pathway and evaluate the role of inhibiting these
pathways on cell death induction. Second, KRAS mutant
PANC-1, MIA PaCa-2, KP-4, KP-3 and KP-2 cells and KRAS
wild-type BxPC-3 cells were used, and it was revealed that
combination treatment with lapatinib and FTY720 was effective in
all cell lines, regardless of KRAS mutation. However, to
date, gene mutations have been poorly investigated. Therefore, it
is necessary to further analyze the association between combined
effects and gene mutations in KRAS, p16/CDKN2A, p53/TP53 and
SMAD4, which are frequently mutated in pancreatic cancer
cells (2,84). Third, the present study only
performed in vitro analyses, and investigations using animal
models and clinically derived samples should be undertaken in the
future to confirm these effects in vivo.
In conclusion, the combination of lapatinib and
FTY720 demonstrated significant effects on PDAC cells, suggesting
its ability to improve the efficacy of combination chemotherapy in
patients with PDAC. HCQ and abemaciclib are also useful candidates
for improving treatment options in combination with lapatinib.
Lapatinib, FTY720, HCQ and abemaciclib are all FDA-approved drugs
whose safety and toxicity have been previously determined.
Therefore, the present study has the potential to rapidly improve
the treatment of patients with PDAC. Although lysosome-targeted
drug combinations are markedly efficacious, their underlying
molecular mechanisms need to be further elucidated to achieve
evidence-based medicine.
Supplementary Material
Supporting Data
Acknowledgements
The authors would like to thank Dr A. Abe and Mr.
S. Moriya (Department of Biochemistry, Tokyo Medical University,
Japan) and Dr H. Hino (Division of Anatomical Science, Department
of Functional Morphology, Nihon University School of Medicine,
Japan) for their technical assistance.
Funding
This study was supported by the Japan Society for the Promotion
of Science KAKENHI (grant nos. 18K06901 and 21K07106), the
MEXT-Supported Program of the Strategic Research Foundation at
Private Universities (grant no. S1411011 and 2014e2018), from the
Ministry of Education, Culture, Sports, Science and Technology of
Japan, and the Cancer Research Grant afforded by the Tokyo Medical
University Cancer Research Foundation (2021).
Availability of data and materials
The datasets used and/or analyzed during the
current study are available from the corresponding author on
reasonable request.
Authors' contributions
MH, SS, MO and KM designed the study. SS, MO, MM,
KO, HK, AH, NT and MH performed the experiments and analyzed the
data. SS, MO and MH confirm the authenticity of the raw data. MH,
SS, MO, NT and KM were major contributors to writing the
manuscript. All authors have read and approved the final
manuscript.
Ethics approval and consent to
participate
Not applicable.
Patent consent for publication
Not applicable.
Competing interests
The authors declare that they have no competing
interests.
Glossary
Abbreviations
Abbreviations:
|
ACTB
|
β-actin
|
|
ANOVA
|
analysis of variance
|
|
CALR
|
calreticulin
|
|
Ca2+
|
calcium
|
|
CASP3
|
caspase-3
|
|
COX IV
|
cytochrome c oxidase subunit 4
|
|
CTSB
|
cathepsin B
|
|
DDIT3
|
DNA damage inducible transcript 3
|
|
DMSO
|
dimethyl sulfoxide
|
|
ER
|
endoplasmic reticulum
|
|
FTY720
|
fingolimod
|
|
GAPDH
|
glyceraldehyde-3-phosphate
dehydrogenase
|
|
HBSS
|
Hanks' balanced salt solution
|
|
HCQ
|
hydroxychloroquine
|
|
IgG
|
immunoglobulin G
|
|
LAMP2
|
lysosome-associated membrane
glycoprotein 2
|
|
LDH
|
lactate dehydrogenase
|
|
LGALS3
|
galectin-3
|
|
LMP
|
lysosomal membrane
permeabilization
|
|
NSCLC
|
non-small cell lung cancer
|
|
PARP1
|
poly [ADP-ribose] polymerase 1
|
|
PDAC
|
pancreatic ductal adenocarcinoma
|
|
p-H2AX
|
phosphorylated-histone H2A.X
|
|
PI
|
propidium iodide
|
|
qPCR
|
quantitative polymerase chain
reaction
|
|
TGOLN2
|
trans-Golgi network integral membrane
protein 2
|
|
XBP1
|
X-box-binding protein 1
|
References
|
1
|
Rawla P, Sunkara T and Gaduputi V:
Epidemiology of pancreatic cancer: Global trends, etiology and risk
factors. World J Oncol. 10:10–27. 2019. View Article : Google Scholar : PubMed/NCBI
|
|
2
|
Mizrahi JD, Surana R, Valle JW and Shroff
RT: Pancreatic cancer. Lancet. 395:2008–2020. 2020. View Article : Google Scholar : PubMed/NCBI
|
|
3
|
Ushio J, Kanno A, Ikeda E, Ando K, Nagai
H, Miwata T, Kawasaki Y, Tada Y, Yokoyama K, Numao N, et al:
Pancreatic ductal adenocarcinoma: Epidemiology and risk factors.
Diagnostics (Basel). 11:5622021. View Article : Google Scholar : PubMed/NCBI
|
|
4
|
Rai V and Agrawal S: Targets (metabolic
mediators) of therapeutic importance in pancreatic ductal
adenocarcinoma. Int J Mol Sci. 21:85022020. View Article : Google Scholar : PubMed/NCBI
|
|
5
|
Feig C, Gopinathan A, Neesse A, Chan DS,
Cook N and Tuveson DA: The pancreas cancer microenvironment. Clin
Cancer Res. 18:4266–4276. 2012. View Article : Google Scholar : PubMed/NCBI
|
|
6
|
Conroy T, Desseigne F, Ychou M, Bouché O,
Guimbaud R, Bécouarn Y, Adenis A, Raoul JL, Gourgou-Bourgade S, de
la Fouchardière C, et al: FOLFIRINOX versus gemcitabine for
metastatic pancreatic cancer. N Engl J Med. 364:1817–1825. 2011.
View Article : Google Scholar : PubMed/NCBI
|
|
7
|
Suker M, Beumer BR, Sadot E, Marthey L,
Faris JE, Mellon EA, El-Rayes BF, Wang-Gillam A, Lacy J, Hosein PJ,
et al: FOLFIRINOX for locally advanced pancreatic cancer: A
systematic review and patient-level meta-analysis. Lancet Oncol.
17:801–810. 2016. View Article : Google Scholar : PubMed/NCBI
|
|
8
|
Zeng S, Pöttler M, Lan B, Grützmann R,
Pilarsky C and Yang H: Chemoresistance in pancreatic cancer. Int J
Mol Sci. 20:45042019. View Article : Google Scholar : PubMed/NCBI
|
|
9
|
Florey O and Overholtzer M:
Macropinocytosis and autophagy crosstalk in nutrient scavenging.
Philos Trans R Soc Lond B Biol Sci. 374:201801542019. View Article : Google Scholar : PubMed/NCBI
|
|
10
|
Bryant KL, Mancias JD, Kimmelman AC and
Der CJ: KRAS: Feeding pancreatic cancer proliferation. Trends
Biochem Sci. 39:91–100. 2014. View Article : Google Scholar : PubMed/NCBI
|
|
11
|
Piffoux M, Eriau E and Cassier PA:
Autophagy as a therapeutic target in pancreatic cancer. Br J
Cancer. 124:333–344. 2021. View Article : Google Scholar : PubMed/NCBI
|
|
12
|
Su H, Yang F, Fu R, Li X, French R, Mose
E, Pu X, Trinh B, Kumar A, Liu J, et al: Cancer cells escape
autophagy inhibition via NRF2-induced macropinocytosis. Cancer
Cell. 39:678–693.e11. 2021. View Article : Google Scholar : PubMed/NCBI
|
|
13
|
Morishita H and Mizushima N: Diverse
cellular roles of autophagy. Annu Rev Cell Dev Biol. 35:453–475.
2019. View Article : Google Scholar : PubMed/NCBI
|
|
14
|
Sousa CM, Biancur DE, Wang X, Halbrook CJ,
Sherman MH, Zhang L, Kremer D, Hwang RF, Witkiewicz AK, Ying H, et
al: Pancreatic stellate cells support tumour metabolism through
autophagic alanine secretion. Nature. 536:479–483. 2016. View Article : Google Scholar : PubMed/NCBI
|
|
15
|
Recouvreux MV and Commisso C:
Macropinocytosis: A metabolic adaptation to nutrient stress in
cancer. Front Endocrinol (Lausanne). 8:2612017. View Article : Google Scholar : PubMed/NCBI
|
|
16
|
Perera RM and Zoncu R: The lysosome as a
regulatory Hub. Annu Rev Cell Dev Biol. 32:223–253. 2016.
View Article : Google Scholar : PubMed/NCBI
|
|
17
|
Gupta S, Yano J, Mercier V, Htwe HH, Shin
HR, Rademaker G, Cakir Z, Ituarte T, Wen KW, Kim GE, et al:
Lysosomal retargeting of myoferlin mitigates membrane stress to
enable pancreatic cancer growth. Nat Cell Biol. 23:232–242. 2021.
View Article : Google Scholar : PubMed/NCBI
|
|
18
|
Ota K, Okuma T, Lorenzo A, Yokota A, Hino
H, Kazama H, Moriya S, Takano N, Hiramoto M and Miyazawa K:
Fingolimod sensitizes EGFR wild-type non-small cell lung cancer
cells to lapatinib or sorafenib and induces cell cycle arrest.
Oncol Rep. 42:231–242. 2019.PubMed/NCBI
|
|
19
|
Zhang N, Qi Y, Wadham C, Wang L, Warren A,
Di W and Xia P: FTY720 induces necrotic cell death and autophagy in
ovarian cancer cells: A protective role of autophagy. Autophagy.
6:1157–1167. 2010. View Article : Google Scholar : PubMed/NCBI
|
|
20
|
Liao A, Hu R, Zhao Q, Li J, Li Y, Yao K,
Zhang R, Wang H, Yang W and Liu Z: Autophagy induced by FTY720
promotes apoptosis in U266 cells. Eur J Pharm Sci. 45:600–605.
2012. View Article : Google Scholar : PubMed/NCBI
|
|
21
|
Zhang L, Wang H, Ding K and Xu J: FTY720
induces autophagy-related apoptosis and necroptosis in human
glioblastoma cells. Toxicol Lett. 236:43–59. 2015. View Article : Google Scholar : PubMed/NCBI
|
|
22
|
Li J, Wang SW, Zhang DS, Sun Y, Zhu CY,
Fei Q, Hu J, Zhang C and Sun YM: FTY720-induced enhancement of
autophagy protects cells from FTY720 cytotoxicity in colorectal
cancer. Oncol Rep. 35:2833–2842. 2016. View Article : Google Scholar : PubMed/NCBI
|
|
23
|
Alinari L, Mahoney E, Patton J, Zhang X,
Huynh L, Earl CT, Mani R, Mao Y, Yu B, Quinion C, et al: FTY720
increases CD74 expression and sensitizes mantle cell lymphoma cells
to milatuzumab-mediated cell death. Blood. 118:6893–6903. 2011.
View Article : Google Scholar : PubMed/NCBI
|
|
24
|
Trkov S, Stenovec M, Kreft M, Potokar M,
Parpura V, Davletov B and Zorec R: Fingolimod-a sphingosine-like
molecule inhibits vesicle mobility and secretion in astrocytes.
Glia. 60:1406–1416. 2012. View Article : Google Scholar : PubMed/NCBI
|
|
25
|
Ahmed D, de Verdier PJ, Ryk C, Lunqe O,
Stål P and Flygare J: FTY720 (Fingolimod) sensitizes hepatocellular
carcinoma cells to sorafenib-mediated cytotoxicity. Pharmacol Res
Perspect. 3:e001712015. View Article : Google Scholar : PubMed/NCBI
|
|
26
|
Tay KH, Liu X, Chi M, Jin L, Jiang CC, Guo
ST, Verrills NM, Tseng HY and Zhang XD: Involvement of vacuolar
H(+)-ATPase in killing of human melanoma cells by the sphingosine
kinase analogue FTY720. Pigment Cell Melanoma Res. 28:171–183.
2015. View Article : Google Scholar : PubMed/NCBI
|
|
27
|
Li X, Wang MH, Qin C, Fan WH, Tian DS and
Liu JL: Fingolimod suppresses neuronal autophagy through the
mTOR/p70S6K pathway and alleviates ischemic brain damage in mice.
PLoS One. 12:e01887482017. View Article : Google Scholar : PubMed/NCBI
|
|
28
|
Min KJ and Kwon TK: Induction of lysosomal
membrane permeabilization is a major event of FTY720-mediated
non-apoptotic cell death in human glioma cells. Cancers (Basel).
12:33882020. View Article : Google Scholar : PubMed/NCBI
|
|
29
|
Aizawa S, Yaguchi M, Nakano M, Toyama K,
Inokuchi S, Imai T, Yasuda M, Nabeshima R and Handa H:
Hematopoietic supportive function of human bone marrow stromal cell
lines established by a recombinant SV40-adenovirus vector. Exp
Hematol. 22:482–487. 1994.PubMed/NCBI
|
|
30
|
Kazama H, Hiramoto M, Miyahara K, Takano N
and Miyazawa K: Designing an effective drug combination for ER
stress loading in cancer therapy using a real-time monitoring
system. Biochem Biophys Res Commun. 501:286–292. 2018. View Article : Google Scholar : PubMed/NCBI
|
|
31
|
Iwawaki T, Akai R, Kohno K and Miura M: A
transgenic mouse model for monitoring endoplasmic reticulum stress.
Nat Med. 10:98–102. 2004. View Article : Google Scholar : PubMed/NCBI
|
|
32
|
Kaizuka T, Morishita H, Hama Y, Tsukamoto
S, Matsui T, Toyota Y, Kodama A, Ishihara T, Mizushima T and
Mizushima N: An autophagic flux probe that releases an internal
control. Mol Cell. 64:835–849. 2016. View Article : Google Scholar : PubMed/NCBI
|
|
33
|
Saito Y, Moriya S, Kazama H, Hirasawa K,
Miyahara K, Kokuba H, Hino H, Kikuchi H, Takano N, Hiramoto M, et
al: Amino acid starvation culture condition sensitizes
EGFR-expressing cancer cell lines to gefitinib-mediated
cytotoxicity by inducing atypical necroptosis. Int J Oncol.
52:1165–1177. 2018.PubMed/NCBI
|
|
34
|
Livak KJ and Schmittgen TD: Analysis of
relative gene expression data using real-time quantitative PCR and
the 2(−Delta Delta C(T)) method. Methods. 25:402–408. 2001.
View Article : Google Scholar : PubMed/NCBI
|
|
35
|
Aizawa S, Hiramoto M, Hoshi H, Toyama K,
Shima D and Handa H: Establishment of stromal cell line from an MDS
RA patient which induced an apoptotic change in hematopoietic and
leukemic cells in vitro. Exp Hematol. 28:148–155. 2000. View Article : Google Scholar : PubMed/NCBI
|
|
36
|
Nadanaciva S, Lu S, Gebhard DF, Jessen BA,
Pennie WD and Will Y: A high content screening assay for
identifying lysosomotropic compounds. Toxicol In Vitro. 25:715–723.
2011. View Article : Google Scholar : PubMed/NCBI
|
|
37
|
Chou TC: Theoretical basis, experimental
design, and computerized simulation of synergism and antagonism in
drug combination studies. Pharmacol Rev. 58:621–681. 2006.
View Article : Google Scholar : PubMed/NCBI
|
|
38
|
Chiba K, Kataoka H, Seki N, Shimano K,
Koyama M, Fukunari A, Sugahara K and Sugita T: Fingolimod (FTY720),
sphingosine 1-phosphate receptor modulator, shows superior efficacy
as compared with interferon-β in mouse experimental autoimmune
encephalomyelitis. Int Immunopharmacol. 11:366–372. 2011.
View Article : Google Scholar : PubMed/NCBI
|
|
39
|
White C, Alshaker H, Cooper C, Winkler M
and Pchejetski D: The emerging role of FTY720 (fingolimod) in
cancer treatment. Oncotarget. 7:23106–23127. 2016. View Article : Google Scholar : PubMed/NCBI
|
|
40
|
Heymach JV, Nilsson M, Blumenschein G,
Papadimitrakopoulou V and Herbst R: Epidermal growth factor
receptor inhibitors in development for the treatment of non-small
cell lung cancer. Clin Cancer Res. 12:4441s–4445s. 2006. View Article : Google Scholar : PubMed/NCBI
|
|
41
|
Legrand C, Bour JM, Jacob C, Capiaumont J,
Martial A, Marc A, Wudtke M, Kretzmer G, Demangel C, Duval D, et
al: Lactate dehydrogenase (LDH) activity of the cultured eukaryotic
cells as marker of the number of dead cells in the medium
[corrected]. J Biotechnol. 25:231–243. 1992. View Article : Google Scholar : PubMed/NCBI
|
|
42
|
Crowley LC, Marfell BJ, Scott AP and
Waterhouse NJ: Quantitation of apoptosis and necrosis by annexin V
binding, propidium iodide uptake, and flow cytometry. Cold Spring
Harb Protoc 2016. 2016. View Article : Google Scholar
|
|
43
|
Duriez PJ and Shah GM: Cleavage of
poly(ADP-ribose) polymerase: A sensitive parameter to study cell
death. Biochem Cell Biol. 75:337–349. 1997. View Article : Google Scholar : PubMed/NCBI
|
|
44
|
Rogakou EP, Boon C, Redon C and Bonner WM:
Megabase chromatin domains involved in DNA double-strand breaks in
vivo. J Cell Biol. 146:905–916. 1999. View Article : Google Scholar : PubMed/NCBI
|
|
45
|
Rogakou EP, Nieves-Neira W, Boon C,
Pommier Y and Bonner WM: Initiation of DNA fragmentation during
apoptosis induces phosphorylation of H2AX histone at serine 139. J
Biol Chem. 275:9390–9395. 2000. View Article : Google Scholar : PubMed/NCBI
|
|
46
|
Patel T, Gores GJ and Kaufmann SH: The
role of proteases during apoptosis. FASEB J. 10:587–597. 1996.
View Article : Google Scholar : PubMed/NCBI
|
|
47
|
Degterev A, Hitomi J, Germscheid M, Ch'en
IL, Korkina O, Teng X, Abbott D, Cuny GD, Yuan C, Wagner G, et al:
Identification of RIP1 kinase as a specific cellular target of
necrostatins. Nat Chem Biol. 4:313–321. 2008. View Article : Google Scholar : PubMed/NCBI
|
|
48
|
Aruoma OI, Halliwell B, Hoey BM and Butler
J: The antioxidant action of N-acetylcysteine: Its reaction with
hydrogen peroxide, hydroxyl radical, superoxide, and hypochlorous
acid. Free Radic Biol Med. 6:593–597. 1989. View Article : Google Scholar : PubMed/NCBI
|
|
49
|
Wu YT, Tan HL, Huang Q, Kim YS, Pan N, Ong
WY, Liu ZG, Ong CN and Shen HM: Autophagy plays a protective role
during zVAD-induced necrotic cell death. Autophagy. 4:457–466.
2008. View Article : Google Scholar : PubMed/NCBI
|
|
50
|
Wang F, Gómez-Sintes R and Boya P:
Lysosomal membrane permeabilization and cell death. Traffic.
19:918–931. 2018. View Article : Google Scholar : PubMed/NCBI
|
|
51
|
Serrano-Puebla A and Boya P: Lysosomal
membrane permeabilization as a cell death mechanism in cancer
cells. Biochem Soc Trans. 46:207–215. 2018. View Article : Google Scholar : PubMed/NCBI
|
|
52
|
Cremer T, Neefjes J and Berlin I: The
journey of Ca2+ through the cell-pulsing through the
network of ER membrane contact sites. J Cell Sci.
133:jcs2491362020. View Article : Google Scholar : PubMed/NCBI
|
|
53
|
Lemasters JJ, Nieminen AL, Qian T, Trost
LC, Elmore SP, Nishimura Y, Crowe RA, Cascio WE, Bradham CA,
Brenner DA and Herman B: The mitochondrial permeability transition
in cell death: A common mechanism in necrosis, apoptosis and
autophagy. Biochim Biophys Acta. 1366:177–196. 1998. View Article : Google Scholar : PubMed/NCBI
|
|
54
|
Kim I, Rodriguez-Enriquez S and Lemasters
JJ: Selective degradation of mitochondria by mitophagy. Arch
Biochem Biophys. 462:245–253. 2007. View Article : Google Scholar : PubMed/NCBI
|
|
55
|
Ponnambalam S, Girotti M, Yaspo ML, Owen
CE, Perry AC, Suganuma T, Nilsson T, Fried M, Banting G and Warren
G: Primate homologues of rat TGN38: Primary structure, expression
and functional implications. J Cell Sci. 109:675–685. 1996.
View Article : Google Scholar : PubMed/NCBI
|
|
56
|
Ghosh RN, Mallet WG, Soe TT, McGraw TE and
Maxfield FR: An endocytosed TGN38 chimeric protein is delivered to
the TGN after trafficking through the endocytic recycling
compartment in CHO cells. J Cell Biol. 142:923–936. 1998.
View Article : Google Scholar : PubMed/NCBI
|
|
57
|
Di Martino R, Sticco L and Luini A:
Regulation of cargo export and sorting at the trans-Golgi network.
FEBS Lett. 593:2306–2318. 2019. View Article : Google Scholar : PubMed/NCBI
|
|
58
|
Hino H, Iriyama N, Kokuba H, Kazama H,
Moriya S, Takano N, Hiramoto M, Aizawa S and Miyazawa K:
Abemaciclib induces atypical cell death in cancer cells
characterized by formation of cytoplasmic vacuoles derived from
lysosomes. Cancer Sci. 111:2132–2145. 2020. View Article : Google Scholar : PubMed/NCBI
|
|
59
|
Ohkuma S and Poole B: Fluorescence probe
measurement of the intralysosomal pH in living cells and the
perturbation of pH by various agents. Proc Natl Acad Sci USA.
75:3327–3331. 1978. View Article : Google Scholar : PubMed/NCBI
|
|
60
|
Mackenzie AH: Pharmacologic actions of
4-aminoquinoline compounds. Am J Med. 75:5–10. 1983. View Article : Google Scholar : PubMed/NCBI
|
|
61
|
Appelqvist H, Nilsson C, Garner B, Brown
AJ, Kagedal K and Ollinger K: Attenuation of the lysosomal death
pathway by lysosomal cholesterol accumulation. Am J Pathol.
178:629–639. 2011. View Article : Google Scholar : PubMed/NCBI
|
|
62
|
Appelqvist H, Sandin L, Björnström K,
Saftig P, Garner B, Ollinger K and Kågedal K: Sensitivity to
lysosome-dependent cell death is directly regulated by lysosomal
cholesterol content. PLoS One. 7:e502622012. View Article : Google Scholar : PubMed/NCBI
|
|
63
|
Kornhuber J, Henkel AW, Groemer TW,
Städtler S, Welzel O, Tripal P, Rotter A, Bleich S and Trapp S:
Lipophilic cationic drugs increase the permeability of lysosomal
membranes in a cell culture system. J Cell Physiol. 224:152–164.
2010.PubMed/NCBI
|
|
64
|
Villamil Giraldo AM, Appelqvist H, Ederth
T and Öllinger K: Lysosomotropic agents: Impact on lysosomal
membrane permeabilization and cell death. Biochem Soc Trans.
42:1460–1464. 2014. View Article : Google Scholar : PubMed/NCBI
|
|
65
|
Lu S, Sung T, Lin N, Abraham RT and Jessen
BA: Lysosomal adaptation: How cells respond to lysosomotropic
compounds. PLoS One. 12:e01737712017. View Article : Google Scholar : PubMed/NCBI
|
|
66
|
Anand A, Liu B, Dicroce Giacobini J, Maeda
K, Rohde M and Jäättelä M: Cell death induced by cationic
amphiphilic drugs depends on lysosomal Ca2+ release and
cyclic AMP. Mol Cancer Ther. 18:1602–1614. 2019. View Article : Google Scholar : PubMed/NCBI
|
|
67
|
Llanos S, Megias D, Blanco-Aparicio C,
Hernández-Encinas E, Rovira M, Pietrocola F and Serrano M:
Lysosomal trapping of palbociclib and its functional implications.
Oncogene. 38:3886–3902. 2019. View Article : Google Scholar : PubMed/NCBI
|
|
68
|
Aits S and Jäättelä M: Lysosomal cell
death at a glance. J Cell Sci. 126:1905–1912. 2013. View Article : Google Scholar : PubMed/NCBI
|
|
69
|
Xu H and Ren D: Lysosomal physiology. Annu
Rev Physiol. 77:57–80. 2015. View Article : Google Scholar : PubMed/NCBI
|
|
70
|
Ballabio A and Bonifacino JS: Lysosomes as
dynamic regulators of cell and organismal homeostasis. Nat Rev Mol
Cell Biol. 21:101–118. 2020. View Article : Google Scholar : PubMed/NCBI
|
|
71
|
Wu Y, Huang P and Dong XP: Lysosomal
calcium channels in autophagy and cancer. Cancers (Basel).
13:12992021. View Article : Google Scholar : PubMed/NCBI
|
|
72
|
Sahara S and Yamashima T: Calpain-mediated
Hsp70.1 cleavage in hippocampal CA1 neuronal death. Biochem Biophys
Res Commun. 393:806–811. 2010. View Article : Google Scholar : PubMed/NCBI
|
|
73
|
Villalpando Rodriguez GE and Torriglia A:
Calpain 1 induce lysosomal permeabilization by cleavage of
lysosomal associated membrane protein 2. Biochim Biophys Acta.
1833:2244–2253. 2013. View Article : Google Scholar : PubMed/NCBI
|
|
74
|
Phillips MJ and Voeltz GK: Structure and
function of ER membrane contact sites with other organelles. Nat
Rev Mol Cell Biol. 17:69–82. 2015. View Article : Google Scholar : PubMed/NCBI
|
|
75
|
Prinz WA, Toulmay A and Balla T: The
functional universe of membrane contact sites. Nat Rev Mol Cell
Biol. 21:7–24. 2020. View Article : Google Scholar : PubMed/NCBI
|
|
76
|
Vessey DA, Kelley M, Zhang J, Li L, Tao R
and Karliner JS: Dimethylsphingosine and FTY720 inhibit the SK1
form but activate the SK2 form of sphingosine kinase from rat
heart. J Biochem Mol Toxicol. 21:273–279. 2007. View Article : Google Scholar : PubMed/NCBI
|
|
77
|
Bandhuvula P, Tam YY, Oskouian B and Saba
JD: The immune modulator FTY720 inhibits sphingosine-1-phosphate
lyase activity. J Biol Chem. 280:33697–33700. 2005. View Article : Google Scholar : PubMed/NCBI
|
|
78
|
Berdyshev EV, Gorshkova I, Skobeleva A,
Bittman R, Lu X, Dudek SM, Mirzapoiazova T, Garcia JG and Natarajan
V: FTY720 inhibits ceramide synthases and up-regulates
dihydrosphingosine 1-phosphate formation in human lung endothelial
cells. J Biol Chem. 284:5467–5477. 2009. View Article : Google Scholar : PubMed/NCBI
|
|
79
|
Lahiri S, Park H, Laviad EL, Lu X, Bittman
R and Futerman AH: Ceramide synthesis is modulated by the
sphingosine analog FTY720 via a mixture of uncompetitive and
noncompetitive inhibition in an Acyl-CoA chain length-dependent
manner. J Biol Chem. 284:16090–16098. 2009. View Article : Google Scholar : PubMed/NCBI
|
|
80
|
Dawson G and Qin J: Gilenya (FTY720)
inhibits acid sphingomyelinase by a mechanism similar to tricyclic
antidepressants. Biochem Biophys Res Commun. 404:321–323. 2011.
View Article : Google Scholar : PubMed/NCBI
|
|
81
|
Ogretmen B: Sphingolipid metabolism in
cancer signalling and therapy. Nat Rev Cancer. 18:33–50. 2018.
View Article : Google Scholar : PubMed/NCBI
|
|
82
|
Hannun YA and Obeid LM: Principles of
bioactive lipid signalling: Lessons from sphingolipids. Nat Rev Mol
Cell Biol. 9:139–150. 2008. View Article : Google Scholar : PubMed/NCBI
|
|
83
|
Hannun YA and Obeid LM: Sphingolipids and
their metabolism in physiology and disease. Nat Rev Mol Cell Biol.
19:175–191. 2018. View Article : Google Scholar : PubMed/NCBI
|
|
84
|
Hayashi A, Hong J and Iacobuzio-Donahue
CA: The pancreatic cancer genome revisited. Nat Rev Gastroenterol
Hepatol. 18:469–481. 2021. View Article : Google Scholar : PubMed/NCBI
|