Introduction
The myeloproliferative syndrome chronic myeloid
leukemia (CML) is predominantly caused by reciprocal translocation
t(9;22)(q34;q11) with subsequent formation of the BCR-ABL1
fusion gene resulting in malignant cell transformation (1,2).
Since the development of tyrosine kinase inhibitors (TKIs), CML can
be effectively treated by blocking the BCR-ABL1 kinase domain
(3,4). This treatment is tremendously
successful in clinical routine showing 83.3% 10-year survival
rates, which are comparable to healthy individuals (5). However, besides primary resistance,
20 to 25% of TKI-treated CML patients acquire therapy resistance
after initial cytogenetic or molecular remission (5,6).
Only some of these patients can be helped with second or third
generation TKIs (for example, nilotinib, dasatinib or ponatinib)
(4,7) dependent on the underlying mechanisms
of TKI resistance, which is unknown in numerous cases.
In ~60% of all clinical cases, resistance occurs due
to gene amplification/overexpression or point mutations in the
BCR-ABL1-kinase, i.e. Y253H, E255V, T315I, F317L and F359V
(8,9). For the remaining cases, various
BCR-ABL1-independent mechanisms are discussed; for instance,
upregulation of efflux transporters of the ABC-binding cassette
family, alternate activation of signaling pathways and adaptions of
the DNA methylation profile or dysregulation of microRNA expression
(10–13). Further, persistence of cancer stem
cells may contribute to resistance (14–16).
In the present study, global transcriptional and
epigenetic changes in different in vitro-TKI resistance cell
models of imatinib and nilotinib were investigated. Recurrent
genome-wide expression and DNA methylation profiles were obtained
from biological replicates derived from chronic exposure to low and
high concentrations of imatinib, as well as to nilotinib to analyze
whether there are similarities of gene expression changes caused
during development of TKI resistance. Based on these findings,
aberrant cell adhesion signaling was identified to be recurrently
differentially dysregulated in imatinib and nilotinib resistance.
Thus, the role of fibronectin 1 (FN1) in imatinib resistance was
analyzed providing insights into the mechanisms underlying TKI
resistance.
Materials and methods
Reagents, cell lines and generation of
resistant cells
K-562 cells (RRID: CVCL_0004), established from the
pleural effusion of a 53-year old woman (Lozzio and Lozzio, 1975),
were obtained from the German Collection of Microorganisms and Cell
Cultures (DSMZ). The cells were maintained and imatinib resistant
cell lines were obtained as previously described in two independent
biological replicates for each subline (11,17).
Briefly, native cells were exposed initially to low TKI
concentration until the cells were resistant to this concentration
as the cellular proliferation rate was restored. After 10–14 d, the
TKI concentration was slowly increased. This was repeated until the
desired concentrations of 0.5 µM or 2 µM imatinib and 0.1 µM
nilotinib were reached. Imatinib and nilotinib were obtained from
Novartis International AG and stored at −20°C in 10 mM aqueous
stock solutions. Both TKIs were diluted to 100 µM working solutions
in RPMI-1640 (Gibco; Thermo Fisher Scientific, Inc.). Authenticity
of TKI resistant K-562 cell lines was confirmed by short tandem
repeat analysis using GenePrint 10 System (Promega Corporation).
BCR-ABL1 mutations were analyzed as previously described
(17). None of the sublines showed
mutations in BCR-ABL1. For inhibition assays,
1×10⁶ cells were incubated with 10 µM FAK14 inhibitor
(Sigma-Aldrich; Merck KGaA) or 50 µM ATN-161 (Bio-Techne) for 24
h.
RNA and DNA extraction
Total RNA was isolated using miRVana microRNA
isolation kit (Thermo Fisher Scientific, Inc.) or PeqGOLD TriFast
(VWR International, LLC) according to the manufacturer's
recommendation. Cell line DNA was purified using Gentra Puregene
kit (Qiagen GmbH) according to the manufacturer's protocol.
Genome-wide expression analysis
Genome-wide expression analyses of two biological
and four technical replicates of native, imatinib and nilotinib
resistant K-562 sublines (native; lowIM: 0.5 µM imatinib resistant;
highIM: 2 µM imatinib resistant; N: 0.1 µM nilotinib resistant) was
performed using HuGene 2.0 ST arrays (Affymetrix; Thermo Fisher
Scientific, Inc.) and 100 ng RNA of each sample according to the
manufacturer's recommendations. Data were analyzed with
Transcriptome Analyses Console (Thermo Fisher Scientific, Inc.) and
genes with fold changes ±2 and false discovery rate (FDR) corrected
P-value P<0.05 were considered to be differentially expressed.
Subsequent analyses were performed using Venn diagrams [(18); PNNL, omics.pnl.gov], Cluster 3.0
software (Stanford University, USA), KEGG pathway prediction using
DAVID Functional Annotation Tool (DAVID Bioinformatics Resources
6.8), STRING database (string-db.org, Version 11.5 with medium
confidence), as well as R 4.0.3. with the ‘GOplot’ package
(19,20).
Genome-wide methylation analysis
Methylation analyses of native and TKI resistant
cell lines were performed using Infinium MethylationEPIC BeadChip
(Illumina, Inc.) for 250 ng DNA of each sample (native, lowIM,
highIM, N) according to the manufacturer's recommendation. Data
were analyzed using Genome Studio Software (Illumina, Inc.) with 1%
FDR and calculation of delta beta values Δβ with P-value FDR
correction. CpGs with Δβ ≥0.2 and Padj<0.05 were
considered to be differential methylated. Genes were chosen for
subsequent analyses with at least three differentially methylated
CpGs/gene and clustered according to their genomic location.
Principle component analysis (PCA) was performed using Python 3.7.1
(21) with the packages skleran
0.20.1, pandas 0.23.44 and numpy 1.19.3, frequency scatter plots
using R. Statistical analyses were performed with GraphPad Prism
(Version 8.0 for Windows; GraphPad Software, Inc.).
Reverse transcription-quantitative
(RT-q) PCR
Total RNA (1 µg) was reversely transcribed using
random hexamer primers and the High Capacity cDNA Synthesis kit
(Thermo Fisher Scientific, Inc.) according to the manufacturer's
protocol. RT-qPCR of target genes was performed in triplicates on
the QuantStudio 7 device (Thermo Fisher Scientific, Inc.) with the
assays BCL-2 (Hs00608023_m1), DNASE2 (Hs00172391_m1),
FN1 (Hs01549976_m1), IFI30 (Hs00173838_m1),
NMU (Hs00183624_m1), PDE4DIP (Hs00206200_m1),
TBP (Hs00427620_m1) and GAPDH (Hs02786624_g1) serving
as internal controls. Universal Master Mix II, without UNG, (Thermo
Fisher Scientific, Inc.) using default cycling conditions, was used
for qPCR. Statistical analysis was performed as previously
described (22).
Whole cell lysates and
immunoblotting
Whole cell lysates and immunoblotting were performed
as previously described (17,23,24).
For membrane fractionation, the Plasma Membrane Protein Extraction
kit (Abcam) was used. A total of 20 µg of protein was loaded onto
the respective membranes and blots were probed with antibodies
obtained from Cell Signaling Technology, Inc. [(p-ERK: cat. no.
9102; RRID: AB_330744; 1:2,000), (p-NFκB: cat. no. 93H1; RRID:
AB_10827881; 1:1,000) NFκB: cat. no. D14E12; RRID: AB_10859369;
1:1,000) p-p38: cat. no. 9211, RRID: AB_331641; 1:500)], Santa Cruz
Biotechnology, Inc. [(ERK: cat. no. sc-514302; RRID: AB_2571739;
1:750; FN1: cat. no. sc-8422; RRID: AB_627598; 1:200), GAPDH: cat.
no. sc-47724; RRID: AB_627678; 1:1,000), (p38: cat. no. sc-7972;
RRID: AB_628079; 1:1,000)] or LI-COR Biosciences [(anti-mouse: cat.
no. 926-32210; RRID: AB_621842; cat. no. 926-680707; RRID:
AB_10956588), anti-rabbit: cat. no. 926-68071; RRID: AB_10956166;
cat. no. 926-32211; RRID: AB_621843; all 1:10,000]. Primary
antibodies were diluted in Intercept/TBS blocking solution (LI-COR
Biosciences) supplemented with 0.2% Tween-20, secondary antibodies
were diluted in TBS supplemented with 0.1% Tween-20.
Cell adhesion assay
Corning Matrigel basement membrane mix (VWR) was
thawed overnight at 4°C. A total of 50 µl/well were added onto dark
96-well plates under pre-chilled conditions. After 1 h
consolidation, the plate was washed with pre-warmed serum-free
media and dried for 30 min. The cell adhesion assay was performed
using Vybrant Cell Adhesion Assay kit (Thermo Fisher Scientific,
Inc.) according to the manufacturer's protocol. Briefly,
1.5×10⁶ cells were used for each sample, washed twice
with pre-warmed PBS and resuspended in serum-free media. A total of
5 µM calcein AM was added and incubated for 30 min at 37°C and 5%
CO2. After washing twice with pre-warmed PBS and
resuspension in serum-free RPMI-1640, 100 µl cell suspension was
added to the pre-coated plate and incubated for 90 min at 37°C, 5%
CO2. Wells were washed twice with pre-warmed PBS to
remove non-adherent cells. After addition of 200 µl PBS, the plates
were measured using 494 nm as absorbance and 517 nm as emission
wavelength at an Infinite M200 Pro device (Tecan Group, Ltd.).
Cloning
FN1 coding plasmids (Gene ID: 2335,
ABIN3996197, antibodies-online) were subcloned into the
pSelect–puromycin-mcs vector (Sigma-Aldrich; Merck KGaA) using the
Pfu-X Core kit (Jena Bioscience) using the following set of
primers: FN1_pSELECT_forward,
5′-GCGTGTCGACGGATCATGCTTAGGGGTCCGGGG-3′ and reverse,
5′-GCCAGCTAGCCCATGTTACTCTCGGGAATCTTCTCTGTC-3′ with annealing at
61°C, the restriction enzymes BamHI and NcoI (New
England BioLabs, Inc.), cloning enhancer and the In-Fusion HD kit
(Takara Bio Europe SAS).
Plasmid and siRNA transfection
Cells (2×10⁶) were transfected with 5 µg
of the respective plasmid (pSELECT-empty; pSELECT-FN1) using
nucleofection and the nucleofector 2 b device (Lonza Group Ltd.).
After 1 h of transfection, imatinib-resistant cells were seeded
onto respective cell culture plates to analyze cellular fitness
followed by 48 h exposure to 0.5 µM imatinib or used for expression
analyses as previously described (17,22).
For siRNA transfection, K-562 cells were transfected with 100 nM
Silencer Select Negative Control #1 siRNA (cat. no. 4390843) or
Silencer Pre-designed siRNA 10826 (sense:
5′-GGCUCAGCAAAUGGUUCAGtt-3′, antisense:
5′-CUGAACCAUUUGCUGAGCCtg-3′; AM16708; Thermo Fisher Scientific,
Inc.) as aforementioned. After 24 h of transfection, cells were
seeded onto respective cell culture plates and exposed to 2 µM
imatinib for 48 h or transferred for RNA isolation. In case of
proliferation analyses, cells were incubated for 24 h with 2 µM
imatinib.
Cellular fitness assays
Cell numbers were obtained by trypan blue staining
as previously described (22).
WST-1 (Sigma-Aldrich; Merck KGaA) and Caspase Glo 9 Assay (Promega
Corporation) were performed as previously described (17). Proliferation was analyzed by Ki-67
expression using human MKI67 ELISA kit (cat. no. MBS8291369,
MyBioSource, Inc.) according to the manufacturer's recommendation
with 50 µg protein/well. Data were analyzed normalizing IM-treated
to non-treated samples followed by statistical analyses as
described below.
Software & statistical
analysis
Primers were designed using the InFusion Cloning
primer design tool (Takara Bio Europe SAS). Densitometry was
performed using Empiria Studio 1.2 (LI-COR Biosciences).
Spearman-Rank correlation was calculated using Cluster 3.0
(Stanford University, Stanford, CA, USA). Unless not otherwise
described, statistical analysis was performed using one-way ANOVA
with subsequent Dunnett's test, unpaired Student's or Welch's
t-test and the GraphPad prism software (Version 8.0; GraphPad
Software, Inc.). P<0.05 was considered to indicate a
statistically significant difference.
Results
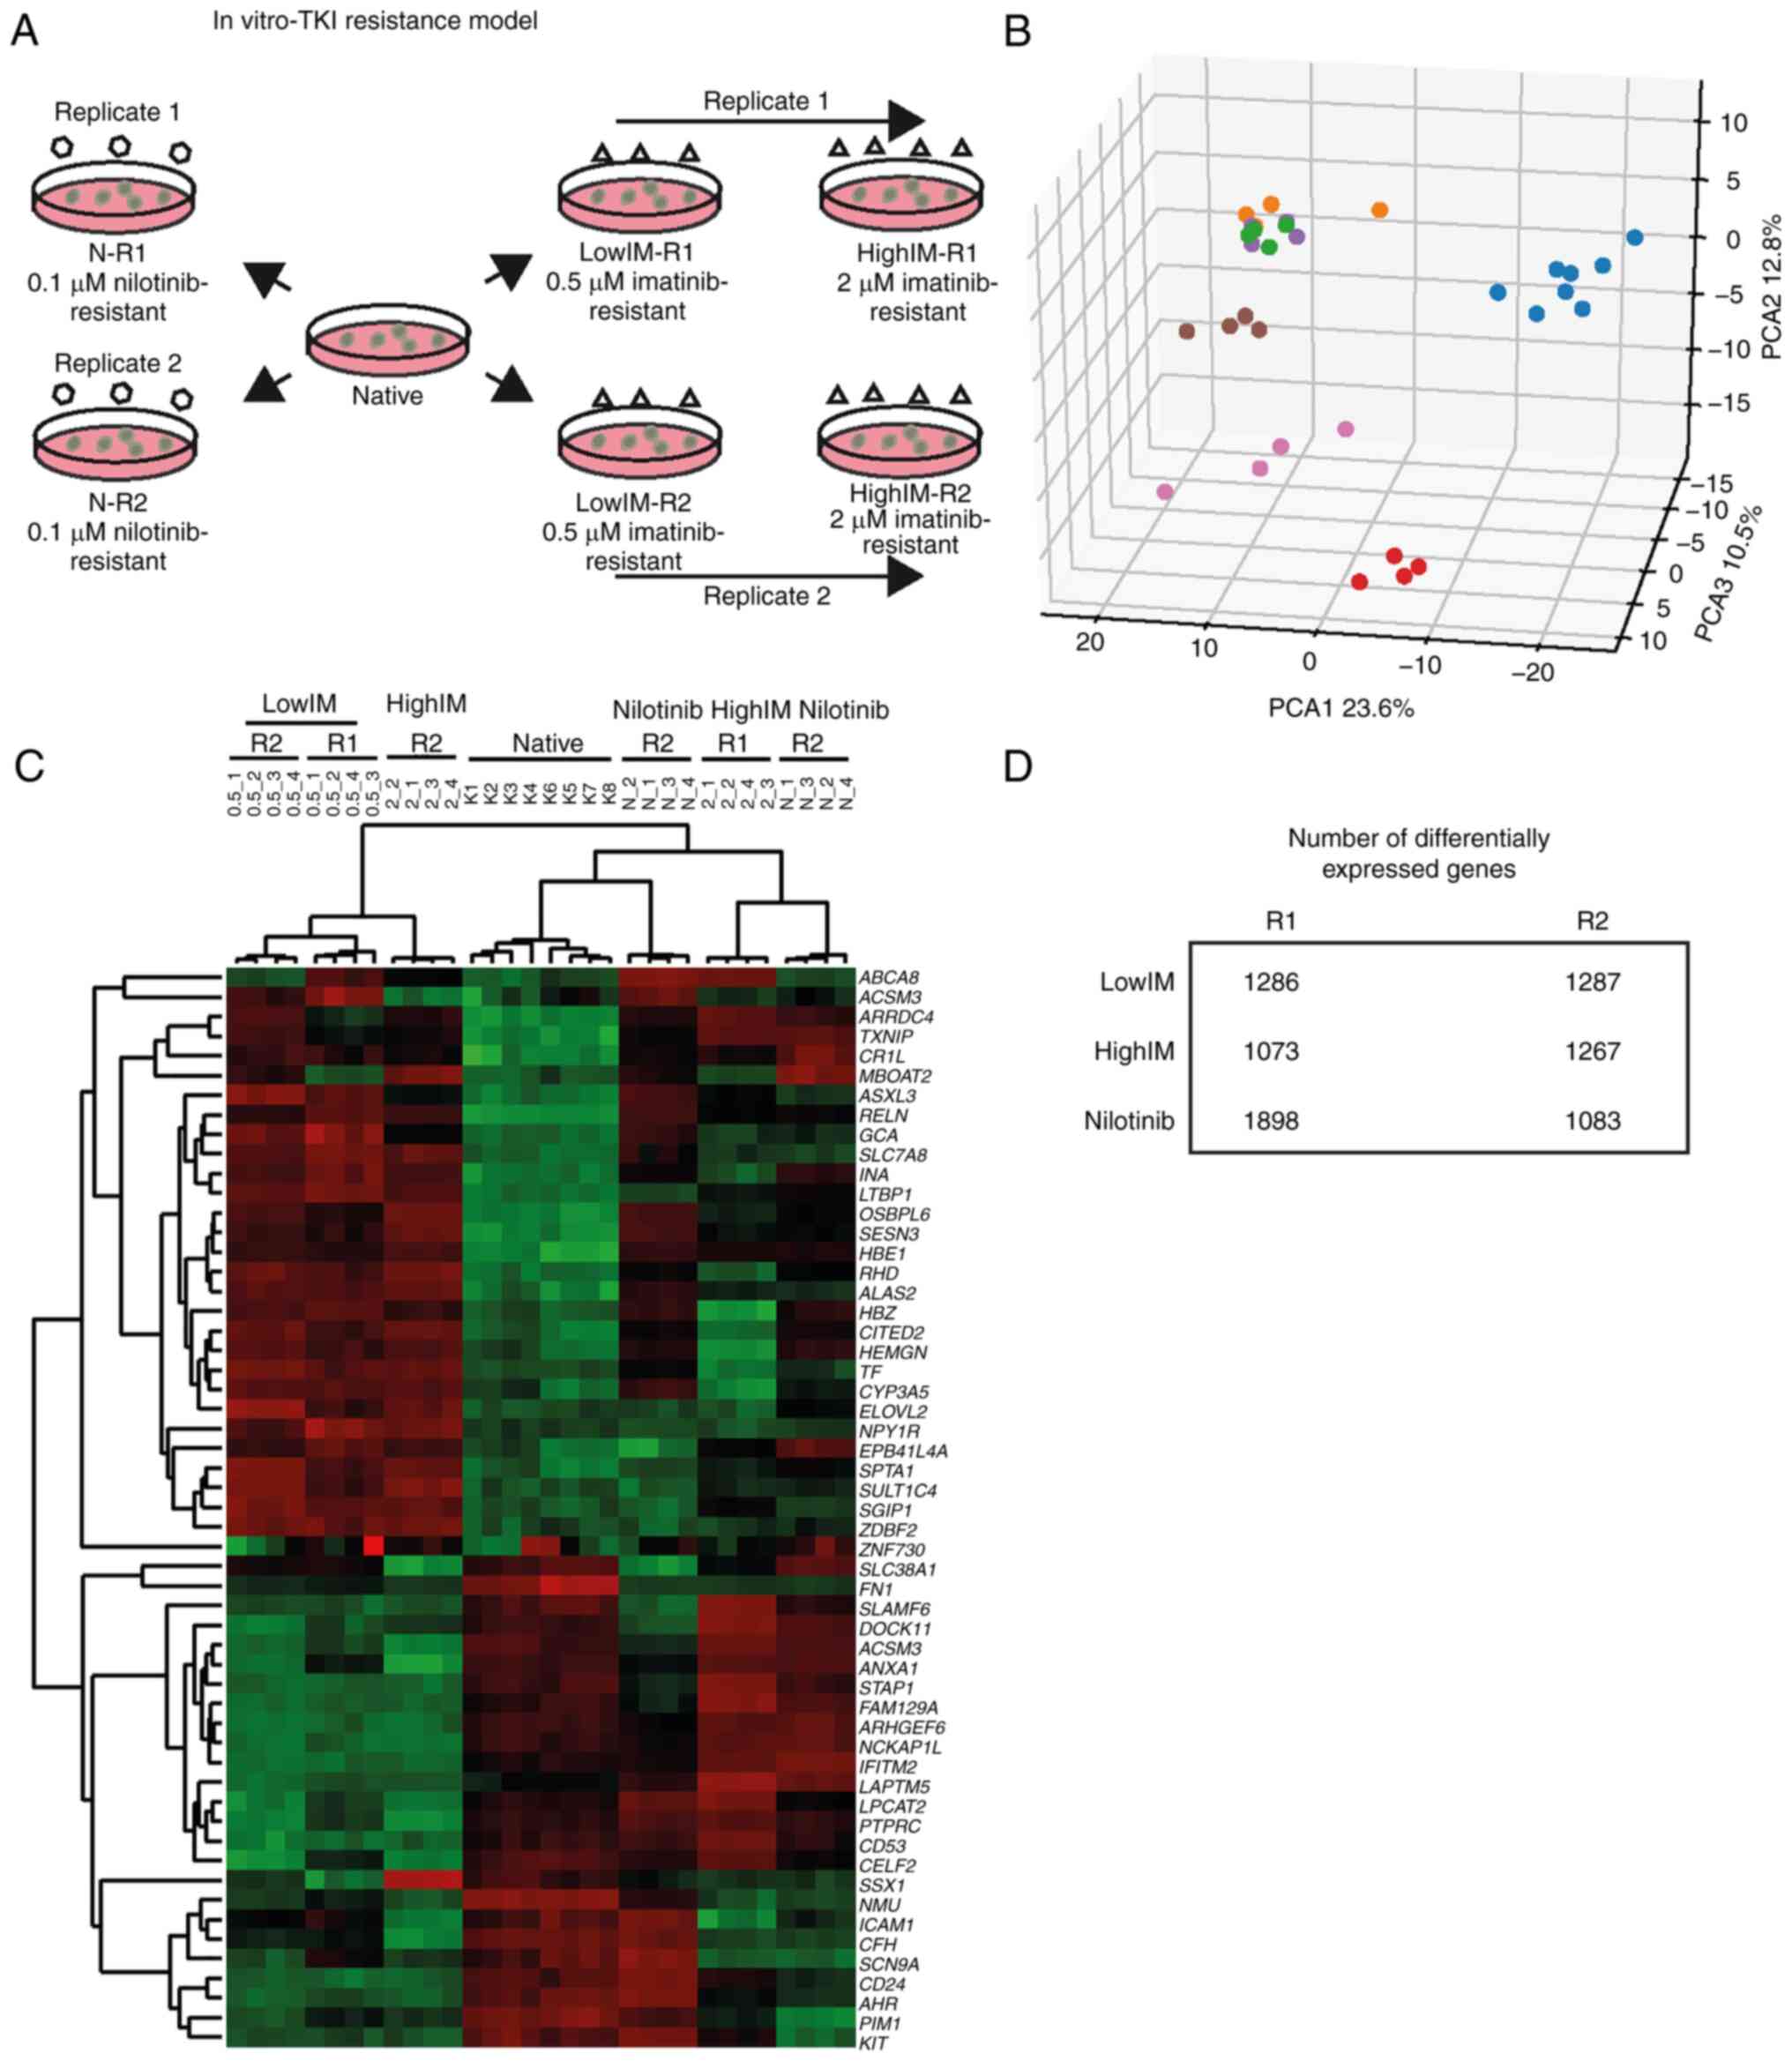
Gene expression changes between the
biological replicates of TKI resistant CML cells
To study mechanisms of TKI resistance in CML cells,
an in vitro-TKI CML cell line model of CML cells being
resistant to low (lowIM: 0.5 µM) and high (highIM: 2 µM)
concentrations of imatinib or to 0.1 µM nilotinib (N, Fig. 1A) was generated. At lowIM, the
number of differentially expressed genes were 1,286 and 1,287 in
the biological replicates, respectively (Fig. 1B-D), and there was an overlap of
636 unidirectional differentially expressed genes with 67% being
downregulated (Fig. S1). At
highIM, a total of 1,073 and 1,267 genes were differentially
expressed in the biological replicates. A total of 317 genes were
unidirectionally expressed in both replicates with 35% being
downregulated indicating larger differences (Figs. 1B-D and S1). The difference was even more
profound in 0.1 µM nilotinib resistance: 1,898 and 1,083 genes were
differentially expressed in the biological replicates with 469
unidirectional differentially expressed genes among them 25%
downregulated genes (Fig. 1B-D and
S1). Overall, the differences in
gene expression were more pronounced in CML cells resistant to
higher imatinib concentrations or nilotinib.
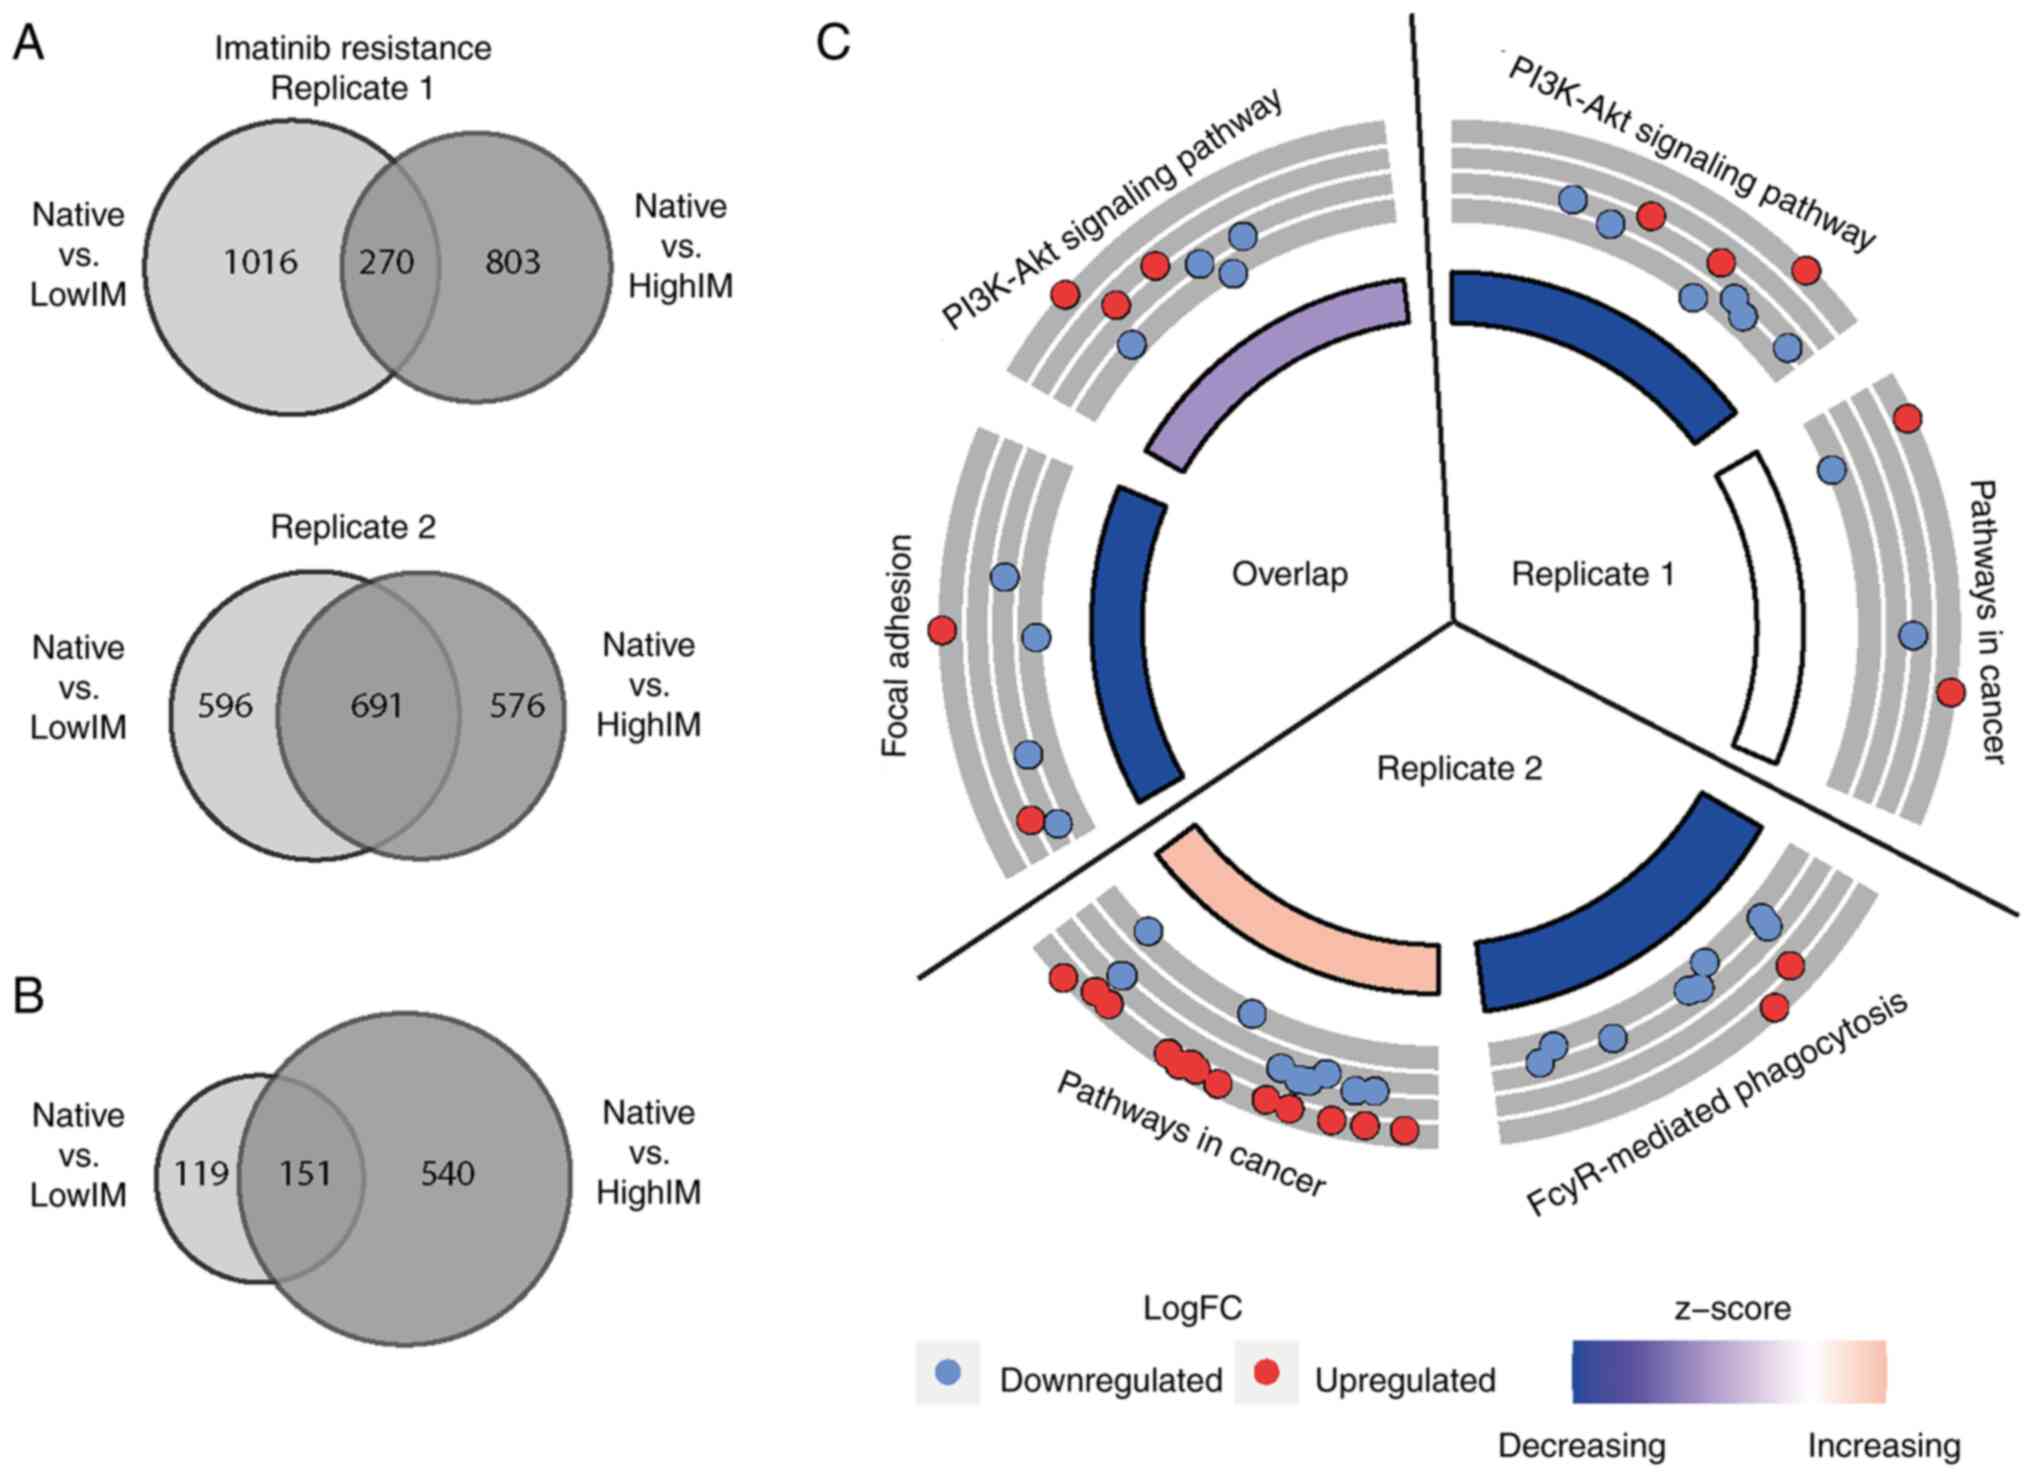
Recurrent expression changes and
pathway analysis of imatinib and nilotinib resistance
The extent of gene expression changes among imatinib
resistant CML cells differed with respect to imatinib
concentration, but also between the biological replicates. In
replicate 1, there was a total of 270 genes that were
differentially expressed in lowIM, as well as highIM concentrations
compared with native CML cells. By contrast, in replicate 2, a
total of 691 genes was significantly altered in both, lowIM and
highIM resistant sublines compared with their native progenitor
cells (Fig. 2A). Genes being
differentially expressed in both replicates in both imatinib
concentrations were considered as most promising to be associated
with drug resistance. There were 151 unidirectional differentially
expressed genes, 67 among them were upregulated and 84
downregulated in resistant cell lines compared with native cells
(Fig. 2B). For these genes,
pathway prediction was performed disclosing an enrichment in
signaling pathways and malignant signaling transduction in cancer
(R1: Padj=0.05, R2: Padj=0.04). Further,
genes involved in focal adhesion pathways were found to be enriched
in the biological replicates of imatinib resistant sublines
compared with TKI native cells (Padj=0.01), among them
B-cell lymphoma 2 (BCL-2), insulin-like growth factor 1
(IGF1), reelin (RELN) and fibronectin 1 (FN1)
(Fig. 2C, Table SI). For nilotinib resistance, no
significant enrichment of pathways was detected for the overlap of
the two biological replicates. When comparing gene expression of
all replicates of imatinib and nilotinib resistance, there was an
overlap of 71 genes concomitantly dysregulated (Fig. S2). For these genes, the pathway
prediction analysis revealed no enrichment. However, STRING
analysis showed a network involving FN1, serglycin
(SRGN) and IGF1 with the highest downregulation for
FN1 in all TKI resistant sublines (fold change: highIM
−11.24, N −11.95, Fig. S2).
Methylation alterations in imatinib
and nilotinib resistance
Genome-wide methylation analyses were performed to
compare alterations during the development of TKI resistance of
imatinib and nilotinib resistant sublines. Overall, genome-wide
methylation profiles displayed a pattern similar to the gene
expression profiles as revealed by the respective PCA (Fig. 3A). In imatinib resistant sublines,
6.6 to 11.2% of CpGs were differentially methylated, while 5.0 to
9.5% of CpGs were differentially methylated in nilotinib resistance
(Fig. 3B). Applying a filter of ≥3
concurrently altered CpGs per gene, 4.0 to 7.5% CpGs were
differentially methylated in imatinib resistance. Of note, large
differences were observed in nilotinib resistance with 6.0% in N-R1
and 2.7% in N-R2 (Fig. 3B).
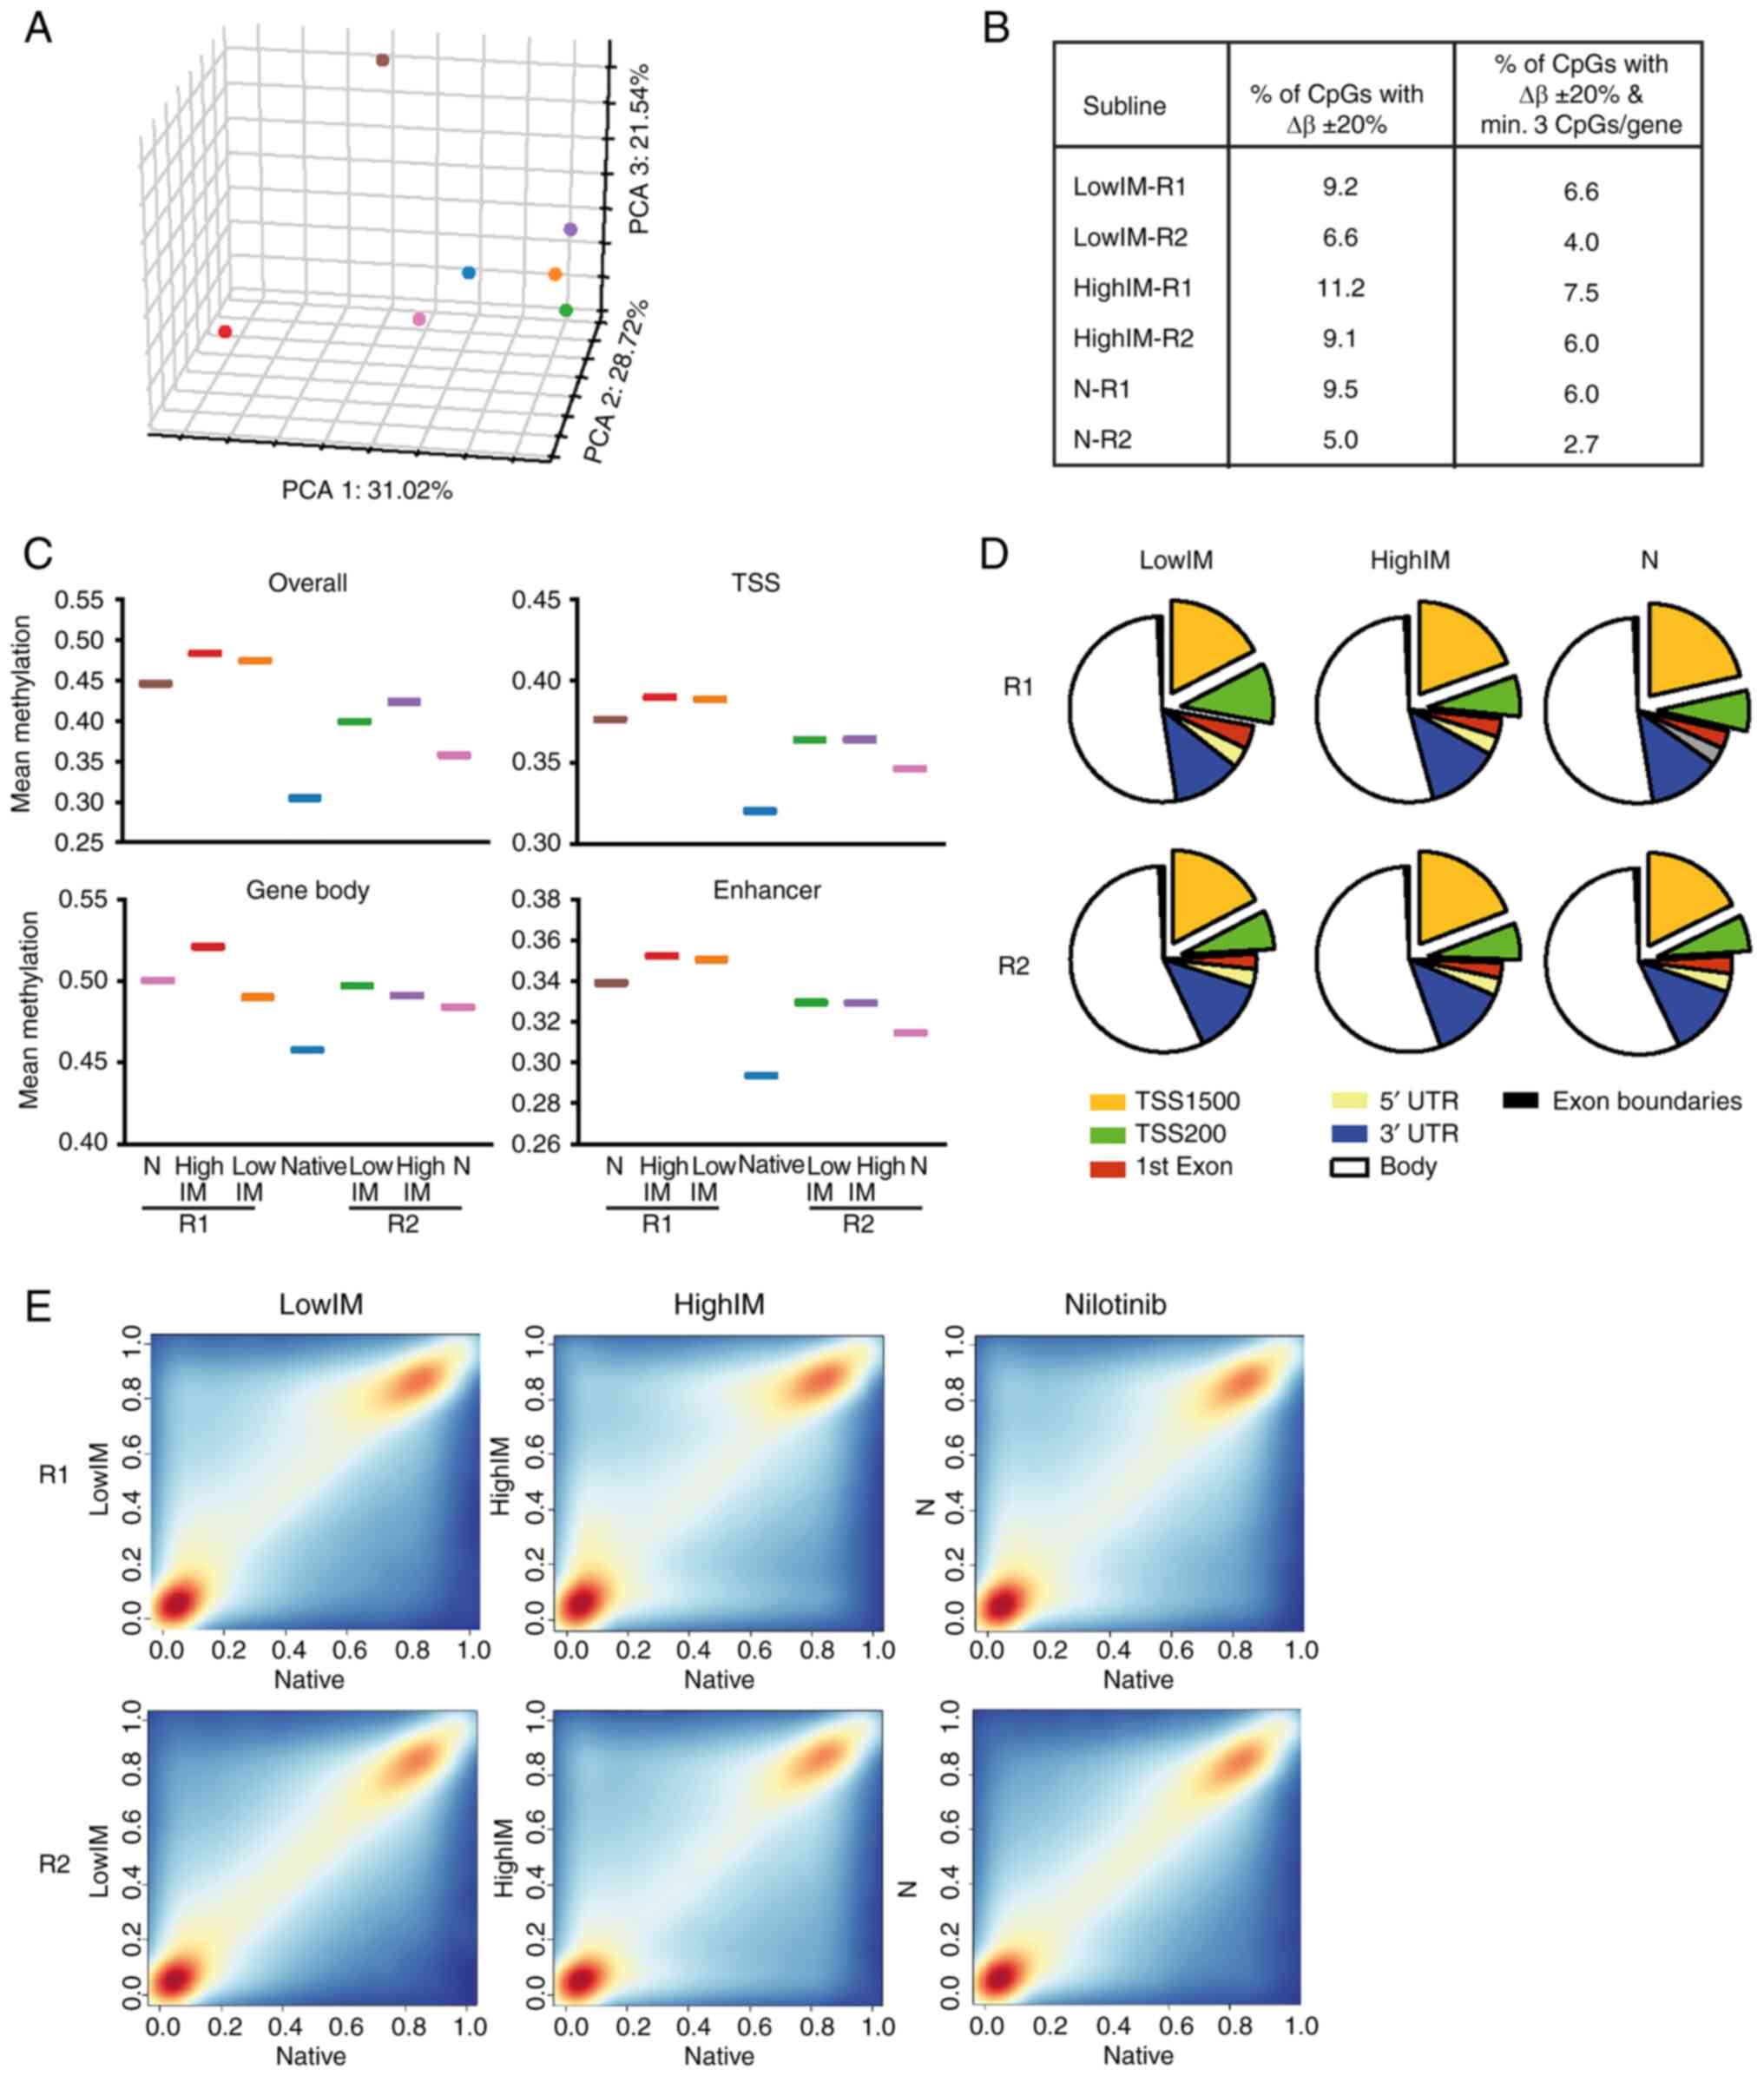 | Figure 3.Genome-wide methylation profile of
TKI resistance. (A) PCA of TKI resistant sublines. Blue: native
cells; orange: lowIM-R1; green: lowIM-R2; red: highIM-R1; purple:
highIM-R2; brown: N-R1; pink: N-R2. (B) Percentage of
differentially methylated CpGs in TKI resistant sublines compared
with native K-562 with Δβ ± 20 % and Padj<0.05 and
filtered for minimum 3 CpGs per gene. (C) Mean methylation of TKI
resistant cell lines depicted for overall, TSS, gene body and
enhancer methylation. (D) Distribution of differentially methylated
CpGs in genomic regions in each subline of TKI resistance. (E)
Frequency scatter plots of differentially methylated CpGs in all
genomic regions of each TKI resistant subline. Red:
hypermethylation; blue: hypomethylation. TKI, tyrosine kinase
inhibitor; TSS, transcription start site; lowIM, 0.5 µM imatinib
resistant; highIM, 2 µM imatinib resistant; N, 0.1 µM nilotinib
resistant; R1, resistant subline 1; R2, resistant subline 2; PCA,
principle component analysis. |
Next, mean DNA methylation of the TKI resistant
sublines was analyzed taking into account the genomic localization.
An increase in overall DNA methylation (in all genomic regions), as
well as in transcriptional start side (TSS), gene body and enhancer
region methylation were observed in all resistant sublines compared
with native K-562 cells (Fig. 3C).
Regarding the distribution of differentially methylated CpGs in the
genome, hardly any difference was detected between TKI resistant
sublines (Fig. 3D). The increase
in methylation in all genomic regions was also visible in the
frequency distribution of each TKI resistant subline showing a
hypermethylation particularly in highIM, but less pronounced in
lowIM and nilotinib (Fig. 3E).
These findings suggested moderate methylation changes in the TKI
resistant cell lines compared with their native counterparts.
Association of DNA methylation and
gene expression in TKI resistance
In an analysis of genes that were both
differentially expressed and differentially methylated, and thereby
potentially altered by methylation, 50 genes were detected in all
biological replicate of imatinib resistance (Table SII). In nilotinib resistance,
large differences between the replicates were observed with 95
genes in N-R1 and 21 in N-R2. The overlap of genes being
differentially methylated and expressed between the biological
replicates was 12 in lowIM, 17 in highIM and 7 for nilotinib
resistant cells (Table SIII).
Filtering for differentially expressed genes with differentially
methylated CpGs in the TSS region of the respective genes in all
biological replicates, only 5 genes, namely BCL-2, PDE4DIP, NMU,
IFI30 and DNASE2 were detected (Table SIII). For four of these five genes
(DNASE2, IFI30, NMU and PDE4DIP), mRNA-downregulation
in lowIM and highIM was confirmed by RT-qPCR (Fig. S3). This suggested that consistent
methylation changes during development of TKI resistance are
limited to distinct genes.
Aberrant cell adhesion signaling
reveals fibronectin 1 as modulator of imatinib resistance
The gene expression profiles of imatinib resistant
cell lines pointed to dysregulation of cell adhesion signaling
indicated by pathway enrichment in focal adhesion and
PI3K-Akt-signaling. Among the differentially expressed genes,
expression of the extracellular matrix protein FN1 was most
substantially reduced in imatinib resistance compared with native
cells (mean fold change: −9.8,
Padj=9.5×10⁻¹⁵). This gene was also
considerably downregulated in both replicates of nilotinib
resistance (mean fold change: −11.9,
Padj=1.8×10⁻⁷). FN1 dysregulation was
confirmed by comparing native K-562 with lowIM and highIM cells on
mRNA and protein level, respectively. FN1 mRNA was
significantly decreased in all tested imatinib resistant sublines
compared with native cells (lowIM: P<0.001, highIM: P<0.001;
Fig. 4A). A similar result was
obtained on protein level, as FN1 showed lower abundance in all
imatinib resistant cell lines compared with native cells (lowIM:
P<0.001, highIM: P<0.001; Fig.
4B). In a next step, cell adhesion capacity of imatinib
resistant cell lines was analyzed investigating the binding to
Matrigel-coated plates and compared with the binding capacity of
native K-562 cells. A significantly reduced cell adhesion capacity
was only detected in lowIM-R2 (P=0.02; Fig. 4C).
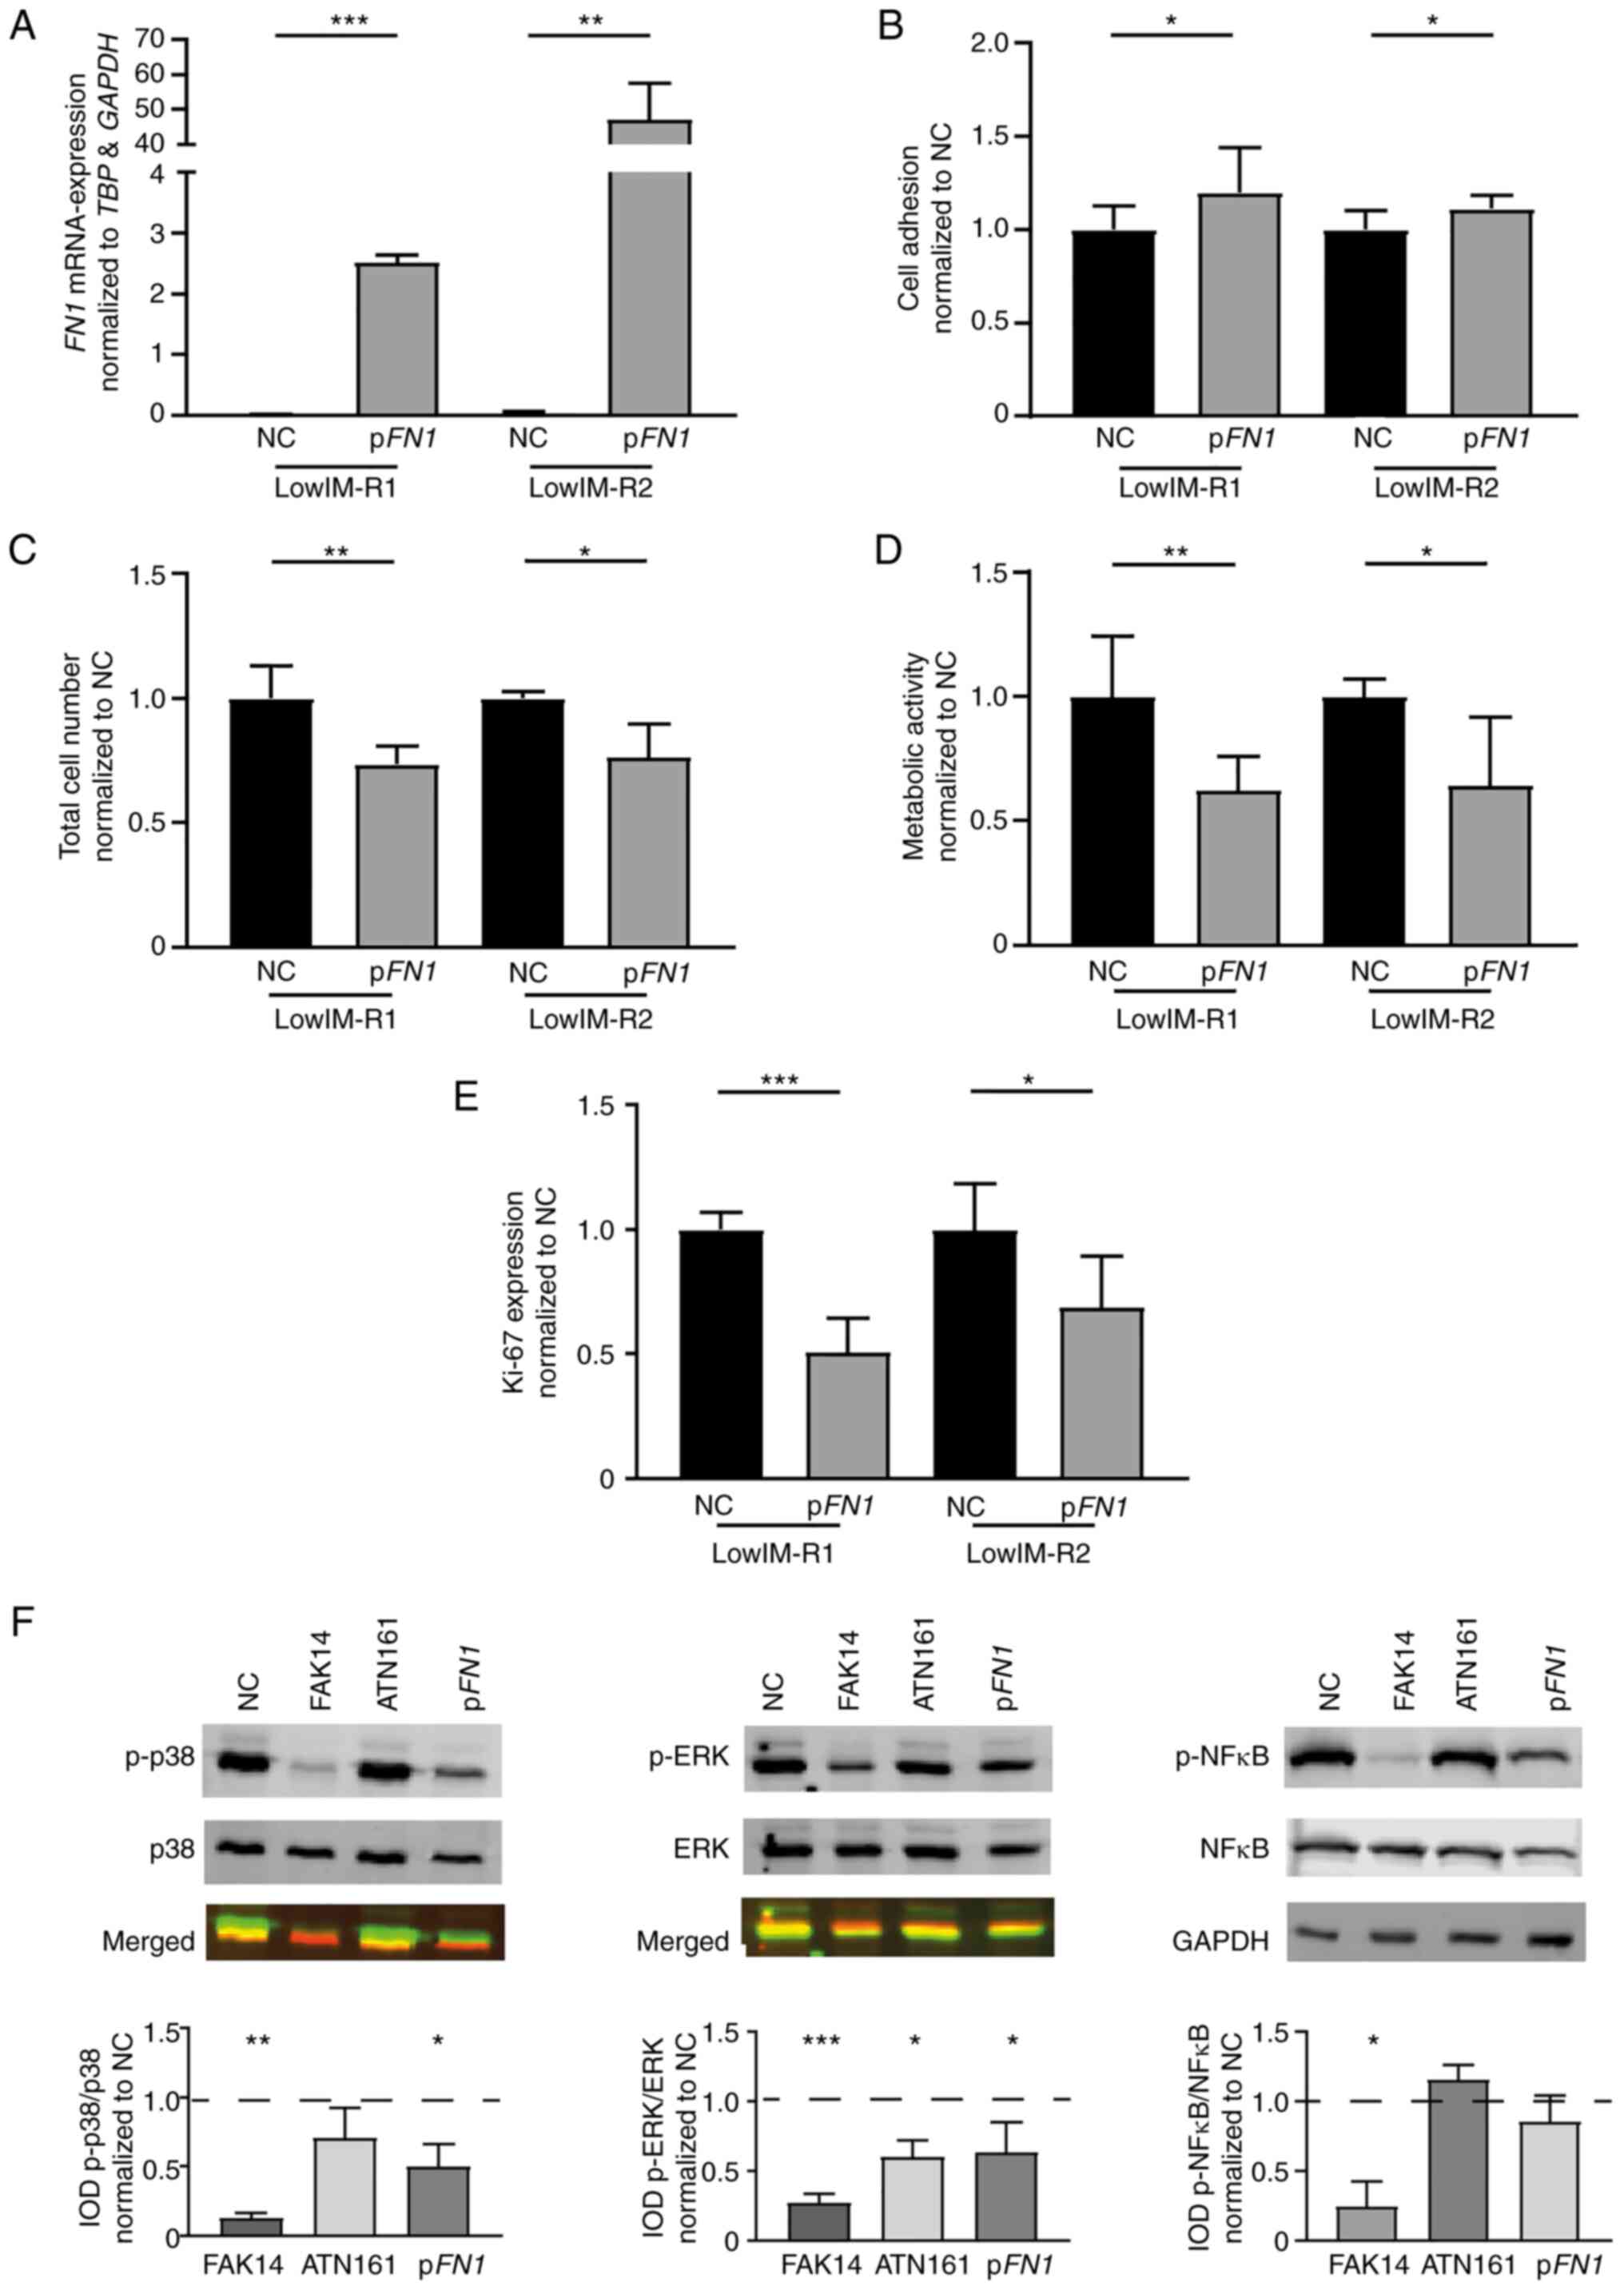
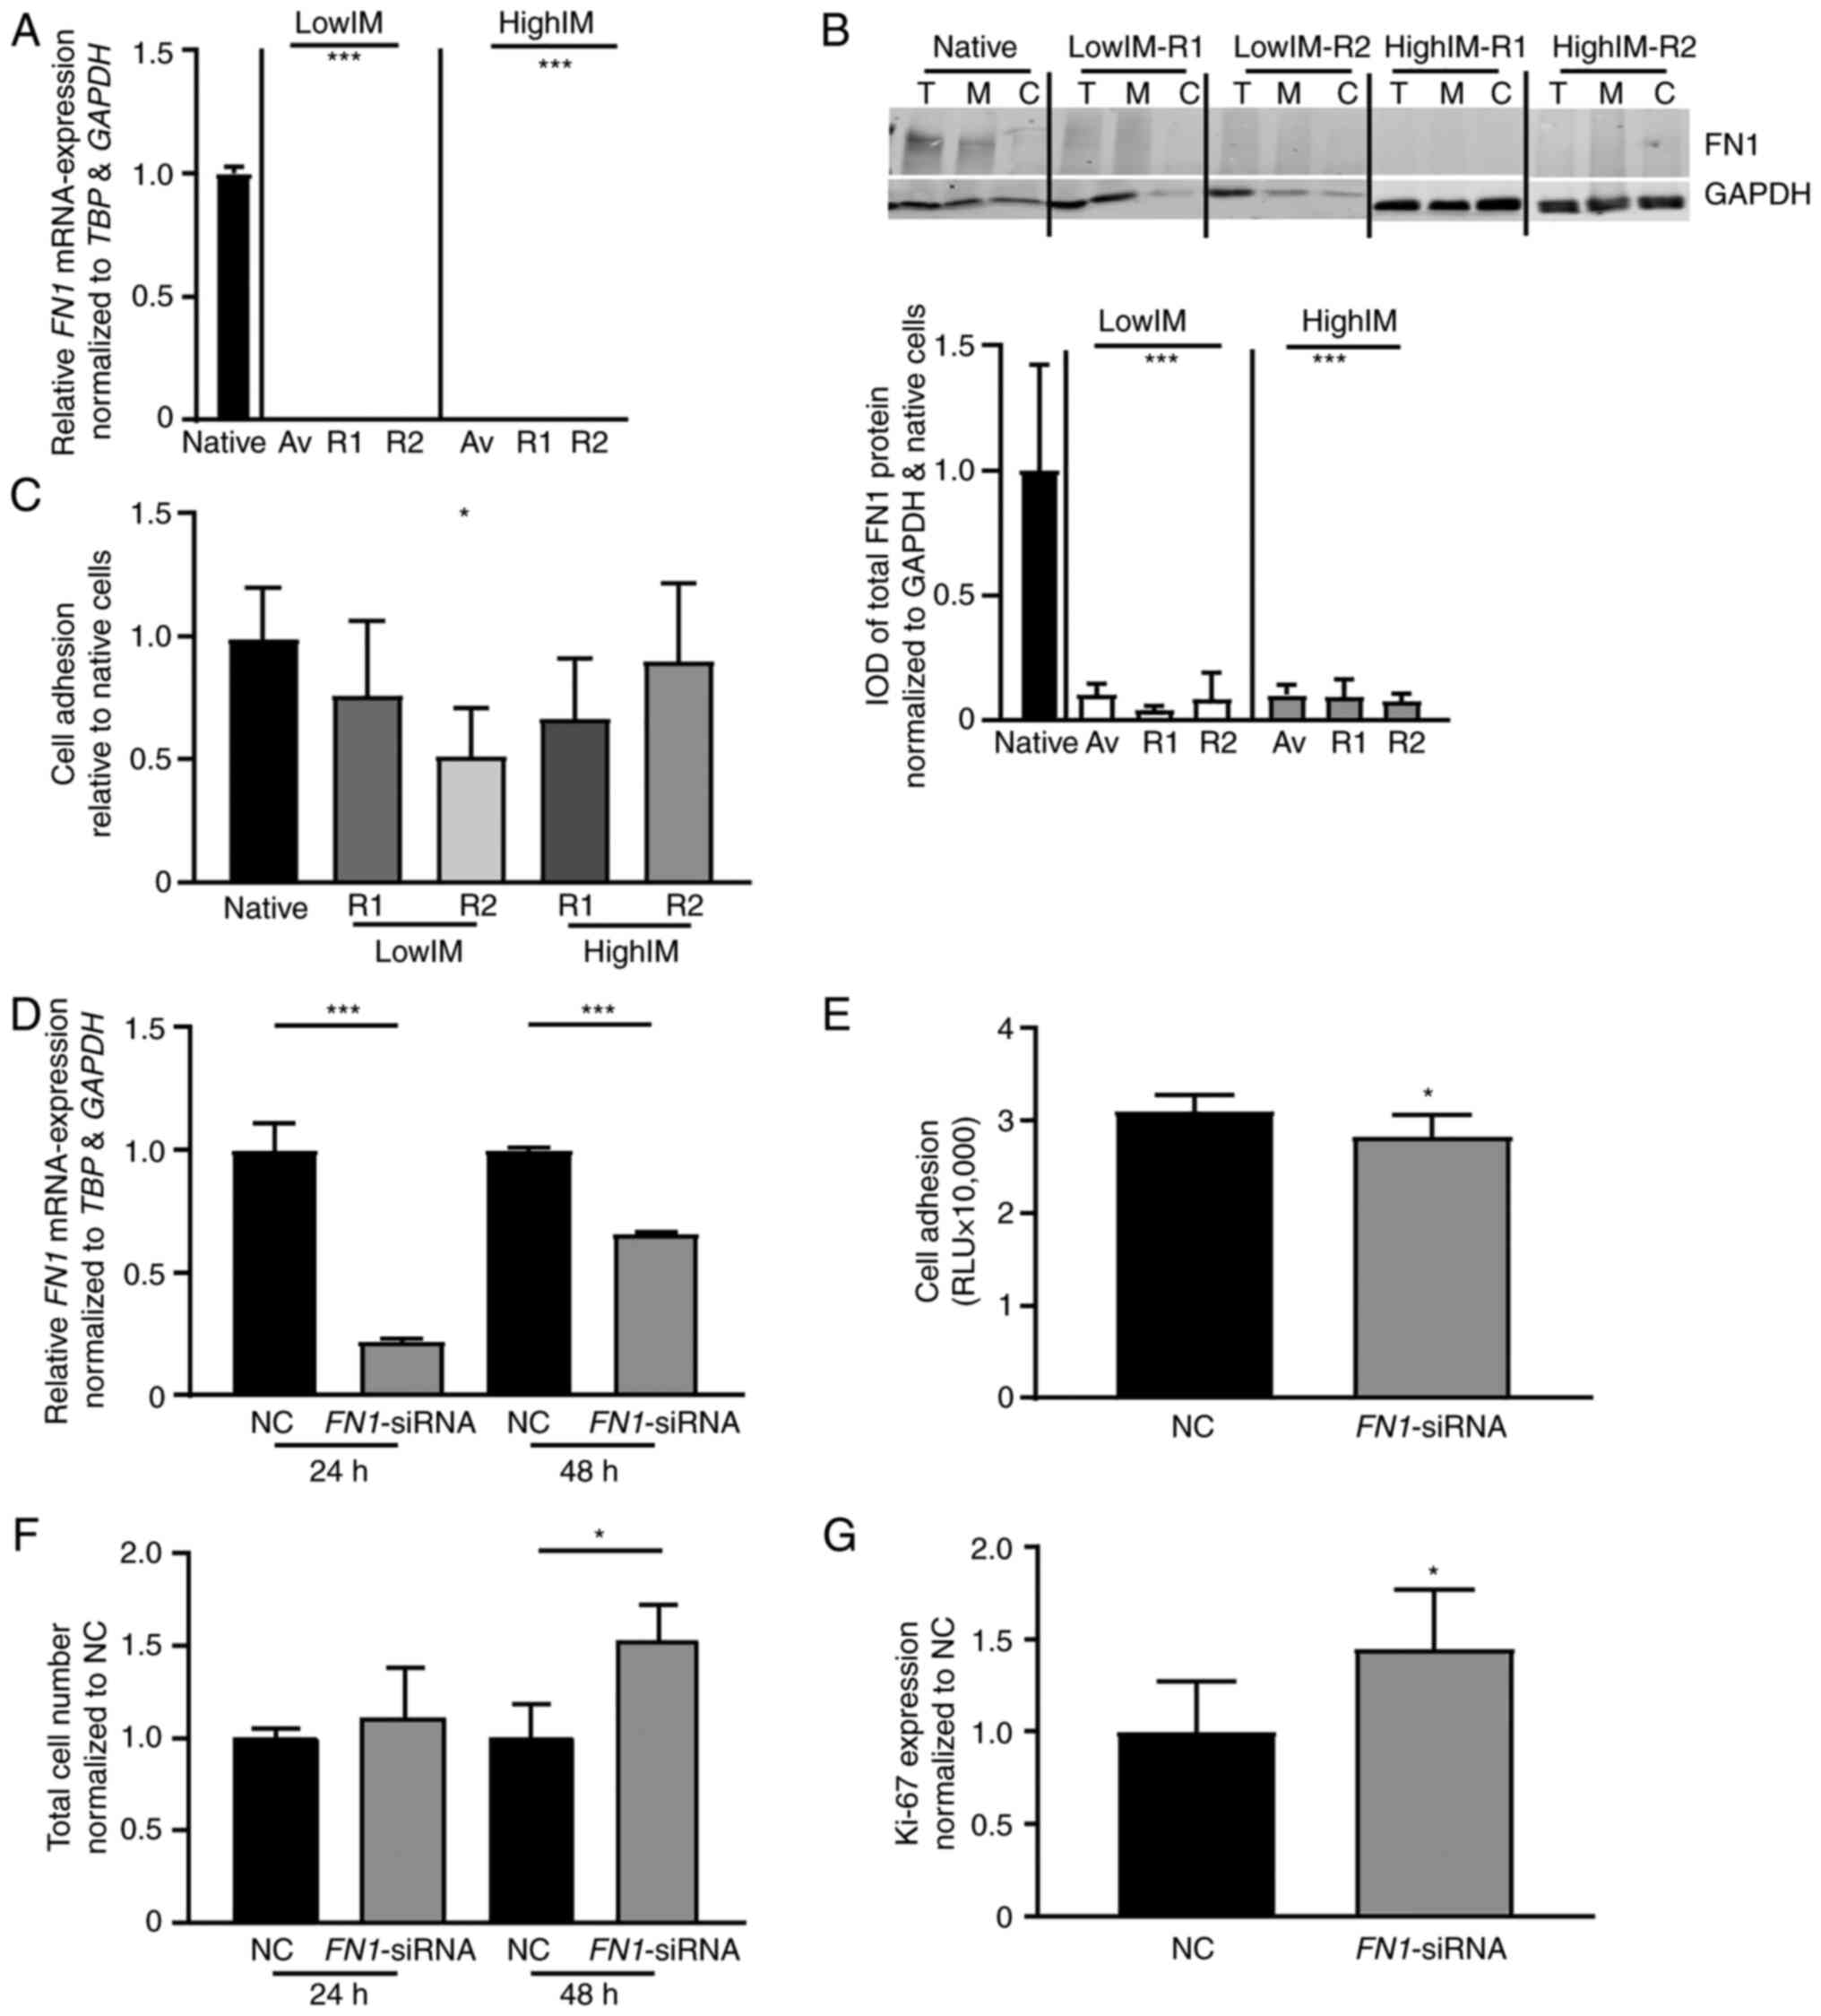 | Figure 4.FN1 expression and
siRNA-mediated knockdown in CML cells. (A-C) FN1 expression
in IM-resistant sublines. (A) mRNA expression of FN1 in
IM-resistant sublines compared with TBP, GAPDH and relative
to native cells. (B) Immunoblotting against FN1 in IM-resistant
sublines (top panel) followed by densitometric analyses (lower
panel) compared with GAPDH. Av, Average/mean expression; T, Total
protein; M, Membrane fraction; C, Cytosolic fraction. (C) Cell
adhesion capacity of IM-resistant K-562 cells to Matrigel coated
surfaces normalized to native cells. (D-G) siRNA-mediated knockdown
of FN1 in K-562 cells. (D) FN1-mRNA expression 24 and
48 h after siRNA-transfection analyzed by reverse
transcription-quantitative PCR and normalized to TBP, GAPDH
and NC. (E) Cell adhesion capacity of K-562 cells after
siRNA-transfection. (F) Total cell number measured by trypan blue
staining and (G) Ki-67 expression after siRNA-transfection of K-562
cells after exposure to 2 µM IM and normalized to NC. N=3;
*P<0.05 and ***P<0.001. FN1, matrix protein fibronectin 1;
CML, chronic myeloid leukemia; lowIM, 0.5 µM imatinib resistant;
highIM, 2 µM imatinib resistant; R1, resistant subline 1; R2,
resistant subline 2; IM, imatinib; IOD, integrated optical density;
NC, negative control transfection; RLU, relative luminescence
units; siRNA, small interfering RNA. |
Next, siRNA-mediated knockdown of FN1
expression was performed in native K-562 cells. Transfection of a
FN1-specific siRNA led to a significant reduction of
FN1-expression after 24 (P<0.001) and 48 h (P<0.001),
accompanied by reduced cell adhesion to Matrigel (P=0.02; Fig. 4D and E). Moreover, under exposure
to 2 µM imatinib, FN1-knockdown resulted in a 1.5-fold
higher cell number after 48 h (P=0.03), as well as a 1.45-fold
higher Ki-67 expression (P=0.04; Fig.
4F and G). This indicated a decreased imatinib susceptibility
after knockdown of FN1.
Vice versa, lowIM cells were transfected with an
FN1-encoding expression plasmid. Overexpression of
FN1 in lowIM-R1 (P<0.001) and lowIM-R2 (P=0.002, Fig. 5A) led to increased cell adhesion to
Matrigel (lowIM-R1: 19.9 %, P=0.03; lowIM-R2: 11.3%, P=0.04;
Fig. 5B). Moreover, after
restoration of FN1-expression, imatinib resistant sublines
showed reduced cell numbers (lowIM-R1: −26.5%, P=0.008;
lowIM-R2: −23.4 %, P=0.04; Fig. 5C), cell viability (lowIM-R1:
−38.7%, P=0.003; lowIM-R2: −33.7%, P=0.004; Fig. 5D), as well as proliferation rates
in both tested cell lines (lowIM-R1: −49.3%, P<0.001;
lowIM-R2: P=0.04; Fig.
5E) compared with respective sublines without FN1
overexpression. These data indicated that FN1 affects the response
to imatinib in CML cells.
As FN1 is known to activate integrin α5β1, which
leads to intracellular signaling via the focal adhesion kinase
(FAK) and subsequently alteration of survival and proliferation
signaling via MAP kinase, p38 and NFκB pathways, lowIM-R1 cells
were transfected with FN1 and effects on the intracellular
signaling cascade were analyzed. Restoration of FN1 expression led
to a significant decrease in p38- (−0.50, P=0.04) and
ERK-phosphorylation (−0.36, P=0.04), but not of NFκB (Fig. 5F). Inhibition of integrin α5β1 by
ATN-161 in lowIM-R1 cells led to a reduction of ERK-phosphorylation
(−0.40, P=0.04), while FAK inhibition using FAK14 led to a decrease
in p-p38 (−0.87, P=0.002), p-ERK (−0.72, P<0.001) and p-NFκB
(−0,76, P=0.01). These findings stand in line with the observed
reduction in total cell number and proliferation rate after
FN1-transfection (Fig. 5F).
Discussion
Using an in vitro-CML cell line model of drug
resistance against imatinib and nilotinib, drug
concentration-dependent differences were detected in overall gene
expression and DNA methylation. Differential expression of genes
associated with cell adhesion signaling, particularly FN1,
was observed as a common phenomenon in all imatinib resistant, but
also nilotinib resistant sublines. FN1 was proven to improve
imatinib susceptibility by transfection experiments.
In the present study, gene expression profiles of
treatment-naïve and TKI resistant cell lines were obtained using
microarrays. These arrays are a well-established system to analyze
gene expression, biomarker identification or genotyping (25,26).
Although next generation sequencing has several benefits, such as
being a flexible, open, but also cost-intensive system for a high
coverage, microarrays still provide a useful tool for expression
analyses of low expressed genes, thereby being a closed system with
only a limited straightforward bioinformatic pipeline (26). The HuGene 2.0 ST arrays (as well as
their successor Clariom D) from Affymetrix/Thermo Fisher
Scientific, Inc. are well known to have a high reproducibility of
>0.9 (27–29). However, to cope with experimental
validation, 4 technical replicates for each cell line were included
into our analyses. These replicates showed a high reproducibility,
as visible in the PCA, but also in the number of dysregulated genes
leading to the assumption that the observed differences in the gene
expression profiles are indeed due to differences in the resistant
cell lines and not due to methodological problems. In the gene
expression profiles, there were relatively large differences
between the replicates of cells being resistant to high
concentrations of imatinib or to nilotinib, but less differences
were observed in cells being resistant to low imatinib
concentrations. This gives hint to dose-dependent mechanisms of
resistance standing in line with previous studies (30,31).
Only few similarities of differentially expressed genes could be
detected between the two TKIs indicating distinct mechanisms of
resistance against TKIs. A similar phenomenon was described in a
study from Kim et al (31),
in a comparison of nilotinib to imatinib resistant cells showing
profound differences in the expression profile of TKI resistant
sublines and only a small overlap. In the present study, recurrent
differential expression of genes associated with PI3K-Akt signaling
and focal adhesion was observed in all imatinib resistant sublines
compared with native K-562 cells. In a previous study from Chung
et al (30), overexpression
of genes associated with transcription or apoptosis was determined,
as well as downregulation of protein and energy metabolism. As
signaling transduction was significantly altered in our model, this
only partially stands in line with the present findings. Regarding
the observed gene expression changes associated with cell adhesion
signaling in imatinib resistance, this was also detected by Kim
et al (31) showing
upregulation of genes associated with cell adhesion in TKI
resistant cells.
In several studies, it was shown that cell adhesion
plays an important role in leukemia, as it affects the interaction
of tumor cells with the bone marrow microenvironment or stroma
(32). In addition,
hyperactivation of the tyrosine kinase BCR-ABL1 was shown to change
the leukemic phenotype, as well as the activation state of cell
adhesion molecules, for example beta-1 integrins (33–36).
In the present study, a downregulation of FN1 in imatinib resistant
cells was observed compared with their native counterparts. In
several in vitro-studies, it was shown that adhesion to
extracellular matrix proteins, for example FN1, promotes apoptotic
resistance under TKI treatment and the binding is influenced by
these drugs contributing to the term ‘cell adhesion-mediated drug
resistance’ (37,38). These studies were performed using
treatment-naïve cells analyzing the drug response and not cells
with a persistent resistance. In both studies, FN1 was used to coat
surfaces and measure cell adhesion. However, in the present study,
FN1-transfection experiments were performed to directly analyze its
role in TKI resistance demonstrating that FN1 itself influences the
response to TKIs. This revealed that binding to FN1 protects the
cells to initial exposure of treatment-naïve cells to imatinib,
while in the present study, it was also possible to restore
imatinib susceptibility of already resistant cells by FN1
transfection. Therefore, it appears that not only the binding to
extracellular FN1 modulates drug resistance, but the production of
FN1 by the cell itself can influence drug response and resistance.
These findings suggested that FN1 does not only play a role as
adhesion molecule, but also impairs TKI resistance. In a study from
Kumar et al (39), it was
demonstrated that TKI resistance mediated by the BCR-ABL1
gatekeeper mutation T315I alters cell adhesion and niche
localization compared wild-type BCR-ABL1 by increased expression of
integrin β3 and integrin-like kinase (ILK). Thereby the deposition
of FN1 was decreased promoting malignant progression. In addition,
it was identified that treatment of BCR-ABLT315I CML
with FN1 or an ILK inhibitor significantly increases survival of
mice in a xenograft model (39).
It was observed that FN1 knockdown indeed enhanced imatinib
resistance, while restoration of FN1 expression in imatinib
resistant sublines re-established imatinib sensitivity. These
findings stand in line with the observed inhibition of
proliferation after FN1 treatment of BCR-ABLT315I, but
also B-ALL cells (39,40). However, significant dysregulation
of either integrin β3 or ILK in the gene expression profiles of our
in vitro-model was not observed. After restoration of
FN1-expression in imatinib resistant cells, a decrease of p38 and
ERK-phosphorylation was observed pointing to an involvement of
these pathways to the detected decreased proliferation and cell
numbers after FN1 transfection. While the effect was less
pronounced for FN1 compared with FAK inhibition, the absence of
effects after integrin α5β1 inhibition revealed that this receptor
does not solely promote the effects of FN1. Further studies may
reveal how FN1 is regulated in imatinib-resistant cell lines and
which players additionally contribute to the observed
phenomenon.
Genome-wide methylation analyses showed a slight
increase in overall methylation in imatinib and nilotinib
resistance. In drug-resistant cancers, a variable extent of
dysregulated methylation dependent on the drug and tumor was
described, for instance 65% hypermethylated genes in patients with
colorectal cancer undergoing 5-fluorouracil treatment or 44%
hypermethylated genes in cisplatin-resistant lung adenocarcinoma
A549 cells (41–43). For CML, it was revealed that DNA
methylation increases moderately in blast crisis compared with
chronic phase (44). In addition,
it was demonstrated that the BCR-ABL1 fusion protein is able to
alter DNA methylation, which can be reversed by imatinib or
5-azacytidine (45). Amabile et
al (45) also found that only
less than half of the differential methylated regions were
associated with promoter regions in their CML tumorigenesis model
consistent with observations of differential methylation in all
genomic regions detected in the present study. It was identified
that solely distinct genes were differentially methylated after TKI
exposure or in TKI resistance, for instance PTEN, PDLIM4, BIM,
HOXA4, OSCP1 or NPM2 (10,46–48).
In the present study, hypermethylation of these genes was not
detected, but BCL2 (B-cell lymphoma 2), PDE4DIP
(phosphodiesterase 4D interacting protein), NMU (neuromedin
U), IFI30 (gamma-interferon-inducible lysosomal thiol
reductase) and DNASE2 (deoxyribonuclease-2-alpha) were
identified as candidate genes that were downregulated in imatinib
resistance-potentially by DNA methylation in their promoter region.
With BCL2, DNASE2 and PDE4DIP, three of five genes
encode for regulators of apoptosis and cell cycle, it could be
hypothsized that these genes are involved in the development of TKI
resistance. However, further studies are necessary to reveal
whether these genes and their DNA methylation are involved in the
development of TKI resistance or could be used as potential
prognostic biomarkers.
Studying drug resistance by using in
vitro-cell lines is useful to identify mechanisms of
resistance, to establish treatment protocols and to predict drug
efficacy (49–51). The experiments are performed with
cell lines derived almost exclusively as one single biological
sample of a resistant cell line generated either by pulse treatment
or continuous administration of increasing drug concentrations to
the cells (52). For our in
vitro-model, drug concentrations of 0.5 and 2 µM imatinib and
0.1 µM nilotinib were used to generate biological replicates of
resistant sublines. The imatinib concentrations used depict the
plasma levels measured in TKI-treated CML patients and reflect
their high variation from 0.34 to 3 µM (53–55).
A total of 0.1 µM nilotinib, however, was used to consider the
20-fold higher potency of nilotinib compared with imatinib
(4). As in vitro-drug
resistance models are generally only generated once,
reproducibility is often lacking and therefore, transfer to the
clinical situation is limited (51). Drug resistance models for CML were
mainly obtained using a similar TKI concentration range and the
same cell line model. However, large differences were observed, for
instance shown for the influence of drug transporters in TKI
resistance (56–59). This may be due to different TKI
concentrations, cell line passages or clonal evolution occurring
during the development of TKI resistance. Accordingly, biological
replicates are essential to overcome this limitation and identify
recurrent mechanisms of resistance. Therefore, biological
replicates of TKI resistance were developed using the CML cell line
K-562 to study recurrent mechanisms of resistance against imatinib
and nilotinib. Although it was possible to identify alterations in
cell adhesion signaling as potential recurrent mechanism of TKI
resistance, the differences between the biological replicates
indicated that genetic aberrations occurring during the development
of resistance additionally contribute to this phenomenon.
In conclusion, studying TKI resistance in
vitro, a TKI- and concentration-dependent change in genome-wide
gene expression was observed. Further, a slight hypermethylation in
TKI resistance was detected. However, the extent of gene and also
methylation changes differed markedly between biological replicates
demonstrating that biological replicates are crucial applying such
models of acquired drug resistance. Notably, cell adhesion
signaling, in particular the cellular matrix protein FN1, was found
to be dysregulated in all resistant sublines. As proof of
principle, experimental downregulation of FN1 led to a reduction of
imatinib susceptibility indicating that FN1 may play a role in
imatinib resistance and could potentially be used as a biomarker or
target for future therapies.
Supplementary Material
Supporting Data
Supporting Data
Acknowledgements
The authors would like thank Irina Naujoks, Anna
Jürgensen and Britta Schwarten, Institute of Experimental and
Clinical Pharmacology, University Hospital Schleswig-Holstein,
Kiel, for outstanding technical assistance, the Institute of
Clinical Molecular Biology in Kiel for providing Sanger sequencing
as supported in part by the DFG Clusters of Excellence ‘Precision
Medicine in Chronic Inflammation’ and ‘ROOTS’ and Claudia Becher,
Institute of Human Genetics, University Hospital
Schleswig-Holstein, Kiel, for her technical assistance.
Funding
The present study was supported by a grant of the Medical
Faculty of the University of Kiel.
Availability of data and materials
Genome-wide gene expression (GSE203342, http://www.ncbi.nlm.nih.gov/geo/query/acc.cgi?acc=GSE203442)
and methylation (GSE203443, http://www.ncbi.nlm.nih.gov/geo/query/acc.cgi?acc=GSE203443)
datasets are available in the GEO repository. Further data
generated and analyzed during this study are included in this
published article and its supplementary information files.
Authors' contributions
MK and IN concepted the study and designed the
research. MK, ML and JK performed the experiments. MK, ML, RB and
OA analyzed the data. MK, HB and IN interpreted the data. MK, IC
and IN wrote the manuscript. All authors read approved the final
version of the manuscript. MK and IC confirm the authenticity of
all the raw data.
Ethics approval and consent to
participate
Not applicable.
Patient consent for publication
Not applicable.
Competing interests
The authors declare that they have no competing
interests.
References
|
1
|
Deininger MW, Goldman JM and Melo JV: The
molecular biology of chronic myeloid leukemia. Blood. 96:3343–3356.
2000. View Article : Google Scholar : PubMed/NCBI
|
|
2
|
Quintas-Cardama A and Cortes J: Molecular
biology of bcr-abl1-positive chronic myeloid leukemia. Blood.
113:1619–1630. 2009. View Article : Google Scholar : PubMed/NCBI
|
|
3
|
Druker BJ, Tamura S, Buchdunger E, Ohno S,
Segal GM, Fanning S, Zimmermann J and Lydon NB: Effects of a
selective inhibitor of the Abl tyrosine kinase on the growth of
Bcr-Abl positive cells. Nat Med. 2:561–566. 1996. View Article : Google Scholar : PubMed/NCBI
|
|
4
|
Baccarani M, Deininger MW, Rosti G,
Hochhaus A, Soverini S, Apperley JF, Cervantes F, Clark RE, Cortes
JE, Guilhot F, et al: European LeukemiaNet recommendations for the
management of chronic myeloid leukemia: 2013. Blood. 122:872–884.
2013. View Article : Google Scholar : PubMed/NCBI
|
|
5
|
Hochhaus A, Larson RA, Guilhot F, Radich
JP, Branford S, Hughes TP, Baccarani M, Deininger MW, Cervantes F,
Fujihara S, et al: Long-term outcomes of imatinib treatment for
chronic myeloid leukemia. N Engl J Med. 376:917–927. 2017.
View Article : Google Scholar : PubMed/NCBI
|
|
6
|
Milojkovic D and Apperley J: Mechanisms of
resistance to imatinib and second-generation tyrosine inhibitors in
chronic myeloid leukemia. Clin Cancer Res. 15:7519–7527. 2009.
View Article : Google Scholar : PubMed/NCBI
|
|
7
|
Soverini S, De Benedittis C, Papayannidis
C, Paolini S, Venturi C, Iacobucci I, Luppi M, Bresciani P,
Salvucci M, Russo D, et al: Drug resistance and BCR-ABL kinase
domain mutations in Philadelphia chromosome-positive acute
lymphoblastic leukemia from the imatinib to the second-generation
tyrosine kinase inhibitor era: The main changes are in the type of
mutations, but not in the frequency of mutation involvement.
Cancer. 120:1002–1009. 2014. View Article : Google Scholar : PubMed/NCBI
|
|
8
|
Zabriskie MS, Eide CA, Tantravahi SK,
Vellore NA, Estrada J, Nicolini FE, Khoury HJ, Larson RA, Konopleva
M, Cortes JE, et al: BCR-ABL1 compound mutations combining key
kinase domain positions confer clinical resistance to ponatinib in
Ph chromosome-positive leukemia. Cancer Cell. 26:428–442. 2014.
View Article : Google Scholar : PubMed/NCBI
|
|
9
|
de Lavallade H and Kizilors A: The
importance of mutational analyses in chronic myeloid leukaemia for
treatment choice. Eur Med J Oncol. 4:86–95. 2016.
|
|
10
|
Jelinek J, Gharibyan V, Estecio MR, Kondo
K, He R, Chung W, Lu Y, Zhang N, Liang S, Kantarjian HM, et al:
Aberrant DNA methylation is associated with disease progression,
resistance to imatinib and shortened survival in chronic
myelogenous leukemia. PLoS One. 6:e221102011. View Article : Google Scholar : PubMed/NCBI
|
|
11
|
Turrini E, Haenisch S, Laechelt S, Diewock
T, Bruhn O and Cascorbi I: MicroRNA profiling in K-562 cells under
imatinib treatment: Influence of miR-212 and miR-328 on ABCG2
expression. Pharmacogenet Genomics. 22:198–205. 2012. View Article : Google Scholar : PubMed/NCBI
|
|
12
|
Liu Y, Song Y, Ma W, Zheng W and Yin H:
Decreased microRNA-30a levels are associated with enhanced ABL1 and
BCR-ABL1 expression in chronic myeloid leukemia. Leuk Res.
37:349–356. 2013. View Article : Google Scholar : PubMed/NCBI
|
|
13
|
Shibuta T, Honda E, Shiotsu H, Tanaka Y,
Vellasamy S, Shiratsuchi M and Umemura T: Imatinib induces
demethylation of miR-203 gene: An epigenetic mechanism of
anti-tumor effect of imatinib. Leuk Res. 37:1278–1286. 2013.
View Article : Google Scholar : PubMed/NCBI
|
|
14
|
Cortes J and O'Dwyer ME: Clonal evolution
in chronic myelogenous leukemia. Hematol Oncol Clin North Am.
18:671–684. 2004. View Article : Google Scholar : PubMed/NCBI
|
|
15
|
Corbin AS, Agarwal A, Loriaux M, Cortes J,
Deininger MW and Druker BJ: Human chronic myeloid leukemia stem
cells are insensitive to imatinib despite inhibition of BCR-ABL
activity. J Clin Invest. 121:396–409. 2011. View Article : Google Scholar : PubMed/NCBI
|
|
16
|
Hamad A, Sahli Z, El Sabban M, Mouteirik M
and Nasr R: Emerging therapeutic strategies for targeting chronic
myeloid leukemia stem cells. Stem Cells Int. 2013:7243602013.
View Article : Google Scholar : PubMed/NCBI
|
|
17
|
Kaehler M, Ruemenapp J, Gonnermann D,
Nagel I, Bruhn O, Haenisch S, Ammerpohl O, Wesch D, Cascorbi I and
Bruckmueller H: MicroRNA-212/ABCG2-axis contributes to development
of imatinib-resistance in leukemic cells. Oncotarget.
8:92018–92031. 2017. View Article : Google Scholar : PubMed/NCBI
|
|
18
|
Oliveros JC: An interactive tool for
comparing lists with Venn's diagrams. 2007-2015.https://bioinfogp.cnb.csic.es/tools/venny/index.html
|
|
19
|
Walter W, Sanchez-Cabo F and Ricote M:
GOplot: An R package for visually combining expression data with
functional analysis. Bioinformatics. 31:2912–2914. 2015. View Article : Google Scholar : PubMed/NCBI
|
|
20
|
RStudio Team (2020), . RStudio: Integrated
Development for R. RStudio. PBC; Boston, MA: http://www.rstudio.com/
|
|
21
|
Pedregosa F, Varoquaux G, Gramfort A,
Michel V and Thirion B: Scikit-learn: Machine learning in python. J
Machine Learning Research. 12:2825–2830. 2011.
|
|
22
|
Kaehler M, Dworschak M, Rodin JP,
Ruemenapp J, Vater I, Penas EMM, Liu C, Cascorbi I and Nagel I:
Zfp36l1 plays an ambiguous role in the regulation of cell expansion
and negatively regulates Cdkn1a in chronic myeloid leukemia cells.
Exp Hematol. 99:54–64. 2021. View Article : Google Scholar : PubMed/NCBI
|
|
23
|
Waetzig V, Haeusgen W, Andres C, Frehse S,
Reinecke K, Bruckmueller H, Ruwen Boehm H, Herdegen T and Cascorbi
I: Retinoic acid-induced survival effects in SH-SY5Y neuroblastoma
cells. J Cell Biochem. 120:5974–5986. 2019. View Article : Google Scholar : PubMed/NCBI
|
|
24
|
Bruhn O, Lindsay M, Wiebel F, Kaehler M,
Nagel I, Böhm R, Röder C and Cascorbi I: Alternative
polyadenylation of ABC transporters of the C-family (ABCC1, ABCC2,
ABCC3) and implications on posttranscriptional Micro-RNA
regulation. Mol Pharmacol. 97:112–122. 2020. View Article : Google Scholar : PubMed/NCBI
|
|
25
|
Edeki C: Comparative study of microarray
and next generation sequencing technologies. IJCSMC. 1:15–20.
2012.
|
|
26
|
Pop L, Zanoaga O, Chiroi P, Nutu A, Korban
SS, Stefan C, Irimie A and Berindan-Neagoe I: Microarrays and NGS
for drug discovery. Drug Design. Parikesit AA: IntechOpen; 2021
|
|
27
|
Bakay M, Chen YW, Borup R, Zhao P,
Nagaraju K and Hoffman EP: Sources of variability and effect of
experimental approach on expression profiling data interpretation.
BMC Bioinformatics. 3:42002. View Article : Google Scholar : PubMed/NCBI
|
|
28
|
Bammler T, Beyer RP, Bhattacharya S,
Boorman GA, Boyles A, Bradford BU, Bumgarner RE, Bushel PR,
Chaturvedi K, Choi D, et al: Standardizing global gene expression
analysis between laboratories and across platforms. Nat Methods.
2:351–356. 2005. View Article : Google Scholar : PubMed/NCBI
|
|
29
|
Draghici S, Khatri P, Eklund AC and
Szallasi Z: Reliability and reproducibility issues in DNA
microarray measurements. Trends Genet. 22:101–109. 2006. View Article : Google Scholar : PubMed/NCBI
|
|
30
|
Chung YJ, Kim TM, Kim DW, Namkoong H, Kim
HK, Ha SA, Kim S, Shin SM, Kim JH, Lee YJ, et al: Gene expression
signatures associated with the resistance to imatinib. Leukemia.
20:1542–1550. 2006. View Article : Google Scholar : PubMed/NCBI
|
|
31
|
Kim TM, Ha SA, Kim HK, Yoo J, Kim S, Yim
SH, Jung SH, Kim DW, Chung YJ and Kim JW: Gene expression
signatures associated with the in vitro resistance to two tyrosine
kinase inhibitors nilotinib and imatinib. Blood Cancer J.
1:e322011. View Article : Google Scholar : PubMed/NCBI
|
|
32
|
Krause DS and Scadden DT: A hostel for the
hostile: The bone marrow niche in hematologic neoplasms.
Haematologica. 100:1376–1387. 2015. View Article : Google Scholar : PubMed/NCBI
|
|
33
|
Bazzoni G, Carlesso N, Griffin JD and
Hemler ME: Bcr/Abl expression stimulates integrin function in
hematopoietic cell lines. J Clin Invest. 98:521–528. 1996.
View Article : Google Scholar : PubMed/NCBI
|
|
34
|
Nishihara T, Miura Y, Tohyama Y, Mizutani
C, Hishita T, Ichiyama S, Uchiyama T and Tohyama K: Effects of the
tyrosine kinase inhibitor imatinib mesylate on a Bcr-Abl-positive
cell line: Suppression of autonomous cell growth but no effect on
decreased adhesive property and morphological changes. Int J
Hematol. 78:233–240. 2003. View Article : Google Scholar : PubMed/NCBI
|
|
35
|
Li Y, Clough N, Sun X, Yu W, Abbott BL,
Hogan CJ and Dai Z: Bcr-Abl induces abnormal cytoskeleton
remodeling, beta1 integrin clustering and increased cell adhesion
to fibronectin through the Abl interactor 1 pathway. J Cell Sci.
120:1436–1446. 2007. View Article : Google Scholar : PubMed/NCBI
|
|
36
|
Windisch R, Pirschtat N, Kellner C,
Chen-Wichmann L, Lausen J, Humpe A, Krause DS and Wichmann C:
Oncogenic deregulation of cell adhesion molecules in leukemia.
Cancers (Basel). 11:3112019. View Article : Google Scholar : PubMed/NCBI
|
|
37
|
Damiano JS, Hazlehurst LA and Dalton WS:
Cell adhesion-mediated drug resistance (CAM-DR) protects the K562
chronic myelogenous leukemia cell line from apoptosis induced by
BCR/ABL inhibition cytotoxic drugs and gamma-irradiation. Leukemia.
15:1232–1239. 2001. View Article : Google Scholar : PubMed/NCBI
|
|
38
|
Obr A, Roselova P, Grebenova D and
Kuželová K: Real-time analysis of imatinib- and dasatinib-induced
effects on chronic myelogenous leukemia cell interaction with
fibronectin. PLoS One. 9:e1073672014. View Article : Google Scholar : PubMed/NCBI
|
|
39
|
Kumar R, Pereira RS, Zanetti C, Minciacchi
VR, Merten M, Meister M, Niemann J, Dietz MS, Rüssel N, Schnütgen
F, et al: Specific targetable interactions with the
microenvironment influence imatinib-resistant chronic myeloid
leukemia. Leukemia. 34:2087–2101. 2020. View Article : Google Scholar : PubMed/NCBI
|
|
40
|
Wlodek J and Pituch-Noworolska A: The
influence of fibronectin on proliferation and apoptosis of acute
lymphoblastic leukaemia cells in vitro. Pol J Pathol. 69:62–66.
2018. View Article : Google Scholar : PubMed/NCBI
|
|
41
|
Baharudin R, Ab Mutalib NS, Othman SN,
Sagap I, Rose IM, Mokhtar NM and Jamal R: Identification of
predictive DNA methylation biomarkers for chemotherapy response in
colorectal cancer. Front Pharmacol. 8:472017. View Article : Google Scholar : PubMed/NCBI
|
|
42
|
Guo R, Wu G, Li H, Qian P, Han J, Pan F,
Li W, Li J and Ji F: Promoter methylation profiles between human
lung adenocarcinoma multidrug resistant A549/cisplatin (A549/DDP)
cells and its progenitor A549 cells. Biol Pharm Bull. 36:1310–1316.
2013. View Article : Google Scholar : PubMed/NCBI
|
|
43
|
Romero-Garcia S, Prado-Garcia H and
Carlos-Reyes A: Role of DNA methylation in the resistance to
therapy in solid tumors. Front Oncol. 10:11522020. View Article : Google Scholar : PubMed/NCBI
|
|
44
|
Lebecque B, Bourgne C, Vidal V and Berger
MG: DNA methylation and intra-clonal heterogeneity: The chronic
myeloid leukemia model. Cancers (Basel). 13:35872021. View Article : Google Scholar : PubMed/NCBI
|
|
45
|
Amabile G, Di Ruscio A, Müller F, Welner
RS, Yang H, Ebralidze AK, Zhang H, Levantini E, Qi L, Martinelli G,
et al: Dissecting the role of aberrant DNA methylation in human
leukaemia. Nat Commun. 6:70912015. View Article : Google Scholar : PubMed/NCBI
|
|
46
|
Jose-Eneriz ES, Agirre X, Jimenez-Velasco
A, Cordeu L, Martín V, Arqueros V, Gárate L, Fresquet V, Cervantes
F, Martínez-Climent JA, et al: Epigenetic down-regulation of BIM
expression is associated with reduced optimal responses to imatinib
treatment in chronic myeloid leukaemia. Eur J Cancer. 45:1877–1889.
2009. View Article : Google Scholar : PubMed/NCBI
|
|
47
|
Elias MH, Baba AA, Husin A, Sulong S,
Hassan R, Sim GA, Wahid SFA and Ankathil R: HOXA4 gene promoter
hypermethylation as an epigenetic mechanism mediating resistance to
imatinib mesylate in chronic myeloid leukemia patients. Biomed Res
Int. 2013:1297152013. View Article : Google Scholar : PubMed/NCBI
|
|
48
|
Nishioka C, Ikezoe T, Yang J, Udaka K and
Yokoyama A: Imatinib causes epigenetic alterations of PTEN gene via
upregulation of DNA methyltransferases and polycomb group proteins.
Blood Cancer J. 1:e482011. View Article : Google Scholar : PubMed/NCBI
|
|
49
|
Borisov N, Tkachev V, Suntsova M,
Kovalchuk O, Zhavoronkov A, Muchnik I and Buzdin A: A method of
gene expression data transfer from cell lines to cancer patients
for machine-learning prediction of drug efficiency. Cell Cycle.
17:486–491. 2018. View Article : Google Scholar : PubMed/NCBI
|
|
50
|
Mirabelli P, Coppola L and Salvatore M:
Cancer cell lines are useful model systems for medical research.
Cancers. 11:10982019. View Article : Google Scholar : PubMed/NCBI
|
|
51
|
Rumjanek VM, Vidal RS and Maia RC:
Multidrug resistance in chronic myeloid leukaemia: How much can we
learn from MDR-CML cell lines? Biosci Rep. 33:e000812013.
View Article : Google Scholar : PubMed/NCBI
|
|
52
|
McDermott M, Eustace AJ, Busschots S,
Breen L, Crown J, Clynes M, O'Donovan N and Stordal B: In vitro
development of chemotherapy and targeted therapy drug-resistant
cancer cell lines: A practical guide with case studies. Front
Oncol. 4:402014. View Article : Google Scholar : PubMed/NCBI
|
|
53
|
Peng B, Lloyd P and Schran H: Clinical
pharmacokinetics of imatinib. Clin Pharmacokinet. 44:879–894. 2005.
View Article : Google Scholar : PubMed/NCBI
|
|
54
|
de Kogel CE and Schellens JH: Imatinib.
Oncologist. 12:1390–1394. 2007. View Article : Google Scholar : PubMed/NCBI
|
|
55
|
Picard S, Titier K, Etienne G, Teilhet E,
Ducint D, Bernard MA, Lassalle R, Marit G, Reiffers J, Begaud B, et
al: Trough imatinib plasma levels are associated with both
cytogenetic and molecular responses to standard-dose imatinib in
chronic myeloid leukemia. Blood. 109:3496–3499. 2007. View Article : Google Scholar : PubMed/NCBI
|
|
56
|
Gromicho M, Dinis J, Magalhães M,
Fernandes AR, Tavares P, Laires A, Rueff J and Rodrigues AS:
Development of imatinib and dasatinib resistance: dynamics of
expression of drug transporters ABCB1, ABCC1, ABCG2, MVP, and
SLC22A1. Leuk Lymphoma. 52:1980–1990. 2011. View Article : Google Scholar : PubMed/NCBI
|
|
57
|
Eadie LN, Hughes TP and White DL: ABCB1
overexpression is a key initiator of resistance to tyrosine kinase
inhibitors in CML cell lines. PLoS One. 11:e01614702016. View Article : Google Scholar : PubMed/NCBI
|
|
58
|
de Lima LT, Vivona D, Bueno CT, Hirata
RDC, Hirata MH, Luchessi AD, de Castro FA, de Lourdes F,
Chauffaille M, Zanichelli MA, Chiattone CS, et al: Reduced ABCG2
and increased SLC22A1 mRNA expression are associated with imatinib
response in chronic myeloid leukemia. Med Oncol. 31:8512014.
View Article : Google Scholar : PubMed/NCBI
|
|
59
|
Nies AT, Schaeffeler E, van der Kuip H,
Cascorbi I, Bruhn O, Kneba M, Pott C, Hofmann U, Volk C, Hu S, et
al: Cellular uptake of imatinib into leukemic cells is independent
of human organic cation transporter 1 (OCT1). Clin Cancer Res.
20:985–994. 2014. View Article : Google Scholar : PubMed/NCBI
|