Introduction
Psoralea coryfolia is a traditional tonifying
drug, which can tonify renal function and is antidiarrheal. A
previous study illustrated that Psoralea coryfolia has
estrogen-like effects (1). For adult
ovariectomized female-mice, Psoralea coryfolia could not
only increase keratinization of vaginal epithelial cells and
enhance the weight of the uterus, but it also has an influence on
their estrous cycles, which demonstrate the estrogen effects of
Psoralea coryfolia (2).
Bavachin is one of the classic flavonoid phytoestrogens extracted
from Psoralea coryfolia (3–5).
Phytoestrogens are one of the selective estrogen receptor (ER)
modulators extracted from plants with a structure similar to
estrogen, which may have an important role in the treatment of skin
disease as a substitute of estrogen, due to its estrogen-like
effects but mild estrogen-like side effects (6). Previously, certain studies have shown
that Psoralea coryfolia and certain phytoestrogens extracted
from Psoralea coryfolia that exhibit estrogen-like effects
were closely connected with melanin synthesis. Psoralea
coryfolia combined with psoralen combined with ultraviolet A
(UVA) treatment could increase the activity of melanocytes, and
reduce the degeneration of melanocytes and keratinocytes (7). Bakuchiol, bavachin and isobavachalcone
can inhibit melanin synthesis in B16 mouse melanoma cells (8). Phytoestrogen can regulate melanin
synthesis of melanocytes through the mitogen-activated protein
kinase (MAPK) signaling pathway initiated by binding of
phytoestrogen to the ER. Thus, bavachin may regulate melanin
synthesis of A375 cells through the ER-MAPK signaling pathway.
Materials and methods
Cells and reagents
Human A375 cells (Cell Center of Chinese Academy of
Sciences, Beijing, China), MTT (Sigma-Aldrich, St. Louis, MO, USA),
Dulbecco's modified Eagle's medium (DMEM; Hyclone, Thermo Fisher
Scientific, Inc., Waltham, MA, USA), cell lysis buffer for Western
blotting and immunoprecipitation (Beyotime Institute of
Biotechnology, Shanghai, China), goat anti-mouse immunoglobulin G
conjugated with horseradish peroxidase (cat. no. BA1050; Wuhan
Boster Golden Bridge Biological Technology Co., Ltd., Wuhai,
China), mouse anti-β-actin monoclonal antibody (cat. no. TA-09;
Beijing Zhongshan Jinqiao Biotechnology Co., Ltd., Beijing, China),
mouse anti-tyrosinase (TYR) monoclonal antibody (cat. no. sc-20035;
Santa Cruz Biotechnology, Inc., Santa Cruz, CA, USA), mouse
anti-JNK monoclonal antibody (Santa Cruz Biotechnology, Inc.),
primer (Sangon Biotech Co., Ltd., Shanghai, China) and TRIzol
reagent (Gibco, Thermo Fisher Scientific, Inc.) were purchased.
Instruments
A TCL6G-C table-top high-speed refrigerated
centrifuge (Anting, Shanghai, China), MK3 Enzyme microplate reader
(Redian, Shanghai, China), DYCZ-40B transfer electrophoresis cell
(Liuyi, Beijing, China), Professional polymerase chain reaction
(PCR) Amplification Instrument (Biometra, Gottingen, Germany),
SmartChemi™ Image Analysis system (Beijing Sage Creation Science
Co., Ltd., Beijing, China) and Nano-100 Spectrophotometry (Aosheng,
Hangzhou, China) were the instruments used.
Drugs
Bavachin with a purity >98% (20130829; Baoji
Herbest Bio-Tech Co., Ltd., Baoji, China), estradiol with a purity
>98% (L750N46; Bailingwei, Beijing, China), ICI182780
(20A/129473; Tocris Bioscience, Bristol, UK) and U0126 (S110202;
Selleck, Houston, TX, USA) were used for the treatments of the
cells.
Drug solution preparation
Estradiol was precisely weighed (5.5 mg), dissolved
with 4 ml anhydrous alcohol, and DMEM complete medium was added to
a total volume of 1 liter. A stock solution with a concentration of
20 µmol/l was prepared and diluted to 10−3 µmol/l when
used. Bavachin was weighed precisely (6.49 mg) and dissolved with
DMEM complete medium to a total volume of 100 ml. The solution was
prepared with an initial concentration of 200 µmol/l, and diluted
to 10 µmol/l when used. ICI182780 was weighed precisely (5 mg),
dissolved with 1% dimethyl sulphoxide (DMSO) and DMEM complete
medium was added to prepare the solution with an initial
concentration of 200 µmol/l. This solution was diluted to 1 µmol/l
when used. U0126 was weighed precisely (8.53 mg), dissolved with 1%
DMSO and DMEM complete medium was added to prepare the solution
with an initial concentration of 400 µmol/l. The solution was
diluted to 10 µmol/l when used. All the solutions were filtered and
sterilized by 0.22-µm filter membrane, and stored at −20°C.
Cell grouping and culture
A375 cells in the logarithmic growth phase were
prepared and subsequently digested, centrifuged and resuspended.
The cells were transferred to 96-well plates (200 µl medium with
4,500 cells per well) or 6-well plates (2 ml medium with
24×104 cells per well), cultured in 5% CO2 at
37°C for 24 h, the medium was discarded and the cells were divided
into different groups according to the drug treatments. For the
control group, medium without drugs was added; for the estradiol
group, estradiol solution with a concentration of 10−3
µmol/l was added; for the bavachin group, 10 µmol/l bavachin
solution was added; for the bavachin + ICI182780 group, 1 µmol/l
ICI182780 solution was added, and bavachin stock solution was added
1 h later, with a bavachin concentration that was identical to the
bavachin group. For the bavachin + U0126 group, 10 µmol/l U0126
solution was added, and 20 min later the bavachin stock solution
was added to make a concentration of bavachin that was identical to
the bavachin group. All the cell groups were cultured for a further
48 h. There were 6 wells for duplicate treatments in the 96-well
plates, and 4 wells for duplicate treatments in 6-well plates.
Detection index
Cell activity
MTT solution (20 µl) was added to each well of the
96-well plates, the cells were cultured for 4 h, the solution was
discarded, and the purple crystal was dissolved in the wells with
150 µl DMSO solution, agitated in a 37°C incubator shaker for 10
min, and the optical density (OD) was measured at 490 nm by the
microplate reader.
Melanin content
The cultured solution in the 6-well plates was
discarded, the cells were washed with phosphate-buffered saline
(PBS) twice and were digested with 1 ml 0.25% pancreatin for 1 min.
DMEM total medium was added (1 ml) to stop the digestion, the cell
suspension was collected in a 15-ml centrifuge tube, the sample
underwent centrifugation at a speed of 2,000 × g for 5 min and the
supernatant was discarded. Following this, 100 µl of 1 mol/l NaOH
solution was added, mixed and placed in a centrifuge tube in water
at 37°C for 1 h. Subsequently, 400 µl double-distilled water was
added, the sample was mixed, and a 100 µl solution was removed from
each centrifuge tube to 96-well plates, and the OD was measured at
490 nm by the microplate reader.
TYR activity
The culture solution in the 96-well plates was
discarded, the cells were washed with PBS twice, 100 µl 1%
Triton-X-100 was added in each well, and the cell samples were
rapidly frozen at −80°C for 30 min. Following this, 50 µl PBS [with
0.2% L-dopa (pH 6.8)] was added to each well, the cells were
cultured at 37°C for 3 h, and the OD at a wavelength of 490 nm was
detected by the microplate reader.
Western blot analysis of TYR and c-Jun N-terminal
kinases (JNK) protein expression levels
The total protein of each group in the 6-well plates
was collected and detected. Polyacrylamide gel electrophoresis was
used to separate the protein, which was transferred to a
polyvinylidene difluoride membrane, blocked with non-specific
binding using 5% non-fat milk for 2 h, following which the samples
were incubated with primary antibodies (1:300) overnight at 4°C.
Following this, the samples were incubated with secondary
antibodies in a separate process, and colored with
electrochemiluminescence. Images of each sample were captured and
the gray value of each band was analyzed. The amount of target
protein is shown by the ratio of its gray value to the internal
reference.
Analysis of TYR, tyrosinase-related protein-1
(TRP-1), TRP-2, extracellular signal-regulated kinase 1 (ERK1),
ERK2 and JNK2 mRNA expression levels by reverse transcription
(RT)-PCR
The total cells in the 6-well plates of each group
were collected. The total RNA was extracted according to the
manufacturer's protocol for TRIzol. For RT, 3 µg RNA was collected
from each group. The reaction conditions were as follows: Sample
was incubated at 25°C for 10 min, at 42°C for 60 min and at 70°C
for 10 min, before terminating the reaction and obtaining the cDNA.
Primer sequences were designed and composed by Sangon Biotech Co.,
Ltd. The primer sequences, with the reference gene β-actin, are
shown in Table I. Amplification
conditions were as follows: Initial denaturation at 94°C for 2 min,
denaturation for 30 sec at 94°C, annealing for 40 sec (TYR
at 60°C, TRP-1 at 58°C, TYP-2 at 58°C, ERK1 at
58°C, ERK2 at 55°C, JNK2 at 55°C and β-actin at 55°C,
respectively), and the extension was for 40 sec at 70°C. A total of
35 PCR cycles were used for amplification of the samples. The PCR
amplification products (5 µl) were mixed with 1 µl of 6X DNA
loading buffer. The PCR products were fractionated by 1.5% agarose
gel electrophoresis at a constant voltage of 120 V for 30 min. The
results were detected using a gel imaging system, and were analyzed
with gel-pro analysis software (Media Cybernetics, Inc., Rockville,
MD, USA). The mRNA levels of each group were calculated as the
relative expression ratio to that of β-actin (TYR/β-actin,
TRP-1/β-actin, TRP-2/β-actin, ERK1/β-actin,
ERK2/β-actin and JNK2/β-actin).
 | Table I.Polymerase chain reaction primer
sequences. |
Table I.
Polymerase chain reaction primer
sequences.
| Primer name | Upstream primer | Downstream
primer | Amplified fragment,
base pairs |
|---|
| TYR |
5′TCACGGCTCTGTTGAATGTCT3′ |
5′CTGAAGTTGGGCGAGATGAT3′ | 300 |
| TRY |
5′ACATCATTCCCTCACCAAAGAC3′ |
5′AGAAGTCCGAAAGCCAAGTAAA3′ | 303 |
| TRP-2 |
5′GTTCCTTTCTTCCCTCCAGTG3′ |
5′TTCCTTTATTGTCAGCGTCAGA3′ | 300 |
| ERK1 |
5′GGGAGGTGGAGATGGTGAAG3′ |
5′AGCAGGTTGGAGGGCTTTAGAT3′ | 441 |
| ERK2 |
5′ACCCACACAAGAGGATTGAAGT3′ |
5′AAAAGCCACAACTACCAGAAAC3′ | 353 |
| JNK2 |
5′CCTTCTTTACCAGATGCTTTGTG3′ |
5′ATACGGTCAGTGCCTTGGAATA3′ | 303 |
| β-actin |
5′CGTGGACATCCGCAAAGAC3′ |
5′AAGAAAGGGTGTAACGCAACTA3′ | 302 |
Statistical analysis
The obtained data are expressed as mean ± standard
deviation, statistically analyzed by one-way analysis of variance
using the SPSS software (version 18.0; SPSS, Inc., Chicago, IL,
USA). A 2:2 comparison was conducted by least significant
difference. P<0.05 was considered to indicate a statistically
significant difference.
Results
Effect on cell activity
The effects of bavachin on A375 cells activity are
shown in Table II. Treatment with 10
µmol/l bavachin had no significant effect on A375 cells activity
when compared to the control group. Therefore, it could be used in
the follow-up experiments.
| Table II.Effects of bavachin on A375 cells
activity. |
Table II.
Effects of bavachin on A375 cells
activity.
| Group (µmol/l) | OD | Cell proliferation
rate, % |
|---|
| Control (0) | 0.466±0.029 | 100.00 |
| Estradiol
(10−3) |
0.564±0.029a | 121.03a |
| Bavachin (10) | 0.436±0.020 |
93.56 |
Effects of bavachin on melanin
synthesis of the A375 cells
The results for the effect of bavachin treatment on
melanin synthesis in A375 cells are shown in Table III. Bavachin significantly inhibited
melanin synthesis, which was 55.07% of the control group
(P<0.01). ICI182780 and U0126 could reverse the melanin decline
induced by bavachin, and the differences were significant when
compared with the bavachin group (P<0.01).
| Table III.Effects of bavachin on melanin
synthesis in A375 cells. |
Table III.
Effects of bavachin on melanin
synthesis in A375 cells.
| Group (µmol/l) | OD |
ODtreatment
group/ODcontrol group, % |
|---|
| Control (0) | 0.138±0.014 | 100.00 |
| Estradiol
(10−3) |
0.168±0.009a | 121.74a |
| Bavachin (10) |
0.076±0.016a | 55.07a |
| Bavachin (10)
+ |
0.114±0.004a,b | 82.61a,b |
| ICI182780 (1) |
|
|
| Bavachin (10)
+ |
0.109±0.010a,b | 78.99a,b |
| U0126 (10) |
|
|
Effects of bavachin on TYR activity of
A375 cells
The results for the effects of bavachin on TYR
activity are shown in Table IV.
Bavachin significantly inhibited TYR activity, which was 72.41% of
the control group (P<0.01). ICI182780 and U0126 reversed the
decline of TYR activity induced by bavachin, and the differences
were significant compared with the bavachin group (P<0.01).
| Table IV.Effects of bavachin on TYR activity
of A375 cells. |
Table IV.
Effects of bavachin on TYR activity
of A375 cells.
| Group (µmol/l) | OD |
ODtreatment
group/ODcontrol group, % |
|---|
| Control (0) | 0.087±0.006 | 100.00 |
| Estradiol
(10−3) |
0.107±0.004a | 122.99a |
| Bavachin (10) |
0.063±0.004a | 72.41a |
| Bavachin (10)
+ |
0.080±0.004b,c | 91.95b,c |
| ICI182780 (1) |
|
|
| Bavachin (10)
+ |
0.077±0.009a,c | 88.51a,c |
| U0126 (10) |
|
|
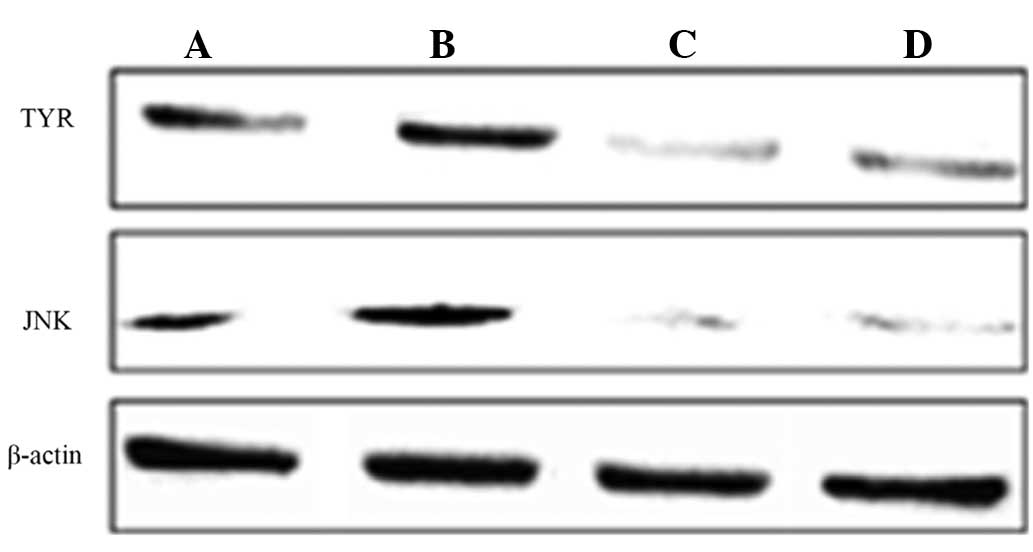
Effects of bavachin on the expression
levels of the TYR and JNK proteins
The effects of bavachin treatment on TYR and JNK
proteins are shown in Table V and
Fig. 1. Bavachin significantly
inhibited the expression levels of the TYR and JNK proteins when
compared with the control group (P<0.01). ICI182780 reversed the
decline of the TYR protein and the JNK protein as induced by
bavachin, and the differences were significant compared to the
bavachin group (P<0.01).
| Table V.Expression levels of TYR and JNK
proteins in the different groups. |
Table V.
Expression levels of TYR and JNK
proteins in the different groups.
| Group (µmol/l) | TYR/β-actin | JNK/β-actin |
|---|
| Control (0) | 0.558±0.018 | 0.477±0.018 |
| Estradiol
(10−3) |
0.693±0.030a |
0.583±0.011a |
| Bavachin (10) |
0.358±0.032a |
0.221±0.003a |
| Bavachin (10)
+ |
0.477±0.005a,b |
0.332±0.029a,b |
| ICI182780 (1) |
|
|
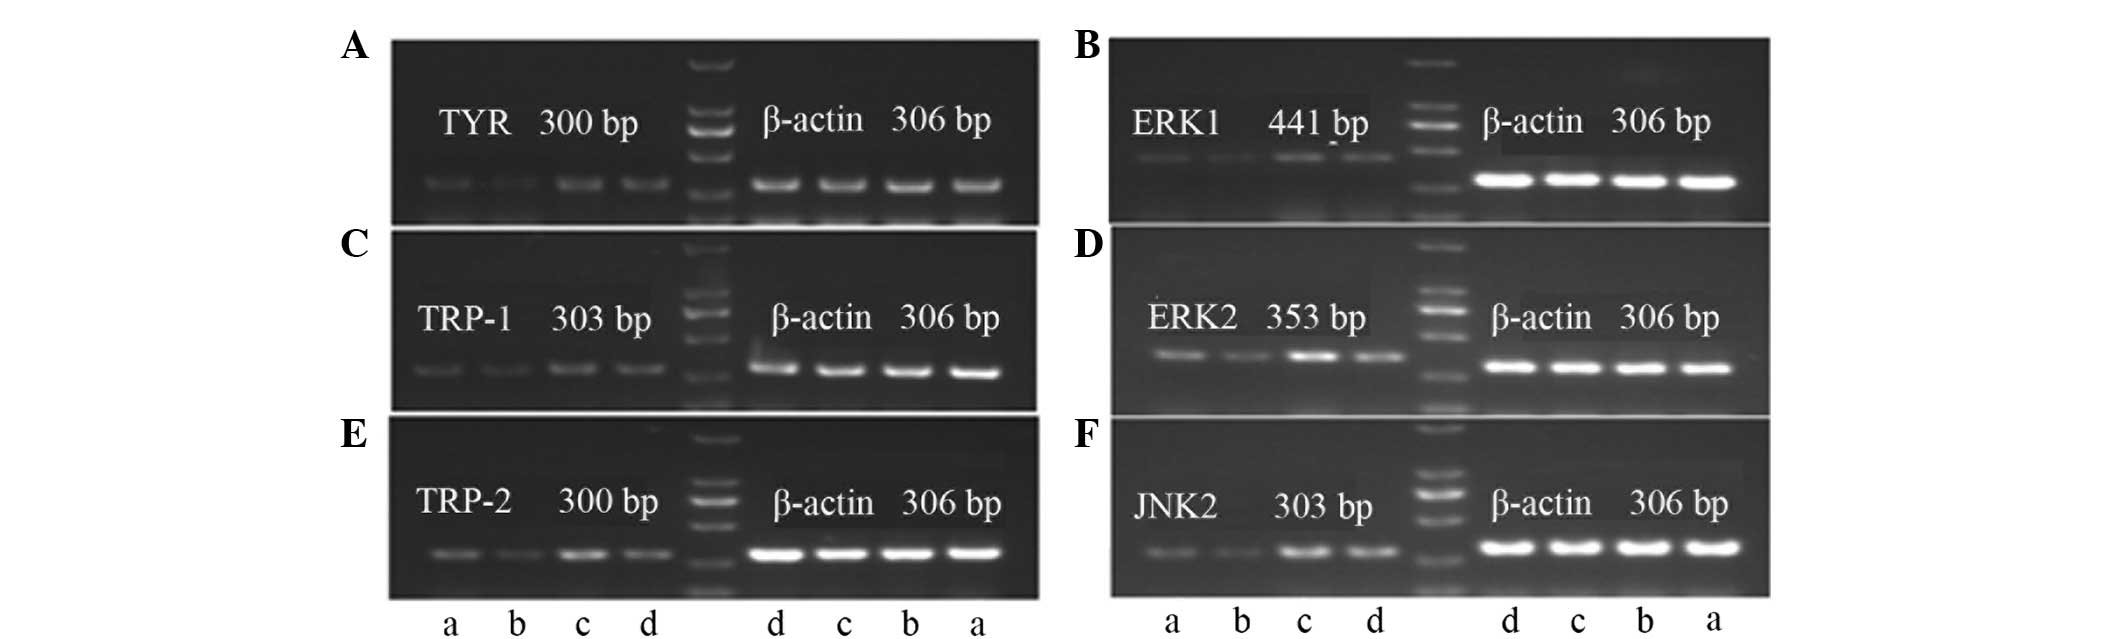
RT-PCR results
Effects of bavachin and ICI182780 on the
expression levels of the TYR, TRP-1, TRP-2, ERK1, ERK2 and JNK2
mRNA in the A375 cells
The effects of bavachin and ICI182780 are shown in
Table VI and Fig. 2. Bavachin significantly inhibited the
expression levels of TYR, TRP-1, TRP-2,
ERK1, ERK2 and JNK2 mRNA when compared with
the control group (P<0.01). ICI182780 reversed the decline of
the TYR, TRP-1, TRP-2, ERK1,
ERK2 and JNK2 mRNA as induced by bavachin, and the
differences were significant when comparing with the bavachin group
(P<0.05 or P<0.01).
| Table VI.Polymerase chain reaction analysis of
the TYR, TRP-1, TRP-2, ERK1,
ERK2 and JNK2 mRNA expression levels in the different
groups. |
Table VI.
Polymerase chain reaction analysis of
the TYR, TRP-1, TRP-2, ERK1,
ERK2 and JNK2 mRNA expression levels in the different
groups.
| mRNA | Control group (0
µmol/l) | Estradiol group
(10−3 µmol/l) | Bavachin group (10
µmol/l) | Bavachin (10
µmol/l) + ICI182780 (1 µmol/l) |
|---|
|
TYR/β-actin | 0.583±0.006 |
0.691±0.017a |
0.332±0.038a |
0.470±0.047a,b |
|
TRP-1/β-actin | 0.424±0.022 |
0.561±0.012a |
0.251±0.029a |
0.357±0.013a,b |
|
TRP-2/β-actin | 0.427±0.010 |
0.532±0.014a |
0.289±0.022a |
0.346±0.036a,c |
|
ERK1/β-actin | 0.461±0.038 |
0.561±0.021a |
0.299±0.009a |
0.357±0.047a,b |
|
ERK2/β-actin | 0.507±0.019 |
0.620±0.031a |
0.320±0.020a |
0.417±0.027a,c |
|
JNK2/β-actin | 0.491±0.013 |
0.591±0.012a |
0.276±0.040a |
0.357±0.033a,c |
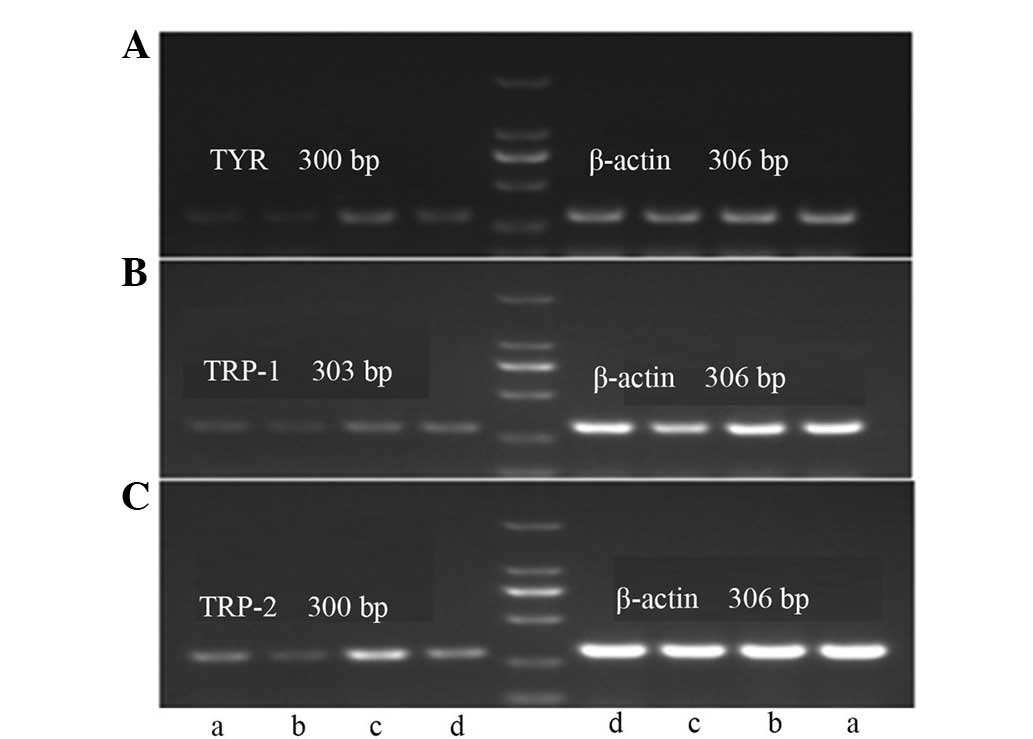
Effects of bavachin and U0126 on expression of
TYR, TRP-1 and TRP-2 mRNA in A375 cells
The results of the effects of bavachin and U0126 are
shown in Table VII and Fig. 3. Bavachin significantly inhibited the
expression of TYR, TRP-1 and TRP-2 mRNA, as
compared with the control group (P<0.01). U0126 reversed the
decline of the TYR, TRP-1 and TRP-2 mRNA
induced by bavachin, and the differences were significant when
compared with the bavachin group (P<0.01 or P<0.05).
| Table VII.Polymerase chain reaction analysis of
TYR, TRP-1 and TRP-2 mRNA expression levels in
the different groups. |
Table VII.
Polymerase chain reaction analysis of
TYR, TRP-1 and TRP-2 mRNA expression levels in
the different groups.
| mRNA | Control group (0
µmol/l) | Estradiol group
(10−3 µmol/l) | Bavachin group (10
µmol/l) | Bavachin (10
µmol/l) + U0126 (1 µmol/l) |
|---|
|
TYR/β-actin | 0.564±0.016 |
0.676±0.011a |
0.368±0.034a |
0.413±0.037a,b |
|
TRP-1/β-actin | 0.458±0.010 |
0.547±0.022a |
0.291±0.009a |
0.392±0.015a,c |
|
TRP-2/β-actin | 0.411±0.007 |
0.549±0.016a |
0.265±0.033a |
0.348±0.008a,c |
Discussion
Melanin is produced in the melanosome of melanocytes
regulated by TYR, which is the main rate-limiting enzyme of this
process. The TYR genes mainly includes TYR,
TRP-1 and TRP-2 (9–11). Estrogen,
as an extracellular stimuli, can bind to ER, which also exists in
melanocytes, and subsequently activate the extracellular signal
transduction pathway directly or indirectly, which can induce a
nongenomic effect. The ER-related regulation is well-connected with
the MAPK signaling pathway, which is a common pathway of
physiological reactions responding to extracellular stimuli. MAPK
belongs to the serine-threonine kinases. A previous study also
demonstrated that the MAPK pathway is involved in the regulation of
melanin synthesis (12). The MAPK
family mainly consists of ERK1/2, JNK1/2 and p38 MAPK (13). The studies have shown that activation
of MAPK signaling may be an important pathway involved in melanoma
transformation. Inhibition of MAPK signaling may be useful in the
prevention and treatment of melanoma (14). The study by Yanase et al
(15) demonstrated that the expression
of TYR mRNA and protein increase phosphorylation, and activity of
ERK1/2 elevated following UVA irradiation. However, treatment with
a tyrosine kinase receptor inhibitor reduced ERK1/2 activation
following UVA-irradiation, which suggested that UVA
irradiation-induced melanogenesis is associated with the activation
of ERK1/2 by upstream signals that originate from reactive oxygen
species or from activated tyrosine kinase receptors (15). Hata et al (16) reported that activation of the p38 MAPK
signaling pathway induced differentiation of B16 melanoma cells. In
a previous study, Ali et al (17) indicated that phytoestrogen extracted
from Psoralea coryfolia is connected with melanin synthesis,
the lyophilized extracts of Psoralea corylifolia seeds and
pure psoralen induced melanin dispersal effects; however, the
underlying regulation mechanism remains to be elucidated.
In the present study, the safe dose of bavachin
could significantly inhibit melanin synthesis and TYR activity in
A375 cells, which could be reversed by ICI182780 and U0126. This
suggested that bavachin inhibits melanin synthesis by decreasing
TYR activity, which was achieved by the ER-ERK pathway. Western
blot analysis shows that bavachin could significantly inhibit the
expression of TYR and JNK protein in the A375 cells, which could be
reversed by ICI182780. This indicates that lessening the expression
of TYR and JNK protein is connected with regulation of melanin
synthesis. RT-PCR showed that bavachin could significantly inhibit
the expression of TYR, TRP-1, TRP-2,
ERK1, ERK2 and JNK2 mRNA, which may be
involved in the regulation of melanin synthesis. Notably, bavachin
inhibited the synthesis of melanin on A375 cells by inhibiting
expression of TYR, TRP-1, TRP-2, ERK1, ERK2 and JNK2 protein and
mRNA.
Acknowledgements
The study was sponsorted by grants from the National
Natural Science Foundation of China (General Program; no.
81274035); Postdoctoral Research Starting Capital of Heilongjiang
Province (no. LBH-Q13162); and the Excellent Innovation Talents of
Heilongjiang University of Chinese Medicine.
References
|
1
|
Xu Y, Zhang ZJ, Geng F, Su SB, White KN,
Bligh SW, Branford-White CJ and Wang ZT: Treatment with Qing'E, a
kidney-invigorating Chinese herbal formula, antagonizes the
estrogen decline in ovariectomized mice. Rejuvenation Res.
13:479–488. 2010. View Article : Google Scholar : PubMed/NCBI
|
|
2
|
Research Office of family planning,
stitute of Chinese Traditional Medicine: Academy of Traditional
Chinese Medicine. Research Data Traditional Chinese Medicine of
Meijing. 1:16–18. 1979.
|
|
3
|
Lim SH, Ha TY, Ahn J and Kim S: Estrogenic
activities of Psoralea corylifolia L. seed extracts and main
constituents. Phytomedicine. 18:425–430. 2011. View Article : Google Scholar : PubMed/NCBI
|
|
4
|
Lim SH, Ha TY, Kim SR, Ahn J, Park HJ and
Kim S: Ethanol extract of Psoralea corylifolia L. and its
main constituent, bakuchiol, reduce bone loss in ovariectomised
Sprague-Dawley rats. Br J Nutr. 101:1031–1039. 2009. View Article : Google Scholar : PubMed/NCBI
|
|
5
|
Xin D, Wang H, Yang J, Su YF, Fan GW, Wang
YF, Zhu Y and Gao XM: Phytoestrogens from Psoralea
corylifolia reveal estrogen receptor-subtype selectivity.
Phytomedicine. 17:126–131. 2010. View Article : Google Scholar : PubMed/NCBI
|
|
6
|
Shelly W, Draper MW, Krishnan V, Wong M
and Jaffe RB: Selective estrogen receptor modulators: An update on
recent clinical findings. Obstet Gynecol Surv. 63:163–181.
2008.PubMed/NCBI
|
|
7
|
Anbar TS, El-Sawy AE, Attia SK, Barakat
MT, Moftah NH, El-Ammawy TS, Abdel-Rahman AT and El-Tonsy MH:
Effect of PUVA therapy on melanocytes and keratinocytes in
non-segmental vitiligo: Histopathological, immuno-histochemical and
ultrastructural study. Photodermatol Photoimmunol Photomed.
28:17–25. 2012. View Article : Google Scholar : PubMed/NCBI
|
|
8
|
Ohno O, Watabe T, Nakamura K, Kawagoshi M,
Uotsu N, Chiba T, Yamada M, Yamaguchi K, Yamada K, Miyamoto K and
Uemura D: Inhibitory effects of bakuchiol, bavachin, and
isobavachalcone isolated from Piper longum on melanin
production in B16 mouse melanoma cells. Biosci Biotechnol Biochem.
74:1504–1506. 2010. View Article : Google Scholar : PubMed/NCBI
|
|
9
|
Hashimoto Y, Ito Y, Kato T, Motokawa T,
Katagiri T and Itoh M: Expression profiles of melanogenesis-related
genes and proteins in acquired melanocytic nevus. J Cutan Pathol.
33:207–215. 2006. View Article : Google Scholar : PubMed/NCBI
|
|
10
|
Lu F, Yan D, Zhou X, Hu DN and Qu J:
Expression of melanin-related genes in cultured adult human retinal
pigment epithelium and uveal melanoma cells. Mol Vis. 13:2066–2072.
2007.PubMed/NCBI
|
|
11
|
Fang D, Kute T and Setaluri V: Regulation
of tyrosinase-related protein-2 (TYRP2) in human melanocytes:
Relationship to growth and morphology. Pigment Cell Res.
14:132–139. 2001. View Article : Google Scholar : PubMed/NCBI
|
|
12
|
Jiang ZQ: The Mechanism of Active
Componets of Two Chinese Traditional Medicines on Melanogenesis
(unpublished PhD thesis). Huazhong University of Science and
Technology. 11143603029711602009.
|
|
13
|
Cohen P: The search for physiological
substrates of MAP and SAP kinases in mammalian cells. Trends Cell
Biol. 7:353–361. 1997. View Article : Google Scholar : PubMed/NCBI
|
|
14
|
Govindarajan B, Bai X, Cohen C, Zhong H,
Kilroy S, Louis G, Moses M and Arbiser JL: Malignant transformation
of melanocytes to melanoma by constitutive activation of
mitogen-activated protein kinase kinase (MAPKK) signaling. J Biol
Chem. 278:9790–9795. 2003. View Article : Google Scholar : PubMed/NCBI
|
|
15
|
Yanase H, Ando H, Horikawa M, Watanabe M,
Mori T and Matsuda N: Possible involvement of ERK 1/2 in
UVA-induced melanogenesis in cultured normal human epidermal
melanocytes. Pigment Cell Res. 14:103–109. 2001. View Article : Google Scholar : PubMed/NCBI
|
|
16
|
Hata K, Hori K and Takahashi S: Role of
p38 MAPK in lupeol-induced B16 2F2 mouse melanoma cell
differentiation. J Biochem. 134:441–445. 2003. View Article : Google Scholar : PubMed/NCBI
|
|
17
|
Ali SA, Sultan T, Galgut JM, Sharma R,
Meitei KV and Ali AS: In vitro responses of fish melanophores to
lyophilized extracts of Psoralea corylifolia seeds and pure
psoralen. Pharm Biol. 49:422–427. 2011. View Article : Google Scholar : PubMed/NCBI
|