Introduction
The incidence of diabetes is increasing worldwide,
and its prevalence reached 415 million people in 2015 (1). Up to 91% of adults with diabetes mellitus
are diagnosed with type 2 diabetes in high-income countries. There
is a long asymptomatic phase (the prediabetic phase) during the
progression of type 2 diabetes. Significant proportions of patients
may develop retinopathy, cardiovascular disease, neuropathy, and
nephropathy in the prediabetic phase (2,3). Lifestyle
modification or pharmacotherapy is beneficial for diabetes
prevention in prediabetic individuals (2,4–7). Impaired fasting glucose (where the
fasting plasma glucose level does not meet the criteria for
diabetes, but is above the normal level) is an intermediate state
of hyperglycemia (8) and adopted as a
measure for identifying high-risk populations for type 2 diabetes
(4). In addition, accumulating
evidence suggests that postprandial hyperglycemia participates in
the development of impaired fasting glucose (9) and is an independent risk factor for
atherosclerosis, with a greater effect than fasting hyperglycemia
(10).
Recent investigations have suggested that vegetarian
diets are effective for glycemic control in diabetes (11–13).
Regarding the suppression of postprandial hyperglycemia, the
efficacy of indigestible dextrin or wheat albumin has been reported
(14,15). Our previous study suggested that intake
of kale (Brassica oleracea var. acephala) is
effective in reducing postprandial plasma glucose (16). In the present study, we investigated
the effective dose of kale-containing food in a randomized,
double-blind, placebo-controlled, crossover trial involving
subjects with moderately high postprandial plasma glucose
levels.
Materials and methods
Food samples
The following food samples were produced by Q'sai
Co., Ltd. (Fukuoka, Japan): Placebo; low-dose kale (7 g
kale-containing food; active-L); and high-dose kale (14 g
kale-containing food; active-H). The ingredients of the food
samples are presented in Table I. At
the measurement times (test periods I, II and III, in which each
experimental procedure was performed in one day), the subjects
consumed one of the food samples together with a high-carbohydrate
meal (rice with chicken and eggs; 575 kcal energy, 18.7 g protein,
3.2 g fat, 115.6 g carbohydrate, and 1,243 mg sodium in a total
meal of 510 g). The meal duration time was set at 10 min. The dose
of kale was defined based on our previous clinical trial of its
effect on postprandial plasma glucose levels (16). In that randomized, double-blind,
placebo-controlled, crossover study, intake of kale-containing food
at a dose of 14 g significantly decreased postprandial plasma
glucose levels. To investigate the appropriate effective dose, the
doses were set at 7 and 14 g in the present study.
 | Table I.Compositions of the food samples. |
Table I.
Compositions of the food samples.
| Ingredient (per 100
g) | Placebo | Active-L | Active-H |
|---|
| Energy (kcal) | 377 | 339 | 299 |
| Protein (g) | 0.2 | 8.3 | 16.6 |
| Fat (g) | 0.3 | 2.6 | 4.7 |
| Carbohydrate (g) | 93.4 | 79.7 | 66.0 |
| Sodium (mg) | 43.5 | 164 | 283 |
Study design
A randomized, double-blind, placebo-controlled,
crossover study was conducted with the aid of a fund from Q'sai
Co., Ltd. at two centers (Kenshokai Fukushima Health Care Center,
Osaka, Japan; and Go Clinic, Osaka, Japan) under the supervision of
the principal investigator (Dr Sumio Kondo; Kenshokai Fukushima
Health Care Center). The study was conducted from April to July
2015. The study conformed to the principles of the Declaration of
Helsinki and was approved by the institutional review board of the
incorporated medical institution (Aiseikai Aisei Hospital Ueno
Clinic, Tokyo, Japan) on the basis of ethical issues, the protocol,
and information on the food samples.
The subjects were recruited in April 2015. The
details of the study were disclosed to the subjects before the
start of the study, and informed consent was obtained from all
subjects. The inclusion criteria were as follows: i) Male or female
aged between 20 and 64 years; ii) fasting plasma glucose level of
≤125 mg/dl at the pretrial test; and iii) postprandial plasma
glucose level of 140–199 mg/dl at 30 min after intake of the
high-carbohydrate meal at the pretrial test. The exclusion criteria
were as follows: i) Those habitually taking green vegetable juice
three times or more per week; ii) those taking health foods or
medicines that may affect sugar metabolism; iii) those suffering
from any disease or with a case history of a serious disease that
required medication; iv) those suffering from serious diseases,
such as diabetes mellitus or failure of the liver, kidney, or
heart, or with a case history of such diseases; v) those taking
warfarin, a vitamin K-dependent anticoagulant that inhibits
synthesis of coagulation factors; vi) those who may be liable to
allergy in response to kale or the high-carbohydrate meal
containing rice, chicken, and egg; vii) those participating in any
other clinical trial within 1 month or planning to participate in
such trials after providing informed consent to join the present
study; viii) those planning to get pregnant or nurse a baby during
the study; ix) those judged inappropriate as participants from
answers to the lifestyle questionnaire; and x) those judged
inappropriate as participants from the view of the principal
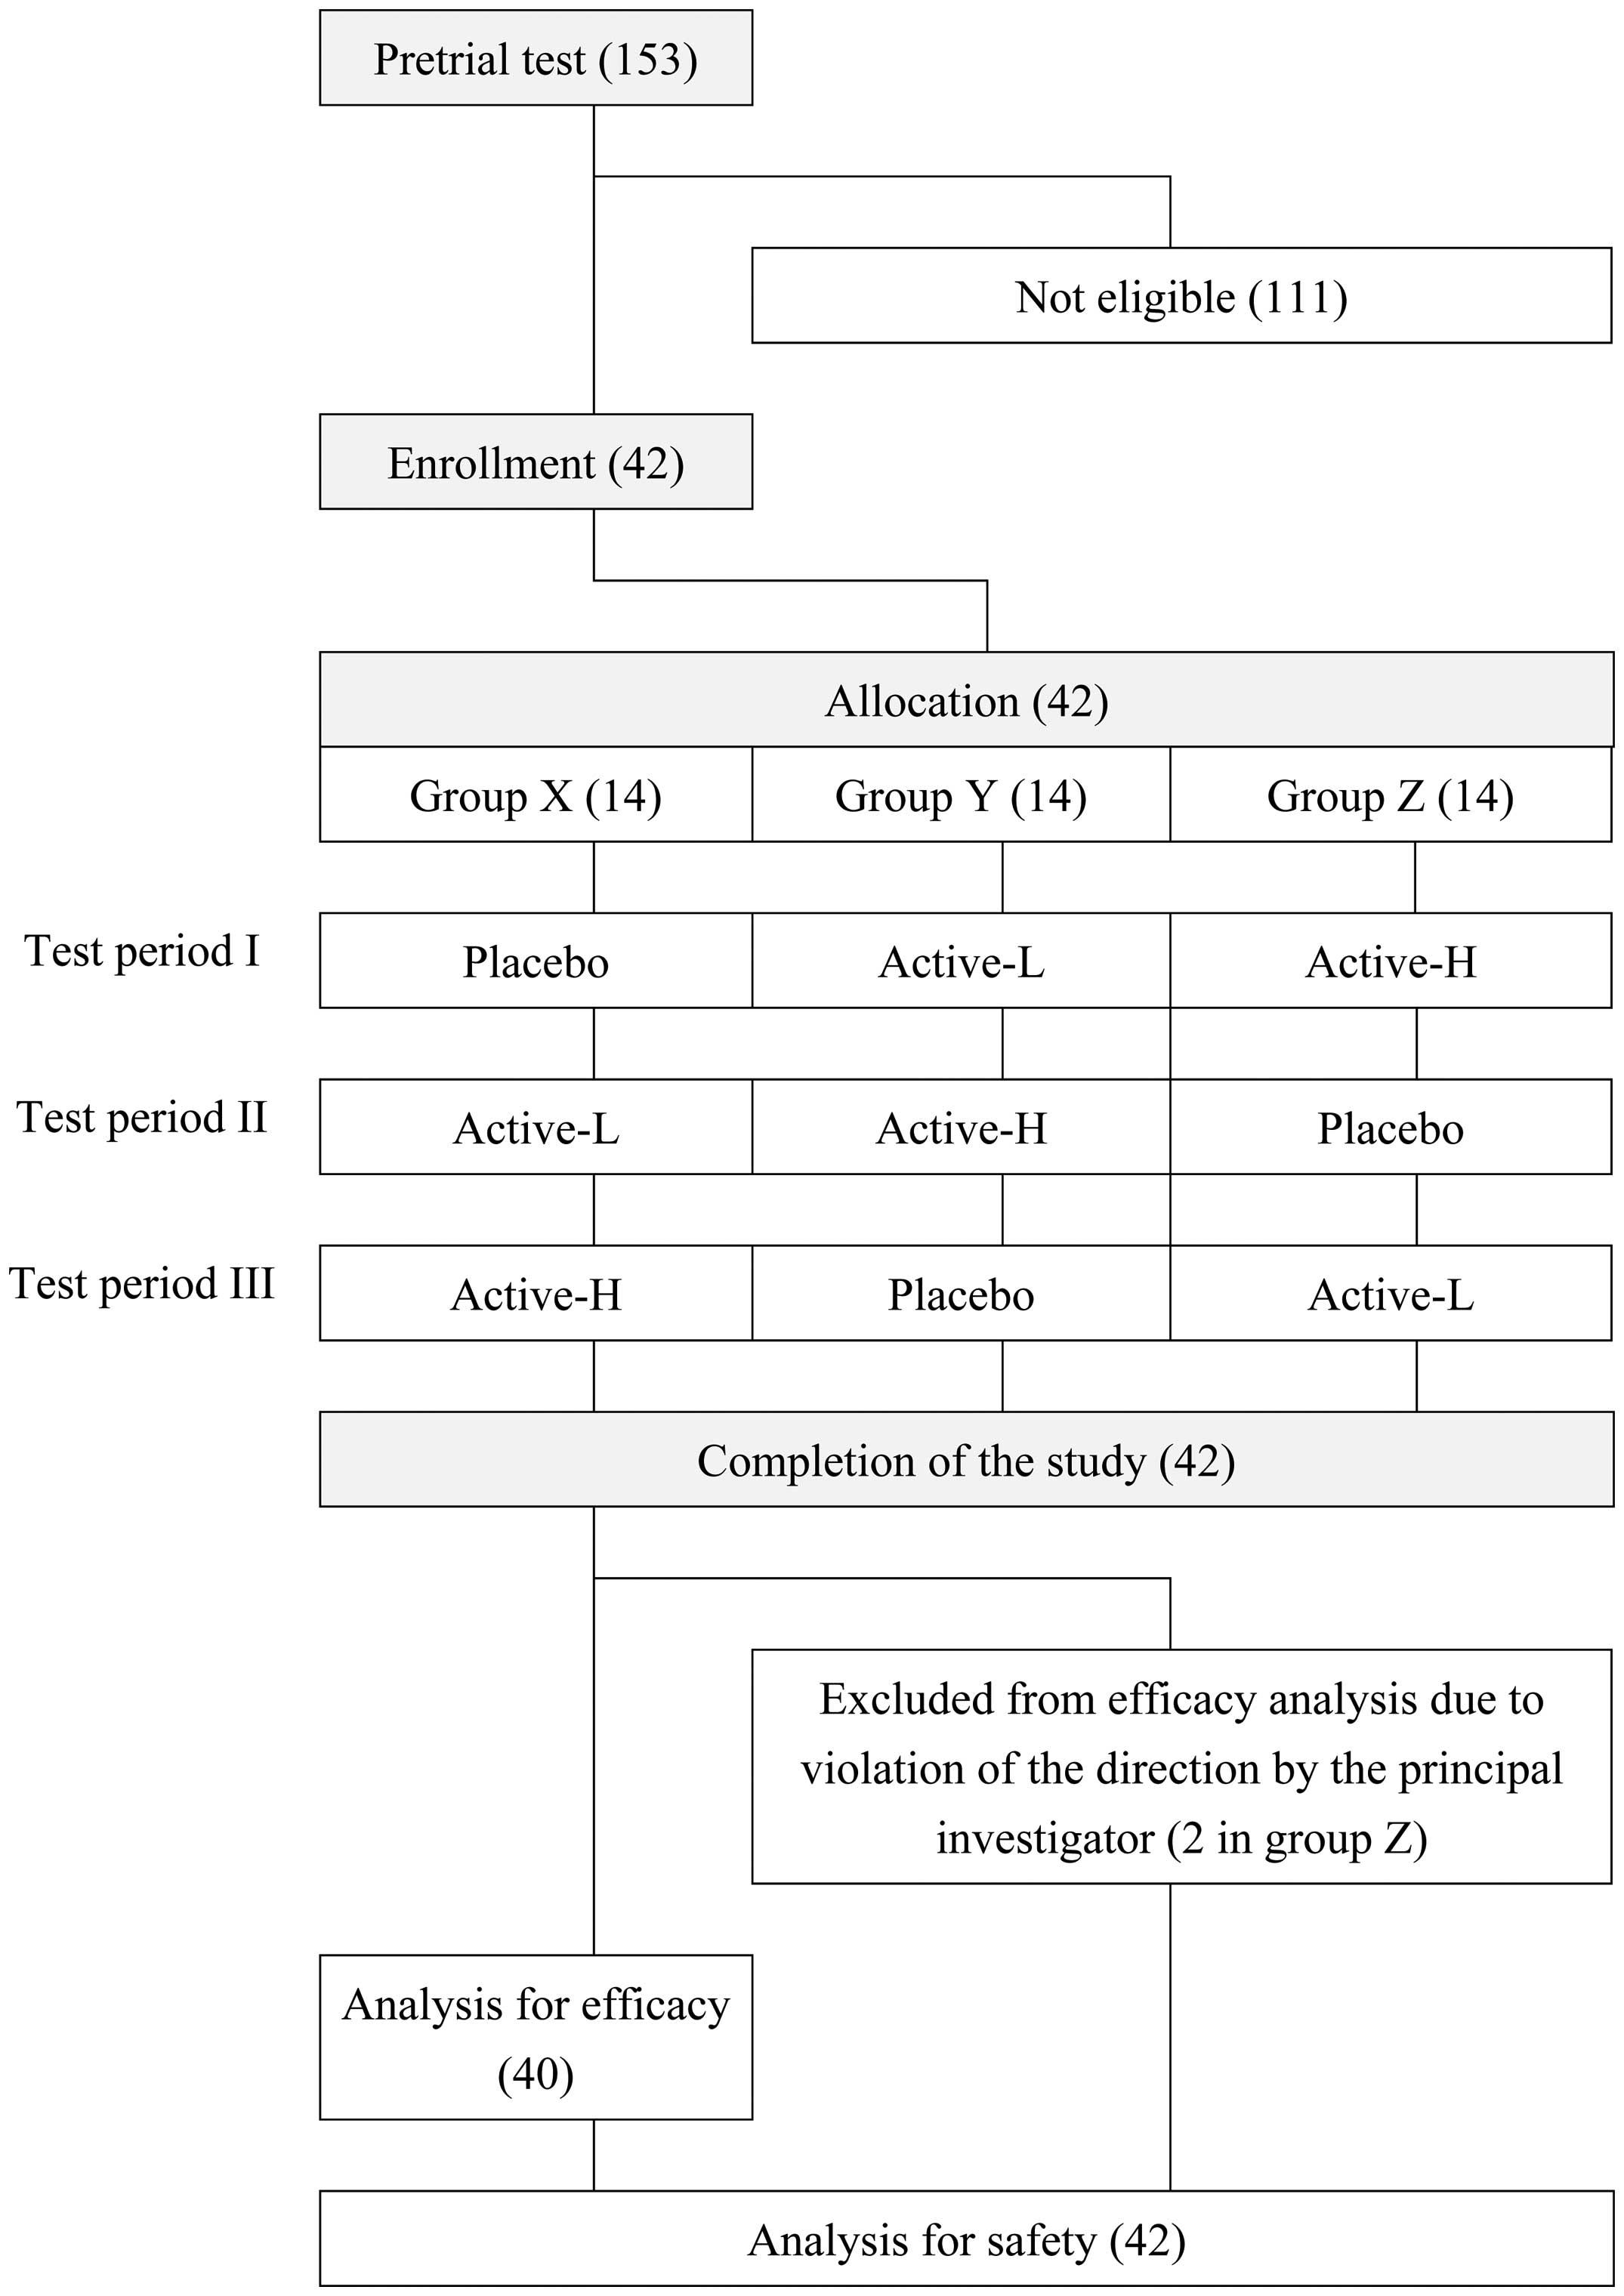
investigator. The 42 included subjects were 23 men and 19 women
aged 44.7±11.1 years. The subjects were assigned to group X (n=14),
group Y (n=14), and group Z (n=14) based on random number tables.
The allocation was conducted by Yoshihisa Kibune (TTC Co., Ltd.,
Tokyo, Japan) and concealed from the subjects, the investigators,
and the researchers who recruited and assessed the subjects. In the
three test periods (periods I, II and III), the subjects in the
three groups were assigned to consume the food samples as shown in
Fig. 1.
During the trial, the following requests were made
to the participants: i) Not to change their lifestyle, including
diet, alcohol drinking, and sleep patterns; ii) to avoid
over-exercising, abstemious eating, or overeating; iii) not to
change their exercise habits; iv) not to take health foods or
supplements; v) to log their lifestyle each day; vi) to go to bed
by 12:00 a.m. on the day before the tests; vii) to avoid drinking
alcohol for 2 days before the test; viii) to avoid consuming any
meals after dinner on the day before the test and to continue
abstaining from food until the test; ix) not to consume a high-fat
meal the day before the test; x) to eat dinner at the usual time;
xi) not to drastically change the dietary composition of their
dinner on the day before the test; xii) to avoid heavy exercise on
the day before the test and the day of the test; and xiii) not to
consume any meal other than that provided for the test on the day
of the test.
In each of the test periods I, II or III, the
participants consumed one of the food samples together with the
high-carbohydrate meal (Fig. 1). The
plasma glucose and insulin levels were measured before
(preprandial) and at 30, 60, 90 and 120 min after the meal. Each
participant logged their lifestyle during the 3 days before the
test. There were 1-week washout periods between test periods I and
II, and between test periods II and III.
The primary outcome measure was plasma glucose level
at 30 min following consumption of the high-carbohydrate meal. The
secondary outcome measures were as follows: Plasma glucose area
under the blood concentration-time curve (AUC) for the plasma
glucose level determined using values obtained for up to 2 h
following the high-carbohydrate meal (AUC0–2 h); plasma
glucose maximum plasma concentration (Cmax); fasting
plasma glucose level; plasma glucose levels at 60, 90 and 120 min
after meal consumption; fasting plasma insulin level; and plasma
insulin levels at 30, 60, 90 and 120 min after meal
consumption.
Measurements of glucose and insulin
plasma levels
The following measurements were performed according
to the standard laboratory protocol of LSI Medience Corporation
(Tokyo, Japan). Plasma glucose was determined by glucose
oxidase-electrochemical assay using a GA08lll automated glucose
analyzer (A&T Corporation, Yokohama, Japan). Plasma insulin was
determined by chemiluminescence immunoassay using an ARCHITECT
i2000 analyzer (Abbott Japan, Tokyo, Japan). The AUC for the
plasma glucose level was determined using values obtained for up to
2 h following the high-carbohydrate meal (AUC0–2 h).
Additional surveys and testing
Further surveys and testing were performed on the
indicated occasions as follows: Lifestyle questionnaire, physical
examination and laboratory examination at pretrial testing; a
medical interview, and somatometry at pretrial testing and test
periods I, II and III.
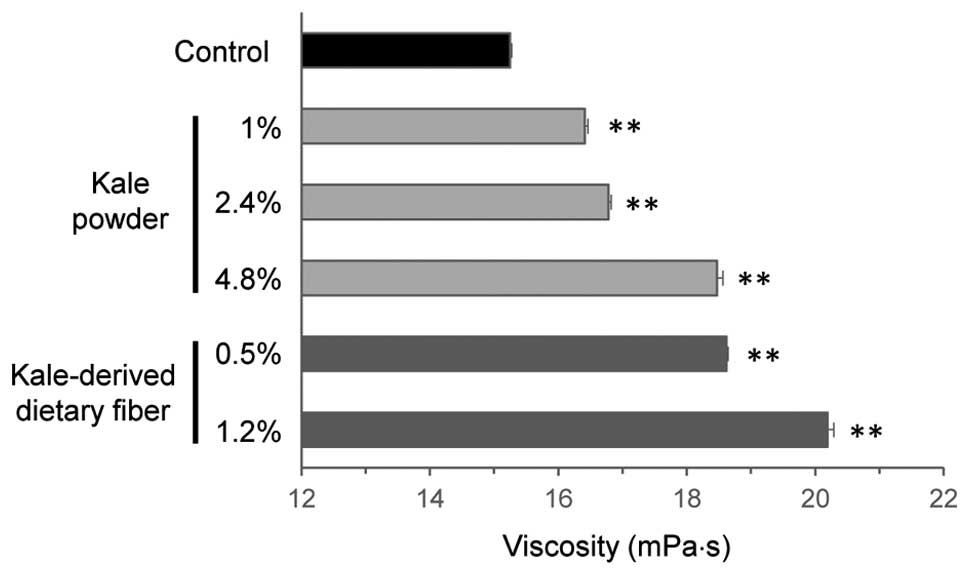
Measurement of viscosity
An artificial digest consisting of 2% (w/v)
methylcellulose and 5% (w/v) glucose was added to the powdered kale
(1–4.8%; w/v) or kale-derived dietary fiber (0.5–1.2%; w/v), and
viscosity of the resulting mixture was measured three times using
an FCV-100 ultrasonic viscosity meter (Fuji Ultrasonic Engineering,
Hamamatsu, Japan). Values are presented as units of mPa·s.
Statistical analysis
All of the measured values are expressed as means ±
standard deviation. The statistical methods used for analysis were
as follows: Analysis of variance (ANOVA) for subject background
data; χ2 test for subject number; ANOVA for comparisons
between groups X, Y and Z and for inter-individual, -period, and
-food sample comparisons; Tukey's test for efficacy of the food
samples and viscosity results. P<0.05 was considered to indicate
a statistically significant difference.
Results
Subjects
Forty-two subjects were enrolled and randomly
allocated to the three groups (groups X, Y and Z). The subjects
consumed one of the food samples, which were comprised of a
placebo, active-L, or active-H, at each of the three test periods,
as depicted in Fig. 1. All of the
participants completed the study, but two subjects in group Z
violated the directions from the principal investigator. These two
subjects were excluded from the analysis of efficacy, but included
in the analysis for safety (Fig. 1).
The background data for the three groups are presented in Table II. ANOVA revealed no significant
inter-group variation in the background data (Table II).
| Table II.Background characteristics of the
subjects in groups X, Y and Z. |
Table II.
Background characteristics of the
subjects in groups X, Y and Z.
| Parameter | Value | P-value |
|---|
| Subjects (m/f) |
| 0.672a |
| X | 7/7 |
|
| Y | 8/6 |
|
| Z | 8/4 |
|
|
Total | 23/17 |
|
| Age (years) |
| 0.345b |
| X | 46.9±9.9 |
|
| Y | 45.0±10.6 |
|
| Z | 40.5±13.0 |
|
|
Total | 44.3±11.2 |
|
| Height (cm) |
| 0.510b |
| X | 167.86±9.45 |
|
| Y | 164.45±10.09 |
|
| Z | 168.14±7.40 |
|
|
Total | 166.75±9.06 |
|
| Body weight (kg) |
| 0.629b |
| X | 64.86±12.98 |
|
| Y | 61.51±11.83 |
|
| Z | 65.85±11.46 |
|
|
Total | 63.99±11.97 |
|
| Body mass index
(kg/m2) |
| 0.908b |
| X | 22.87±3.16 |
|
| Y | 22.69±3.43 |
|
| Z | 23.27±3.70 |
|
|
Total | 22.92±3.34 |
|
| Fasting plasma
glucose level (mg/dl) |
| 0.442b |
| X | 97.3±8.6 |
|
| Y | 94.4±6.5 |
|
| Z | 98.4±9.9 |
|
|
Total | 96.6±8.3 |
|
| Plasma glucose
level 30 min after the meal intake (mg/dl) |
| 0.806b |
| X | 160.8±14.3 |
|
| Y | 159.9±14.7 |
|
| Z | 163.3±10.4 |
|
|
Total | 161.2±13.1 |
|
| Plasma glucose
AUC0–2 h (mg/h/dl) |
| 0.751b |
| X | 284.1±24.4 |
|
| Y | 276.3±37.6 |
|
| Z | 288.0±55.0 |
|
|
Total | 282.5±39.3 |
|
| Plasma glucose
Cmax (mg/dl) |
| 0.483b |
| X | 168.6±15.6 |
|
| Y | 165.6±22.5 |
|
| Z | 176.9±33.0 |
|
|
Total | 170.1±24.1 |
|
Effects on postprandial plasma glucose
levels
As shown in Table
III, no significant inter-period differences in the levels of
fasting plasma glucose, AUC0–2 h, or Cmax
were identified. Furthermore, no significant inter-food sample
differences were observed in the levels of fasting plasma glucose.
Thus, no obvious bias that hampered analyses of AUC0–2 h
or Cmax was noted, therefore usual statistical methods
for the analysis of efficacy were employed. However, there were
significant inter-period differences in the levels of plasma
glucose at 30 and 120 min (Table
III); therefore, these data were excluded from the statistical
analysis of efficacy.
| Table III.Analysis of variance for changes in
plasma glucose levels, as well as AUC0–2 h and
Cmax values following consumption of the
high-carbohydrate meal. |
Table III.
Analysis of variance for changes in
plasma glucose levels, as well as AUC0–2 h and
Cmax values following consumption of the
high-carbohydrate meal.
|
| P-value |
|
|---|
|
|
|
|
|---|
| Item |
Inter-individual | Inter-period | Inter-food
sample |
|---|
| Plasma glucose |
|
|
|
| level |
|
Fasting | <0.001 | 0.962 |
0.472 |
| 30 min
after meal intake | <0.001 | 0.048 | <0.001 |
| 60 min
after test meal intake | <0.001 | 0.287 | <0.001 |
| 90 min
after test meal intake | <0.001 | 0.177 |
0.308 |
| 120 min
after test meal intake | <0.001 | 0.019 |
0.396 |
| AUC0–2
h | <0.001 | 0.252 |
0.008 |
|
Cmax | <0.001 | 0.178 | <0.001 |
Fig. 2A shows the time
courses of the changes in plasma glucose following consumption of
the high-carbohydrate test meal. The level increased transiently
following consumption of the test meal, with a peak at ~30–60 min,
when the subjects consumed the placebo. The increase was
significantly smaller when the subjects consumed the
kale-containing food (active-L or active-H) compared with the
placebo according to Tukey's test (P<0.01 at 60 min). No
significant differences were identified between the values obtained
with active-L and active-H. The Cmax values (mg/dl) were
calculated to be 176.0±25.6 for placebo, 163.2±24.2 for active-L
(P<0.01 vs. placebo), and 162.0±22.9 for active-H (P<0.01 vs.
placebo; Fig. 2B). The AUC0–2
h values (mg/h/dl) were 284.2±43.0 for placebo, 268.4±42.6
for active-L (P<0.05 vs. placebo), and 266.3±41.9 for active-H
(P<0.05 vs. placebo; Fig. 2C).
Effects on postprandial plasma insulin
levels
The data are summarized in Table IV. The plasma level of insulin
increased transiently after the test meal intake, with a peak at
~30 min, when the subjects consumed the placebo. When the subjects
consumed the kale-containing food (active-L or active-H), the
increases in plasma insulin level were moderate, and the
differences were not significant.
| Table IV.Effects of kale intake on the levels
of postprandial plasma insulin. |
Table IV.
Effects of kale intake on the levels
of postprandial plasma insulin.
|
| Plasma insulin
level (µU/ml) |
|---|
|
|
|
|---|
| Test sample | Preprandial | 30 min | 60 min | 90 min | 120 min |
|---|
| Placebo | 4.46±2.39 | 48.61±31.29 | 59.41±35.98 | 46.53±28.91 | 45.08±33.40 |
| Active-L |
4.38±2.07a | 44.70±30.58 | 54.27±34.15 | 44.08±30.31 | 39.50±27.86 |
| Active-H | 4.10±2.28 | 45.40±29.31 | 52.15±30.71 | 41.13±23.49 |
36.46±21.49a |
Effects of an artificial digest on
viscosity
The addition of powdered kale, the active ingredient
of the test food, at 1–4.8% (w/v) resulted in a dose-dependent
increase in viscosity of the mixture (Fig.
3). Furthermore, kale-derived dietary fiber exerted a potent
effect when added at 0.5–1.2% (w/v). The effect exerted by
kale-derived dietary fiber at 0.5% (w/v) was comparable to that
exerted by kale powder at 4.8% (w/v; Fig.
3).
Adverse events
There were no adverse events considered to be caused
by consumption of the kale-containing food, based on the judgment
of the principal investigator after examining data for physical
measurements, blood biochemistry, hematology and urinalysis, as
well as medical interview.
Discussion
Postprandial hyperglycemia causes impaired fasting
glucose, which is a risk factor of type 2 diabetes (4,9). Lifestyle
modification, particularly through diet, is an attractive means of
controlling hyperglycemia. Kale has good nutritive value,
antioxidant activity, and health-benefits (17–19), and is
widely consumed in Western countries. In Japan, drinks prepared
from kale-containing green powder are consumed to supplement
vegetable intake or promote health. As part of our survey of
health-promoting effects of kale-containing green drinks, its
effect on postprandial hyperglycermia were investigated. The
preliminary results suggested that intake of kale reduced
postprandial plasma glucose levels (16).
The aim of the present study was to investigate the
effective dose of kale for postprandial plasma glucose levels in
humans. The subjects involved in this randomized, double-blind,
placebo-controlled, crossover trial exhibited slightly elevated
postprandial plasma glucose levels. They consumed placebo or
kale-containing food once with a meal, and their plasma glucose
levels were measured for up to 2 h after the meal. As the aim of
the study was to investigate the effective dose of the
kale-containing food, the effects of a dose of 7 g kale were
compared with those of a dose of 14 g kale, as the efficacy of kale
at 14 g was demonstrated in our previous study (16). In the present study, it was found that
kale at a dose of 7 g was as effective as kale at a dose of 14 g in
suppressing postprandial increases in plasma glucose levels. Thus,
the impact of kale on postprandial hyperglycemia was demonstrated
effectively, and the intake of kale-containing food at a dose of 7
g was identified to be sufficient to exert its effect.
Kale contains significant quantities of dietary
fibers (18,20), which prevent postprandial elevation of
plasma glucose (21). A possible
underlying mechanism responsible for this effect of plasma glucose
is an increase in intestinal viscosity, which delays the absorption
of nutrients (22,23). The kale-containing food used in the
current clinical study significantly increased viscosity at
concentrations of >1% during in vitro experiments. In addition,
the dietary fiber fraction of the kale-containing food was
effective for increasing viscosity at concentrations as low as 0.5%
(Fig. 3). Thus, it is hypothesized
that an increase in viscosity in the gut may have contributed to
the effect observed in the current study.
The present finding that kale consumption
ameliorates postprandial hyperlipidemia may contribute to
developing the concept of dietary control of hyperglycemia. The
present study, however, was performed with limited numbers of
subjects whose 30-min postprandial plasma glucose levels were
140–187 mg/dl. For the American Diabetes Association, the
postprandial glycemic threshold value has been set at 180 mg/dl
(24). Therefore, further
investigations are required to examine the efficacy of kale
consumption in subjects with more severe postprandial
hyperglycemia.
Acknowledgements
Asahi Suzuki and Mihoko Kurokawa are employees of
Q'sai Co., Ltd., which provided the research expenses to TTC Co.,
Ltd. Asahi Suzuki and Mihoko Kurokawa were not involved in the
interpretation of the results, and not influenced the outcomes at
any stage of the clinical trial.
References
|
1
|
International Diabetes Federation (IDF), .
IDF Diabetes Atlas. 7th. IDF; Brussels: 2015
|
|
2
|
Tabák AG, Herder C, Rathmann W, Brunner EJ
and Kivimäki M: Prediabetes: A high-risk state for diabetes
development. Lancet. 379:2279–2290. 2012. View Article : Google Scholar : PubMed/NCBI
|
|
3
|
Grundy SM: Pre-diabetes, metabolic
syndrome, and cardiovascular risk. J Am Coll Cardiol. 59:635–643.
2012. View Article : Google Scholar : PubMed/NCBI
|
|
4
|
Knowler WC, Fowler SE, Hamman RF,
Christophi CA, Hoffman HJ, Brenneman AT, Brown-Friday JO, Goldberg
R, Venditti E and Nathan DM: Diabetes Prevention Program Research
Group: 10-year follow-up of diabetes incidence and weight loss in
the Diabetes Prevention Program Outcomes Study. Lancet.
374:1677–1686. 2009. View Article : Google Scholar : PubMed/NCBI
|
|
5
|
Gerstein HC, Yusuf S, Bosch J, Pogue J,
Sheridan P, Dinccag N, Hanefeld M, Hoogwerf B, Laakso M, Mohan V,
et al: DREAM (Diabetes REduction Assessment with ramipril and
rosiglitazone Medication) Trial Investigators: Effect of
rosiglitazone on the frequency of diabetes in patients with
impaired glucose tolerance or impaired fasting glucose: A
randomised controlled trial. Lancet. 368:1096–1105. 2006.
View Article : Google Scholar : PubMed/NCBI
|
|
6
|
Knowler WC, Barrett-Connor E, Fowler SE,
Hamman RF, Lachin JM, Walker EA and Nathan DM: Diabetes Prevention
Program Research Group: Reduction in the incidence of type 2
diabetes with lifestyle intervention or metformin. N Engl J Med.
346:393–403. 2002. View Article : Google Scholar : PubMed/NCBI
|
|
7
|
Ramachandran A, Snehalatha C, Mary S,
Mukesh B, Bhaskar AD and Vijay V: Indian Diabetes Prevention
Programme (IDPP): The Indian Diabetes Prevention Programme shows
that lifestyle modification and metformin prevent type 2 diabetes
in Asian Indian subjects with impaired glucose tolerance (IDPP-1).
Diabetologia. 49:289–297. 2006. View Article : Google Scholar : PubMed/NCBI
|
|
8
|
Heianza Y, Hara S, Arase Y, Saito K,
Fujiwara K, Tsuji H, Kodama S, Hsieh SD, Mori Y, Shimano H, et al:
HbA1c 5·7-6·4% and impaired fasting plasma glucose for diagnosis of
prediabetes and risk of progression to diabetes in Japan (TOPICS
3): A longitudinal cohort study. Lancet. 378:147–155. 2011.
View Article : Google Scholar : PubMed/NCBI
|
|
9
|
Tabák AG, Jokela M, Akbaraly TN, Brunner
EJ, Kivimäki M and Witte DR: Trajectories of glycaemia, insulin
sensitivity, and insulin secretion before diagnosis of type 2
diabetes: An analysis from the Whitehall II study. Lancet.
373:2215–2221. 2009. View Article : Google Scholar : PubMed/NCBI
|
|
10
|
Node K and Inoue T: Postprandial
hyperglycemia as an etiological factor in vascular failure.
Cardiovasc Diabetol. 8:232009. View Article : Google Scholar : PubMed/NCBI
|
|
11
|
Trapp C and Levin S: Preparing to
prescribe plant-based diets for diabetes prevention and treatment.
Diabetes Spectrum. 25:38–44. 2012. View Article : Google Scholar
|
|
12
|
Orlich MJ and Fraser GE: Vegetarian diets
in the Adventist Health Study 2: A review of initial published
findings. Am J Clin Nutr. 100(Suppl 1): 353S–358S. 2014. View Article : Google Scholar : PubMed/NCBI
|
|
13
|
Yokoyama Y, Barnard ND, Levin SM and
Watanabe M: Vegetarian diets and glycemic control in diabetes: A
systematic review and meta-analysis. Cardiovasc Diagn Ther.
4:373–382. 2014.PubMed/NCBI
|
|
14
|
Hobden MR, Guérin-Deremaux L, Rowland I,
Gibson GR and Kennedy OB: Potential anti-obesogenic properties of
non-digestible carbohydrates: Specific focus on resistant dextrin.
Proc Nutr Soc. 74:258–267. 2015. View Article : Google Scholar : PubMed/NCBI
|
|
15
|
Murayama Y, Mochizuki K, Shimada M,
Fujimoto S, Nukui K, Shibata K and Goda T: Dietary supplementation
with alpha-amylase inhibitor wheat albumin to high-fat diet-induced
insulin-resistant rats is associated with increased expression of
genes related to fatty acid synthesis in adipose tissue. J Agric
Food Chem. 57:9332–9338. 2009. View Article : Google Scholar : PubMed/NCBI
|
|
16
|
Korenori Y, Suzuki A, Kurokawa M and Saito
J: Beneficial effects of dietary intake of food containing kale
(Brassica oleracea var. acephala) on postprandial blood glucose in
humans. A randomized, placebo-controlled, double-blind, crossover
study. Jpn Pharmacol Ther. 43:1157–1163. 2015.
|
|
17
|
Kim SY: Comparison of nutritional
compositions and antioxidant activities of building blocks in
shinseoncho and kale green vegetable juices. Prev Nutr Food Sci.
17:269–273. 2012. View Article : Google Scholar : PubMed/NCBI
|
|
18
|
Sikora E and Bodziarczyk I: Composition
and antioxidant activity of kale (Brassica oleracea L. var.
acephala) raw and cooked. Acta Sci Pol Technol Aliment. 11:239–248.
2012.PubMed/NCBI
|
|
19
|
Ismail A, Marjan ZM and Foong CW: Total
antioxidant activity and phenolic content in selected vegetables.
Food Chem. 87:581–586. 2004. View Article : Google Scholar
|
|
20
|
Migliozzi M, Thavarajah D, Thavarajah P
and Smith P: Lentil and kale: Complementary nutrient-rich whole
food sources to combat micronutrient and calorie malnutrition.
Nutrients. 7:9285–9298. 2015. View Article : Google Scholar : PubMed/NCBI
|
|
21
|
Lattimer JM and Haub MD: Effects of
dietary fiber and its components on metabolic health. Nutrients.
2:1266–1289. 2010. View Article : Google Scholar : PubMed/NCBI
|
|
22
|
Lightowler HJ and Henry CJ: Glycemic
response of mashed potato containing high-viscocity
hydroxypropylmethylcellulose. Nutr Res. 29:551–557. 2009.
View Article : Google Scholar : PubMed/NCBI
|
|
23
|
Maki KC, Davidson MH, Witchger MS, Dicklin
MR and Subbaiah PV: Effects of high-fiber oat and wheat cereals on
postprandial glucose and lipid responses in healthy men. Int J
Vitam Nutr Res. 77:347–356. 2007. View Article : Google Scholar : PubMed/NCBI
|
|
24
|
American Diabetes Association: 5, .
Glycemic Targets. Diabetes Care. 39(Suppl 1): S39–S46.
2016.PubMed/NCBI
|