Introduction
Diabetes mellitus (DM) is characterized by chronic
hyperglycemia caused by impaired insulin secretion, peripheral
insulin resistance, or both (1). To
prevent long-term micro- and macro-vascular complications, patients
with DM are required to maintain adequate glycemic control, which
is routinely assessed by measuring hemoglobin A1c (HbA1c) and
fasting blood glucose (FBG) levels (2). This therapeutic target can be achieved
by adhering to appropriate dietary and lifestyle modifications and
to the proper medications (3).
Although nutrition recommendations for patients with
DM focus on the proportion of calories obtained from carbohydrate,
fat and protein (4), there is
increasing data suggesting that vitamin D supplementation may be
associated with improved glycemic control (5–7). This was
based on prior studies that determined significant inverse
associations between serum vitamin D level and measures of glycemic
control including both HbA1c and FBG levels (8–10). The
involvement of vitamin D in glucose metabolism is considered be
associated with its role in pancreatic insulin secretion and
peripheral insulin resistance (11).
Despite being classified as a vitamin, vitamin D has also been
noted to serve several hormonal functions that are proposed to
result from its action on vitamin D receptors (VDRs), which are
widely expressed on various cell types (12). Among these functions is the action of
vitamin D on the VDRs of pancreatic beta islet cells (12). In animal studies, mice lacking
functional VDRs exhibited impaired insulin secretion (13); furthermore, vitamin D supplementation
was able to induce insulin biosynthesis in the pancreatic islets of
rats (14). In humans, certain VDR
gene variants have been associated with impaired insulin secretion
and the development of type 2 DM (15). In addition, vitamin D may serve a role
in peripheral insulin sensitivity through its action on VDRs
expressed on human skeletal muscle and adipose tissue cells
(11,16,17). These
cells are involved in determining peripheral insulin sensitivity as
they are responsible for glucose uptake in response to insulin
secretion (11).
Despite reports of a possible role for vitamin D in
DM (5,8,9), to our
knowledge the present study is the first to investigate the
association between serum vitamin D, HbA1c and FBG levels in adults
with DM from northern Jordan. The aim was to compare serum levels
of 25-hydroxyvitamin D between DM patients with good glycemic
control and patients with uncontrolled DM. Additionally, it was
investigated whether associations existed between measures of
glycemic control and other variables including age, duration of DM
and medications.
Materials and methods
Study design
The current study was a cross-sectional study that
involved 261 male and female adults (aged 19–79 years old; 111 men
and 150 women) with type 1 or type 2 DM. This represented a
response rate of 87% following assessment of eligibility. Patients
were recruited from the outpatient diabetes clinic of King Abdullah
University Hospital, Ramtha, Jordan between December 2016 and
January 2018. Patients with chronic renal failure, chronic liver
disease and/or on vitamin D supplementation for the past 3 months
were excluded from the study. All participants were taking
medications for the treatment of DM and its complications.
Participants had been informed of the purpose of the study prior to
signing consent forms. The study procedure was ethically approved
by the Institutional Research Board of Jordan University of Science
and Technology and King Abdullah University Hospital (Irbid,
Jordan; approval no. 1092015).
Sample size calculation
Sample size was calculated based on the reported
prevalence of vitamin D deficiency and insufficiency among patients
with DM in northern Jordan, which was 87.1% as determined in our
previous study (18). Sample size was
determined using the formula [sample size=
(t)2(p)(q)/(d)2] (19), where t-value (t=1.96) represents the
95% confidence interval, p=0.87 [the estimated prevalence of
vitamin D deficiency and insufficiency (18)], q=1-p and d=0.05 (the margin of error
based on the 95% confidence interval). Consequently, the calculated
sample size was 173 patients. The current study included a larger
number of patients with DM to increase reliability of results.
Data collection
Descriptive information regarding age, sex, type of
DM, duration of DM, smoking status, history of chronic renal
failure, history of chronic liver disease, history of previous
supplementation of vitamin D and list of current medications were
obtained from patients' medical records and/or by self-reporting.
Body weight (kg) was measured using a calibrated balance with
wearing of light clothes and without shoes. Height (cm) and waist
circumference (cm) were measured using a metric scale tape and body
mass index (BMI) was calculated by dividing weight (kg) by height
squared (m2). Systolic and diastolic blood pressures
(SBP and DBP) were measured using a mercury sphygmomanometer by a
registered nurse.
Blood processing and laboratory
assays
Following overnight fasting, 10-ml venous blood
samples were collected by a qualified laboratory technician to
determine 25-hydroxyvitamin D, HbA1c and FBG levels. Serum was
prepared within 2 h of blood collection by centrifuging blood
samples at 2,100 × g for 8 min using a high-speed Jouan MR23i
centrifuge (Thermo Fisher Scientific, Inc., Waltham, MA, USA), with
maintenance and preparation all at room temperature. FBG
concentration was determined by the hexokinase method (20) using a Hitachi 902 auto-analyzer (Roche
Diagnostics GmbH, Mannheim, Germany). The level of HbA1c was
determined by turbidimetric inhibition immunoassay (21) using a cobas b 101 system (Roche
Diagnostics GmbH). According to a recent report from the American
College of Physicians that recommended a target HbA1c of 7–8% for
adults with DM (2), participants with
HbA1c <8% were considered as having good glycemic control while
participants with HbA1c ≥8% were considered as having uncontrolled
DM. Serum 25-hydroxyvitamin D concentration was determined by
electrochemiluminescence immunoassay (22) using a Roche Modular E170 Analyzer
(Roche Diagnostics GmbH). Participants with serum 25-hydroxyvitamin
D >30 ng/ml were considered as having sufficient vitamin D
levels whereas participants with serum 25-hydroxyvitamin D of 20–30
ng/ml or less than 20 ng/ml were considered as having insufficient
or deficient vitamin D levels, respectively (23).
Statistical analysis
The IBM SPSS statistics 20.0 software (IBM Corp.,
Armonk, New York, USA) was used to perform statistical analysis.
All non-normally distributed continuous variables were
log-transformed prior to analysis. Continuous variables were
presented as mean ± standard deviation or median (interquartile
range). Qualitative variables were presented as number
(percentage). Differences in the mean levels of continuous
variables between participants with good glycemic control and
participants with uncontrolled DM were determined by Student's
t-test. Differences in qualitative variables between participants
with good glycemic control and participants with uncontrolled DM
were determined by χ2 test. Differences in the mean
level of 25-hydroxyvitamin D between participants with deficient,
insufficient and sufficient vitamin D levels were determined using
one-way analysis of variance with Tukey's post hoc test for
multiple comparisons. Correlation analyses between HbA1c, FBG and
other continuous variables were performed using the Pearson
product-moment correlation test. Multiple linear regression
analysis was used to detect independent predictors of HbA1c and
FBG. All P-values were two-sided and considered statistically
significant at <0.05.
Results
Characteristics of participants
The mean age of the patients was 54.94±10.92 years.
The mean duration of DM was 7.84±6.58 years, the mean BMI was
30.77±4.80 kg/m2, the mean waist circumference was
103.68±12.91 cm, the mean SBP was 137.02±17.05 mmHg and the mean
DBP was 82.65±10.51 mmHg. The median fasting blood glucose (FBG)
was 8.60 (6.60–12.53) mmol/l, the median HbA1c was 8.00 (6.88–9.83)
% and the median serum 25-hydroxyvitamin D concentration was 14.80
(8.42–22.67) ng/ml. A total of 52 (19.9%) participants were current
smokers and 209 (80.1%) participants were non-smokers. A total of
204 (78.2%) participants were on insulin therapy, 238 (91.2%)
participants were on metformin therapy, 96 (36.8%) participants
were on sulfonylureas therapy, 98 (37.5%) participants were on
aspirin therapy, 123 (47.1%) participants were on statins therapy,
39 (14.9%) participants were on beta blockers therapy, 79 (30.3%)
participants were on angiotensin converting enzyme inhibitors
therapy, 32 (12.3%) participants were on calcium channel blockers
therapy and 45 (17.2%) participants were on proton pump inhibitors
therapy. Descriptive characteristics of the participants according
to their glycemic control are presented in Table I.
 | Table I.Characteristics of participants
according to level of glycemic control. |
Table I.
Characteristics of participants
according to level of glycemic control.
| Characteristics | Good glycemic
control, HbA1c <8% (n=129) | Glycemic
uncontrolled, HbA1c ≥8% (n=132) | P-valuea |
|---|
| Age, years | 56.72±9.86 | 53.19±11.64 | <0.01 |
| Sex |
|
| <0.01 |
| Male | 43 (33.3) | 68 (51.5) |
|
|
Female | 86 (66.7) | 64 (48.5) |
|
| Smoking | 21 (16.3) | 31 (23.5) | 0.16 |
| Height, cm | 165.28±9.07 | 167.07±10.19 | 0.14 |
| Weight, kg | 85.43±13.00 | 84.33±15.30 | 0.53 |
| BMI,
kg/m2 | 31.16±4.12 | 30.38±5.37 | 0.19 |
| WC, cm | 104.18±11.93 | 103.20±13.82 | 0.55 |
| DM |
|
| <0.01 |
| Type
1 | 2 (1.6) | 20 (15.2) |
|
| Type
2 | 127 (98.4) | 112 (84.8) |
|
| Log [duration of DM
(months)] | 1.67±0.49 | 1.87±0.51 | <0.01 |
| Log [FBG
(mmol/l)] | 0.87±0.14 | 1.06±0.19 | <0.01 |
| Log [HbA1c
(%)] | 0.83±0.06 | 1.00±0.07 | <0.01 |
| SBP, mmHg | 136.58±16.08 | 137.45±18.01 | 0.68 |
| DBP, mmHg | 83.61±9.22 | 81.70±11.60 | 0.15 |
| Insulin | 100 (77.5) | 104 (78.8) | 0.80 |
| Metformin | 124 (96.1) | 114 (86.4) | <0.01 |
| Sulfonylureas | 44 (34.1) | 52 (39.4) | 0.38 |
| Aspirin | 53 (41.1) | 45 (34.1) | 0.24 |
| Statins | 65 (50.4) | 58 (43.9) | 0.30 |
| Beta blockers | 19 (14.7) | 20 (15.2) | 0.92 |
| ACEIs | 39 (30.2) | 40 (30.3) | 0.99 |
| CCBs | 18 (14.0) | 14 (10.6) | 0.41 |
| PPIs | 20 (15.5) | 25 (18.9) | 0.46 |
| Log
[25-hydroxyvitamin D (ng/ml)] | 1.18±0.26 | 1.10±0.30 | 0.03 |
Correlation of HbA1c and FBG with
serum 25-hydroxyvitamin D and other variables
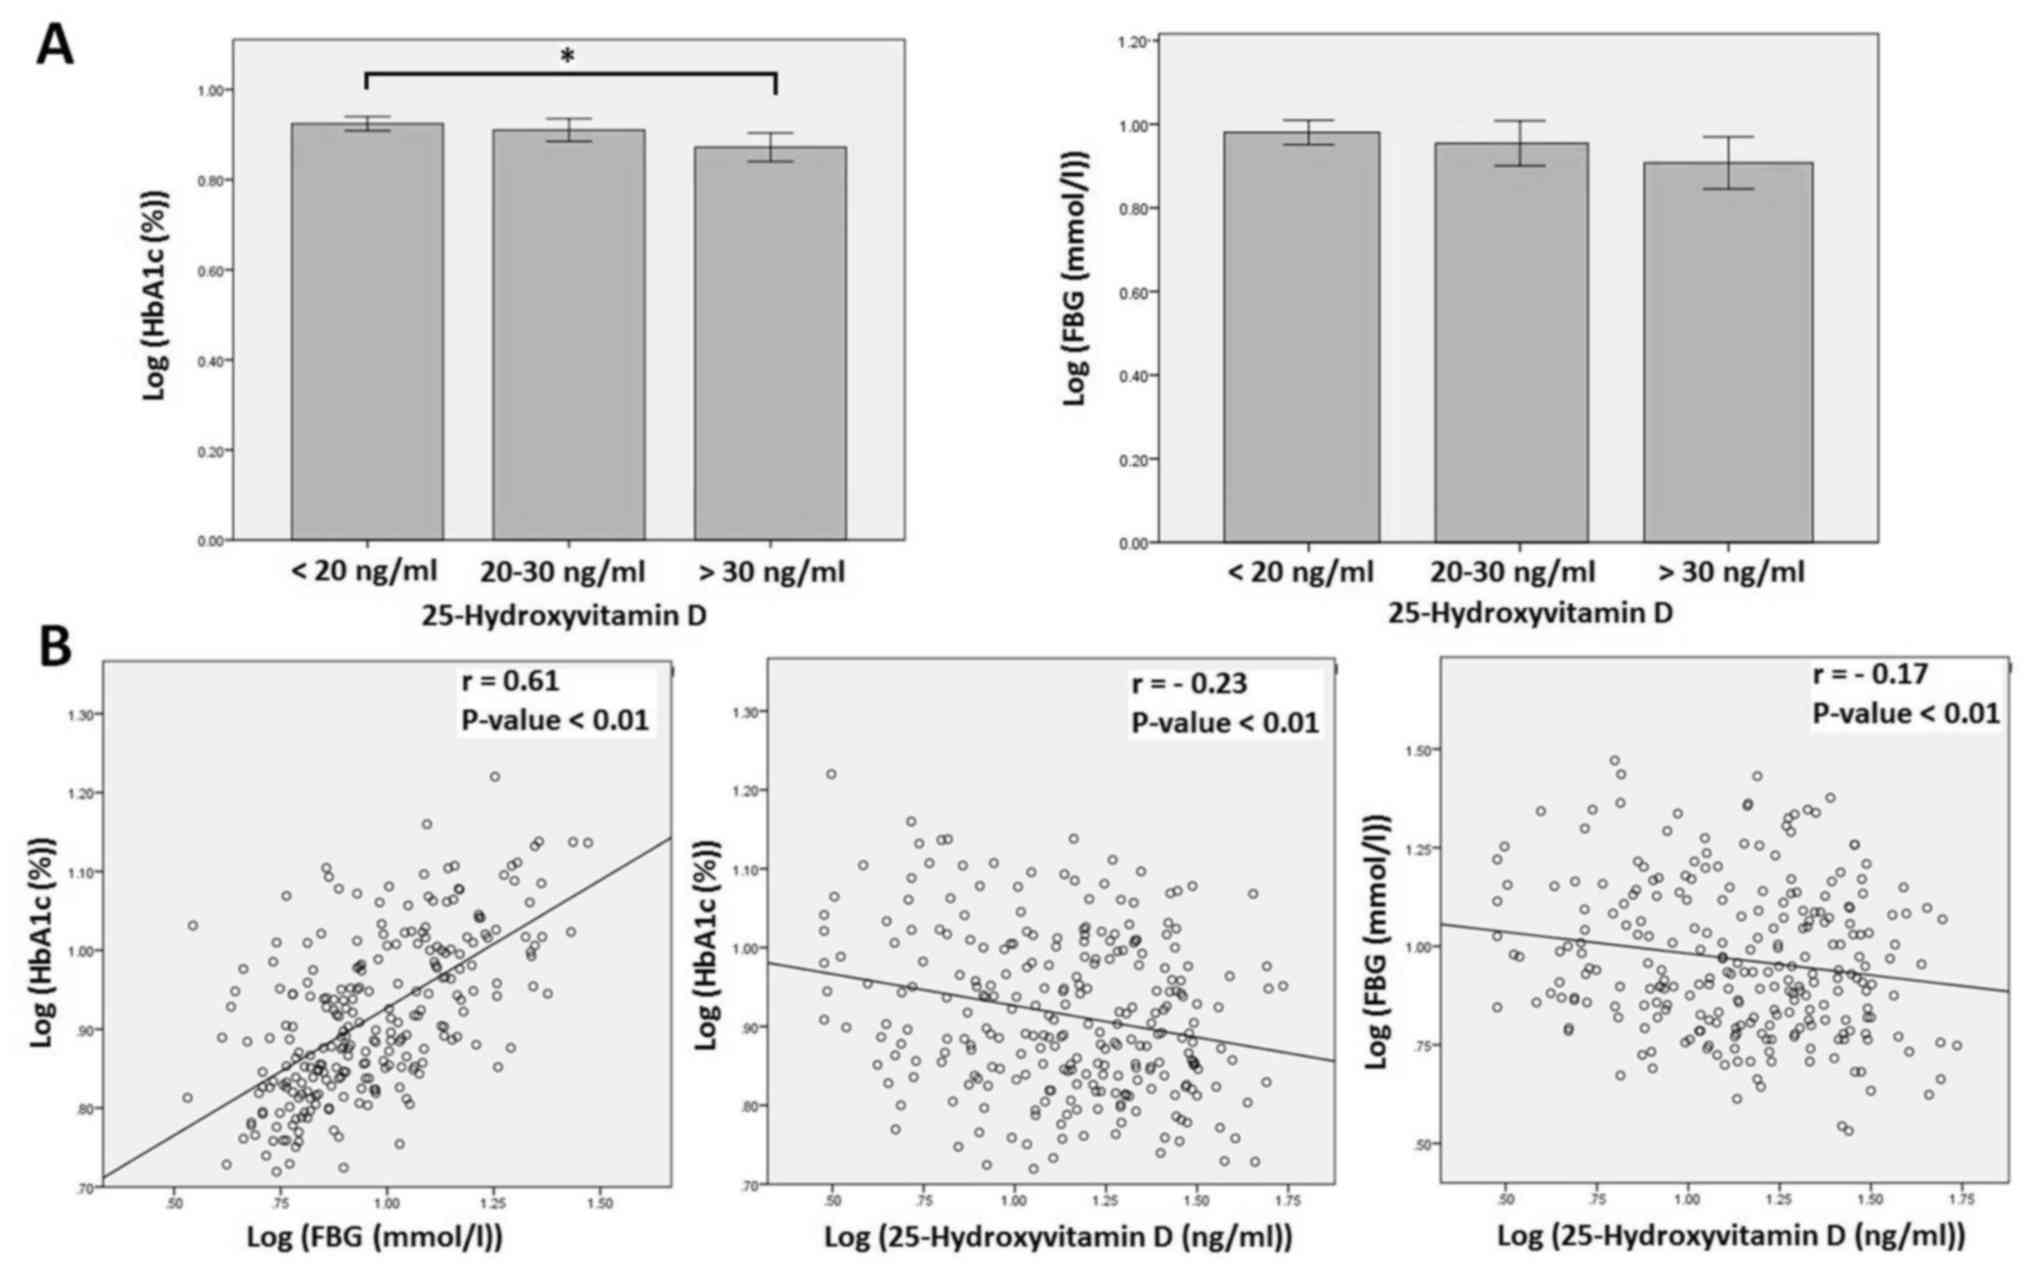
As shown in Table I,
serum 25-hydroxyvitamin D was significantly higher in participants
with controlled DM compared with in those with uncontrolled DM
(P=0.03). HbA1c level was significantly higher in participants with
deficient (<20 ng/ml) vitamin D level compared with in
participants with sufficient (>30 ng/ml) vitamin D level
(P=0.02; Fig. 1A). Whereas, there was
no significant difference in HbA1c level between participants with
deficient or sufficient and insufficient vitamin D levels
(P>0.05; Fig. 1A). In addition,
there was no significant difference in FBG level between
participants with sufficient, insufficient and deficient vitamin D
levels (Fig. 1A). Further correlation
analyses (Table II) between HbA1c,
FBG, serum 25-hydroxyvitamin D and other variables determined
significant inverse correlations between serum 25-hydroxyvitamin D
and HbA1c (r=−0.23, P<0.01) and between serum 25-hydroxyvitamin
D and FBG (r=−0.17, P<0.01; Fig.
1B). HbA1c was also inversely correlated with participant's age
(r=−0.19, P<0.01) and directly correlated with duration of DM
(r=0.21, P<0.01) and FBG (r=0.61, P<0.01). FBG was also
directly correlated with duration of DM (r=0.21, P<0.01).
| Table II.Correlation of HbA1c and FBG with
other variables. |
Table II.
Correlation of HbA1c and FBG with
other variables.
|
| Log [HbA1c
(%)] | Log [FBG
(mmol/l)] |
|---|
|
|
|
|
|---|
|
Characteristics | r |
P-valuea | r |
P-valuea |
|---|
| Age | −0.19 | <0.01 | −0.12 | 0.06 |
| Height, cm | 0.04 | 0.50 | −0.05 | 0.45 |
| Weight, kg | −0.08 | 0.21 | 0.02 | 0.75 |
| BMI,
kg/m2 | −0.08 | 0.21 | 0.05 | 0.42 |
| WC, cm | −0.03 | 0.63 | 0.11 | 0.10 |
| Log [duration of DM
(months)] | 0.21 | <0.01 | 0.21 | <0.01 |
| Log [FBG
(mmol/l)] | 0.61 | <0.01 | – | – |
| SBP (mmHg) | 0.05 | 0.46 | 0.01 | 0.87 |
| DBP (mmHg) | −0.10 | 0.12 | −0.07 | 0.25 |
| Log
[25-hydroxyvitamin D (ng/ml)] | −0.23 | <0.01 | −0.17 | <0.01 |
Association of HbA1c and FBG with
serum 25-hydroxyvitamin D and other variables
Multiple linear regression analyses were performed
to identify the potential predictors of HbA1c and FBG levels
(Table III). HbA1c was inversely
associated with serum 25-hydroxyvitamin D level and directly
associated with FBG (both P<0.01). HbA1c was also associated
with type of DM (P<0.01), indicating that participants with type
1 DM had higher levels of HbA1c (Tables
I and III). FBG was associated
with statins therapy (P=0.04), indicating that participants on
statin therapy had lower levels of FBG (Tables I and III).
| Table III.Association of HbA1c and FBG with
other variables. |
Table III.
Association of HbA1c and FBG with
other variables.
| Dependent
variable | R2 | ANOVA | Model | B | β | t-value |
P-valuea |
|---|
| Log [HbA1c
(%)] | 0.48 | F=12.95,
P<0.01 | Constant | 0.86 | – | 13.24 | <0.01 |
|
|
|
| Age | <-0.01 | −0.06 | −1.03 | 0.30 |
|
|
|
| Log (duration of
DM) | 0.02 | 0.08 | 1.47 | 0.14 |
|
|
|
| Log [FBG
(mmol/l)] | 0.29 | 0.54 | 10.53 | <0.01 |
|
|
|
| Log [25-hydroxy-
vitamin D (ng/ml)] | −0.05 | −0.13 | −2.67 | <0.01 |
|
|
|
| Type of DM | −0.06 | −0.17 | −2.39 | 0.02 |
|
|
|
| Sex | −0.02 | −0.09 | −1.64 | 0.10 |
|
|
|
| Smoking | 0.01 | 0.03 | 0.56 | 0.57 |
|
|
|
| Metformin
therapy | −0.03 | −0.07 | −1.17 | 0.24 |
|
|
|
| Sulfonylureas
therapy | 0.01 | 0.03 | 0.56 | 0.58 |
|
|
|
| Insulin
therapy | <0.01 | <0.01 | 0.15 | 0.88 |
|
|
|
| Statin therapy | <0.01 | 0.04 | 0.70 | 0.49 |
|
|
|
| Beta blocker
therapy | 0.02 | 0.06 | 1.15 | 0.25 |
|
|
|
| ACEIs therapy | 0.02 | 0.07 | 1.18 | 0.24 |
|
|
|
| Aspirin
therapy | −0.02 | −0.11 | −1.81 | 0.07 |
|
|
|
| CCBs therapy | <-0.01 | −0.01 | −0.27 | 0.79 |
|
|
|
| PPIs therapy | −0.01 | −0.05 | −1.06 | 0.29 |
| Log [FBG
(mmol/l)] | 0.42 | F=11.00,
P<0.01 | Constant | −0.15 | – | −0.86 | 0.39 |
|
|
|
| Log (duration of
DM) | 0.03 | 0.07 | 1.29 | 0.20 |
|
|
|
| Log [HbA1c
(%)] | 1.14 | 0.61 | 10.69 | <0.01 |
|
|
|
| Log
[25-hydroxy-vitamin D (ng/ml)] | −0.02 | −0.04 | −0.68 | 0.50 |
|
|
|
| Type of DM | −0.02 | −0.03 | −0.41 | 0.68 |
|
|
|
| Sex | <0.01 | 0.02 | 0.27 | 0.79 |
|
|
|
| Smoking | <0.01 | <0.01 | 0.13 | 0.90 |
|
|
|
| Metformin
therapy | 0.09 | 0.13 | 2.01 | 0.05 |
|
|
|
| Sulfonylureas
therapy | 0.02 | 0.06 | 1.02 | 0.31 |
|
|
|
| Insulin
therapy | −0.02 | −0.05 | −0.88 | 0.38 |
|
|
|
| Statins
therapy | −0.05 | −0.12 | −2.02 | 0.04 |
|
|
|
| Beta blocker
therapy | −0.01 | −0.02 | −0.33 | 0.74 |
|
|
|
| ACEIs therapy | −0.03 | −0.06 | −1.07 | 0.29 |
|
|
|
| Aspirin
therapy | 0.04 | 0.11 | 1.75 | 0.08 |
|
|
|
| CCBs therapy | <0.01 | 0.01 | 0.24 | 0.81 |
|
|
|
| PPIs therapy | 0.03 | 0.06 | 1.03 | 0.30 |
Discussion
In the present descriptive study, the aim was to
assess the association between serum 25-hydroxyvitamin D levels and
measures of glycemic control in adults with DM from the north of
Jordan. Patients with good glycemic control exhibited significantly
higher levels of 25-hydroxyvitamin D compared with patients with
uncontrolled DM. Additionally, patients with sufficient vitamin D
status exhibited significantly lower HbA1c levels (but not FBG
levels) compared with patients with deficient vitamin D status.
Correlation analysis also revealed significant inverse correlations
between 25-hydroxyvitamin D levels and HbA1c and FBG levels.
Further multiple linear regression analysis identified an inverse
significant association between HbA1c and 25-hydroxyvitamin D
levels but did not find similar association between FBG and
25-hydroxyvitamin D levels.
These findings are comparable with those reported in
previous similar studies. For instance, Zoppini et al
(8) and Kostoglou-Athanassiou et
al (10) observed a significant
inverse association between 25-hydroxyvitamin D and HbA1c levels in
patients with type 2 DM, though Zoppini et al (8) did not detect a significant correlation
between 25-hydroxyvitamin D and FBG levels in their cohort. In
addition, Lim et al (24) and
Kajbaf et al (25) found a
significant inverse association between 25-hydroxyvitamin D and
HbA1c levels in type 2 DM patients with chronic kidney disease. In
patients with type 1 or 2 DM, Buhary et al (5) also detected a significant inverse
association between HbA1c and 25-hydroxyvitamin D levels, and
observed that supplementation of vitamin D was able to improve
glycemic control by reducing HbA1c levels. Although this finding
was supported by a recent systematic review and meta-analysis,
which concluded that supplementation of vitamin D was associated
with reduced HbA1c levels in patients with type 2 DM (7), other systematic reviews and
meta-analyses (26,27) have not supported the notion that
vitamin D supplementation may improve measures of glycemic control
including HbA1c levels. Thus, the association between vitamin D and
HbA1c levels in patients with DM does not essentially imply the
involvement of vitamin D supplementation in improving glycemic
control. This exposes the question of whether the relationship
between vitamin D deficiency and glucose homeostasis is causal or
confounding (28).
However, the possible role of vitamin D in glucose
metabolism may be due to its action on VDRs expressed on cells of
the pancreatic beta islets (12),
skeletal muscle and adipose tissue (11,16,17).
Vitamin D binding to these receptors may be involved in enhancing
pancreatic insulin secretion and peripheral insulin sensitivity by
increasing glucose uptake in skeletal muscle and adipose tissue
(11). The inconsistent effect of
vitamin D supplementation in improving glycemic control (5,7,26,27) may be
explained by the possible action of vitamin D on enhancing insulin
secretion, which depends on the reserved function of the pancreatic
beta islet cells (29). Patients with
type 2 DM may have variable and progressive decrease in pancreatic
insulin secretion (29). Therefore,
the variability in responding to vitamin D supplementation could be
due to the variability in the reserved beta islet cell function,
which may differ from one patient to another. Consequently, it is
possible that if patients have complete pancreatic beta cell
dysfunction, vitamin D supplementation may not affect insulin
secretion and thus glycemic control.
In the current study, 25-hydroxyvitamin D was
inversely associated with HbA1c but not with FBG. This suggests
that maintaining a sufficient vitamin D level in DM patients may
improve HbA1c but not FBG. The difference between the two glycemic
measures is that HbA1c reflects the average level of blood glucose
over the past 2–3 months while FBG represents a single measurement
of blood glucose concentration following overnight fasting
(30). As FBG is determined by the
level of basal insulin secretion and HbA1c by the level of both
basal and postprandial insulin secretion (31), the present results suggest that the
association between vitamin D and HbA1c could be due to vitamin D
involvement in postprandial insulin secretion rather than basal
insulin secretion. The effect of vitamin D on insulin secretion may
also be indirect by increasing intracellular calcium (28). One of the principal functions of
vitamin D is to increase calcium absorption from the
gastrointestinal tract (32). In the
postprandial situation, increased vitamin D-dependent calcium
absorption may increase intracellular calcium, which could act as a
mediator of postprandial insulin secretion (28) and thus improve HbA1c level without
affecting FBG level.
Although participants with controlled DM were of
significantly increased age, presented with shorter duration of DM,
were of a greater female proportion and were using metformin more
than participants with uncontrolled DM, multiple linear regression
analysis did not reveal any significant association between these
parameters and measures of glycemic control. Participants with type
2 DM more frequently had controlled DM compared with participants
with type 1 DM. Consistently, regression analysis demonstrated a
significant association between HbA1c level and DM type, which
suggests that patients with type 1 DM had higher levels of HbA1c
compared with patients with type 2 DM. Interestingly, FBG level was
significantly inversely associated with the use of statin therapy,
suggesting that these medications may have a positive effect on
FBG.
Collectively, the current study confirmed a
significant inverse association between serum 25-hydroxyvitamin D
and HbA1c levels but did not identify such association between
25-hydroxyvitamin D and FBG levels in adult patients with DM from
northern Jordan. The current study had strength in its relatively
large sample size, making the results comparable with findings
reported in other similar studies. In addition, the impact of
patients' medications on the association between 25-hydroxyvitamin
D and glycemic control was taken in consideration by including
these medications in the regression analysis. However, the
cross-sectional design prevented investigation into why
25-hydroxyvitamin D level was associated with HbA1c. As such, this
association requires further investigation to determine if vitamin
D supplementation may improve glycemic control in adults with DM
from Jordan. If vitamin D supplementation was to improve glycemic
control, then further research to determine the mechanism by which
vitamin D affects glucose homeostasis would be warranted. Another
limitation was the emphasis on detecting an association between
serum 25-hydroxyvitamin D level and measures of glycemic control
without investigating a possible association between serum
25-hydroxyvitamin D and DM complications, which are the most
important factors affecting the prognosis of DM patients (33). However, this may encourage future
studies into the potential relationship between serum vitamin D and
individual DM complications such as eye lesions, vascular lesions
and kidney disease.
In conclusion, the present study observed a
significant inverse association between serum 25-hydroxyvitamin D
and HbA1c levels in adult patients with DM. Serum 25-hydroxyvitamin
D level in patients with good glycemic control was significantly
higher than in patients with uncontrolled DM. These findings may
enhance further research to identify if vitamin D supplementation
can improve HbA1c level in patients with DM, and if vitamin D can
affect glucose homeostasis in DM.
Acknowledgements
Not applicable.
Funding
The current study was supported by the Deanship of
Research at Jordan University of Science and Technology (grant no.
109/2015).
Availability of data and materials
The datasets used and/or analyzed during the current
study are available from the corresponding author on reasonable
request.
Authors' contributions
MJA was responsible for study design, patient
recruitment, data collection, data analysis and manuscript writing.
KKAR was responsible for data interpretation and manuscript
editing. Both authors approved the final version of the manuscript
to be published.
Ethics approval and consent to
participate
The study procedure was ethically approved by the
Institutional Research Board of Jordan University of Science and
Technology and King Abdullah University Hospital (Irbid, Jordan;
approval no. 1092015). All participants agreed to participate in
this study by signed written informed consent.
Patient consent for publication
All participants provided written informed consent
permitting publication of relevant data following anonymization of
personal information.
Competing interests
The authors declare that they have no competing
interests.
References
|
1
|
Ndisang JF, Vannacci A and Rastogi S:
Insulin Resistance, Type 1 and Type 2 Diabetes, and Related
Complications 2017. J Diabetes Res. 2017:14782942017. View Article : Google Scholar : PubMed/NCBI
|
|
2
|
Qaseem A, Wilt TJ, Kansagara D, Horwitch
C, Barry MJ and Forciea MA; Clinical Guidelines Committee of the
American College of Physicians, . Hemoglobin A1c targets for
glycemic control with pharmacologic therapy for nonpregnant adults
with type 2 diabetes mellitus: A guidance statement update from the
American college of physicians. Ann Intern Med. 168:569–576. 2018.
View Article : Google Scholar : PubMed/NCBI
|
|
3
|
Sanghani NB, Parchwani DN, Palandurkar KM,
Shah AM and Dhanani JV: Impact of lifestyle modification on
glycemic control in patients with type 2 diabetes mellitus. Indian
J Endocrinol Metab. 17:1030–1039. 2013. View Article : Google Scholar : PubMed/NCBI
|
|
4
|
Franz MJ, Boucher JL and Evert AB:
Evidence-based diabetes nutrition therapy recommendations are
effective: The key is individualization. Diabetes Metab Syndr Obes.
7:65–72. 2014. View Article : Google Scholar : PubMed/NCBI
|
|
5
|
Buhary BM, Almohareb O, Aljohani N,
Alrajhi S, Elkaissi S, Sherbeeni S, Almaghamsi A, Khan SA and
Almalki MH: Association of glycosylated hemoglobin levels with
vitamin D status. J Clin Med Res. 9:1013–1018. 2017. View Article : Google Scholar : PubMed/NCBI
|
|
6
|
Lee CJ, Iyer G, Liu Y, Kalyani RR, Bamba
N, Ligon CB, Varma S and Mathioudakis N: The effect of vitamin D
supplementation on glucose metabolism in type 2 diabetes mellitus:
A systematic review and meta-analysis of intervention studies. J
Diabetes Complications. 31:1115–1126. 2017. View Article : Google Scholar : PubMed/NCBI
|
|
7
|
Wu C, Qiu S, Zhu X and Li L: Vitamin D
supplementation and glycemic control in type 2 diabetes patients: A
systematic review and meta-analysis. Metabolism. 73:67–76. 2017.
View Article : Google Scholar : PubMed/NCBI
|
|
8
|
Zoppini G, Galletti A, Targher G, Brangani
C, Pichiri I, Negri C, Stoico V, Cacciatori V and Bonora E:
Glycated haemoglobin is inversely related to serum vitamin D levels
in type 2 diabetic patients. PLoS One. 8:e827332013. View Article : Google Scholar : PubMed/NCBI
|
|
9
|
Haidari F, Zakerkish M, Karandish M, Saki
A and Pooraziz S: Association between serum vitamin D level and
glycemic and inflammatory markers in non-obese patients with type 2
diabetes. Iran J Med Sci. 41:367–373. 2016.PubMed/NCBI
|
|
10
|
Kostoglou-Athanassiou I, Athanassiou P,
Gkountouvas A and Kaldrymides P: Vitamin D and glycemic control in
diabetes mellitus type 2. Ther Adv Endocrinol Metab. 4:122–128.
2013. View Article : Google Scholar : PubMed/NCBI
|
|
11
|
Alvarez JA and Ashraf A: Role of vitamin D
in insulin secretion and insulin sensitivity for glucose
homeostasis. Int J Endocrinol. 2010:3513852010. View Article : Google Scholar : PubMed/NCBI
|
|
12
|
Wang Y, Zhu J and DeLuca HF: Where is the
vitamin D receptor? Arch Biochem Biophys. 523:123–133. 2012.
View Article : Google Scholar : PubMed/NCBI
|
|
13
|
Zeitz U, Weber K, Soegiarto DW, Wolf E,
Balling R and Erben RG: Impaired insulin secretory capacity in mice
lacking a functional vitamin D receptor. FASEB J. 17:509–511. 2003.
View Article : Google Scholar : PubMed/NCBI
|
|
14
|
Bourlon PM, Billaudel B and Faure-Dussert
A: Influence of vitamin D3 deficiency and 1,25 dihydroxyvitamin D3
on de novo insulin biosynthesis in the islets of the rat endocrine
pancreas. J Endocrinol. 160:87–95. 1999. View Article : Google Scholar : PubMed/NCBI
|
|
15
|
Sentinelli F, Bertoccini L, Barchetta I,
Capoccia D, Incani M, Pani MG, Loche S, Angelico F, Arca M, Morini
S, et al: The vitamin D receptor (VDR) gene rs11568820 variant is
associated with type 2 diabetes and impaired insulin secretion in
Italian adult subjects, and associates with increased
cardio-metabolic risk in children. Nutr Metab Cardiovasc Dis.
26:407–413. 2016. View Article : Google Scholar : PubMed/NCBI
|
|
16
|
Simpson RU, Thomas GA and Arnold AJ:
Identification of 1,25-dihydroxyvitamin D3 receptors and activities
in muscle. J Biol Chem. 260:8882–8891. 1985.PubMed/NCBI
|
|
17
|
Al-Shoumer KA and Al-Essa TM: Is there a
relationship between vitamin D with insulin resistance and diabetes
mellitus? World J Diabetes. 6:1057–1064. 2015. View Article : Google Scholar : PubMed/NCBI
|
|
18
|
Alkhatatbeh MJ, Abdul-Razzak KK, Khasawneh
LQ and Saadeh NA: High prevalence of vitamin D deficiency and
correlation of serum vitamin D with cardiovascular risk in patients
with metabolic syndrome. Metab Syndr Relat Disord. 15:213–219.
2017. View Article : Google Scholar : PubMed/NCBI
|
|
19
|
Bartlett JE, Kotrlik JW and Higgins CC:
Organizational research: Determining appropriate sample size in
survey research. Inf Technol Learn Perform J. 19:43–50. 2001.
|
|
20
|
Schmidt FH: [Blood glucose levels in
capilary blood of adults assessed by the hexokinase method
(author's transl)]. Klin Wochenschr. 51:520–522. 1973.(In German).
View Article : Google Scholar : PubMed/NCBI
|
|
21
|
Genc S, Omer B, Aycan-Ustyol E, Ince N,
Bal F and Gurdol F: Evaluation of turbidimetric inhibition
immunoassay (TINIA) and HPLC methods for glycated haemoglobin
determination. J Clin Lab Anal. 26:481–485. 2012. View Article : Google Scholar : PubMed/NCBI
|
|
22
|
Leino A, Turpeinen U and Koskinen P:
Automated measurement of 25-OH vitamin D3 on the Roche Modular E170
analyzer. Clin Chem. 54:2059–2062. 2008. View Article : Google Scholar : PubMed/NCBI
|
|
23
|
Holick MF: Vitamin D status: Measurement,
interpretation, and clinical application. Ann Epidemiol. 19:73–78.
2009. View Article : Google Scholar : PubMed/NCBI
|
|
24
|
Lim LL, Ng YM, Kang PS and Lim SK:
Association between serum 25-hydroxyvitamin D and glycated
hemoglobin levels in type 2 diabetes patients with chronic kidney
disease. J Diabetes Investig. 9:375–382. 2018. View Article : Google Scholar : PubMed/NCBI
|
|
25
|
Kajbaf F, Mentaverri R, Diouf M, Fournier
A, Kamel S and Lalau JD: The Association between 25-Hydroxyvitamin
D and Hemoglobin A1c Levels in Patients with Type 2 Diabetes and
Stage 1-5 Chronic Kidney Disease. Int J Endocrinol.
2014:1424682014. View Article : Google Scholar : PubMed/NCBI
|
|
26
|
George PS, Pearson ER and Witham MD:
Effect of vitamin D supplementation on glycaemic control and
insulin resistance: A systematic review and meta-analysis. Diabet
Med. 29:e142–e150. 2012. View Article : Google Scholar : PubMed/NCBI
|
|
27
|
Nigil Haroon N, Anton A, John J and Mittal
M: Effect of vitamin D supplementation on glycemic control in
patients with type 2 diabetes: A systematic review of
interventional studies. J Diabetes Metab Disord. 14:32015.
View Article : Google Scholar : PubMed/NCBI
|
|
28
|
Lips P, Eekhoff M, van Schoor N,
Oosterwerff M, de Jongh R, Krul-Poel Y and Simsek S: Vitamin D and
type 2 diabetes. J Steroid Biochem Mol Biol. 173:280–285. 2017.
View Article : Google Scholar : PubMed/NCBI
|
|
29
|
Fonseca VA: Defining and characterizing
the progression of type 2 diabetes. Diabetes Care. 32 Suppl
2:S151–S156. 2009. View Article : Google Scholar : PubMed/NCBI
|
|
30
|
Sherwani SI, Khan HA, Ekhzaimy A, Masood A
and Sakharkar MK: Significance of HbA1c Test in diagnosis and
prognosis of diabetic patients. Biomark Insights. 11:95–104. 2016.
View Article : Google Scholar : PubMed/NCBI
|
|
31
|
Monnier L and Colette C: Contributions of
fasting and postprandial glucose to hemoglobin A1c. Endrocr Pract.
12 Suppl 1:42–46. 2016. View Article : Google Scholar
|
|
32
|
Christakos S, Dhawan P, Porta A, Mady LJ
and Seth T: Vitamin D and intestinal calcium absorption. Mol Cell
Endocrinol. 347:25–29. 2011. View Article : Google Scholar : PubMed/NCBI
|
|
33
|
Papatheodorou K, Banach M, Bekiari E,
Rizzo M and Edmonds M: Complications of Diabetes 2017. J Diabetes
Res. 2018:30861672018. View Article : Google Scholar : PubMed/NCBI
|