Introduction
Minamata disease is a toxic nervous disease
resulting from the consumption of seafood contaminated with
methylmercury (MeHg) compounds (1).
In the brain of patients with Minamata disease, the accumulation of
macrophages was observed around brain lesions, and Hg was detected
in neurons, neuroglial cells and macrophages, indicating the
potential involvement of macrophages in MeHg-induced neurotoxicity
(2). Furthermore, the infiltration of
CD204-positive macrophages in the brains of MeHg-exposed KK-Ay mice
has been reported (3,4). Acute and chronic brain inflammation
induces brain injury and neurodegenerative disorders (5), and macrophages and microglia are potent
modulators of repair and regeneration in the central nervous system
(6). Microglia, in addition to
peripherally derived macrophages and perivascular macrophages,
participate in inflammatory responses. Therefore, clarification of
the role of inflammation due to Hg compounds in macrophages is
important for understanding the pathophysiology of acute and
chronic exposure to MeHg.
Exposure to a non-cytotoxic dose of MeHg increases
the expression of various cytokines, such as interleukin (IL)-6,
IL-8 and monocyte chemoattractant protein (MCP-1), which have been
reported in human U-87MG astrocytoma/glioblastoma and U937
macrophage cell lines (7,8). In vivo studies using mice also
reported the activation of MCP-1 expression through MeHg exposure
in the brain (9,10). A recent study reported that a
non-toxic dose of MeHg induced the expression of macrophage
inflammatory proteins C-X-C motif chemokine 2 (MIP-2) and C-C motif
chemokine 12 (MCP-5), which are murine functional homologs of human
IL-8 and MCP-1, respectively, in RAW264.7 macrophages (11).
After a long period (>20 years) of MeHg exposure,
the proportion of MeHg in total mercury (T-Hg) was reported to be
in the range of 0.48-2.67% in the occipital pole, calcarine region,
posterior central gyrus, anterior central gyrus, white matter of
the frontal lobe, pallidum and cerebellum of patients with Minamata
disease, indicating that MeHg had been demethylated to inorganic
mercury (Hg2+) in the brain (12). MeHg demethylation in macrophages with
the involvement of reactive oxygen species (ROS) signaling pathways
was reported in both in vivo and in vitro studies
(13,14), suggesting that the accumulation of
Hg2+might cause inflammation in the chronic stages of
MeHg exposure. Therefore, clarification of the inflammatory
response in macrophages against Hg2+ exposure is
important to understand the pathophysiology of the late stages of
MeHg exposure. Previous studies reported that exposure to
Hg2+ activated the expression of pro-inflammatory
cytokines such as tumor necrosis factor (TNF)-α (15,16) and
IL-1(16), and decreased
IL-1-receptor antagonist and IL-10 expression in human peripheral
blood mononuclear cells (16).
Recently, Wu et al (17)
reported that the administration of Hg2+
(HgCl2, 33.6 mg/kg for 7 days) caused a significant
delay in body weight gain and induced the expression of MIP-2 and
platelet-derived growth factor-inducible protein KC (KC), a
functional IL-8 homolog of C-X-C motif chemokine ligand (CXCL)1, in
the livers of Kunming mice. However, the effect of a non-toxic dose
of Hg2+ on MIP-2, KC and MCP-5 expression in macrophages
remains to be elucidated.
As Hg compounds express their toxicity through the
inflammatory pathway, a promising strategy to protect the body from
the harmful effects of Hg is treatment with an anti-inflammatory
agent. The potential applications of N-acetyl-L-cysteine (NAC) to
facilitate recovery after various neurological disorders, such as
traumatic brain injury, cerebral ischemia, and in the treatment of
cerebrovascular vasospasm after subarachnoid hemorrhage, have been
examined (18). NAC is a well-known
antioxidant, as well as an anti-inflammatory agent, that can work
to reduce the toxic effects of heavy metals such as arsenic
(19). By inhibiting the upstream
signaling of transcription factor production, NAC increases
glutathione levels intracellularly and/or acts as a free radical
scavenger, which results in the decrease in ROS (19-21).
NAC has also been reported to work as a chelating agent to
accelerate the urine-based excretion of MeHg in mice (22). Studies have shown that NAC suppresses
MeHg-induced IL-6 and MCP-1 expression in U-87MG cells (7), IL-6 and IL-8 expression in U937
macrophages and U-87MG cells (8), and
MIP-2 expression in RAW264.7 macrophages (11).
Based on this background information, the activation
of MIP-2, KC and MCP-5 expression in macrophages was examined in
the presence of Hg2+ to clarify the involvement of
inflammatory responses upon MeHg exposure. Furthermore, the effects
of NAC on Hg2+-induced cytokine expression levels were
also examined.
Materials and methods
Cell culture
An initial concentration of 2x10⁴
RAW264.7 cells (Sumitomo Dainippon Pharma Co., Ltd.) were cultured
in DMEM (Sigma-Aldrich; Merck KGaA) containing penicillin (100
U/ml), streptomycin (171.90 µmol/l), 1% L-glutamine (Sigma-Aldrich;
Merck KGaA) and 10% heat-inactivated FBS (Nichirei Biosciences) at
37˚C in a 5% CO2 humidified incubator.
Cytotoxicity assay
Hg2+ (HgCl2) stock solution
(10 mM) (Merck KGaA) was dissolved in Dulbecco's PBS
(Sigma-Aldrich; Merck KGaA) and kept at 4˚C. It was diluted with
cell culture medium immediately prior to being added to the cells.
NAC (Wako Pure Chemical Industries, Ltd.) was dissolved in FBS-free
DMEM, and the pH was adjusted to 7.4 by adding NaOH.
The cells were cultured (2x10⁴
cells/well) for 24 h in 96-well plates and then incubated with
medium containing Hg2+ (0.1-100 µM) or NAC (0.1-100 mM)
for 24 h to check the cytotoxicity level using a WST-Cell Counting
Kit-8, according to the manufacturer's protocol (Wako Pure Chemical
Industries, Ltd.). The WST-8, highly water-soluble tetrazolium
salt, is reduced by dehydrogenase activity in the cells to give a
yellow-colored formazan dye, which is soluble in the tissue culture
media. The amount of the formazan dye, generated by the activity of
dehydrogenases in the cells, is directly proportional to the number
of living cells. The yellow color was quantified within 1-2 h at
450 nm absorbance using a microplate spectrophotometer (TriStar
LB941; Berthold Technologies GmbH and Co. KG) and culture medium
was used as a standard to adjust the absorbance values of the
samples. The mean values and standard errors (SEs) were based on
four independent experiments.
Treatments with Hg2+ and
NAC
Based on the results of the cytotoxicity
experiments, 10 or 20 µM Hg2+ and 1 or 20 mM NAC were
used as non-cytotoxic doses. A non-cytotoxic dose was considered to
be aconcentration of Hg2+or NAC at which cell viability
could be maintained near 100%. Cells were incubated with
Hg2+ for 3, 6, 12 and 24 h to deduce the optimal time
for Hg2+-induced MIP-2, KC and MCP-5 expression. The
suppressive effect of NAC was investigated in three different
experiments using the following protocols.
Pre-treatment. NAC was added to cells at 23 h
into the cell culture period and maintained for 1 h. Cells were
then washed with double the volume of culture medium to eliminate
the remaining NAC, and then incubated with medium containing
Hg2+ for 3 h. The incubation time of NAC was determined
based on the results of previously published study (11).
Co-treatment. Medium containing both
Hg2+ and NAC, that was prepared and kept at room
temperature for 30 min in advance, was added to cells at 24 h into
the cell culture time for 3 h.
Post-treatment. Hg2+ was added to
the culture medium after 24 h of cell culture, and then washed out
after 3-h incubation. Next, the cells were incubated with medium
containing NAC for 3 h. The cells were harvested at 30 h into the
cell culture time (for all experiments).
Determination of mRNA expression
To harvest the cells, β-mercaptoethanol and RLT
buffer from the RNeasy Plus Mini kit (Qiagen, Inc.) was used. The
total level of mRNA was analyzed as previously described (7,8,11,23,24). Total
RNA from the cells was extracted using an RNeasy Plus Mini kit
(Qiagen, Inc.). Then, total RNA (600 ng) was used to synthesize
cDNA using the QuantiTect Reverse Transcription kit (Qiagen, Inc.)
following the kit instructions using the ASTEC Program Temp Control
system (ASTEC Co., Ltd.) and kept at -80˚C until use. The entire
reverse transcription reaction was performed at 42˚C and
inactivated at 95˚C. Spectrophotometry was used to determine the
cDNA concentration (absorbance at 260 nm, 50 µg/ml; Eppendorf
BioPhotometer; Eppendorf). The reverse-transcribed samples were
then used for reverse transcription-quantitative(RT-q) PCR.The
expression levels of mRNA were quantified with Light Cycler Fast
Start DNA MasterPLUS SYBR-Green I (Roche Diagnostics), following
the manufacturer's instructions. Primers for specific cytokine
genes were obtained from the respective information base in NCBI,
using Primer 3 software (http://frodo.wi.mit.edu/primer3/), and the lengths of
target sites were 80-300 bp (Sigma-Aldrich; Merck KGaA).
The target genes were amplified using the PCR
method, as reported in previous studies (8,23,24). The total volume for one reaction was
20 µl, which consisted of cDNA, primers (0.5 µM) and master mix
solution (prepared using the aforementioned kit). The sequences of
each gene primer were as follows: β-actin,
5'-CGTGCGTGACATCAAAGAGAAG-3' forward and
5'-ATGCCACAGGATTCCATACCC-3' reverse; MIP-2,
5'-AAGTTTGCCTTGACCCTGAA-3' forward and 5'-AGG CACATCAGGTACGATCC-3'
reverse; KC, 5'-AGAACATC CAGAGCTTGAAGGTGTT-3' forward and
5'-GGACACCT TTTAGCATCTTTTGGACA-3' reverse; and MCP-5, 5'-TGG
ACCAGATGCGGTGAGC-3' forward, and 5'-GGCTGCTTG TGATTCTCCTGTAG-3'
reverse. The initial denaturation step was at 95˚C for 10 min,
followed by 45 amplification cycles (denaturation at 95˚C for 10
sec, annealing at 60˚C for 10 sec, and elongation at 72˚C for 15
sec).
The data for inter-assay variance (three independent
experiments) were analyzed using Light Cycler analysis software
version 4.1 (Roche Diagnostics Japan). β-actin gene was used as the
reference gene. This experiment used untreated cells harvested
after 24 h as a standard, and untreated cells harvested after 30 h
as a negative control. Relative gene expression was calculated
according to the 2-∆∆Cq method (25).
As a positive control for the relative gene
expression experiments, cells were incubated with LPS (3 mM) for
3-6 h and the LPS-induced MIP-2, KC and MCP-5 expression were
measured by reverse transcription-quantitative PCR.
Statistical analysis
Mean values and corresponding SEs were calculated
using STATA 14.0 software (StataCorp LP). The P-values for the
differences between two groups were calculated using the
Kruskal-Wallis test and adjusted with Holms method, while the
P-values for trends were calculated using the non-parametric trend
test. The significance level was indicated by P<0.05.
Results
Cytotoxicity of Hg2+ and
NAC
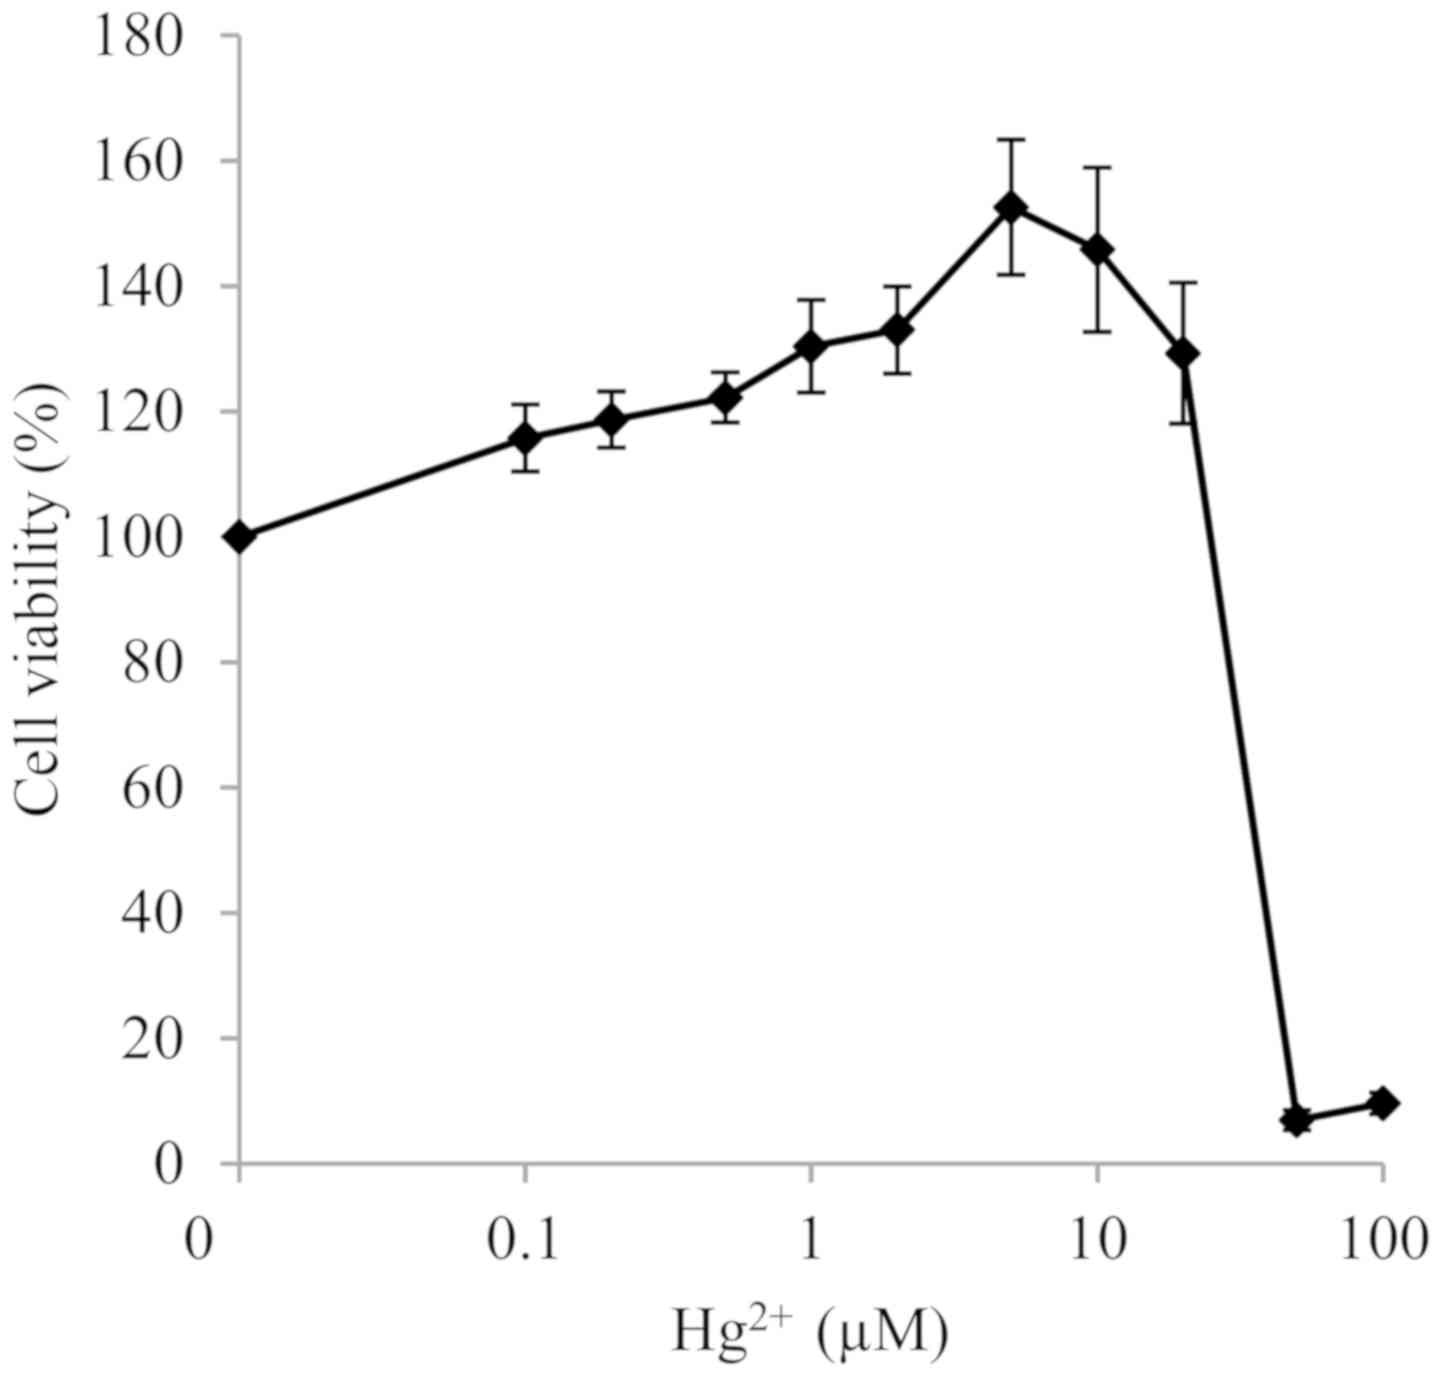
After RAW264.7 macrophages were incubated with
Hg2+ or NAC at different doses for 24 h, cytotoxicity
was determined. In our previous studies (7,8), the
expression of inflammatory cytokines was activated at
non-cytotoxic, but still relatively close to cytotoxic, doses of
MeHg. Since the maximum non-toxic dose of Hg2+is 20 µM
(Fig. 1), 10 and 20 µM doses, where
cell viability was kept ~100%, were selected for
Hg2+-induced cytokine experiments. NAC cytotoxicity
experiments showed no change in cell viability up to a dose of 100
mM (results not shown), and doses of 1 and 20 mM were used in
following experiments to examine its suppressive effect on
Hg2+-induced cytokine expression.
mRNA expression of MIP-2, KC and MCP-5
after Hg2+ treatment
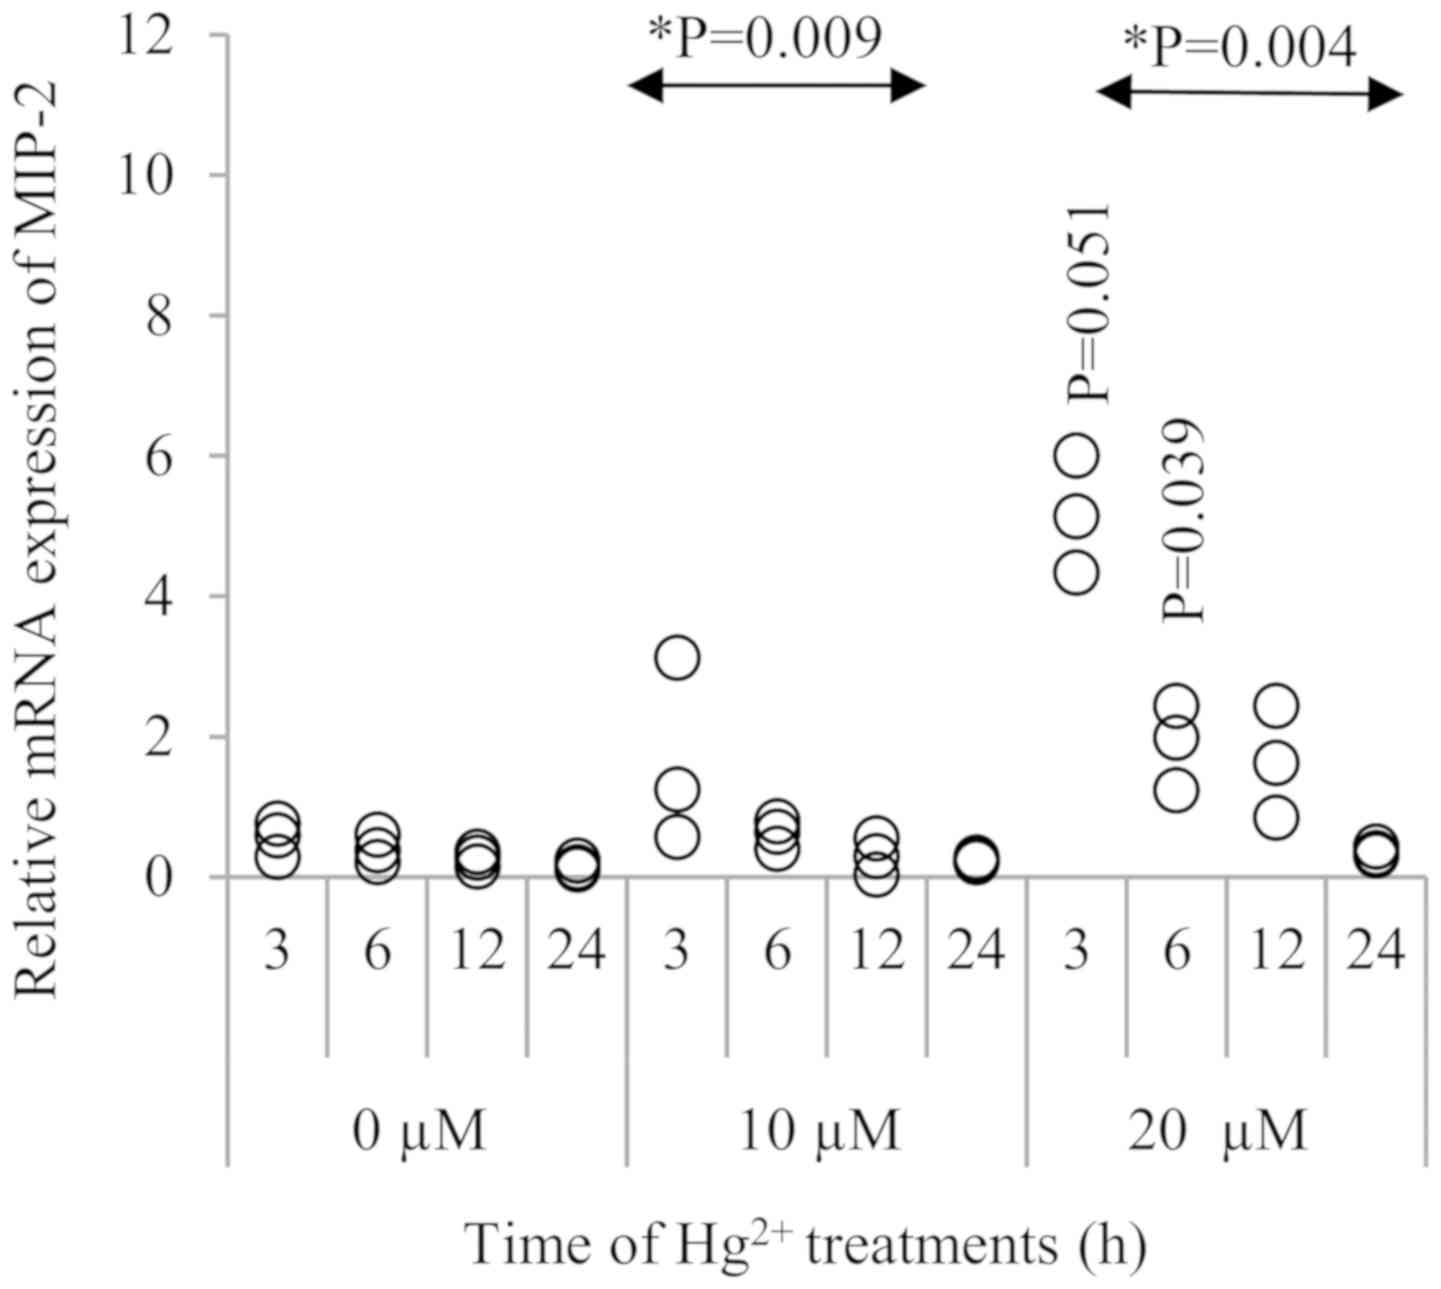
As shown in Fig. 2,
MIP-2 expression was significantly increased in the presence of 20
µM Hg2+ at 3 h (P=0.051) and 6 h (P=0.039),when compared
to the respective 0 and 10 µM Hg2+ groups. Although the
MIP-2 mRNA level was gradually decreased after 3 h, this
upregulation was observed up to 12 h after Hg2+
exposure. When comparing to the control (0 µM Hg2+)
groups at different treatment durations, there was a significant
time trend in MIP-2 expression when exposed to 10 and 20 µM of
Hg2+ (P=0.009 and 0.004, respectively).
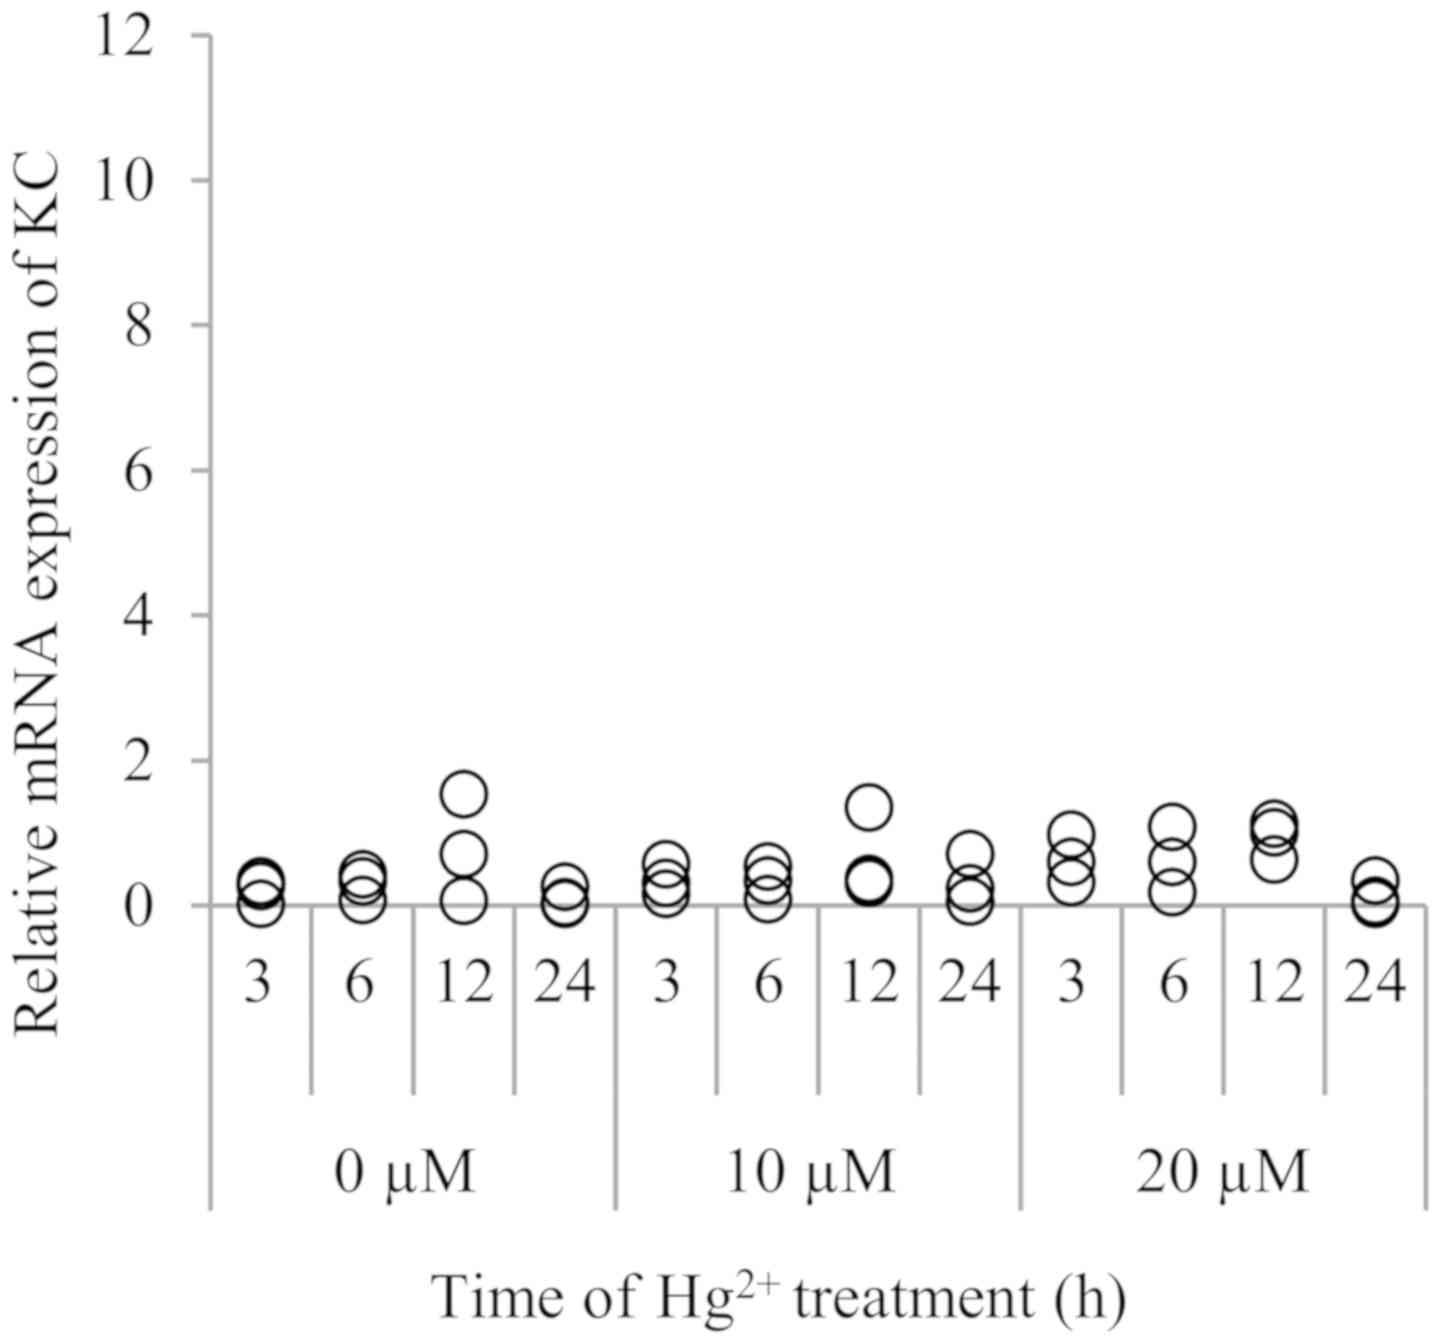
The expression of KC was not significantly
stimulated by Hg2+ at either 10 or 20 µM (Fig. 3).There was no significant time trend
observed.
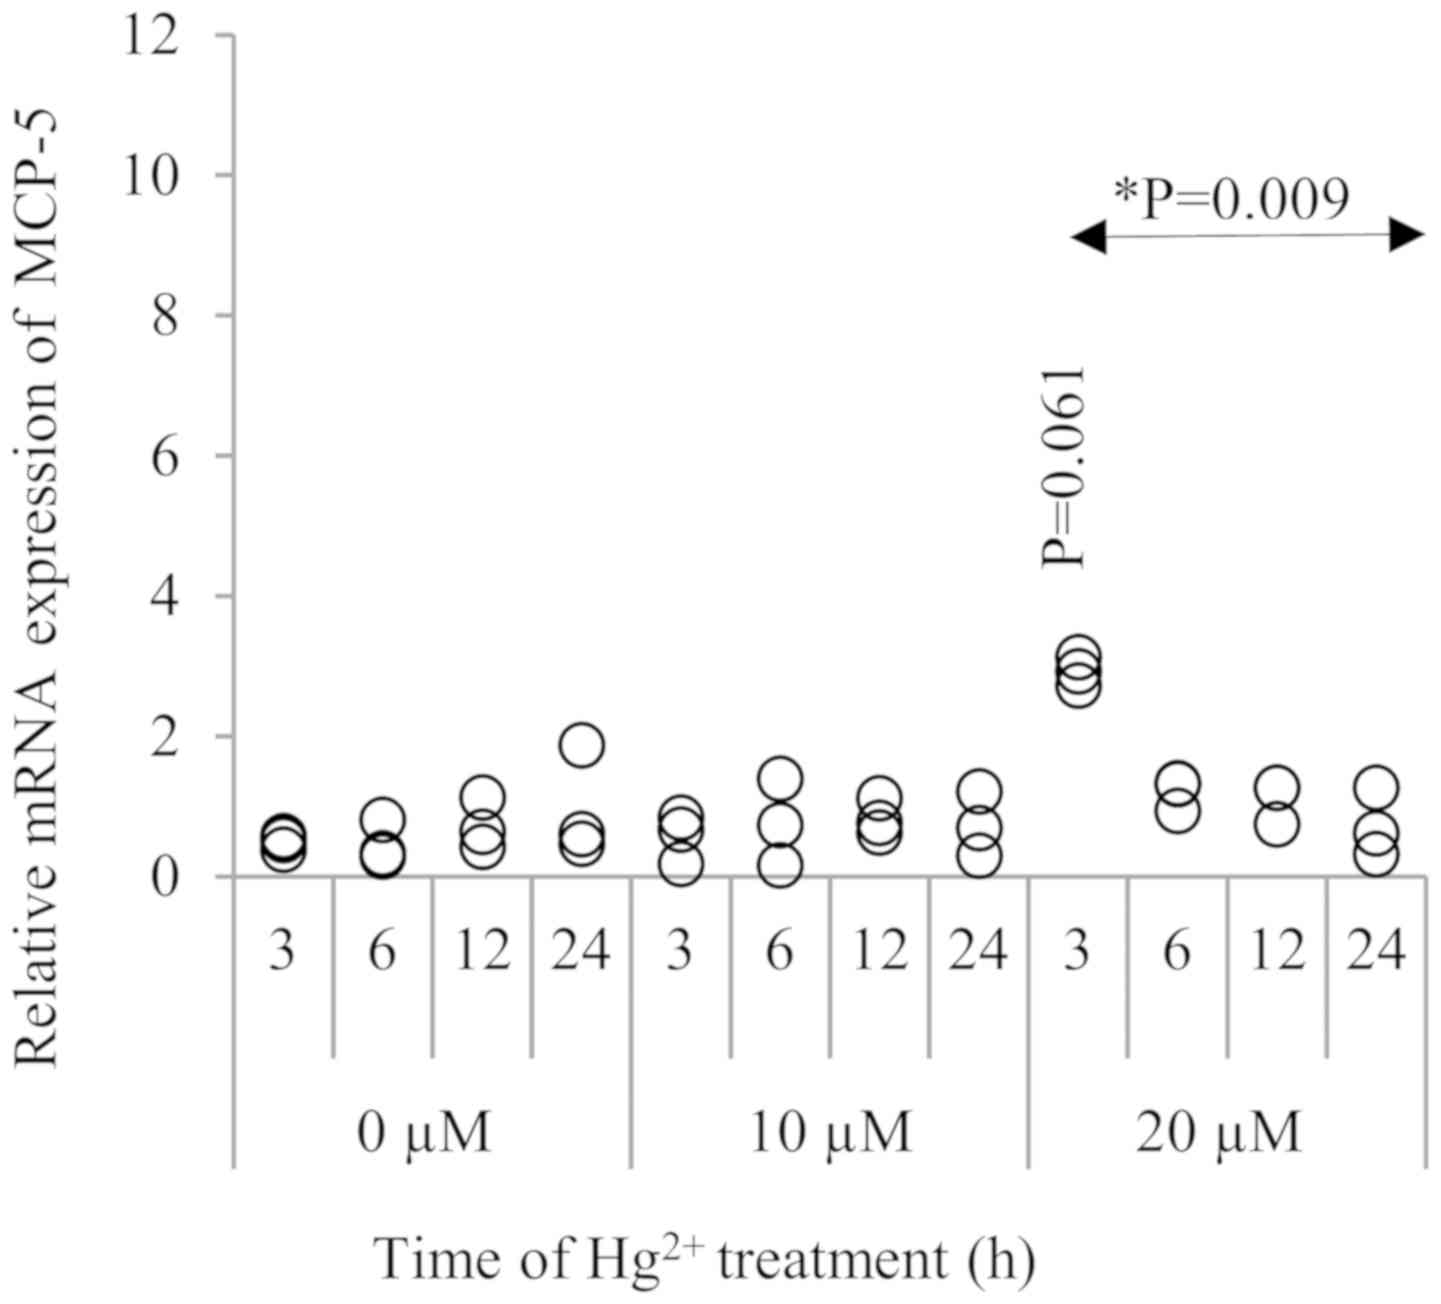
In Fig. 4, MCP-5 was
also upregulated significantly by treatment with 20 µM
Hg2+,and its peak was noted at 3 h after Hg2+
exposure (P=0.061). When comparing to the control (0 µM
Hg2+), although the treatment with 10 µM Hg2+
did not induce a significant increase in MCP-5 expression, there
was a significant time trend in MCP-5 expression at 20 µM
Hg2+ (P=0.009). To confirm the mRNA expression of these
cytokines, RAW264.7 macrophages were treated with 3 mM
lipopolysaccharide (LPS) as a positive control, and the
upregulation of KC, as well as MIP-2 and MCP-5, was observed after
3 h of incubation with LPS (Fig.
S1).
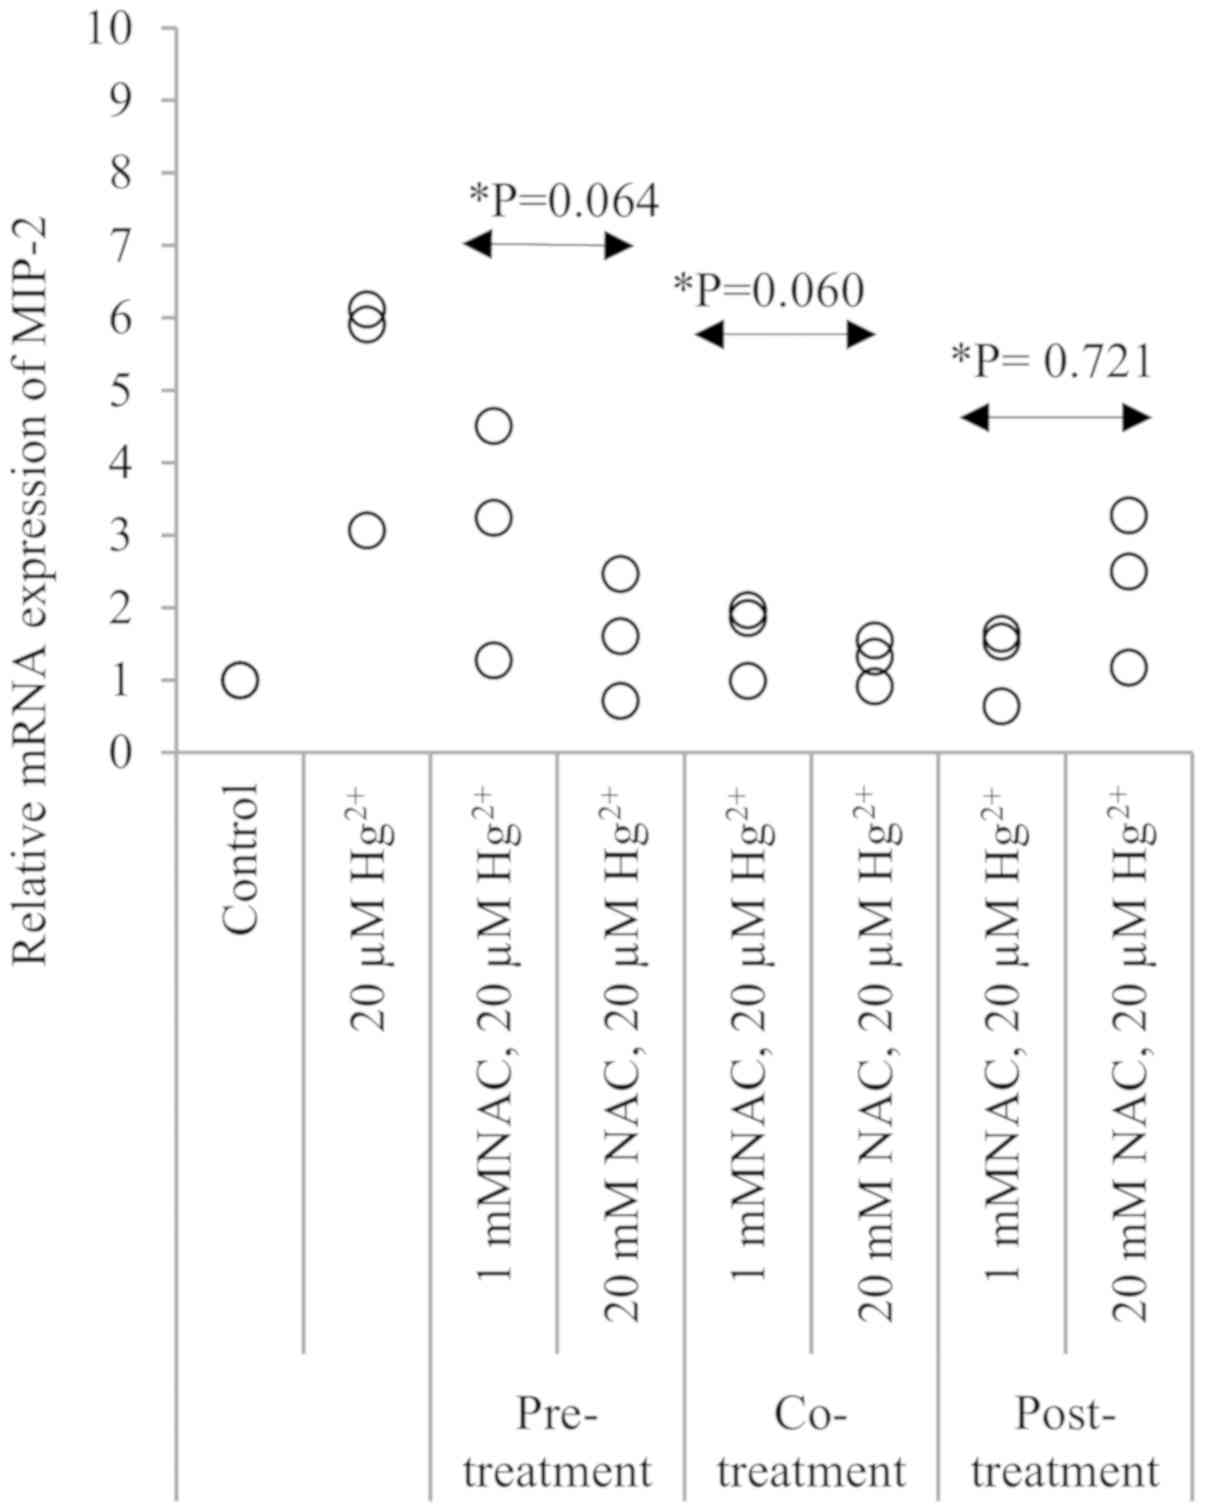
Suppressive effect of NAC on
Hg2+-induced MIP-2 expression
As MIP-2 showed the highest Hg2+-induced
expression among the three cytokines, the effects of NAC treatment
on Hg2+-induced MIP-2 mRNA expression were examined
(Fig. 5). NAC was added at different
timings in pre-, co- and post-treatment experiments, and NAC
treatment suppressed Hg2+-induced MIP-2 expression in
all protocols. In Fig. 5, a decrease
in the trend of MIP-2 expression was seen in the presence of NAC in
pre-treatment (P=0.064), co-treatment (P=0.060) and in
post-treatment (P=0.721). The concentration of 20 mM NAC did not
show a significant suppressive effect on MIP-2 expression in pre-,
co- and post-treatment (P=0.281); the comparison was between 1 mM
and 20 mM NAC-treated cells in all treatments with 20 µM
Hg2+-treated cells.
Discussion
To the best of our knowledge, the current study is
the first to report the distinct activation of MIP-2/KC and MCP-5
expression in macrophages following exposure to Hg2+. A
non-cytotoxic dose of Hg2+, 20 µM, induced the
upregulation of MIP-2 and MCP-5 mRNA expression, which peaked at 3
h after Hg2+ treatment. Conversely, this phenomenon was
not observed with KC expression, although it is a homolog of IL-8.
Similar results were previously found using non-cytotoxic levels of
MeHg exposure in RAW264.7 macrophages, showing distinct activation
of MIP-2 expression, but not of KC (11).
MIP-2 and KC have been reported to serve
complementary roles and functions (26). Tissue-specific and time-dependent
expression patterns of MIP-2 and KC also vary, indicating a
possible difference in their roles, such as in tissue-specific
neutrophil recruitment (27,28). MIP-2 expression was reported to be
more active than that of KC in leukocyte recruitment and
endothelial cell chemotaxis (29,30), as
well as in cyclophilin A-induced neutrophil migration (31). In mice, MIP-2 is 63% identical to
mouse KC, and the mouse MIP-2 is 60% identical to human CXCL2 and
CXCL1(32). Based upon the
similarities in their protein sequences, it is most likely that
mouse KC and MIP-2 are homologs of the human CXCL1 and CXCL2
chemokines, respectively. In mice, a chemokine with protein
sequence homology to IL-8 has not yet been identified, to the best
of our knowledge, hence it has been suggested that MIP-2 and KC in
mice may be functional homologs of human IL-8. Even though they are
functional homologs, these chemokines have different functions in
response to various stimuli. Therefore, Hg2+ may induce
MIP-2 and KC expression differently. For example, MIP-2 and KC
exhibit differential temporal patterns of expression in the skin of
mice following surgical injury (27).
These two chemokines are expressed by distinct cell types at
different times following injury. At 6 h after skin surgery, KC
expression occurs primarily via dermal fibroblasts and endothelial
cells, while MIP-2 production occurs later and is restricted to
infiltrating inflammatory leukocytes, including neutrophils and
monocytes. Similar specific patterns of chemokine expression in
different cell types has been shown in in vitro experiments
using isolated primary- and long-term-cultured cell types. Primary
dermal fibroblasts stimulated with IL-1α predominantly express KC
and very little MIP-2, and peritoneal exudate neutrophils also
produce MIP-2 and KC following stimulation (32). It is clear that various exogenous
stimuli can induce KC and MIP-2 expression, and the quantitative
ratio of that expression mainly depends on the cell type. This
previous study also confirmed that the selective expression of KC
over MIP-2 in endothelial cells is due to greater KC gene
transcription, and not alterations in the rate of mRNA decay. These
results demonstrated that CXC chemokines show different expression
patterns in different cell types, and that their expression varies
over time.
The concentration of Hg2+ used in the
present study is likely to be able to induce cytokine expression
in vivo as well, since an acute case of Minamata disease was
reported to lead to 4.6-24.8 µg/g (23-124 µM) T-Hg in the brain
(2). Non-cytotoxic doses of MeHg have
also increased the expression of IL-8 in the human U937 macrophage
cell line (8).
A significant trend in the activation of MCP-5
expression by a non-cytotoxic level of Hg2+ was also
observed in RAW264.7 macrophages. In our previous study, the
activation of MCP-5 expression was significantly induced by MeHg
exposure at non-cytotoxic doses (11), which indicated that MCP-5 expression
maybe an inflammatory marker for exposures to both MeHg and
Hg2+. It was observed that the expression of
inflammatory cytokines was activated at a non-cytotoxic dose, but
that the concentration used was still relatively close to a
cytotoxic dose of MeHg (7,8). In the present study, the activation of
MIP-2 and MCP-5 expression was observed at 20 µM Hg, indicating
that these inflammatory cytokines are expressed in response to a
non-cytotoxic dose, and thus may also be at cytotoxic doses of Hg
compounds. A limitation of the present study may be that the
reproducibility of the results was confirmed only via an
inter-assay method, and not by an intra-assay method using the same
RNA.
In order to suppress the micro-environmental
inflammatory response to Hg2+, further experiments using
NAC were conducted to reduce the release of MIP-2. NAC was able to
significantly suppress Hg2+-induced MIP-2 expression at
all treatment durations. In the pre-treatment protocol, the medium
containing NAC was washed out before adding the Hg2+; it
was hypothesized that the NAC would primarily function by raising
intracellular glutathione (GSH) levels rather than chelating
Hg2+. The medium containing Hg2+ and NAC for
co-treatment was prepared 30 min before the incubation with the
cells; therefore, the NAC may have equally acted as an antioxidant,
such as by raising intracellular GSH levels, and a chelating agent
for Hg2+. In the post-treatment experiment, the cells
were incubated with Hg2+ for 3 h and the
Hg2+was washed out before adding the NAC; therefore, the
NAC would primarily work by raising intracellular GSH levels rather
than chelating Hg2+. The results for the NAC treatments
indicated that NAC could suppress Hg2+-induced MIP-2
activation as both an antioxidant and as a chelating agent,
depending on the time of addition of NAC.
Activated macrophages promote brain recovery by
resolving local inflammation and releasing trophic factors.
Conversely, these cells may hinder tissue damage in the brain
(33). Infiltration of CD204-positive
macrophages was previously observed in the sciatic nerve of
MeHg-treated KK-Ay mice, suggesting that macrophages can also serve
an important role in the recovery of injured tissues in peripheral
nerves, and as a possible target in regenerating peripheral nerves
and controlling neuropathies (4).
Future studies to identify the specific role of activated MIP-2 and
MCP-5 expression after exposure to Hg2+, and the effects
of NAC in vivo, are warranted.
The present study showed that non-cytotoxic doses of
Hg2+ induced MIP-2 and MCP-5 expression in RAW264.7
macrophages, indicating the possible involvement of these cytokines
in the late stages of MeHg exposure. Among the functional homologs
of human IL-8, only MIP-2, but not KC, was demonstrated to be
upregulated in response to Hg2+ induced in murine
macrophages. The suppressive effects of NAC on
Hg2+-induced MIP-2 at different treatment times
indicated a possible anti-inflammatory effect of NAC, both
extracellular as a chelating agent, and intracellular as an
antioxidant.
Supplementary Material
Relative mRNA expression of MIP-2, KC
and MCP-5 at 3 and 6 h after LPS treatment. RAW264.7 macrophages
were treated for 3 and 6 h with 0.1 or 1 μg/ml LPS, or were
untreated. mRNA expression was analyzed by reverse
transcription-quantitative PCR. Values represent the mean ± SEM of
three experiments. LPS, lipopolysaccharide; MIP-2, C-X-C motif
chemokine 2; KC, platelet-derivedgrowth factor-inducible protein
KC; MCP-5, C-C motif chemokine 12.
Acknowledgements
The authors are grateful to Emeritus Professor
Suminori Akiba (Kagoshima University) for meaningful discussions.
We wish to thank Mr. Masahiro Ueda, Joint Research Laboratory of
Kagoshima University Graduate School of Medicine and Dental
Sciences, for providing their facilities.
Funding
The present study was supported by the Kodama
Memorial Fund for Medical Research, Japan.
Availability of data and materials
The datasets used and/or analyzed during the current
study are available from the corresponding author on reasonable
request.
Author's contributions
JD, MM, AN and MY conceived the concept, designed
the study and were responsible for the interpretation of results,
drafting and finalizing the manuscript. AN and CK were involved in
data analysis, interpretation of the results and manuscript
preparation. MT was involved in the interpretation of the results
and preparation of the manuscript. All authors read and approved
the final manuscript.
Ethics approval and consent to
participate
Not applicable.
Patient consent for publication
Not applicable.
Competing interests
The authors declare that they have no competing
interests.
References
|
1
|
National Research Council: Toxicological
Effects of Methylmercury. National Academy Press, Washington, DC,
pp221-232, 2000.
|
|
2
|
Okabe M and Takeuchi T: Distribution and
fate of mercury in tissue of human organs in Minamata disease.
Neurotoxicol. 74:1531–1537. 1980.
|
|
3
|
Yamamoto M, Yanagisawa R, Motomura E,
Nakamura M, Sakamoto M, Takeya M and Eto K: Increased methylmercury
toxicity related to obesity in diabetic KK-Ay mice. J Appl Toxicol.
34:914–923. 2014.PubMed/NCBI View
Article : Google Scholar
|
|
4
|
Yamamoto M, Motomura E, Yanagisawa R,
Hoang VA, Mogi M, Mori T, Nakamura M, Takeya M and Eto K:
Evaluation of neurobehavioral impairment in methylmercury-treated
KK-Ay mice by dynamic weight-bearing test. J Appl Toxicol.
39:221–230. 2019.PubMed/NCBI View
Article : Google Scholar
|
|
5
|
Whitney NP, Eidem TM, Peng H, Huang Y and
Zheng JC: Inflammation mediates varying effects in neurogenesis:
Relevance to the pathogenesis of brain injury and neurodegenerative
disorders. J Neurochem. 108:1343–1359. 2009.PubMed/NCBI View Article : Google Scholar
|
|
6
|
Hu X, Leak RK, Shi Y, Suenaga J, Gao Y,
Zheng P and Chen J: Microglial and macrophage polarization - New
prospects for brain repair. Nat Rev Neurol. 11:56–64.
2015.PubMed/NCBI View Article : Google Scholar
|
|
7
|
Muniroh M, Khan N, Koriyama C, Akiba S,
Vogel CF and Yamamoto M: Suppression of methylmercury-induced IL-6
and MCP-1 expressions by N-acetylcysteine in U-87MG human
astrocytoma cells. Life Sci. 134:16–21. 2015.PubMed/NCBI View Article : Google Scholar
|
|
8
|
Yamamoto M, Khan N, Muniroh M, Motomura E,
Yanagisawa R, Matsuyama T and Vogel CF: Activation of interleukin-6
and -8 expressions by methylmercury in human U937 macrophages
involves RelA and p50. J Appl Toxicol. 37:611–620. 2017.PubMed/NCBI View
Article : Google Scholar
|
|
9
|
Hwang GW, Lee JY, Ryoke K, Matsuyama F,
Kim JM, Takahashi T and Naganuma A: Gene expression profiling using
DNA microarray analysis of the cerebellum of mice treated with
methylmercury. J Toxicol Sci. 36:389–391. 2011.PubMed/NCBI View Article : Google Scholar
|
|
10
|
Godefroy D, Gosselin RD, Yasutake A,
Fujimura M, Combadière C, Maury-Brachet R, Laclau M, Rakwal R,
Melik-Parsadaniantz S, Bourdineaud JP, et al: The chemokine CCL2
protects against methylmercury neurotoxicity. Toxicol Sci.
125:209–218. 2012.PubMed/NCBI View Article : Google Scholar
|
|
11
|
David J, Nandakumar A, Muniroh M, Akiba S,
Yamamoto M and Koriyama C: Suppression of methylmercury-induced
MIP-2 expression by N-acetyl-L-cysteine in murine RAW264.7
macrophage cell line. Eur J Med Res. 22(45)2017.PubMed/NCBI View Article : Google Scholar
|
|
12
|
Takeuchi T, Eto K and Tokunaga H: Mercury
level and histochemical distribution in a human brain with Minamata
disease following a long-term clinical course of twenty-six years.
Neurotoxicology. 10:651–657. 1989.PubMed/NCBI
|
|
13
|
Suda I, Totoki S, Uchida T and Takahashi
H: Degradation of methyl and ethyl mercury into inorganic mercury
by various phagocytic cells. Arch Toxicol. 66:40–44.
1992.PubMed/NCBI View Article : Google Scholar
|
|
14
|
Suda I, Suda M and Hirayama K: Phagocytic
cells as a contributor to in vivo degradation of alkyl mercury.
Bull Environ Contam Toxicol. 51:394–400. 1993.PubMed/NCBI View Article : Google Scholar
|
|
15
|
Kim SH, Johnson VJ and Sharma RP: Mercury
inhibits nitric oxide production but activates proinflammatory
cytokine expression in murine macrophage: Differential modulation
of NF-kappaB and p38 MAPK signaling pathways. Nitric Oxide.
7:67–74. 2002.PubMed/NCBI View Article : Google Scholar
|
|
16
|
Gardner RM, Nyland JF, Evans SL, Wang SB,
Doyle KM, Crainiceanu CM and Silbergeld EK: Mercury induces an
unopposed inflammatory response in human peripheral blood
mononuclear cells in vitro. Environ Health Perspect. 117:1932–1938.
2009.PubMed/NCBI View Article : Google Scholar
|
|
17
|
Wu Q, Li WK, Zhou ZP, Li YY, Xiong TW, Du
YZ, Wei LX and Liu J: The Tibetan medicine Zuotai differs from
HgCl2 and MeHg in producing liver injury in mice. Regul Toxicol
Pharmacol. 78:1–7. 2016.PubMed/NCBI View Article : Google Scholar
|
|
18
|
Bavarsad Shahripour R, Harrigan MR and
Alexandrov AV: N-acetylcysteine (NAC) in neurological disorders:
Mechanisms of action and therapeutic opportunities. Brain Behav.
4:108–122. 2014.PubMed/NCBI View
Article : Google Scholar
|
|
19
|
Samuni Y, Goldstein S, Dean OM and Berk M:
The chemistry and biological activities of N-acetylcysteine.
Biochim Biophys Acta. 1830:4117–4129. 2013.PubMed/NCBI View Article : Google Scholar
|
|
20
|
Aremu DA, Madejczyk MS and Ballatori N:
N-acetylcysteine as a potential antidote and biomonitoring agent of
methylmercury exposure. Environ Health Perspect. 116:26–31.
2008.PubMed/NCBI View Article : Google Scholar
|
|
21
|
Joshi D, Mittal DK, Shukla S, Srivastav AK
and Srivastav SK: N-acetyl cysteine and selenium protects mercuric
chloride-induced oxidative stress and antioxidant defense system in
liver and kidney of rats: A histopathological approach. J Trace
Elem Med Biol. 28:218–226. 2014.PubMed/NCBI View Article : Google Scholar
|
|
22
|
Falluel-Morel A, Lin L, Sokolowski K,
McCandlish E, Buckley B and DiCicco-Bloom E: N-acetyl cysteine
treatment reduces mercury-induced neurotoxicity in the developing
rat hippocampus. J Neurosci Res. 90:743–750. 2012.PubMed/NCBI View Article : Google Scholar
|
|
23
|
Yamamoto M, Hirano S, Vogel CF, Cui X and
Matsumura F: Selective activation of NF-kappaB and E2F by low
concentration of arsenite in U937 human monocytic leukemia cells. J
Biochem Mol Toxicol. 22:136–146. 2008.PubMed/NCBI View Article : Google Scholar
|
|
24
|
Yamamoto M, Takeya M, Ikeshima-Kataoka H,
Yasui M, Kawasaki Y, Shiraishi M, Majima E, Shiraishi S, Uezono Y,
Sasaki M, et al: Increased expression of aquaporin-4 with
methylmercury exposure in the brain of the common marmoset. J
Toxicol Sci. 37:749–763. 2012.PubMed/NCBI View Article : Google Scholar
|
|
25
|
Livak K and Schmittgen TD: Analysis of
relative gene expression data using real-time quantitative PCR and
the 2(-Delta Delta C(T)) method. Methods. 25:402–408.
2001.PubMed/NCBI View Article : Google Scholar
|
|
26
|
Tanimoto N, Terasawa M, Nakamura M, Kegai
D, Aoshima N, Kobayashi Y and Nagata K: Involvement of KC, MIP-2,
and MCP-1 in leukocyte infiltration following injection of necrotic
cells into the peritoneal cavity. Biochem Biophys Res Commun.
361:533–536. 2007.PubMed/NCBI View Article : Google Scholar
|
|
27
|
Endlich B, Armstrong D, Brodsky J, Novotny
M and Hamilton TA: Distinct temporal patterns of
macrophage-inflammatory protein-2 and KC chemokine gene expression
in surgical injury. J Immunol. 168:3586–3594. 2002.PubMed/NCBI View Article : Google Scholar
|
|
28
|
Rovai LE, Herschman HR and Smith JB: The
murine neutrophil-chemoattractant chemokines LIX, KC, and MIP-2
have distinct induction kinetics, tissue distributions, and
tissue-specific sensitivities to glucocorticoid regulation in
endotoxemia. J Leukoc Biol. 64:494–502. 1998.PubMed/NCBI View Article : Google Scholar
|
|
29
|
Lee J, Cacalano G, Camerato T, Toy K,
Moore MW and Wood WI: Chemokine binding and activities mediated by
the mouse IL-8 receptor. J Immunol. 155:2158–2164. 1995.PubMed/NCBI
|
|
30
|
Zwijnenburg PJ, van der Poll T, Florquin
S, Roord JJ and Van Furth AM: IL-1 receptor type 1 gene-deficient
mice demonstrate an impaired host defense against pneumococcal
meningitis. J Immunol. 170:4724–4730. 2003.PubMed/NCBI View Article : Google Scholar
|
|
31
|
Heine SJ, Olive D, Gao JL, Murphy PM,
Bukrinsky MI and Constant SL: Cyclophilin A cooperates with MIP-2
to augment neutrophil migration. J Inflamm Res. 4:93–104.
2011.PubMed/NCBI View Article : Google Scholar
|
|
32
|
Armstrong DA, Major JA, Chudyk A and
Hamilton TA: Neutrophil chemoattractant genes KC and MIP-2 are
expressed in different cell populations at sites of surgical
injury. J Leukoc Biol. 75:641–648. 2004.PubMed/NCBI View Article : Google Scholar
|
|
33
|
Hanisch UK and Kettenmann H: Microglia:
Active sensor and versatile effector cells in the normal and
pathologic brain. Nat Neurosci. 10:1387–1394. 2007.PubMed/NCBI View Article : Google Scholar
|