Introduction
Refractory ascites represents a particularly severe
manifestation of decompensated liver cirrhosis, often indicating a
terminal disease phase marked by a diminished quality of life,
frequent hospital admissions and a median transplant-free survival
of only 6-12 months (1,2). Despite therapeutic advancements such
as diuretic regimens, large-volume paracentesis, albumin
supplementation and the use of transjugular intrahepatic
portosystemic shunt (TIPS), achieving sustained symptomatic relief
remains clinically challenging (3,4).
Notably, accumulating evidence suggests that metabolic
dysregulation persists even after TIPS, continuing to exert adverse
effects on patient outcomes (5,6). In
light of the limited therapeutic efficacy and marked disease burden
associated with refractory ascites, there is a growing need to
elucidate its underlying pathophysiological mechanisms.
Mounting research underscores the critical interplay
between the gut and liver in the pathogenesis of cirrhosis
(7). The intestinal microbiome,
comprising a complex, adaptable microbial ecosystem, has emerged as
a key regulator of hepatic homeostasis via its metabolic
byproducts, immunomodulatory actions and contribution to intestinal
barrier integrity (8,9). In cirrhosis, microbial dysbiosis,
characterized by reduced species richness, overrepresentation of
opportunistic taxa and compromised mucosal defense, is increasingly
recognized as a driving factor in hepatic inflammation, bacterial
translocation and secondary complications such as hepatic
encephalopathy and spontaneous bacterial peritonitis (10,11).
More recently, shifts in ascitic bacterial composition have been
shown to correlate with disease severity and clinical prognosis,
suggesting that refractory ascites may be associated with a
distinct microbial signature (1,12,13).
However, integrative studies specifically addressing microbiota and
metabolic alterations in this subgroup remain sparse.
Advances in high-throughput methodologies now allow
for comprehensive profiling of the gut ecosystem and its metabolic
outputs (14). The application of
16S rRNA sequencing in tandem with gas chromatography-mass
spectrometry (GC-MS)-based untargeted metabolomics provides a
multidimensional view of host-microbe interactions. A previous
investigation into ascitic fluid metabolomics have highlighted
notable disruptions in biochemical pathways, particularly those
involved in amino acid and lipid metabolism, underscoring the
metabolic complexity associated with advanced cirrhosis (15). The integration of microbial and
metabolic profiling offers a promising approach to elucidate the
pathophysiological mechanisms underlying refractory ascites.
In the present study, an integrated analysis of the
intestinal microbiota and fecal metabolome of patients with
cirrhosis-related refractory ascites was performed. Through
simultaneous 16S rRNA sequencing and GC-MS-based metabolomics, the
present study aimed to characterize disease-specific microbial
communities and metabolic alterations. This approach may provide
novel insights into the gut-liver axis disturbances contributing to
disease progression and inform the development of biomarker-driven
diagnostic or therapeutic strategies.
Materials and methods
Study design and participants
Between July 2023 and July 2024, a total of 140
participants were enrolled from the Department of Hepatology at
Qiannan People's Hospital (Duyun, China), comprising 70 individuals
clinically diagnosed with decompensated cirrhosis accompanied by
refractory ascites (OB group) and 70 healthy control subjects (NC
group) with comparable age and sex distribution. The age and sex
distributions were as follows: in the OB group, there were 47 men
and 23 women with a mean age of 59.36±10.81 years, while in the NC
group, there were 24 men and 46 women with a mean age of 57.42±9.65
years. The eligible age range for inclusion was 40 to 75 years.
Diagnosis of refractory ascites was established in accordance with
the diagnostic criteria specified in the 2017 guidelines published
by the Chinese Society of Hepatology (16). Cirrhosis in participants was
diagnosed through a combination of clinical evaluations and imaging
techniques, including ultrasound, CT scans and MRI. Liver biopsy
was performed when necessary for confirmation, based on clinical
judgment.
The NC group had no prior history of liver disease,
gastrointestinal disorders or other conditions that could
potentially influence the gut microbiota. Additionally, this group
was not affected by chronic conditions such as hypertension,
diabetes, cardiovascular issues or any ongoing inflammatory
diseases. The cause of cirrhosis in participants from the OB group
was established through a combination of clinical evaluation and
laboratory assessments, with common underlying causes being viral
hepatitis (such as hepatitis B or C virus) alcohol-related liver
disease, and non-alcoholic fatty liver disease. Participants in
each group were excluded if they had a history of cancer, recent
abdominal surgery (particularly procedures related to the liver),
uncontrolled infections or severe organ failure. Additional
exclusion criteria included cachexia, recent gastrointestinal
infections (within the previous month), pregnancy, lactation or the
use of antibiotics, corticosteroids or probiotics within 2 weeks
before enrollment.
The sample size was determined based on previous
studies (17,18) with similar patient cohorts and a
power analysis was conducted to ensure sufficient statistical power
(80%) with a significance level of P<0.05 (19,20).
Participants were allocated to either the OB or NC group based on
predefined inclusion and exclusion criteria. The OB group included
patients with confirmed cirrhosis and refractory ascites, diagnosed
through clinical evaluation, imaging studies and ascitic fluid
analysis. The NC group consisted of individuals without liver
disease or other chronic gastrointestinal or systemic conditions
and with routine laboratory test results within the normal limits.
No randomization was performed for the group assignment, as this
was a cohort study, but matching for age and sex between the two
groups was performed. Renal function was evaluated in all OB group
participants by measuring serum creatinine and calculating the
glomerular filtration rate (GFR) to rule out the possibility of
hepatorenal syndrome (HRS). In addition, all participants in the OB
group were evaluated for the presence of hepatic encephalopathy
using clinical assessment based on the West Haven criteria
(21).
Upon recruitment, comprehensive dietary and
lifestyle information from the previous 1 to 3 months was obtained
from each subject. Dietary information was collected using a food
frequency questionnaire, which asked participants about their daily
food intake frequency over the past month. Lifestyle factors such
as physical activity, smoking, alcohol consumption and sleep habits
were assessed using self-reported surveys. These surveys covered
the lifestyle of the participants in the 1 to 3 months prior to the
study to account for any potential confounding factors. In the OB
group, all participants underwent endoscopic evaluation to detect
esophageal varices and signs of gastric bleeding, common
complications in cirrhosis. Ethical approval was granted by the
institutional review board of The People's Hospital of Qiannan
(grant no. 2022-qnzy-18), and written informed consent was obtained
from all participants prior to sample collection and data
acquisition.
During the study period, no patients in the OB group
experienced death directly attributable to the condition.
Additionally, none of the OB group patients underwent TIPS or liver
transplantation during the course of the study. All OB group
patients underwent diagnostic paracentesis to determine the cause
of ascites, with ascitic fluid analysis performed to assess cell
count, protein concentration and albumin gradient, which was
performed in accordance with the diagnostic criteria for refractory
ascites as outlined in the practice guidelines by the American
Association for the Study of Liver Diseases (22).
Assessment of clinical parameters
Liver function tests, including alanine
aminotransferase (ALT), aspartate aminotransferase (AST), total
bilirubin and albumin, were measured following standard clinical
protocols. Prothrombin time (PT) and the international normalized
ratio (INR) were assessed using coagulometric methods. To evaluate
renal function, serum creatinine levels were determined, while urea
nitrogen was measured with routine biochemical techniques. Sodium
and potassium concentrations were quantified using an automated
electrolyte analyzer. The GFR was estimated using the
Cockcroft-Gault formula based on serum creatinine levels (23).
Fecal sample collection and
storage
Fresh fecal samples were collected from each
participant, immediately snap-frozen in liquid nitrogen and then
stored at -80˚C until further processing. Each sample was divided
into aliquots for microbiome and metabolomic analysis, ensuring
consistency and reducing freeze-thaw cycles.
Microbial DNA extraction and 16S rRNA
sequencing
Genomic DNA was extracted from 200 mg of fecal
material using the QIAamp Fast DNA Stool Mini Kit (Qiagen GmbH;
cat. no. 51604), following the manufacturer's protocol. DNA
integrity and concentration were evaluated using 1% agarose gel
electrophoresis and a NanoDrop 2000 spectrophotometer. The V3-V4
hypervariable regions of the bacterial 16S rRNA gene were amplified
using the primers 341F (5'-CCTACGGGNGGCWGCAG-3') and 806R
(5'-GGACTACHVGGGTATCTAAT-3'), with an expected product length of
~466 bp. Amplified PCR products were purified with QIAquick PCR
Purification Kit (Qiagen GmbH; cat. no. 28104) and quantified using
a Qubit 3.0 fluorometer. Sequencing libraries were constructed
using the TruSeq DNA PCR-Free Kit (Illumina, Inc; cat. no.
20015962). The final library concentration was quantified by qPCR
and loaded at a final concentration of 12.5 nM for sequencing on
the Illumina HiSeq 2500 platform. Raw reads were processed by
quality filtering and paired-end merging using FLASH (v1.2.11;
https://ccb.jhu.edu/software/FLASH/),
followed by clustering into operational taxonomic units (OTUs) at
97% similarity using USEARCH (v1.0.667; https://www.drive5.com/usearch/). Taxonomic annotation
was conducted using the Greengenes database (v13_8; https://greengenes.secondgenome.com) with a
minimum confidence threshold of 0.6. α and β diversity indices
(such as Chao1, Shannon and Simpson) were calculated using
Quantitative Insights Into Microbial Ecology (QIIME; v1.9.1;
http://qiime.org/) and MOTHUR (v1.45.3; https://mothur.org/). Principal coordinate analysis
(PCoA), Bray-Curtis dissimilarity and Analysis of Similarities
(ANOSIM) were performed in R (v4.3.1; https://www.r-project.org/). Functional predictions of
microbial communities were generated using PICRUSt2 (v2.5.0;
https://github.com/picrust/picrust2),
Tax4Fun2 (v1.1.5; https://github.com/bwemheu/Tax4Fun2) and BugBase
(v1.0.0; https://github.com/knights-lab/BugBase) to assess
pathway involvement and phenotypic traits.
Metabolite extraction and GC-MS
profiling
Fecal samples were allowed to thaw at ambient
temperature before ~20 mg of each sample was transferred into a
sterile 2 ml microcentrifuge tube containing 400 µl of 70% methanol
with pre-added internal standards (succinic acid-D4,
cat. no. 571687; L-valine-D8, cat. no. 486927;
Sigma-Aldrich; Merck KGaA). The mixture was vortexed for 3 min to
ensure adequate dispersion and then subjected to ultrasonic
extraction at a frequency of 40 kHz in an ice-water bath for 10
min. After sonication, the suspension was incubated at -20˚C for 30
min to precipitate proteins and other particulates. The sample was
centrifuged at 13,000 x g for 10 min at 4˚C, and 300 µl of the
resulting supernatant was transferred to a new tube. A second
centrifugation at 13,000 x g for 3 min was performed, after which
200 µl of the clarified supernatant was collected for downstream
analysis. Untargeted metabolomic analysis was carried out using a
GC-MS system (TripleTOF 6600+; SCIEX) equipped with a Waters T3
reverse-phase column (2.1x100 mm, 1.8 µm particle size).
Chromatographic separation was achieved using a binary solvent
system composed of 0.1% formic acid in water (mobile phase A) and
0.1% formic acid in acetonitrile (mobile phase B). The gradient
program was as follows: 0 min, 95% A; 2 min, 80% A; 5 min, 40% A; 6
min, 1% A; 7.5 min, 1% A; 7.6 min, 95% A; and 10 min, 95% A. The
flow rate was set at 0.4 ml/min and the injection volume was 4 µl.
The column was maintained at a constant temperature of 40˚C. Mass
spectrometric data were acquired in both positive and negative
electrospray ionization (ESI) modes under an information-dependent
acquisition method using Analyst TF 1.7.1 software (SCIEX).
Ionization parameters were as follows: Ion source voltage of +5,000
V (ESI+) and -4,000 V (ESI-), source temperatures of 550˚C and
450˚C for positive and negative modes, respectively, nebulizer gas
at 50 psi, auxiliary heating gas at 60 psi, curtain gas at 35 psi
and a declustering potential of ±60 V. Collision energies were set
at ±10 V for MS1 and ±30 V for MS2, with a collision energy spread
of 15 V. Each mode was acquired over a total runtime of 10 min. The
present study employed an untargeted metabolomics approach and data
were acquired in full-scan mode. Metabolite identification was
based on matching retention times and mass spectra with those in
the NIST and Fiehn libraries (see below).
Metabolomic data processing
Raw data obtained from GC-MS analysis were initially
processed using ChromaTOF software (v.4.72; LECO Corporation) for
peak detection, deconvolution and retention time alignment.
Baseline correction and noise filtering were applied to enhance
signal clarity and ensure consistent feature extraction. Metabolic
features with >50% missing values across all samples were
excluded from further analysis. The remaining missing values were
estimated using a k-nearest neighbor algorithm to maintain data
completeness without compromising structure. To account for
instrument drift and technical variability, total ion current
normalization was applied across all chromatograms. Compound
identification was performed by matching deconvoluted spectra
against commercial reference libraries, such as NIST (https://www.nist.gov/srd/nist-standard-reference-database-1a)
and FiehnLib (https://fiehnlab.ucdavis.edu/projects/fiehnlib), using
a similarity threshold of ≥80%. Metabolite identities were further
verified through manual inspection of fragmentation patterns and
retention indices. Only compounds consistently detected in the
quality control samples with a coefficient of variation <30%
were retained for downstream statistical analysis. All
post-processing, normalization and compound filtering, as well as
the subsequent multivariate and univariate analyses, were performed
in MetaboAnalyst 5.0 (https://www.metaboanalyst.ca). Data transformation and
scaling were applied within the platform prior to these statistical
analyses. The diagnostic efficiency of differential metabolites was
evaluated by constructing receiver operating characteristic (ROC)
curves in R (v.4.3.0) with the pROC package, and the area under the
curve (AUC) was calculated to quantify their discriminative
ability.
Functional enrichment analysis
Metabolites retained after annotation and filtering
were mapped to reference pathways based on the Kyoto Encyclopedia
of Genes and Genomes (KEGG) compound database. Functional
enrichment analysis was conducted using the KEGG Pathway platform
(https://www.genome.jp/kegg/), aiming to
identify significantly perturbed metabolic routes across
experimental conditions. Enrichment significance was evaluated
based on the hypergeometric test, with a false discovery rate
cut-off of <0.05 used to define significantly enriched pathways.
Pathway coverage and biological relevance were also considered in
the final interpretation. In addition, associations between key
metabolites and human diseases were explored using the Human
Metabolome Database (HMDB; https://hmdb.ca/).
Statistical analysis
Statistical procedures were used to compare
microbial and metabolomic characteristics between groups and to
assess their relationships with clinical variables. For microbiome
data, differences in α-diversity were evaluated using either
parametric or non-parametric tests, selected according to the
distribution of the data with unpaired Student's t-test applied to
normally distributed data and the Wilcoxon rank-sum test used for
non-normally distributed data. For examining individual metabolite
differences in the metabolomic data, appropriate univariate tests
were used depending on data distribution, including unpaired
Student's t-test or the Wilcoxon rank-sum test. Only metabolites
that met the predefined criteria for statistical significance were
included in subsequent interpretation. Associations between
refractory ascites and clinical indicators were examined using
Pearson correlation analysis. GraphPad Prism (version 9.5.1;
Dotmatics) was used for these statistical analyses. P<0.05 was
considered to indicate a statistically significant difference.
Results
Patients in the OB group have reduced
microbial richness and diversity
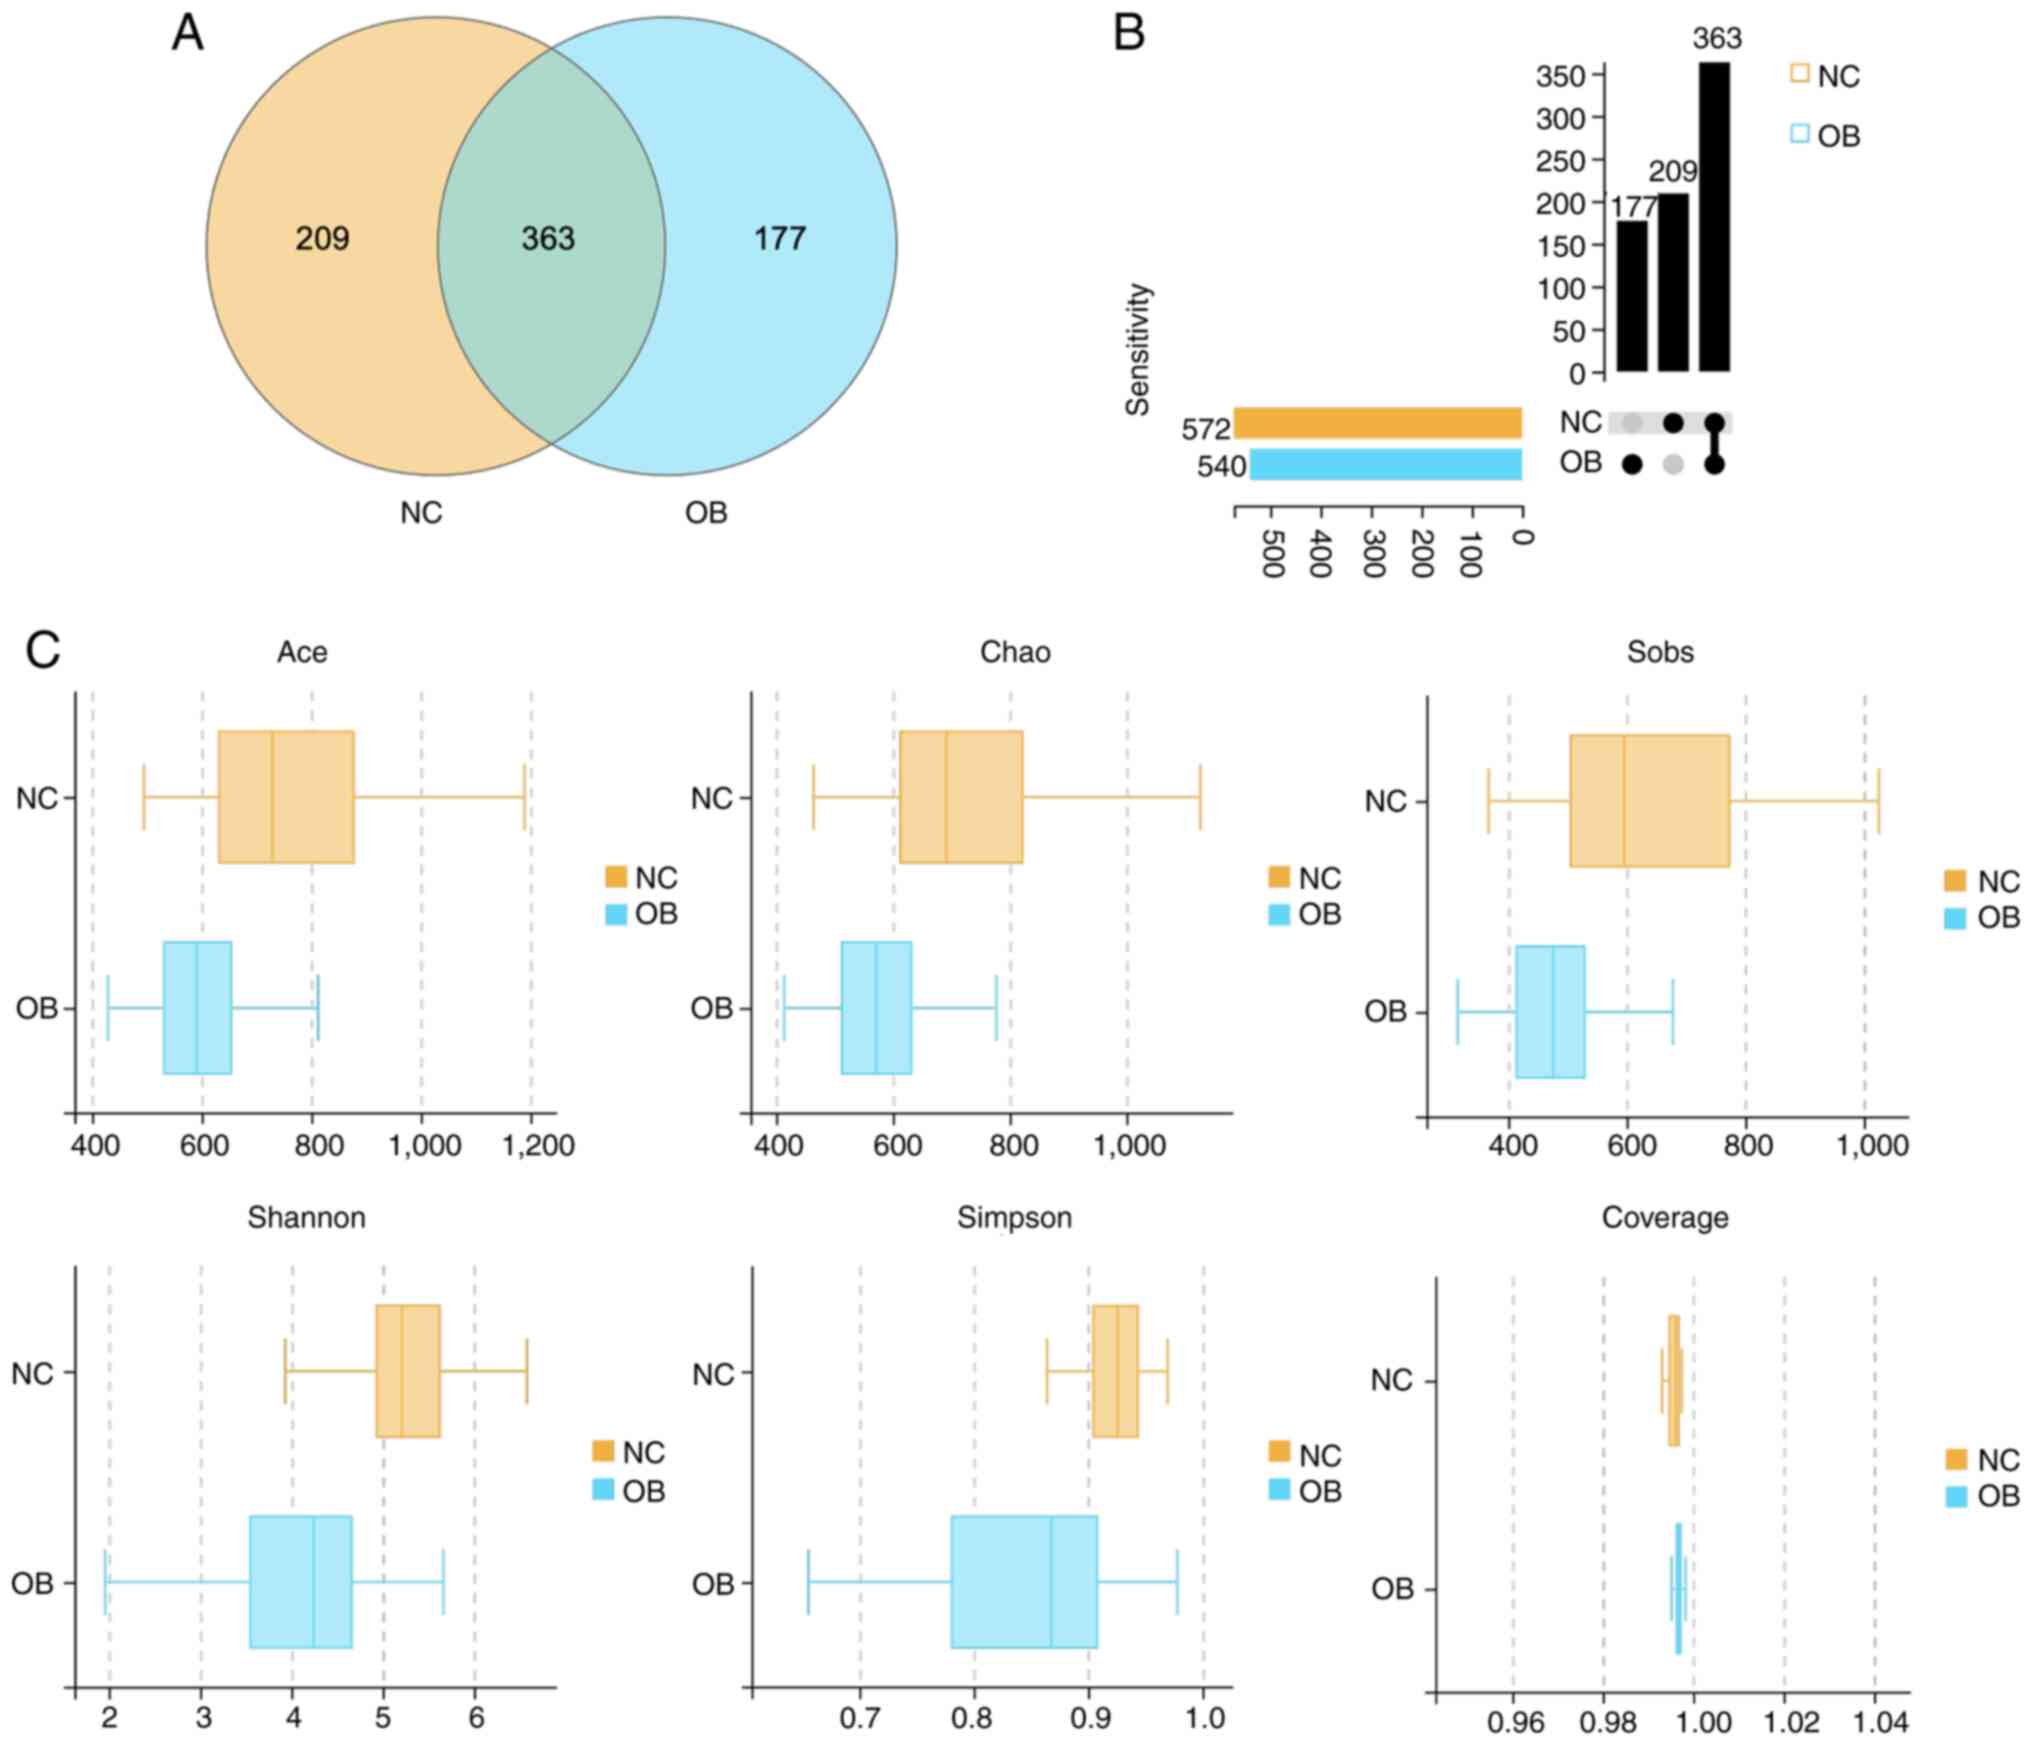
A total of 749 OTUs were obtained following rigorous
quality filtration and sequence clustering of 16S rRNA gene reads.
Among them, 572 OTUs were identified in the NC group and 540 in the
OB group, with 363 OTUs shared across both cohorts. The Venn
diagram illustrates the distribution of overlapping and
group-specific OTUs (Fig. 1A). To
further characterize the pattern of taxa presence and
co-occurrence, an UpSet plot was constructed. The plot provided a
more granular view of intersection sets and subgroup relationships
(Fig. 1B). This visualization
offered an intuitive overview of OTU overlap and structural
complexity between the groups. To assess within-sample microbial
diversity, α diversity indices were calculated and compared between
the groups. As shown in Fig. 1C,
richness estimators, including Ace, Chao1 and Sobs, were
significantly lower in the OB group than in the NC group
(P<0.05), indicating a marked reduction in microbial richness.
Similarly, Shannon and Simpson indices were decreased in the OB
group, reflecting diminished community evenness and overall
diversity compared with the NC group. Notably, the Coverage index
approached 1 in both groups, confirming sufficient sequencing depth
and reliable representation of microbial communities.
Additionally, clinical parameters of the NC and OB
groups were analyzed. The results indicated that in the OB group,
liver function markers (ALT, AST and total bilirubin) were higher,
albumin was lower, coagulation markers (prothrombin time and INR)
were prolonged, creatinine levels were elevated and electrolyte
concentrations (sodium and potassium) were lower. No significant
change was observed in urea nitrogen levels (Table I). These findings reflected a
decline in microbial richness and diversity in individuals with
refractory ascites, highlighting notable ecological disturbance
associated with cirrhosis.
 | Table IClinical parameters comparisons
between the OB and NC groups. |
Table I
Clinical parameters comparisons
between the OB and NC groups.
| Clinical
parameter | NC group
(n=70) | OB group
(n=70) | P-value |
|---|
| Sex,
male/female | 24/46 | 31/39 | 0.84 |
| Liver function
tests | | | |
|
ALT,
U/l | 24.71±1.15 | 52.27±6.54 | 0.0002 |
|
AST,
U/l | 23.04±1.04 | 134.57±23.16 | <0.001 |
|
Total
bilirubin, µmol/l | 17.07±2.36 | 61.41±9.51 | <0.001 |
| Albumin (g/l) | 48.18±0.46 | 29.64±1.09 | <0.001 |
| Coagulation
function | | | |
|
Prothrombin
time, sec | 12.64±0.11 | 17.39±0.31 | <0.001 |
|
International
normalized ratio | 1.18±0.01 | 1.45±0.03 | <0.001 |
| Renal function | | | |
|
Creatinine,
µmol/l | 66.47±1.33 | 133.62±21.67 | <0.001 |
|
Urea
nitrogen, mmol/l | 5.88±0.18 | 7.87±0.66 | 0.1378 |
| Electrolytes | | | |
|
Sodium,
mmol/l | 140.76±0.37 | 137.51±0.58 | <0.001 |
|
Potassium,
mmol/l | 4.36±0.06 | 4.00±0.08 | <0.001 |
β diversity analysis reveals distinct
microbial community structures between the OB and NC groups
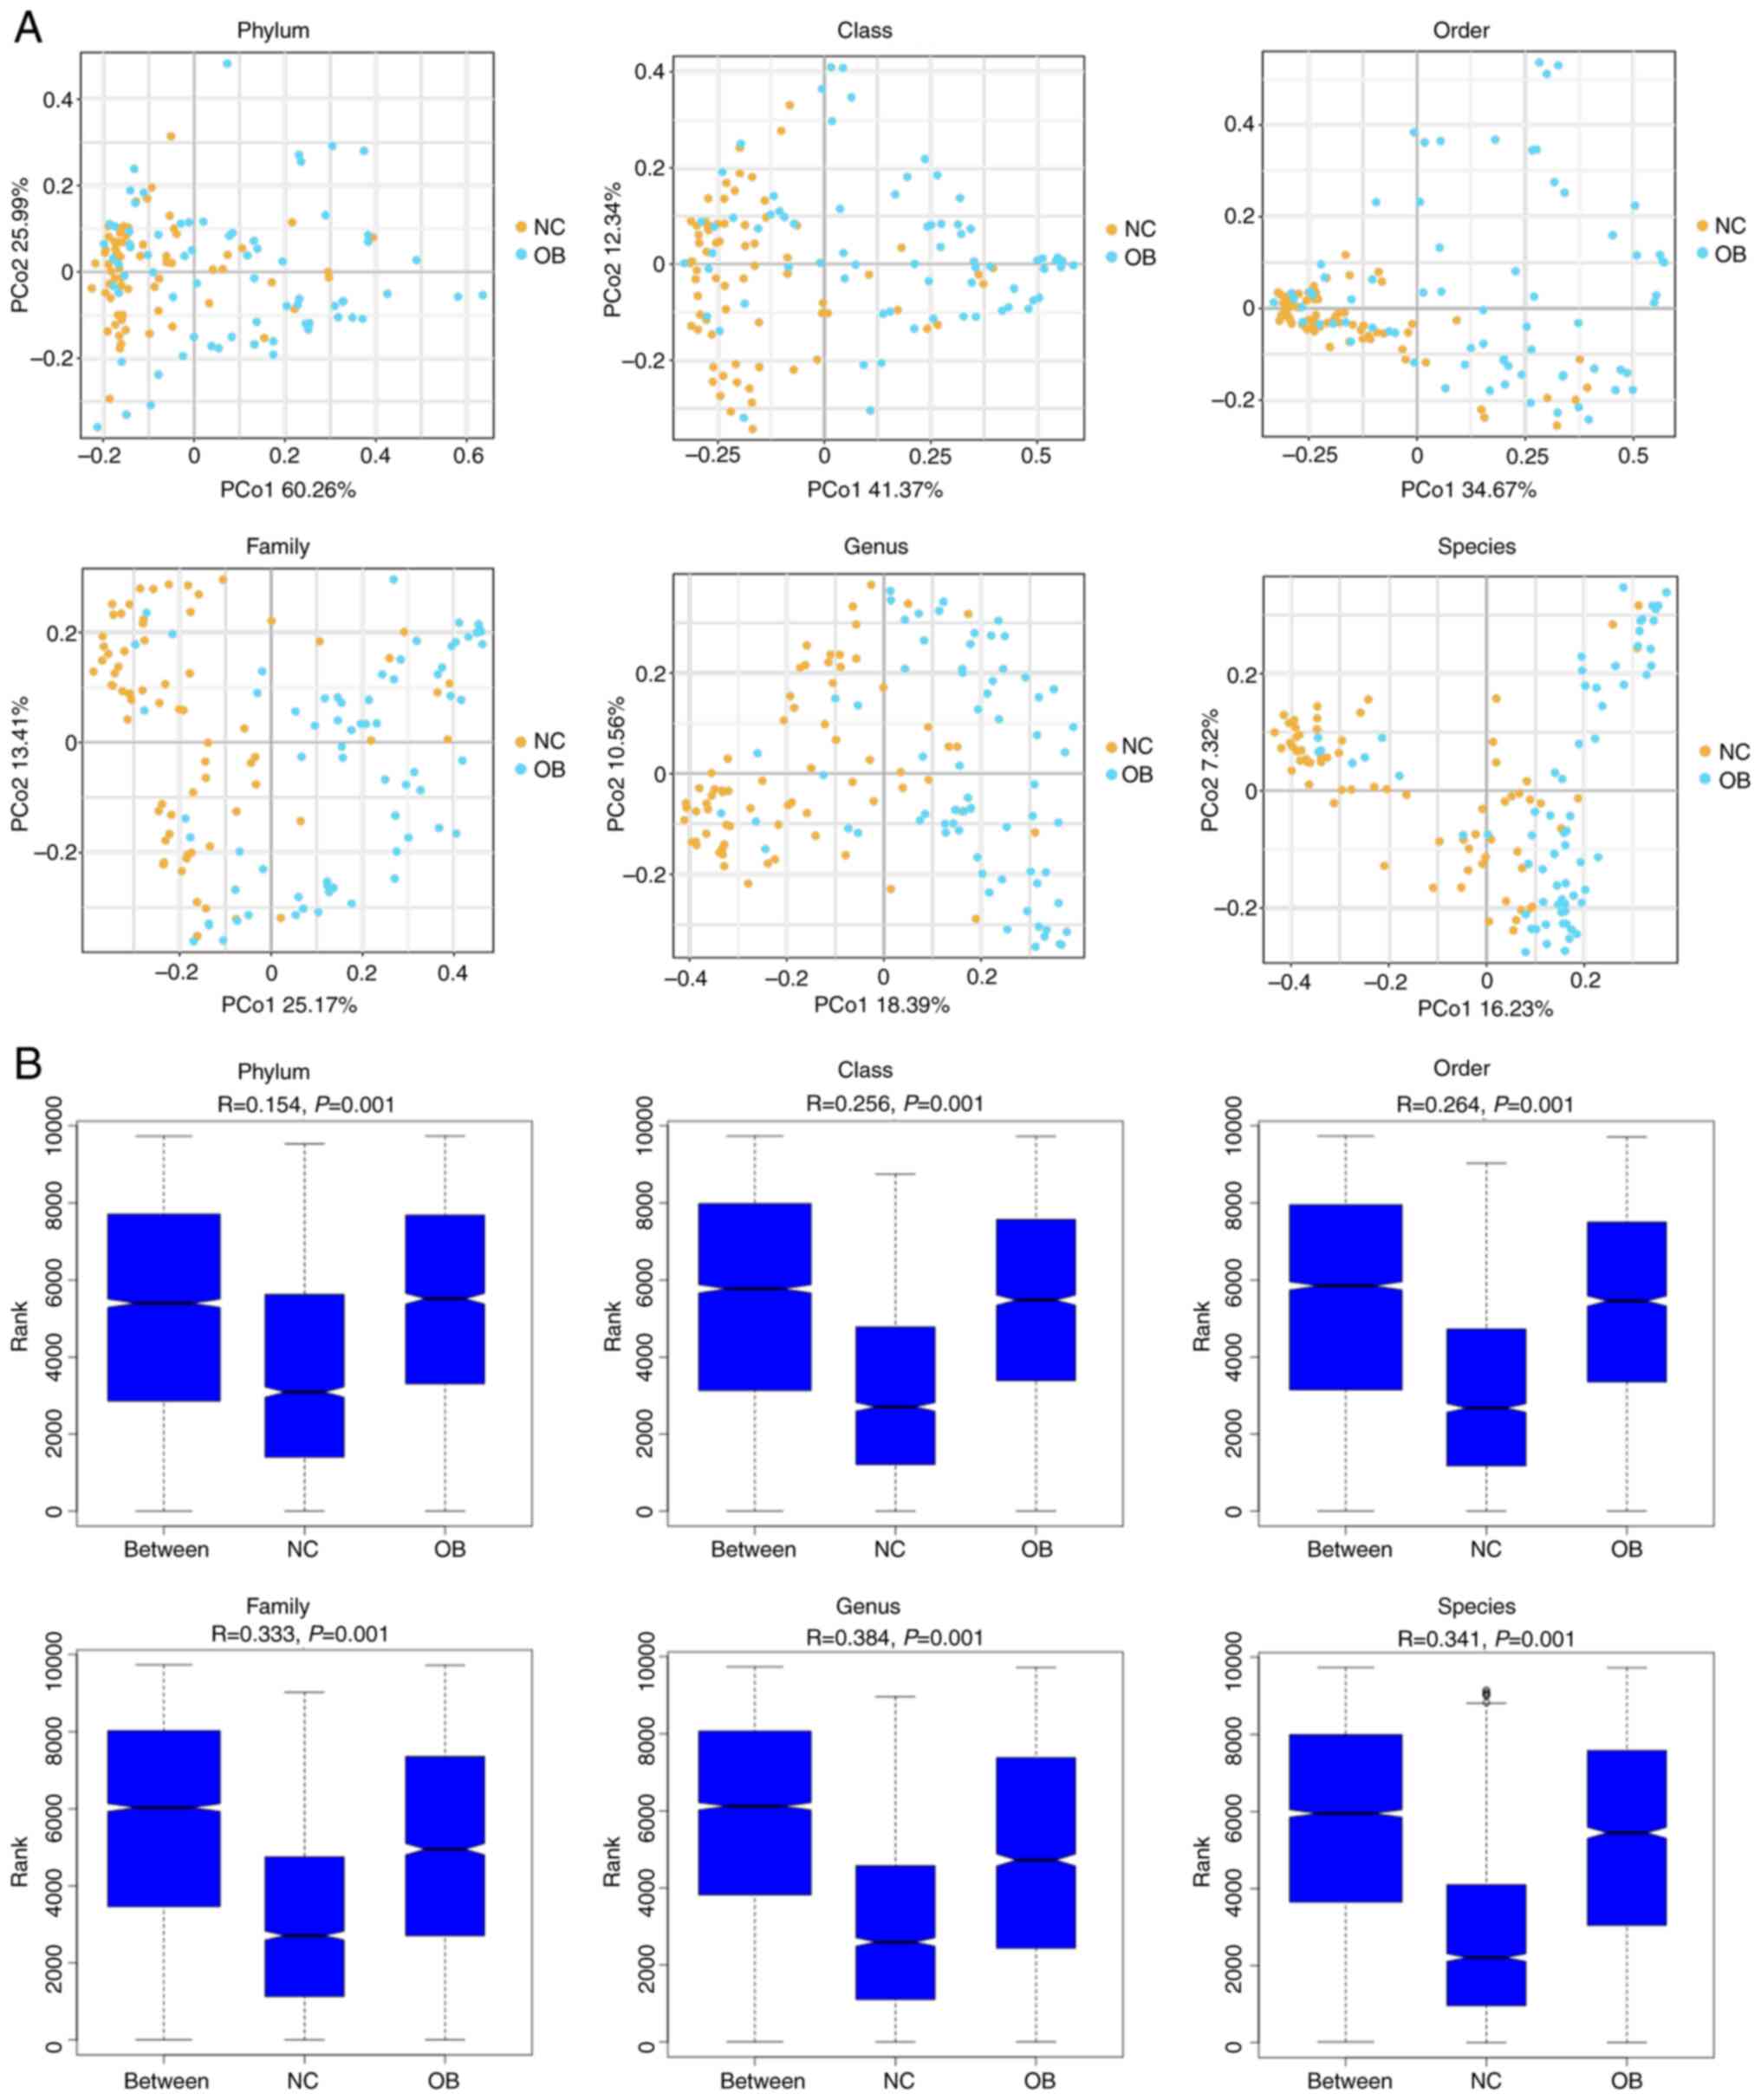
To evaluate the structural variation of the gut
microbiota between cirrhotic patients and healthy individuals, β
diversity analysis was performed across multiple taxonomic levels.
PCoA plots based on Bray-Curtis distances revealed a clear spatial
separation between the NC and OB groups at all six taxonomic ranks,
from phylum to species (Fig. 2A),
indicating distinct community compositions between the groups. The
degree of separation appeared more pronounced at lower taxonomic
levels, particularly at the genus and species ranks. The ANOSIM
results further supported these observations, demonstrating
significant dissimilarities between groups at each taxonomic rank
(Fig. 2B; r>0.25, P<0.001).
Together, these findings illustrate that the gut microbial
communities of cirrhotic patients differed markedly from those of
healthy controls, suggesting ecological shifts linked to disease
progression.
Functional and phenotypic alterations
of gut microbiota in the OB group
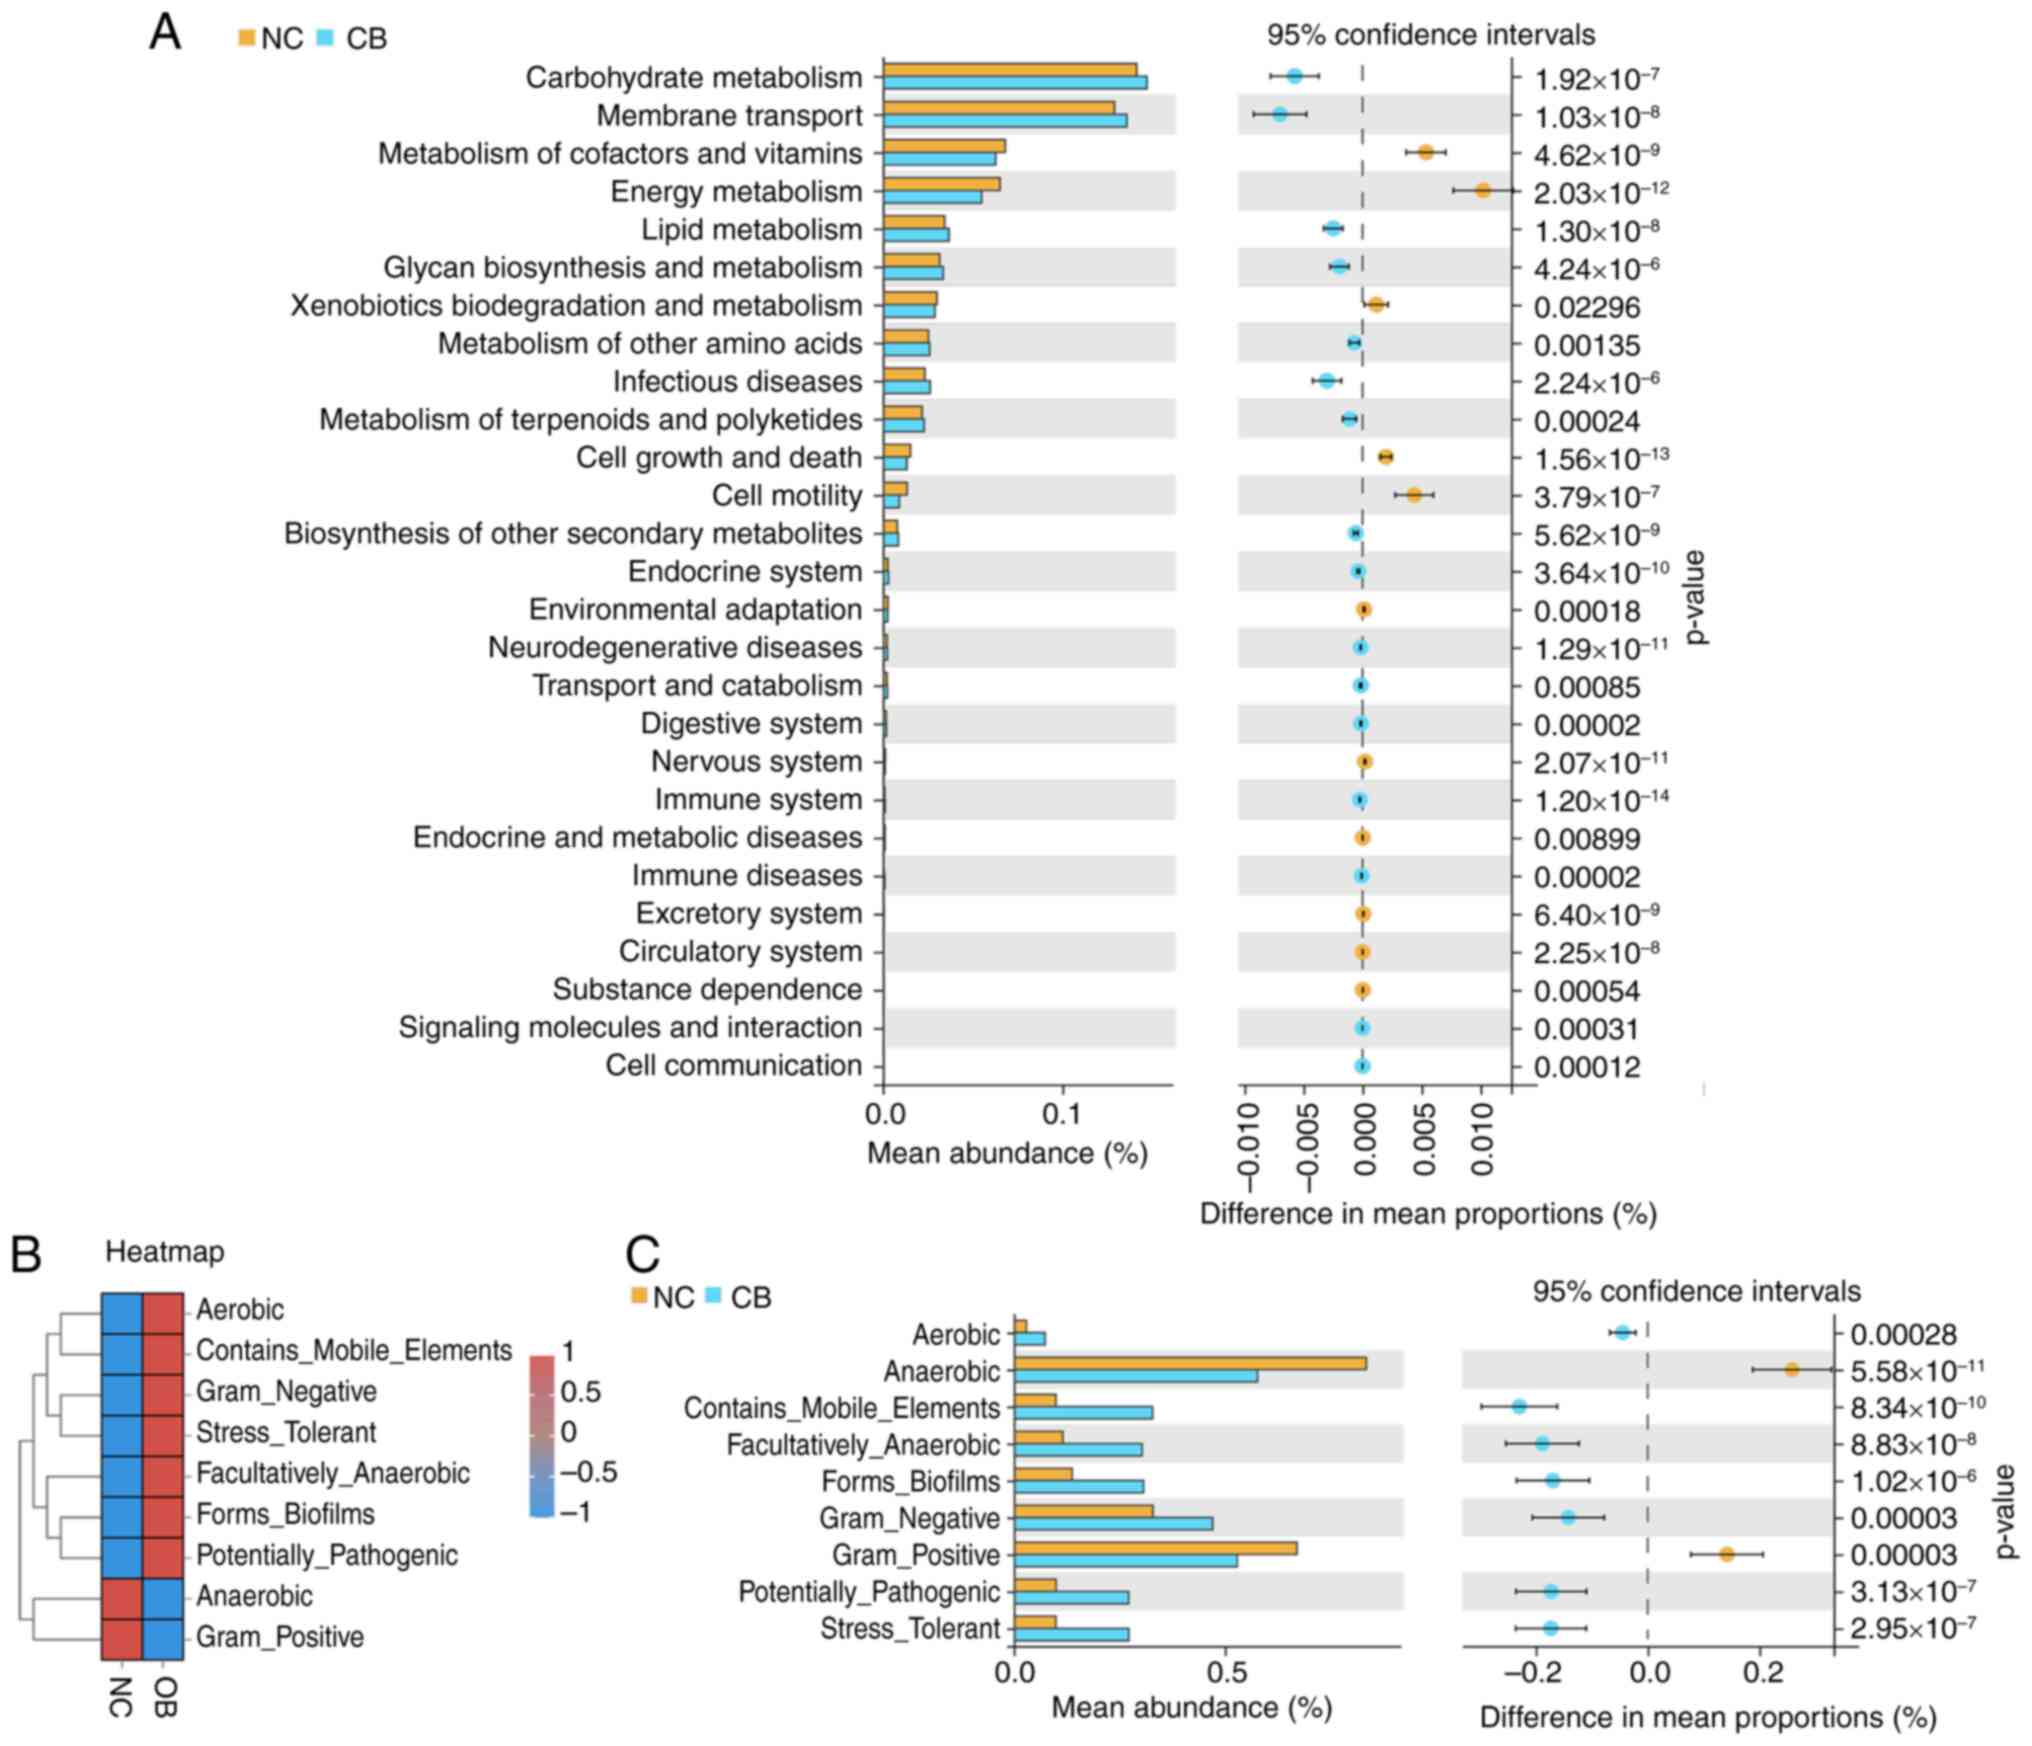
Next, the potential functional differences in the
gut microbiota between groups was explored. Microbial gene
functions were inferred using PICRUSt2. As displayed in Fig. 3A, the pathways related to
‘Carbohydrate Metabolism,’ ‘Membrane Transport’ and the ‘Metabolism
of Cofactors and Vitamins’ were among the most notable predicted
functions, with observable differences noted between the NC and OB
samples. Several immune- and disease-related pathways, such as
those associated with infectious diseases, neurodegenerative
disorders and endocrine system regulation, also displayed
significant variation. Additionally, microbial phenotypic
characteristics were analyzed using BugBase (Fig. 3B and C). The heatmap revealed contrasting trends
in phenotypes such as aerobicity, pathogenic potential and biofilm
formation between the two cohorts. Quantitative comparisons showed
that compared with the NC group, the OB group exhibited higher
proportions of ‘Aerobic’, ‘Contains_Mobile_Elements’,
‘Facultatively_Anaerobic’, ‘Forms_Biofilms’, ‘Gram_Negative’,
‘Potentially_Pathogenic’ and ‘Stress_Tolerant’ phenotypes. By
contrast, the ‘Anaerobic’ and ‘Gram_Positive’ phenotypes were
significantly lower in the OB group (Fig. 3C). These findings suggest that
microbial functional capacities and phenotype expression profiles
were altered in the OB group, as reflected by distinctions in the
predicted pathways and microbial traits.
Microbial taxa with differential
distribution identified by LEfSe
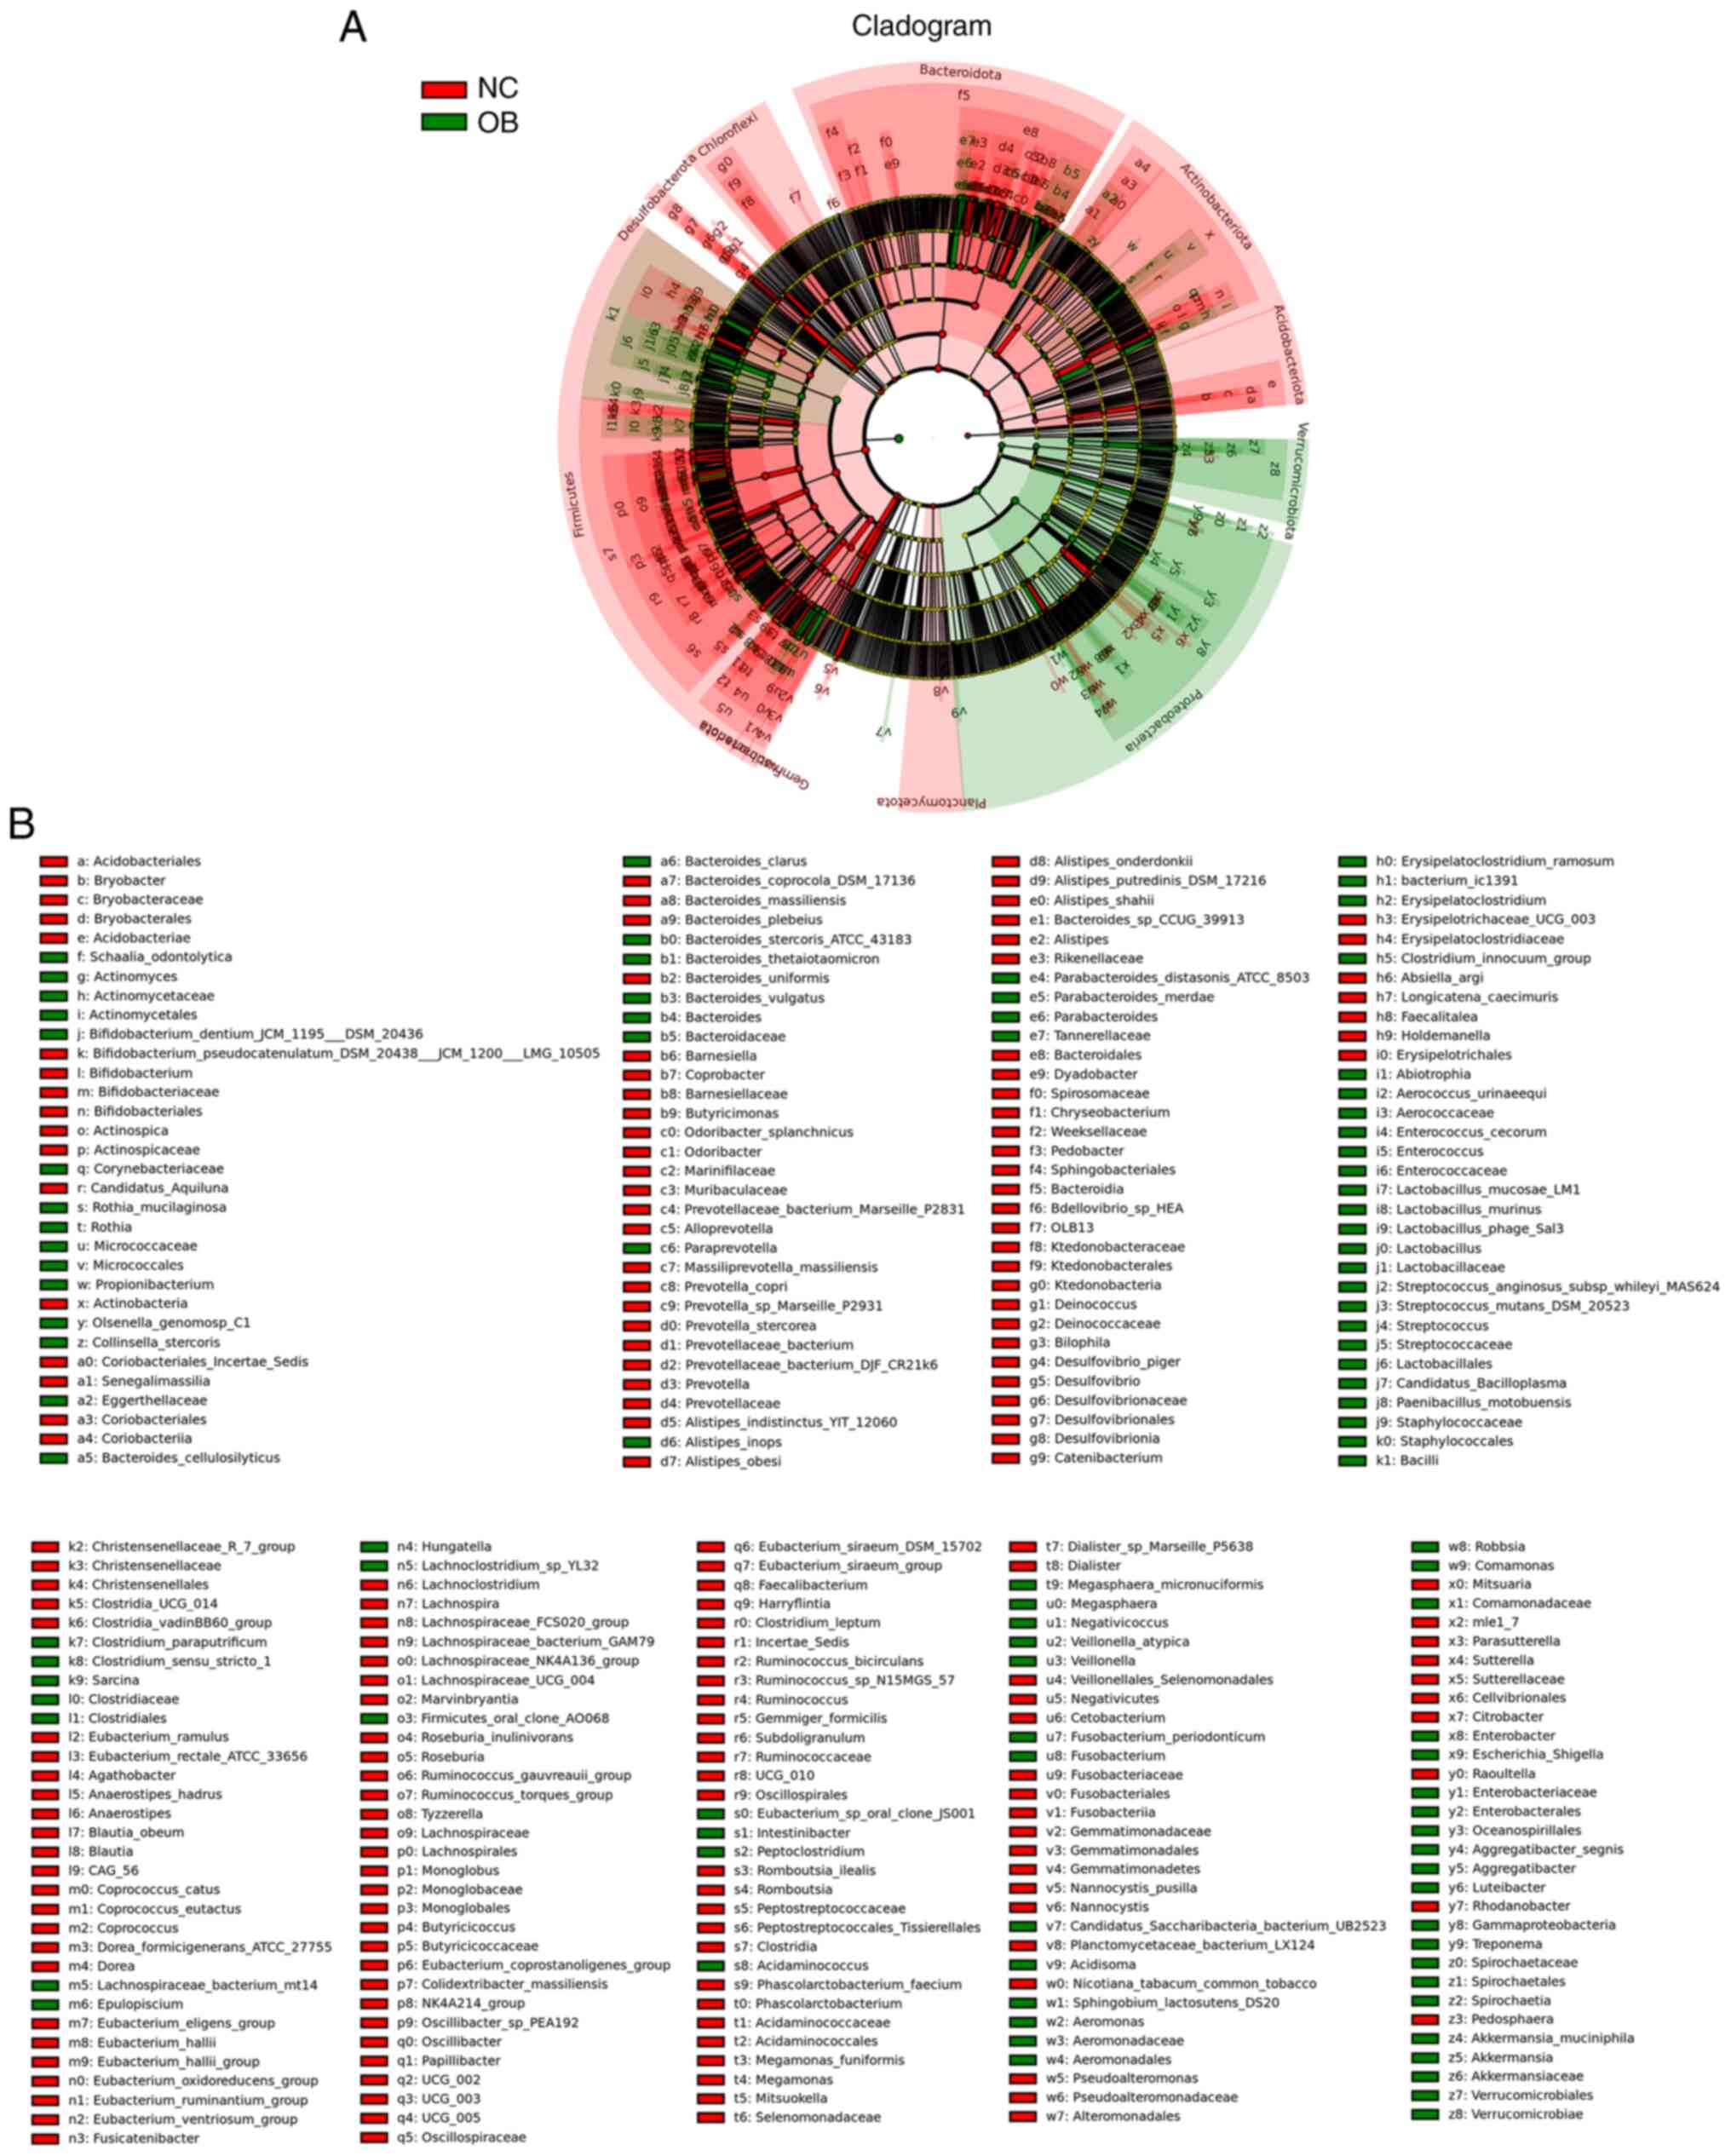
To investigate the taxonomic differences in gut
microbiota composition between the OB and NC groups, LEfSe analysis
was performed to identify taxa exhibiting differential abundance
across taxonomic ranks. The cladogram in Fig. 4A illustrates the phylogenetic
structure of these taxa, with color-coded branches representing
features associated with either the NC or OB group. Several taxa
were found to vary in relative abundance between groups (Fig. 4B). For instance, members of the
phyla Bacteroidota and Actinobacteriota appeared more associated
with the NC group, while taxa belonging to Firmicutes, including
genera such as Clostridium and Lactobacillus, were
relatively more abundant in the OB group. These variations were
evident across multiple levels of taxonomy, suggesting distinct
microbial profiles characterizing the two cohorts.
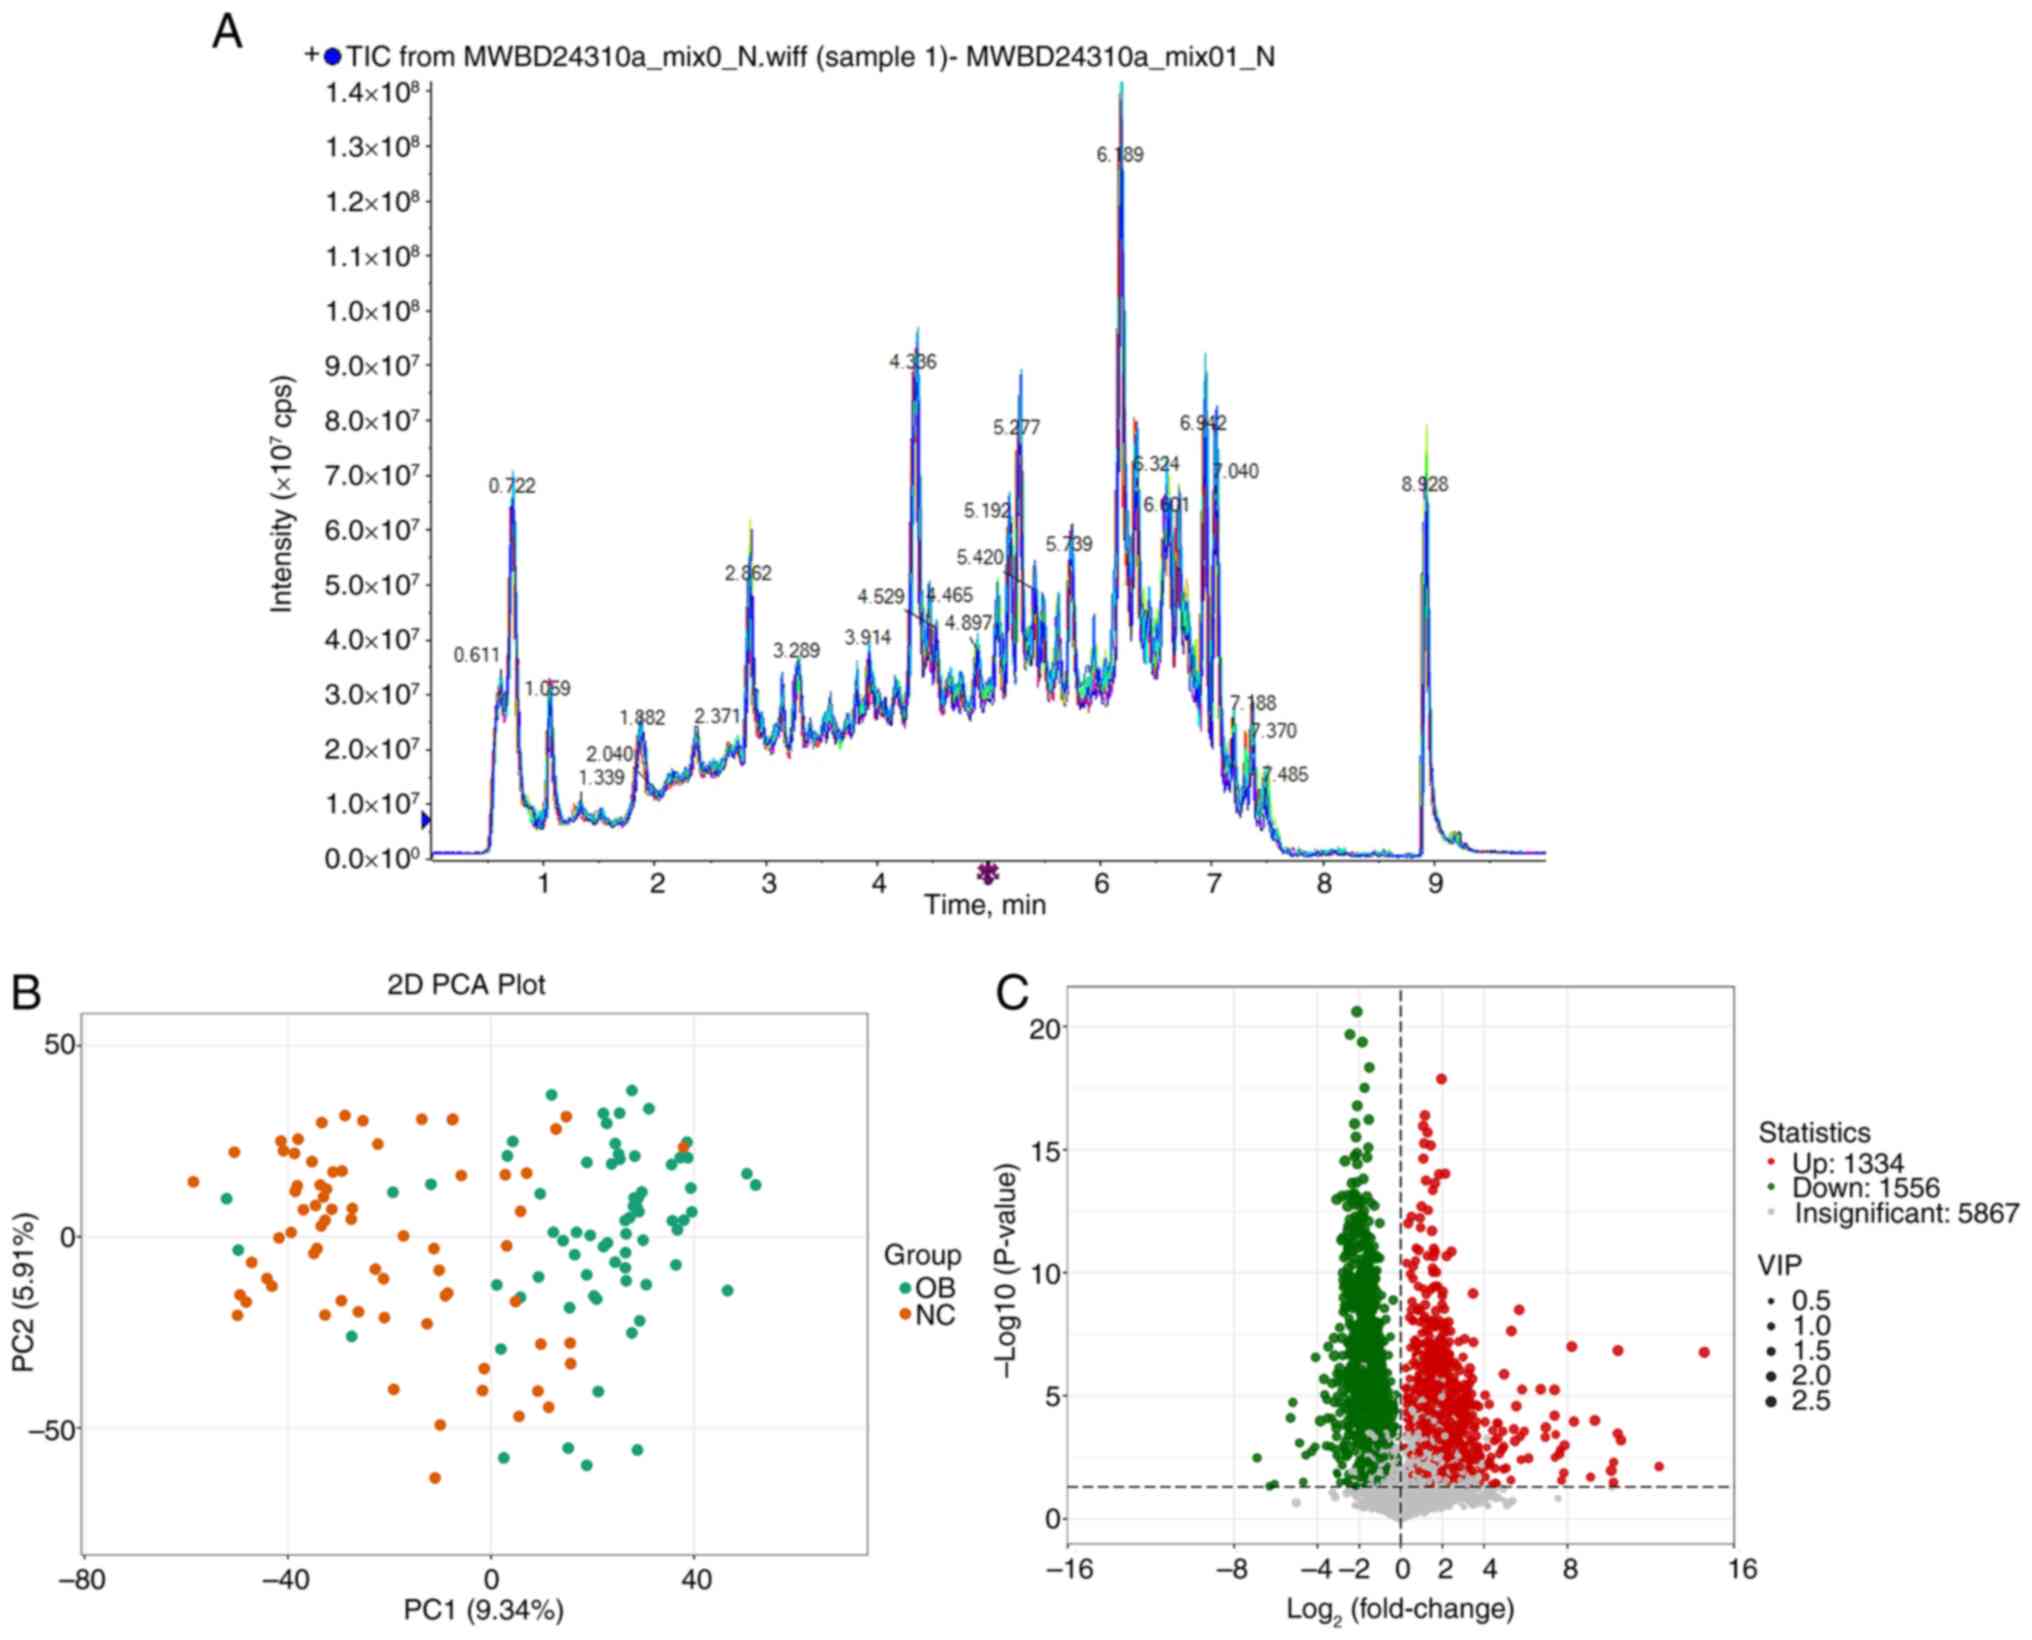
Metabolomic distinctions between the
OB and NC groups based on GC-MS analysis
Building on the observed taxonomic differences in
gut microbiota, untargeted metabolomic profiling was performed to
investigate compositional variations at the metabolite level. Fecal
samples from both the OB and NC groups were analyzed using GC-MS
and the representative total ion chromatograms showed comparable
spectral patterns across samples (Fig.
5A). PCA based on the full metabolite dataset revealed a
distributional shift between the OB and NC groups (Fig. 5B), with samples from each cohort
forming distinguishable clusters. This suggests divergence in
global metabolic features between the two groups. Differential
metabolite screening further identified a wide array of altered
features. A total of 8,777 metabolites were detected, among which
1,334 exhibited increased abundance and 1,556 were decreased in the
OB group compared with the NC group (Fig. 5C). To highlight the most relevant
metabolic shifts, the top 20 upregulated and downregulated
metabolites based on fold change and P-value are summarized in
Tables II and III, respectively. These tables provide
detailed chemical information, statistical significance and fold
changes of the most altered compounds, thereby offering a clearer
view of the molecular disturbances associated with the OB group.
These results offer an initial view of metabolic alterations
between the OB and NC groups.
| Table IITop 20 upregulated differential
metabolites between the OB and NC groups. |
Table II
Top 20 upregulated differential
metabolites between the OB and NC groups.
| No. | Compound | Formula | P-value | Log2FC |
|---|
| 1 |
4-Chloro-5-sulfamoylanthranilic acid |
C7H7ClN2O4S | <0.0001 | 14.58 |
| 2 | Lithospermic acid
B |
C36H30O16 | 0.0075 | 12.41 |
| 3 |
Dihydrorobinetin |
C15H12O7 | 0.0006 | 10.58 |
| 4 |
2,8-Dichloro-3-dibenzofuranol |
C12H6Cl2O2 | <0.0001 | 10.43 |
| 5 | Diflunisal |
C13H8F2O3 | 0.0003 | 10.42 |
| 6 | S1P Lyase
Fluorogenic Substrate |
C15H10O8S | 0.0330 | 10.21 |
| 7 |
[3-(6,7-dihydroxy-4-oxo-4H-chromen-2-yl)
phenyl] oxidanesulfonic acid |
C14H10ClN3O4S | 0.0109 | 10.11 |
| 8 |
N-[(3-chloro-2-hydroxy-5-nitrophenyl)
carbamothioyl] benzamide |
C6H11O6PS | 0.0001 | 9.32 |
| 9 |
5-(Methylthio)-2,3-dioxopentyl
phosphate |
C19H12O8 | 0.0001 | 8.32 |
| 10 |
(1R*,3R*,3'S*)-1,2,3,4-Tetrahydro-1-(2-thio-3-pyrrolidinyl)-beta-carboline-3-carboxylic
acid |
C8H7ClN4S | <0.0001 | 8.21 |
| 11 | Diacerein |
C15H11ClN2O2 | 0.0010 | 7.86 |
| 12 |
6-(2-Chloroallylthio)purine |
C40H40O11 | 0.0135 | 7.83 |
| 13 | Oxazepam |
C14H12O6S | 0.0271 | 7.72 |
| 14 |
1-[3-(6-{2,4-dihydroxy-3-[(1E)-3-methylbut-1-en-1-yl]
benzoyl}-5-(2,4-dihydroxyphenyl)-4-hydroxy-3-methylcyclohex-2-en-1-yl)-2,4-dihydroxyphenyl]-3-(2,4-dihydroxyphenyl)
propan-1-one |
C13H19N3O10 | 0.0016 | 7.66 |
| 15 |
Resveratrol-3-O-sulfate |
C23H34O5 | 0.0023 | 7.62 |
| 16 | Glu-Asp-Asp |
C18H14O8 | 0.0004 | 7.44 |
| 17 | Latanoprost
acid |
C36H28O16 | 0.0032 | 7.4 |
| 18 | (2S-3S)-versiconal
hemiacetal |
C12H11ClN2O5S | 0.0001 | 7.39 |
| 19 | Theaflavin
monogallates |
C16H30N4O5 | <0.0001 | 7.39 |
| 20 | Furosemide |
C23H31FO6 | 0.0002 | 6.96 |
| Table IIITop 20 downregulated differential
metabolites between the OB and NC groups. |
Table III
Top 20 downregulated differential
metabolites between the OB and NC groups.
| No. | Compound | Formula | P-value | Log2FC |
|---|
| 1 | Cortisone
acetate |
C23H30O6 | 0.0033 | -6.90 |
| 2 | Colubrinic
acid |
C30H46O4 | 0.0470 | -6.30 |
| 3 |
2-[1-Hydroxy-3-(4-methoxyphenyl)propyl]-3,5-dimethoxyphenol |
C18H22O5 | 0.0379 | -6.06 |
| 4 | Goshonoside F2 |
C26H44O8 | 0.0001 | -5.30 |
| 5 | Fasciculic acid
C |
C38H63NO11 | <0.0001 | -5.18 |
| 6 | Imperialine |
C27H43NO3 | 0.0008 | -4.86 |
| 7 | Lys-Lys-Ser |
C15H31N5O5 | 0.0315 | -4.68 |
| 8 | Glu-Gln-Gln |
C15H25N5O8 | 0.0026 | -4.56 |
| 9 | Sarpagine |
C19H22N2O2 | 0.0018 | -4.28 |
| 10 |
(Z)-7-[(2R)-3-hydroxy-2-[(E,4R)-4-hydroxy-4-(1-propylcyclobutyl)
but-1-enyl]-5-oxocyclopentyl]hept-5-enoic acid |
C23H36O5 | 0.0012 | -4.12 |
| 11 | Isoeugenitol |
C11H10O4 | <0.0001 | -4.09 |
| 12 | Prostaglandin E2
methyl ester |
C21H34O5 | 0.0001 | -3.86 |
| 13 |
(1R,8S,9S)-3,4-dihydroxy-8-methoxy-11,11-dimethyl-5-propan-2-yl-16-oxatetracyclo[7.5.2.01,10.02,7]hexadeca-2,4,6-trien-15-one |
C21H28O5 | <0.0001 | -3.69 |
| 14 | E-Norendoxifen |
C24H25NO2 | <0.0001 | -3.65 |
| 15 | Oleyl acetate |
C20H38O2 | 0.0011 | -3.56 |
| 16 | Val-Asp-Asp |
C13H21N3O8 | <0.0001 | -3.54 |
| 17 | 14,15-Epoxyemindole
SB |
C28H39NO2 | 0.0001 | -3.52 |
| 18 |
Phe-Ile-His-Arg |
C27H41N9O5 | <0.0001 | -3.48 |
| 19 | Tiocarlide |
C23H32N2O2S | 0.0012 | -3.34 |
| 20 | Fingolimod |
C19H33NO2 | 0.0001 | -3.32 |
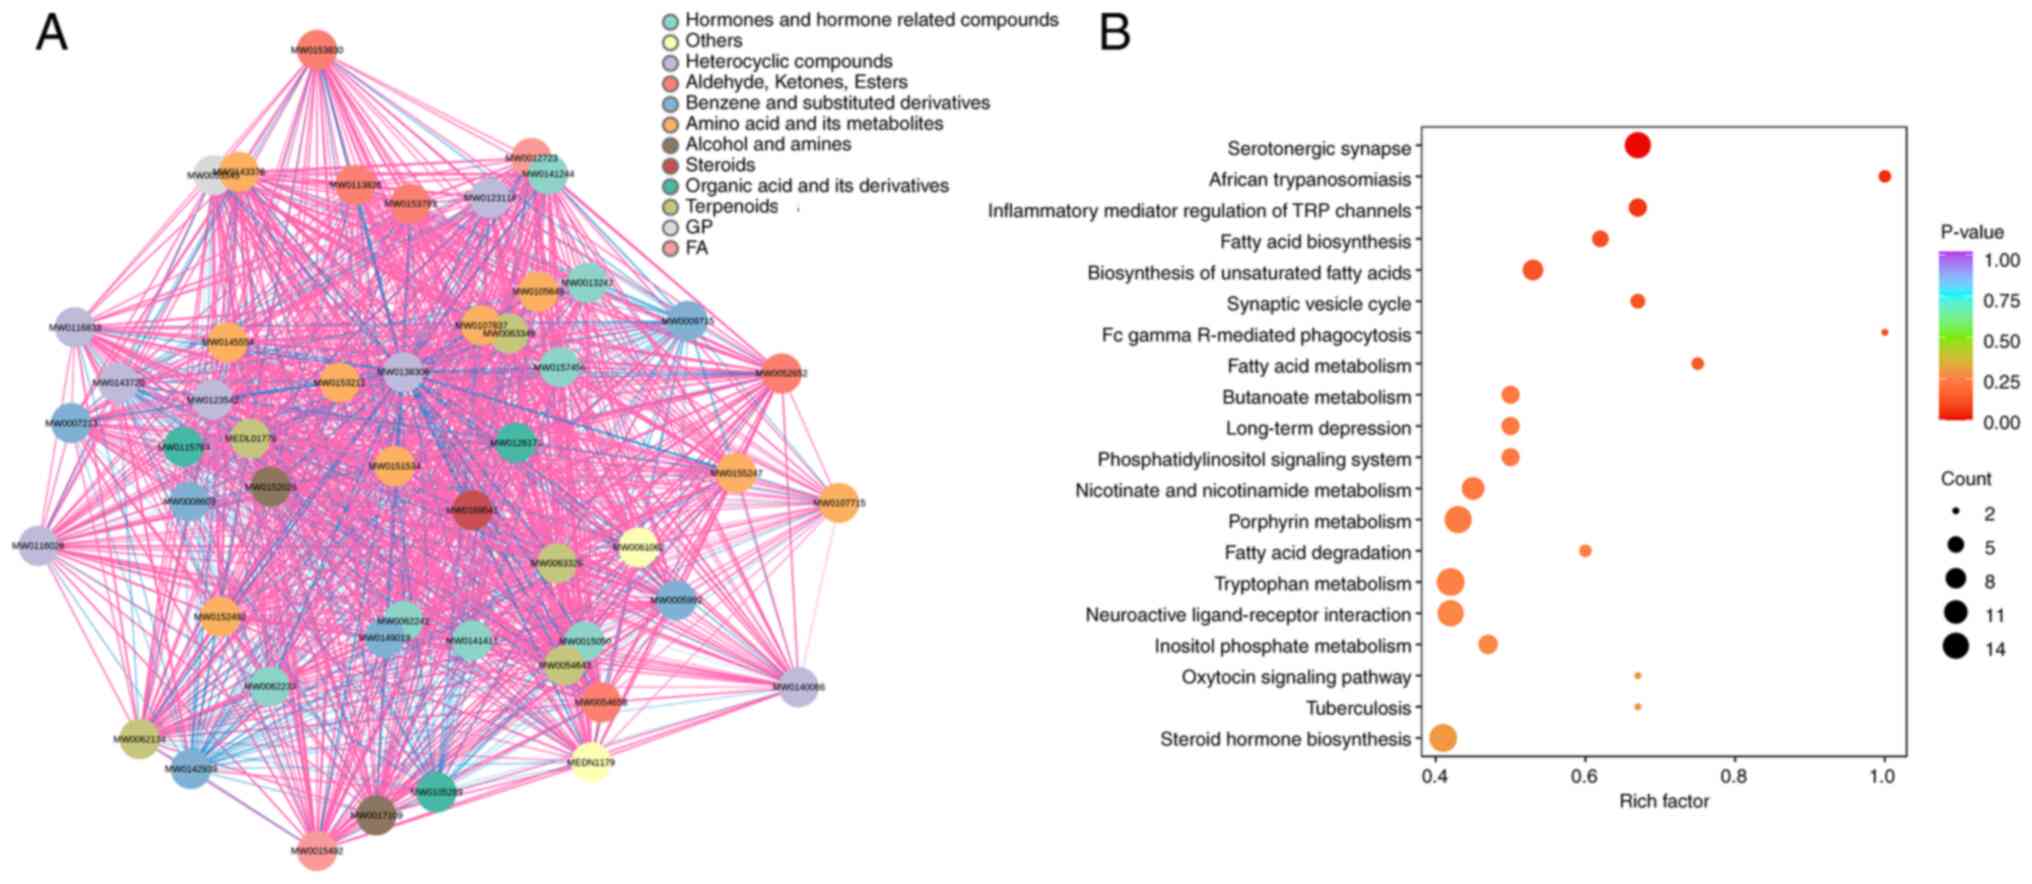
Exploration of enriched pathways
linked to altered metabolites
Based on the screened differential metabolites, a
compound network was constructed to illustrate chemical
associations and structural classifications. Metabolites were
categorized into groups such as amino acid derivatives, steroids,
fatty acids and heterocyclic compounds, with dense interconnections
observed both within and between chemical classes (Fig. 6A). Then, KEGG pathway enrichment was
conducted using the annotated metabolites. A range of pathways were
implicated, including those involved in neurotransmitter signaling
(such as ‘Serotonergic synapse’), lipid metabolism (such as ‘Fatty
acid biosynthesis’ and ‘Fatty acid degradation’) and hormonal
regulation (such as ‘Steroid hormone biosynthesis’ and ‘Oxytocin
signaling pathway’) (Fig. 6B).
Evaluation of diagnostic performance
of differential metabolites
The present study further assessed the
classification potential of key metabolites with receiver operator
characteristic curve analysis. A total of 10 representative
metabolites were selected based on their relevance in prior
screening and annotation. All selected metabolites yielded area
under the curve (AUC) values ≥0.93, with the highest observed for
6-ketoprostaglandin E1 (AUC=0.955). Other compounds such as
prostaglandin D3 (AUC=0.940), deoxyartemisinin (AUC=0.937) and
ganoderic acid Md (AUC=0.930) also exhibited strong classification
performance. The full list included: biotin-XX-hydrazide
(AUC=0.936), estra-4,9-diene-3,17-dione (AUC=0.933), prostaglandin
E2 methyl ester (AUC=0.931), 8-epidermal glycoside (AUC=0.930),
pergolide (AUC=0.930) and cincassiol B (AUC=0.930) (Fig. 7). These results suggest that the
identified features may have contributed to group differentiation
in the metabolomics cohort and provide reference for subsequent
validation efforts.
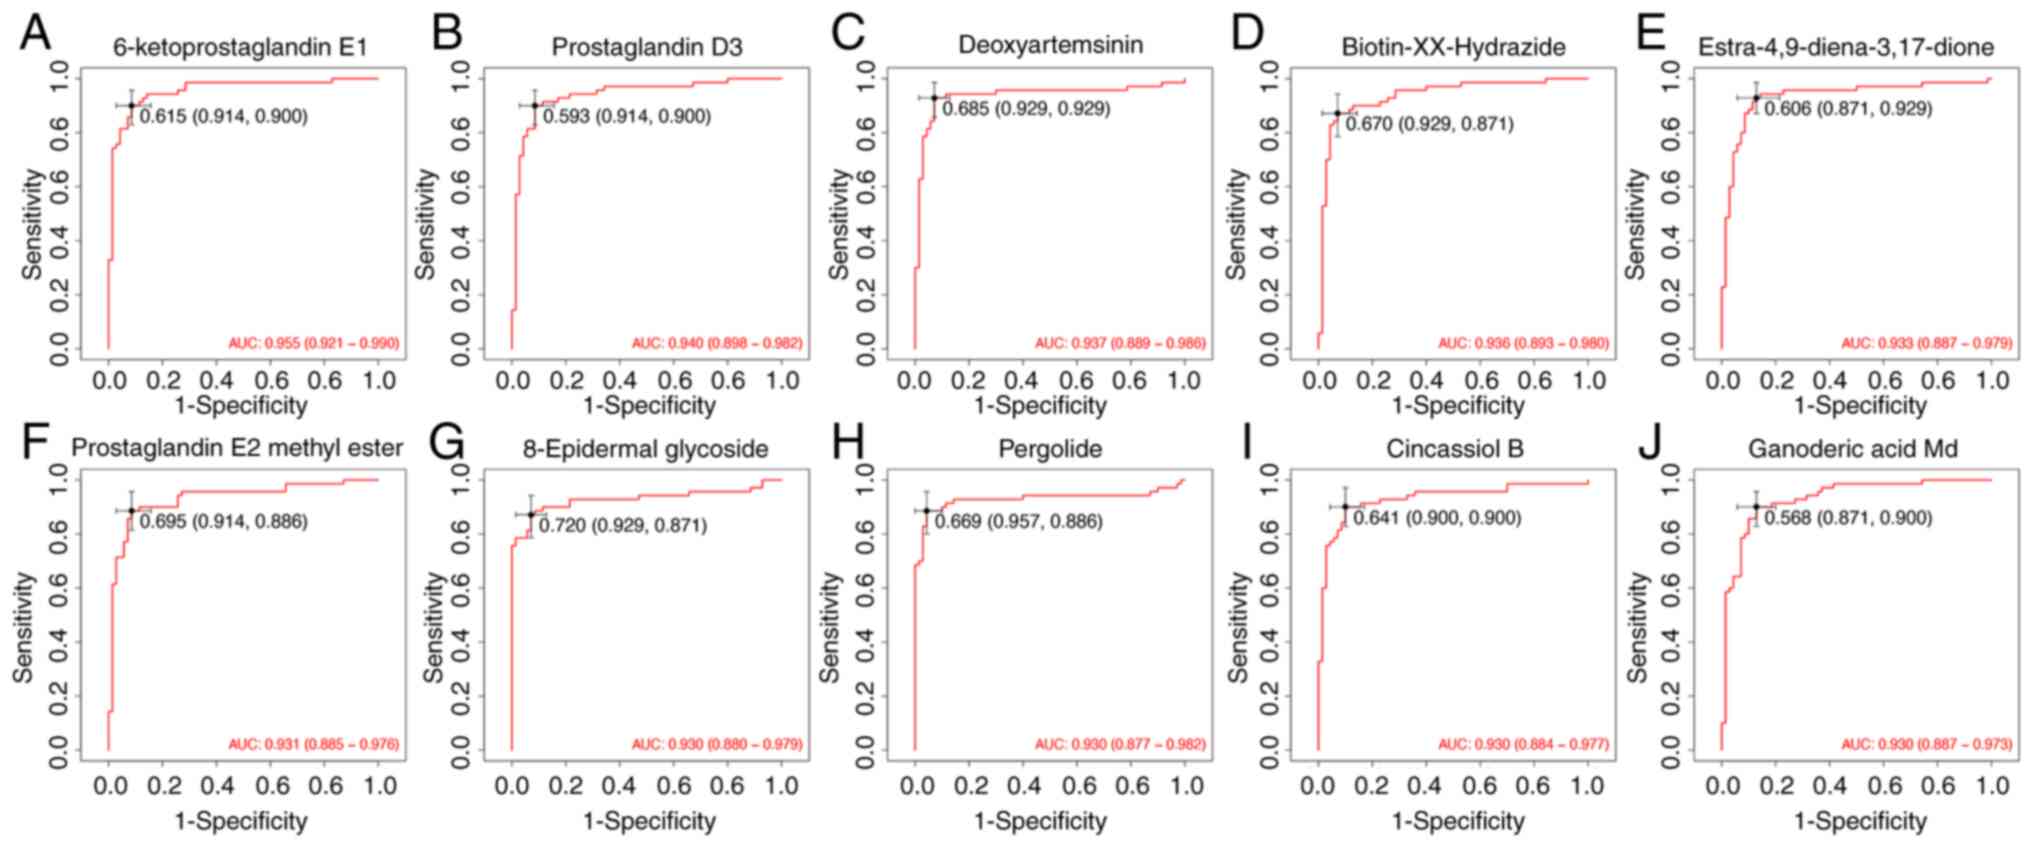 | Figure 7ROC curve analysis of 10 candidate
metabolites distinguishing the NC and OB groups. ROC curves between
the NC and OB groups were generated for the following metabolites:
(A) 6-ketoprostaglandin E1, (B) prostaglandin D3, (C)
deoxyartemisinin, (D) biotin-XX-hydrazide, (E)
estra-4,9-diene-3,17-dione, (F) prostaglandin E2 methyl ester, (G)
8-epidermal glycoside, (H) pergolide, (I) cincassiol B, and (J)
ganoderic acid Md. Values in black on the ROC curves indicate the
optimal cut-off value, followed by the corresponding sensitivity
and specificity in parentheses. ROC, receiver operating
characteristic; NC, normal control; OB, refractory ascites group;
AUC, area under the curve. |
Disease association of key
differential metabolites
Beyond evaluating the diagnostic value of the
differential metabolites, their potential links to human diseases
were further investigated by referencing the KEGG and HMDB
databases. Among them, L-tryptophan, hypoxanthine, and indole
exhibited broad associations with various pathological conditions,
notably encompassing neurological disorders (such as epilepsy,
schizophrenia and Alzheimer's disease), chronic inflammatory
diseases (including Crohn's disease, ulcerative colitis and
rheumatoid arthritis), as well as multiple malignancies (such as
colorectal, ovarian and pancreatic cancer). For example,
L-tryptophan alone was associated with >20 disease states,
reflecting its multifaceted role in systemic metabolic regulation.
Likewise, hypoxanthine was associated with several metabolic
syndromes and tumor-related processes. Besides, other metabolites,
including serotonin, phenylethylamine and deoxycholic acid, were
implicated in both gastrointestinal and neuropsychiatric conditions
(Table IV). Collectively, these
associations underscored the potential involvement of these
metabolites in disease-related metabolic pathways and support their
biological relevance within the study context.
| Table IVDisease associations of differential
metabolites: Refractory ascites groups vs. healthy group. |
Table IV
Disease associations of differential
metabolites: Refractory ascites groups vs. healthy group.
| Compound Name | The Human
Metabolome Database diseases |
|---|
| L-Tryptophan | Epilepsy |
Schizophrenia | Alzheimer's disease | Colorectal cancer | Ovarian
cancer | Obesity | Nicotinamide adenine dinucleotide deficiency |
Hartnup disease | Leukemia | Olivopontocerebral atrophy |
Hereditary spastic paraplegia | Hypothyroidism | Friedreich's
ataxia | Celiac disease | Irritable bowel syndrome | Ulcerative
colitis | Autism | Crohn's disease | Rheumatoid arthritis |
Perillyl alcohol administration for cancer treatment | Pancreatic
cancer | Periodontal disease | Frontotemporal dementia | Lewy body
disease | Attachment loss | Periodontal probing depth | Cachexia |
Eosinophilic esophagitis | Tryptophanuria with dwarfism |
| Hypoxanthine | Lesch-Nyhan
syndrome | Canavan disease | Thymidine treatment | Uremia |
Xanthinuria type 1 | Degenerative disc disease | Hydrocephalus |
3-methyl-crotonyl-glycinuria | Irritable bowel syndrome |
Colorectal cancer | Crohn's disease | Ulcerative colitis |
Rheumatoid arthritis | Perillyl alcohol administration for cancer
treatment | Pancreatic cancer | Periodontal disease | Alzheimer's
disease | Frontotemporal dementia | Lewy body disease | Attachment
loss | Periodontal probing depth | Lung cancer | Autosomal dominant
polycystic kidney disease | Eosinophilic esophagitis |
Hepatocellular carcinoma | Molybdenum cofactor deficiency | Sulfite
oxidase deficiency, ISOLATED | Phosphoribosylpyrophosphate
synthetase superactivity |
| Tryptamine | Irritable bowel
syndrome | Colorectal cancer |
| Phenethylamine | Bulimia nervosa |
Crohn's disease | Ulcerative colitis | Minimal brain dysfunction |
Autism |
| Nicotinic acid | Alcoholism |
Colorectal cancer | Crohn's disease | Ulcerative colitis |
Attachment loss | Missing teeth | Periodontal probing depth |
|
7-Methylguanine | Colorectal
cancer |
| Deoxycholic
acid | Cystic fibrosis |
Irritable bowel syndrome | Ulcerative colitis | Colorectal cancer |
Primary biliary cirrhosis |
| Oxindole | Colorectal
cancer |
Correlation between refractory ascites
and clinical parameters
To further explore the clinical relevance of
refractory ascites, Pearson correlation analysis was performed
between refractory ascites status and routine clinical parameters.
The results demonstrated that refractory ascites was positively
correlated with PT (r=0.536, P<0.001), INR (r=0.533,
P<0.001), TBIL (r=0.384, P=0.001) and urea nitrogen (r=0.285,
P=0.019), while showing negative correlations with serum albumin
(r=-0.299, P=0.012) and sodium (r=-0.270, P=0.024). No significant
associations were observed with age, sex, ALT, AST, potassium or
creatinine (all P>0.05). These findings suggest that impaired
coagulation, hyperbilirubinemia, hypoalbuminemia and electrolyte or
renal disturbances are closely linked with the presence of
refractory ascites (Table V).
| Table VPearson correlation analysis between
refractory ascites and clinical parameters. |
Table V
Pearson correlation analysis between
refractory ascites and clinical parameters.
| Parameter | Correlation
coefficient (r) | P-value |
|---|
| PT | 0.536 | <0.001 |
| INR | 0.533 | <0.001 |
| TBIL | 0.384 | 0.001 |
| Albumin (g/l) | -0.299 | 0.012 |
| Urea nitrogen | 0.285 | 0.019 |
| Sodium
(mmol/l) | -0.27 | 0.024 |
| Diagnosis | 0.229 | 0.056 |
| Potassium
(mmol/l) | 0.218 | 0.070 |
| Creatinine | 0.105 | 0.393 |
| ALT | 0.028 | 0.817 |
| Age | -0.024 | 0.841 |
| Sex | -0.012 | 0.919 |
| AST | -0.012 | 0.920 |
Discussion
The present study offers an in-depth and integrative
assessment of microbial dysbiosis and metabolic abnormalities in
individuals with refractory ascites secondary to cirrhosis,
uncovering notable disturbances across the gut-liver axis. The data
revealed a marked decline in intestinal microbial richness and
significant compositional divergence between the refractory ascites
cohort and healthy counterparts. These alterations included a
notable proliferation of Proteobacteria, particularly
Enterobacteriaceae, alongside a depletion of beneficial anaerobes
such as Bacteroidota and Actinobacteriota. Such microbial
transitions favoring pathogenic species with enhanced oxidative
resilience and biofilm-forming capacities may aggravate bacterial
translocation and systemic inflammatory responses, both central to
the disease pathophysiology.
In the present study, 16S rRNA sequencing was
employed to characterize the microbial community structure, a
high-throughput and widely validated approach that targets the
variable regions of bacterial ribosomal RNA genes to resolve
taxonomic profiles (24). This
technique has been extensively utilized across diverse clinical
contexts, including gastrointestinal, hepatic and respiratory
diseases (25-28).
For instance, it has been applied to identify nasopharyngeal
microbiota alterations in SARS-CoV-2 infection (29). Although widely used in cirrhosis
research, its specific application in the context of refractory
ascites remains underrepresented. This technique enables the
detection of nuanced but clinically meaningful shifts that would
likely be missed through conventional culture methods (30,31).
In addition to overall compositional shifts, distinct dominance
patterns in the OB group were identified in the present study, with
taxa such as Escherichia-Shigella, Enterobacteriaceae and
Gammaproteobacteria markedly enriched compared with controls. These
microbial signatures may reflect selective pressures favoring
opportunistic pathogens under cirrhotic gut conditions. The use of
16S rRNA gene sequencing, a more specific approach than traditional
cultures, enabled the resolution of taxonomic profiles with greater
precision in the present study. However, we acknowledge that while
this method offers significant advantages in microbial
identification, challenges remain in terms of both the cost and the
systematic application of metabolite studies in clinical settings.
Future research may need to explore ways to reduce the cost of
metabolite studies and promote their standardization, ensuring
broader applicability in clinical practice.
Findings from BugBase phenotype predictions
substantiated the observations of the present study, indicating
elevated levels of Gram-negative bacteria, facultative anaerobes
and organisms capable of biofilm production in the ascitic group.
These insights are consistent with recent work by Shi et al
(32), who utilized metagenomic
next-generation sequencing (mNGS) to reveal a high prevalence of
polymicrobial infections in cirrhotic ascitic fluid, including a
dominance of Enterobacteriaceae and other fastidious facultative
pathogens not detected via traditional culture techniques. Their
conclusions emphasized the pathogenic potential of microbial
imbalances and invasive phenotypes in precipitating spontaneous
bacterial peritonitis and systemic immune activation (32), thereby reinforcing the clinical
significance of the microbiota-based findings of the present study.
Notably, these pathogenic phenotypes also suggest that
hypoxia-induced niche disruption and accumulation of oxidative
stress-tolerant species may be key contributors to intestinal
permeability, further linking microbial dysfunction with systemic
disease progression.
In the present study, further functional inference
revealed disruptions in microbial pathways governing carbohydrate
metabolism, vitamin biosynthesis and membrane-associated transport
systems. These imbalances may hinder the production of beneficial
microbial metabolites, such as short-chain fatty acids, and
compromise host mucosal defense. Similar host-microbiota
interactions have been reported in colitis models, where
Marinifilaceae enrichment was linked to suppressed cell cycle
signaling in Toll-like receptor 2-deficient mice (33). Comparable disruptions have been
described by Gitto et al (34), who observed persistent functional
impairments in gut microbiota among patients post-TIPS procedure,
including reduced synthesis of anti-inflammatory lipids such as
octanoic acid and enrichment of inflammation-promoting taxa. While
their study focused on post-intervention systemic effects, the
results of the present study highlight the possibility that such
microbial dysregulation originates earlier at the intestinal level.
The integration of functional annotation tools with community
structure analysis in the present study provides enhanced
mechanistic insight.
In parallel, comprehensive untargeted metabolite
profiling using GC-MS, a technique renowned for its sensitivity in
detecting low-molecular-weight volatile and semi-volatile
compounds, was performed in the present study. GC-MS has garnered
increasing attention in hepatology due to its ability to delineate
metabolic signatures indicative of liver pathology and ascitic
fluid composition (15,35). In the present study, fecal
metabolomics allowed the identification of gut-derived biochemical
alterations, a number of which were associated with the observed
microbiome shifts. Notably, compared with ascitic fluid-based
metabolomics, fecal analysis may offer earlier and more direct
insights into intestinal metabolic dysfunctions that precede
systemic involvement, such as peritonitis or encephalopathy
(36).
In the present study, an integrative metabolomic
analysis combining GC-MS and LC-MS platforms uncovered ~2,900
differentially expressed fecal metabolites. KEGG pathway enrichment
analysis revealed significant disturbances in serotonergic synapse
activity, steroid biosynthesis and neuroactive ligand-receptor
signaling networks. These findings mirror those of Beyoğlu et
al (15), who reported
increased amino acid levels and reduced fatty acid content in
ascitic fluid from cirrhotic patients, pointing to malabsorption
and lipid processing failure. Metabolites such as L-tryptophan and
hypoxanthine, consistently elevated in both the present study and
the study by Beyoğlu et al are recognized modulators of
immune and neurological function (37,38).
Additionally, the present study identified gut-origin compounds,
such as indole and deoxycholic acid, which may serve as
intermediaries in gut-liver communication pathways and merit
further mechanistic exploration.
Sustained oxidative stress is widely acknowledged as
a defining feature of advanced-stage liver cirrhosis, where it
contributes to the disruption of epithelial integrity, propagation
of systemic inflammation and dysregulation of immune responses
(39,40). Within this pathological framework,
multiple metabolites uncovered in the present study, including
hypoxanthine, deoxycholic acid and several indole-related
molecules, appear to engage in redox-sensitive processes and
ROS-driven signaling cascades (41-43).
These metabolites not only mirror the prevailing oxidative
imbalance but may also functionally reinforce inflammatory pathways
and enhance intestinal permeability. Their consistent elevation in
fecal profiles of patients with refractory ascites reinforces their
biological relevance and suggests utility as molecular tracers of
gut-liver axis dysfunction. Among the metabolite features showing
significant differential expression in the present study, 10
exhibited outstanding discriminatory accuracy (AUC≥0.93),
indicating promising diagnostic applicability. These molecular
indicators could complement existing clinical practices for the
early identification and stratification of refractory ascites
cases. Building upon prior findings by Beyoğlu et al
(15), the present study
contributes additional gut-associated candidates with putative
roles in modulating redox homeostasis, host metabolism and immune
signaling dynamics.
Unlike prior investigations that often analyzed
microbial or metabolomic dimensions in isolation, the present study
employed a dual-omics strategy to uncover co-occurring disruptions
across both domains. This allowed for direct alignment of taxonomic
and functional microbial traits with associated metabolic readouts,
thereby delivering a more integrative view of gut-liver axis
dysfunction. Such methodological synergy enhances the ability to
identify both mechanistic drivers and therapeutic targets, paving
the way for precision interventions, such as probiotic
formulations, dietary modulation or microbiota transplantation, to
restore microbial equilibrium and improve outcomes.
Despite the contributions of the present study,
certain limitations should be acknowledged. The cross-sectional
design inherently limits causal inference. Although the cohort size
exceeds that of several related studies, broader multi-center
validation is necessary. Additionally, experimental validation via
targeted functional assays or host-microbiome interaction models is
essential to confirm mechanistic interpretations. Future efforts
should also explore targeted modulation of specific microbial
communities, including the role of pathogenic Enterobacteriaceae,
in attenuating disease progression. Intervention-based trials with
dietary fiber, microbiota-derived postbiotics or strain-level
probiotics may offer feasible therapeutic routes. Future directions
should also include longitudinal follow-up, interventional trials
targeting microbiota or metabolism and integration with host
transcriptomic and immunological profiling. Furthermore, adoption
of mNGS and whole-genome metagenomics may refine taxonomic
resolution and uncover rare but clinically relevant taxa. Another
limitation of the present study is the absence of a direct
comparison between cirrhotic patients with ascites and those with
refractory ascites. Such a comparison could provide specific
microbial and metabolic alterations that distinguish refractory
ascites from standard ascites, particularly in terms of fecal
metabolome and microbial function. Future research should include
this comparative approach, which would enhance the understanding of
the mechanisms behind refractory ascites and their resistance to
conventional therapies. Furthermore, the biomarkers and therapeutic
targets identified in the present study require further validation,
and multicenter studies and randomized controlled trials are
essential to confirm their clinical efficacy and applicability.
Moreover, the role of dysbiosis and the increase in opportunistic
pathogens in the progression of refractory ascites, spontaneous
peritonitis and HRS remains insufficiently explored. Future studies
should focus on elucidating the complex interactions within the
gut-liver axis, which may uncover novel diagnostic and therapeutic
targets.
In conclusion, through a combined analysis of gut
microbiota and fecal metabolomics, the present study demonstrated
that individuals with cirrhosis-related refractory ascites harbor
marked disturbances in both microbial ecology and metabolic
regulation. The microbial landscape was notably skewed toward
Gram-negative, potentially pathogenic species, accompanied by a
marked loss of protective anaerobic taxa. These compositional
changes were accompanied by functional alterations in metabolic
pathways implicated in oxidative stress balance, immune system
dynamics and neurotransmitter signaling. Among the identified fecal
metabolites, several showed strong discriminatory capacity,
highlighting their value as potential biomarkers for early
detection and clinical stratification. Together, these insights
emphasize the pivotal role of gut-liver axis disruption in disease
progression and support the development of targeted microbiota or
metabolite-based interventions. Furthermore, the present study
provides a foundation for future research aimed at developing
diagnostic tools and therapeutic interventions, which could
significantly impact clinical practice. The findings provide a
solid scientific basis for advancing translational strategies aimed
at restoring gut homeostasis and improving patient outcomes in
end-stage liver disease.
Acknowledgements
Not applicable.
Funding
Funding: This work was supported by the 8th Talent Base of
Guizhou Province-Qiannan Prefecture Talent Base for Infectious
Disease Prevention and Control (grant no. RCJD2020-67), the
Guangzhou Science and Technology Program (grant no. 202103000060)
and the Science and Technology Fund of Guizhou Provincial Health
Commission (grant no. g2wkj2023-292).
Availability of data and materials
The data generated in the present study may be found
in the Genome Sequence Archive and the OMIX database of the
National Genomics Data Center under accession nos. CRA029925 and
OMIX011954 or at the following URLs: https://ngdc.cncb.ac.cn/gsa/browse/CRA029925 and
https://ngdc.cncb.ac.cn/omix/release/OMIX011954,
respectively.
Authors' contributions
DC was responsible for conceptualization,
methodology and data interpretation, and was a major contributor in
writing the original draft. SL performed the formal analysis, data
curation and visualization and contributed to funding acquisition
and manuscript reviewing and editing. KZ conducted the
investigation and was responsible for resource provision and
experimental validation. KP contributed to data analysis,
experimental validation and manuscript review and editing. LZ
supervised the project, contributed to study design and data
interpretation, and administered the overall study. DS carried out
methodology development, investigation and data curation. JZ
contributed to data visualization and formal analysis. DR was
involved in study conceptualization, critical interpretation of
data and supervised the study. DC and SL confirm the authenticity
of all the raw data. All authors have read and approved the final
version of the manuscript.
Ethics approval and consent to
participate
Ethical approval was granted by the institutional
review board of Qiannan People's Hospital (approval no.
2022-qnzy-18). Written informed consent was obtained from all human
participants.
Patient consent for publication
Not applicable.
Competing interests
The authors declare that they have no competing
interests.
References
|
1
|
Wong F: Management of refractory ascites.
Clin Mol Hepatol. 29:16–32. 2023.PubMed/NCBI View Article : Google Scholar
|
|
2
|
Zhao R, Lu J, Shi Y, Zhao H, Xu K and
Sheng J: Current management of refractory ascites in patients with
cirrhosis. J Int Med Res. 46:1138–1145. 2018.PubMed/NCBI View Article : Google Scholar
|
|
3
|
Zaccherini G, Tufoni M, Iannone G and
Caraceni P: Management of ascites in patients with cirrhosis: An
update. J Clin Med. 10(5226)2021.PubMed/NCBI View Article : Google Scholar
|
|
4
|
Rajesh S, George T, Philips CA, Ahamed R,
Kumbar S, Mohan N, Mohanan M and Augustine P: Transjugular
intrahepatic portosystemic shunt in cirrhosis: An exhaustive
critical update. World J Gastroenterol. 26:5561–5596.
2020.PubMed/NCBI View Article : Google Scholar
|
|
5
|
Debernardi Venon W, Lo Pumo S, Imperatrice
B, Giorgi M, Righi D, Fonio P, Saracco GM and Marzano A:
Transjugular intrahepatic portosystemic shunt in refractory
ascites: Clinical impact of left ventricular diastolic dysfunction.
Eur J Gastroenterol Hepatol. 33 (1S Suppl 1):e464–e470.
2021.PubMed/NCBI View Article : Google Scholar
|
|
6
|
Gu L, Yin X, Cheng Y, Wang X, Zhang M, Zou
X, Wang L, Zhuge Y and Zhang F: Overweight/Obesity increases the
risk of overt hepatic encephalopathy after transjugular
intrahepatic portosystemic shunt in cirrhotic patients. J Pers Med.
13(682)2023.PubMed/NCBI View Article : Google Scholar
|
|
7
|
Tranah TH, Edwards LA, Schnabl B and
Shawcross DL: Targeting the gut-liver-immune axis to treat
cirrhosis. Gut. 70:982–994. 2021.PubMed/NCBI View Article : Google Scholar
|
|
8
|
Usuda H, Okamoto T and Wada K: Leaky gut:
Effect of dietary fiber and fats on microbiome and intestinal
barrier. Int J Mol Sci. 22(7613)2021.PubMed/NCBI View Article : Google Scholar
|
|
9
|
Ma L, Ni Y, Wang Z, Tu W, Ni L, Zhuge F,
Zheng A, Hu L, Zhao Y, Zheng L and Fu Z: Spermidine improves gut
barrier integrity and gut microbiota function in diet-induced obese
mice. Gut Microbes. 12:1–19. 2020.PubMed/NCBI View Article : Google Scholar
|
|
10
|
Guan H, Zhang X, Kuang M and Yu J: The
gut-liver axis in immune remodeling of hepatic cirrhosis. Front
Immunol. 13(946628)2022.PubMed/NCBI View Article : Google Scholar
|
|
11
|
Nishimura N, Kaji K, Kitagawa K, Sawada Y,
Furukawa M, Ozutsumi T, Fujinaga Y, Tsuji Y, Takaya H, Kawaratani
H, et al: Intestinal permeability is a mechanical rheostat in the
pathogenesis of liver cirrhosis. Int J Mol Sci.
22(6921)2021.PubMed/NCBI View Article : Google Scholar
|
|
12
|
Larrue H, Vinel JP and Bureau C:
Management of severe and refractory ascites. Clin Liver Dis.
25:431–440. 2021.PubMed/NCBI View Article : Google Scholar
|
|
13
|
Helil AS, Haile SA, Birhanu Y, Desalegn H,
Desalegn DM, Geremew RA, Gebreyohannes Z, Mohammed A,
Wondimagegnehu DD, Ayana G, et al: Bacterial profile, drug
resistance pattern, clinical and laboratory predictors of ascites
infection in cirrhosis patients. BMC Infect Dis.
24(528)2024.PubMed/NCBI View Article : Google Scholar
|
|
14
|
Han S, Guiberson ER, Li Y and Sonnenburg
JL: High-throughput identification of gut microbiome-dependent
metabolites. Nat Protoc. 19:2180–2205. 2024.PubMed/NCBI View Article : Google Scholar
|
|
15
|
Beyoğlu D, Simillion C, Storni F, De
Gottardi A and Idle JR: A metabolomic analysis of cirrhotic
ascites. Molecules. 27(3935)2022.PubMed/NCBI View Article : Google Scholar
|
|
16
|
Guidelines on the management of ascites
and complications in cirrhosis. Zhonghua Gan Zang Bing Za Zhi.
25:664–677. 2017.(In Chinese).
|
|
17
|
Chen Y, Yang F, Lu H, Wang B, Chen Y, Lei
D, Wang Y, Zhu B and Li L: Characterization of fecal microbial
communities in patients with liver cirrhosis. Hepatology.
54:562–572. 2011.PubMed/NCBI View Article : Google Scholar
|
|
18
|
Althubaiti A: Sample size determination: A
practical guide for health researchers. J Gen Fam Med. 24:72–78.
2023.PubMed/NCBI View
Article : Google Scholar
|
|
19
|
Malik M, Hnatkova K, Batchvarov V, Gang Y,
Smetana P and Camm AJ: Sample size, power calculations, and their
implications for the cost of thorough studies of drug induced QT
interval prolongation. Pacing Clin Electrophysiol. 27:1659–1669.
2004.PubMed/NCBI View Article : Google Scholar
|
|
20
|
Biau DJ, kernéis S and Porcher R:
Statistics in brief: The importance of sample size in the planning
and interpretation of medical research. Clin Orthop Relat Res.
466:2282–2288. 2008.PubMed/NCBI View Article : Google Scholar
|
|
21
|
Weissenborn K: Hepatic encephalopathy:
Definition, clinical grading and diagnostic principles. Drugs. 79
(Suppl 1):S5–S9. 2019.PubMed/NCBI View Article : Google Scholar
|
|
22
|
Biggins SW, Angeli P, Garcia-Tsao G, Ginès
P, Ling SC, Nadim MK, Wong F and Kim WR: Diagnosis, evaluation, and
management of ascites, spontaneous bacterial peritonitis and
hepatorenal syndrome: 2021 practice guidance by the American
Association for the study of liver diseases. Hepatology.
74:1014–1048. 2021.PubMed/NCBI View Article : Google Scholar
|
|
23
|
Delanaye P, Björk J, Courbebaisse M, Couzi
L, Ebert N, Eriksen BO, Dalton RN, Dubourg L, Gaillard F, Garrouste
C, et al: Performance of Creatinine-based equations to estimate
glomerular filtration rate with a methodology adapted to the
context of drug dosage adjustment. Br J Clin Pharmacol.
88:2118–2117. 2022.PubMed/NCBI View Article : Google Scholar
|
|
24
|
Heidrich V, Inoue LT, Asprino PF, Bettoni
F, Mariotti ACH, Bastos DA, Jardim DLF, Arap MA and Camargo AA:
Choice of 16S ribosomal RNA primers impacts male urinary microbiota
profiling. Front Cell Infect Microbiol. 12(862338)2022.PubMed/NCBI View Article : Google Scholar
|
|
25
|
Bharti R and Grimm DG: Current challenges
and best-practice protocols for microbiome analysis. Brief
Bioinform. 22:178–193. 2021.PubMed/NCBI View Article : Google Scholar
|
|
26
|
Kryukov K, Imanishi T and Nakagawa S:
Nanopore sequencing data analysis of 16S rRNA genes using the
GenomeSync-GSTK system. Methods Mol Biol. 2632:215–226.
2023.PubMed/NCBI View Article : Google Scholar
|
|
27
|
Zhang T, Li H, Ma S, Cao J, Liao H, Huang
Q and Chen W: The newest Oxford Nanopore R10.4.1 full-length 16S
rRNA sequencing enables the accurate resolution of species-level
microbial community profiling. Appl Environ Microbiol.
89(e0060523)2023.PubMed/NCBI View Article : Google Scholar
|
|
28
|
Zhang W, Fan X, Shi H, Li J, Zhang M, Zhao
J and Su X: Comprehensive assessment of 16S rRNA gene amplicon
sequencing for microbiome profiling across multiple habitats.
Microbiol Spectr. 11(e0056323)2023.PubMed/NCBI View Article : Google Scholar
|
|
29
|
Bozza S, Nunzi E, Frias-Mazuecos A,
Pieraccini G, Pariano M, Renga G, Mencacci A, Talesa VN, Antognelli
C, Puccetti P, et al: SARS-CoV-2 infection is associated with Age-
and Gender-specific changes in the nasopharyngeal microbiome. Front
Biosci (Landmark Ed). 29(59)2024.PubMed/NCBI View Article : Google Scholar
|
|
30
|
Johnson JS, Spakowicz DJ, Hong BY,
Petersen LM, Demkowicz P, Chen L, Leopold SR, Hanson BM, Agresta
HO, Gerstein M, et al: Evaluation of 16S rRNA gene sequencing for
species and Strain-level microbiome analysis. Nat Commun.
10(5029)2019.PubMed/NCBI View Article : Google Scholar
|
|
31
|
Sanschagrin S and Yergeau E:
Next-generation sequencing of 16S ribosomal RNA gene amplicons. J
Vis Exp: 51709, 2014 doi: 10.3791/51709.
|
|
32
|
Shi P, Liu J, Liang A, Zhu W, Fu J and Wu
X, Peng Y, Yuan S and Wu X: Application of metagenomic
next-generation sequencing in optimizing the diagnosis of ascitic
infection in patients with liver cirrhosis. BMC Infect Dis.
24(503)2024.PubMed/NCBI View Article : Google Scholar
|
|
33
|
Shi YJ, Sheng KW, Zhao HN, Liu C and Wang
H: Toll-like receptor 2 deficiency exacerbates dextran sodium
sulfate-induced intestinal injury through Marinifilaceae-dependent
attenuation of cell cycle signaling. Front Biosci (Landmark Ed).
29(338)2024.PubMed/NCBI View Article : Google Scholar
|
|
34
|
Gitto S, Vizzutti F, Baldi S, Campani C,
Navari N, Falcini M, Venturi G, Montanari S, Roccarina D, Arena U,
et al: Transjugular intrahepatic Porto-systemic shunt positively
influences the composition and metabolic functions of the gut
microbiota in cirrhotic patients. Dig Liver Dis. 55:622–628.
2023.PubMed/NCBI View Article : Google Scholar
|
|
35
|
Beyoğlu D, Popov YV and Idle JR: The
metabolomic footprint of liver fibrosis. Cells.
13(1333)2024.PubMed/NCBI View Article : Google Scholar
|
|
36
|
Singh R, Zogg H, Wei L, Bartlett A,
Ghoshal UC, Rajender S and Ro S: Gut microbial dysbiosis in the
pathogenesis of gastrointestinal dysmotility and metabolic
disorders. J Neurogastroenterol Motil. 27:19–34. 2021.PubMed/NCBI View Article : Google Scholar
|
|
37
|
Seo SK and Kwon B: Immune regulation
through tryptophan metabolism. Exp Mol Med. 55:1371–1379.
2023.PubMed/NCBI View Article : Google Scholar
|
|
38
|
Ye J, Bi X, Deng S, Wang X, Liu Z, Suo Q,
Wu J, Chen H, Wang Y, Qian K, et al: Hypoxanthine is a metabolic
biomarker for inducing GSDME-dependent pyroptosis of endothelial
cells during ischemic stroke. Theranostics. 14:6071–687.
2024.PubMed/NCBI View Article : Google Scholar
|
|
39
|
Roehlen N, Crouchet E and Baumert TF:
Liver fibrosis: Mechanistic concepts and therapeutic perspectives.
Cells. 9(875)2020.PubMed/NCBI View Article : Google Scholar
|
|
40
|
Sak JJ, Prystupa A, Bis-Wencel H, Kiciński
P, Luchowska-Kocot D, Krukowski H, Nowicki GJ and Panasiuk L:
Oxidative stress-induced growth inhibitor 1 in alcohol-induced
liver cirrhosis. Ann Agric Environ Med. 28:676–680. 2021.PubMed/NCBI View Article : Google Scholar
|
|
41
|
Blachier F: Metabolism of dietary
substrates by intestinal bacteria and consequences for the host
intestine. In: Metabolism of alimentary compounds by the intestinal
microbiota and health. Springer, pp45-144, 2023.
|
|
42
|
Alonso-Peña M, Espinosa-Escudero R,
Herraez E, Briz O, Cagigal ML, Gonzalez-Santiago JM, Ortega-Alonso
A, Fernandez-Rodriguez C, Bujanda L, Calvo Sanchez M, et al:
Beneficial effect of ursodeoxycholic acid in patients with acyl-CoA
oxidase 2 (ACOX2) deficiency-associated hypertransaminasemia.
Hepatology. 76:1259–1274. 2022.PubMed/NCBI View Article : Google Scholar
|
|
43
|
Guan Z, Li Y, Hu S, Mo C, He D, Huang Z
and Liao M: Screening and identification of differential
metabolites in serum and urine of bamaxiang pigs bitten by
trimeresurus stejnegeri based on UPLC-Q-TOF/MS metabolomics
technology. J Toxicol Sci. 47:389–407. 2022.PubMed/NCBI View Article : Google Scholar
|