Introduction
Diffusion-weighted imaging (DWI) of the brain is
routinely used for the early detection and characterization of
cerebral stroke (1). Due to its
exquisite sensitivity to motion, the execution of DWI of the
abdomen has until recently faced numerous obstacles. With the
advent of the echo-planar magnetic resonance imaging (MRI)
technique (2–5), diffusion-weighted MRI of the abdomen
over a short time interval has become possible, minimizing the
effect of physiologic motion such as respiration and cardiac
movement. MRI is commonly used in cancer therapy to determine the
involvement of macroscopic structures for tumor detection and
staging. Techniques for evaluating the characteristics of tumors,
such as endoscopic ultrasound, are usually invasive, and are
therefore not included in routine examinations. A non-invasive
method that provides necessary information, such as location and
tumor characteristics, may involve the measurement of water proton
mobility using DWI.
Patients with esophageal cancer have a poor
prognosis, since most tumors are at an advanced stage at the time
of diagnosis, which is usually the time of onset of symptoms.
Resection is the only curative method for esophageal cancer, but is
limited to early-stage disease. Therefore, early diagnosis and
accurate staging are crucial to determine the possibility of
surgery. Accurate tumor staging is also critical for the selection
of therapy and the prediction of prognosis.
Various tissues have unique diffusion
characteristics determined using the apparent diffusion coefficient
(ADC). Tumor structure is known to change as a cancer grows and
advances in stage. Folpe et al reported that this change in
tumor structure may be reflected in clinical imaging (6). However, the relationship between ADC
values and clinical findings or the stages of esophageal tumors is
unclear. In this study, we assessed the progression of esophageal
squamous cell carcinoma using DWI by monitoring changes in tumor
diffusion, which reflect changes in interstitial water volume and
cellular permeability.
The purpose of this study was to assess the
correlation between clinical status (tumor diameter, serum tumor
marker values and TNM staging) and ADC values calculated by DWI in
cases of esophageal squamous cell carcinoma (ESCC). The ADC value
of the tumors was compared to the standardized uptake value (SUV)
of 18F-fluorodeoxyglucose-positron emission tomography
(FDG-PET).
Materials and methods
Patient population
A total of 123 patients (107 men, 16 women; mean age
65.4±7.7 years; range 44–82 years), admitted to our institution
between January 2006 and March 2008 were enrolled in the study. All
patients had primary SCC of the thoracic esophagus,
histopathologically diagnosed using endoscopic biopsy or surgical
resection specimens. Of the patients, 31 patients underwent
curative esophagectomy, 84 were treated by radiotherapy,
chemotherapy or both, and 8 were not treated. A detailed
examination was performed by esophagoscopy, endoscopic ultrasound,
multi-detector row computed tomography (MDCT), esophagography and
FDG-PET. Endoscopic ultrasound and esophagography are superior for
the diagnosis of early-stage esophageal cancer, while MDCT is
superior for advanced-stage cancer. The clinical stages of the 123
patients were determined according to the International TNM
classification (7): T1, 21
patients; T2, 10; T3, 47; T4, 45; N0, 28; N1, 95; and stage I, 18;
stage II, 16; stage III, 52; and stage IV, 37. Serum levels of the
tumor markers SCC antigen, carcinoembryonic antigen (CEA) and CYFRA
were also determined.
Informed consent according to the Declaration of
Helsinki was obtained from all patients prior to treatment. The
study was approved and carried out according to the guidelines for
clinical research of our institutional review boards.
Diffusion-weighted imaging
MRI was performed using a 1.5-Tesla body scanner
equipped with a phased array body coil (Achiva 1.5T Nova Dual;
Philips Medical, Best and Heeren, The Netherlands). Images were
obtained in the following sequences: a single-shot spin-echo type
of echo-planar sequence was used to obtain DWI; fat signals were
suppressed using short-tau inversion recovery (8). The b-values corresponding to
diffusion-sensitizing gradients were b=0 and 1,000
sec/mm2. Sequential sampling of the k-space was used
with an effective echo time and an acquisition matrix of 128×128,
which was interpolated to 256×256 during image calculation. Forty
consecutive slices from the clavicle to the diaphragm were acquired
to cover the entire tumor with a 400-mm field of view, a 4-mm slice
thickness and a 1-mm slice gap. DWI was performed in 7 min with
free breathing scanning. Before DWI, T2-weighted images
were obtained in the transverse plane. T2-weighted fast
spin-echo images were obtained with the following parameters: TR/TE
3000/75, train length of 15; acquisition of four signals, 192×256
matrices, 32-cm field of view and 8-mm section thickness. The
number of excitations was six to average the motion artifacts.
There were no differences in image quality depending on the
location. The patients that did not receive pre-treatment underwent
examination 1 week prior to surgery.
To minimize esophageal movement, a minimum of 6 h of
fasting with no restrictions on drinking water was required before
the examination. Immediately before the examination, 20 mg of
N-butyl scopolamine bromide was administered by intramuscular
injection.
Image analysis
The ADC map of each slice was generated on a
pixel-by-pixel basis from the signal intensity of the DWI images
and the corresponding b-values based on the equation: ADC = log
S(0) − log S(1,000).
A natural logarithm was used in which S(b)
represented the signal intensity with the diffusion gradient, S(0)
the signal intensity without the diffusion gradient and b the
gradient factor (in sec/mm2) of the used pulse sequence
as a measure of strength of the diffusion gradient. Regions of
interest were established in each lesion on the mapping images. ADC
maps were calculated and transferred to a remote PC workstation
(Aze Virtual Place Advanced Plus, Japan).
The regions of interest were drawn on DWI by two
investigators experienced in MRI for 10 and 19 years, respectively.
Tumor locations were defined based on MDCT, esophagography,
esophagoscopy and MRI (T2WI and DWI). The representative
area of the tumor was determined according to the irregularity of
the wall layer, tumor density and difference in intensity compared
to the surrounding area. Due to excellent fat suppression with
background body-signal suppression, fat around the esophagus had a
very low signal on DWI. An ADC value was obtained from 10 regions
of interest from different axial section levels of the same lesion.
All regions of interest were placed within the lesions and traced
on the ADC maps. The ADC values then were measured using the ADC
maps. The image quality of the DWI and the acquired ADC maps were
sufficient to identify the tumor region in all patients. The ADC
values were compared to tumor diameter, the serum tumor marker
value, the SUV of FDG-PET and TNM stage.
Statistical analysis
Spearman-rank correlations were used to assess the
relationship between ADC values and tumor diameter, serum tumor
markers and SUV of the FDG-PET. We measured the tumor diameter
using esophagography. The Kruskal-Wallis test was used for overall
comparison, and the Mann-Whitney U test was used for comparison
between two groups (for example, between the ADC values of cancer
tissue and normal esophagus) and Dunn’s multiple comparison test.
The cutoff value was set according to receiver operating
characteristic (ROC) analysis. The differences were considered
significant when P-values were <0.05. All statistical analyses
were performed using GraphPad Prism software (La Jolla, CA, USA).
The values are expressed as the mean ± standard deviation (SD).
Results
Clinical characteristics of tumors and
ADC values
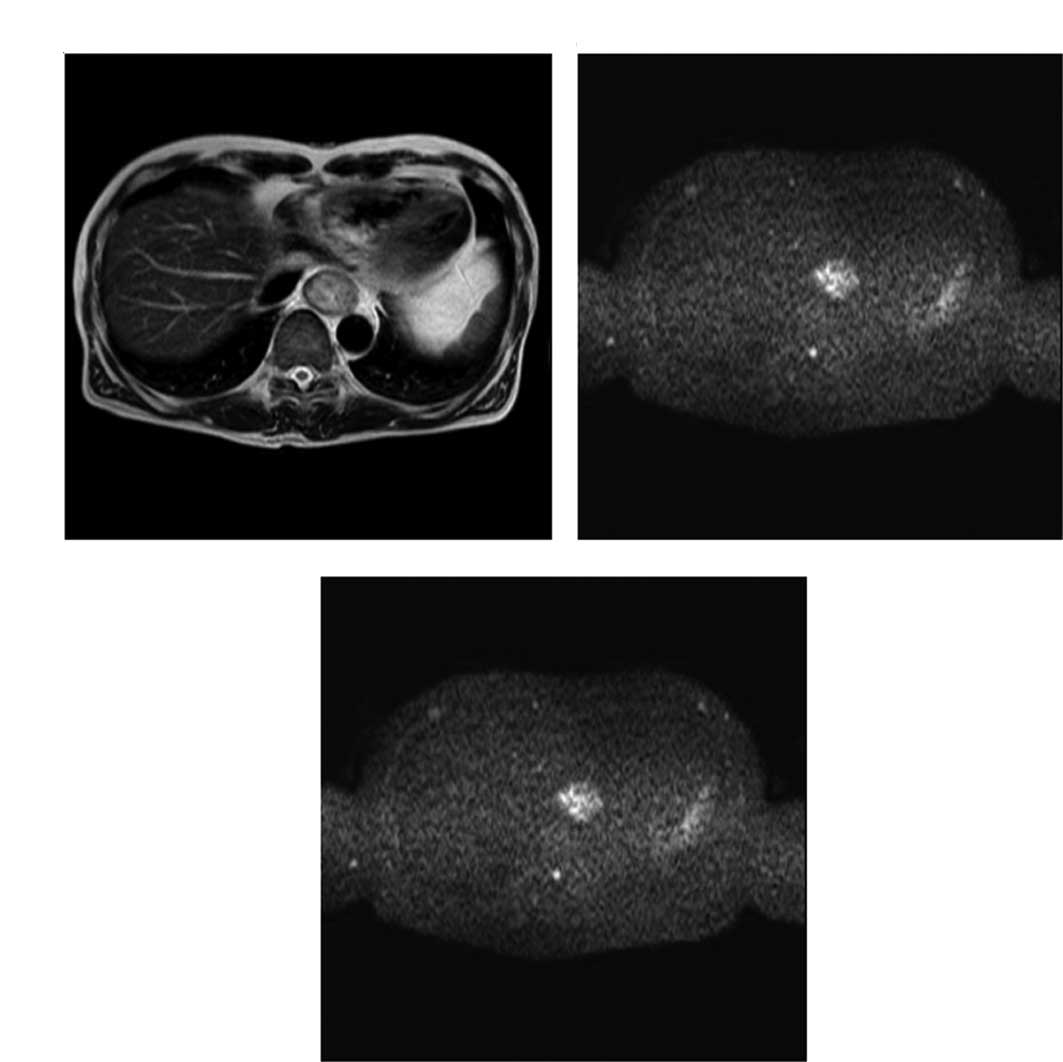
Representative T2- and diffusion-weighted
images are shown in Fig. 1A and B;
a representative ADC map is shown in Fig. 1C.
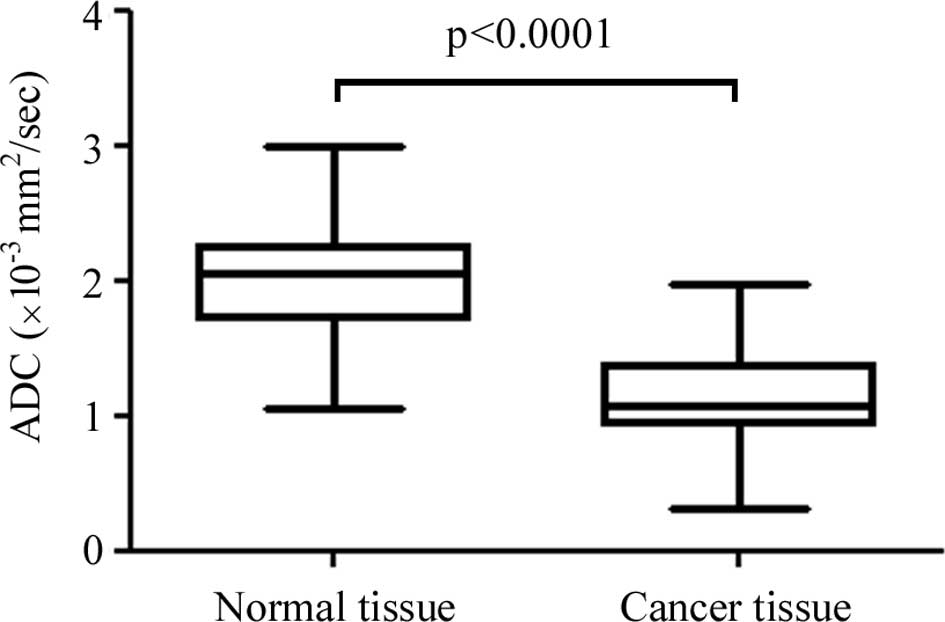
The ADC values of the cancer tissue were
significantly lower than those of the normal esophagus
(1.145±0.321×10⁻³ vs. 2.001±0.385×10⁻³
mm2/sec, respectively; P<0.0001) (Fig. 2). ROC analysis was performed to
establish a statistical standard to diagnose the cancer or normal
tissue. According to ROC analysis, the cutoff value was set at
1.5×10⁻³ mm2/sec, the sensitivity was 92%,
the specificity 86% and the accuracy 89%.
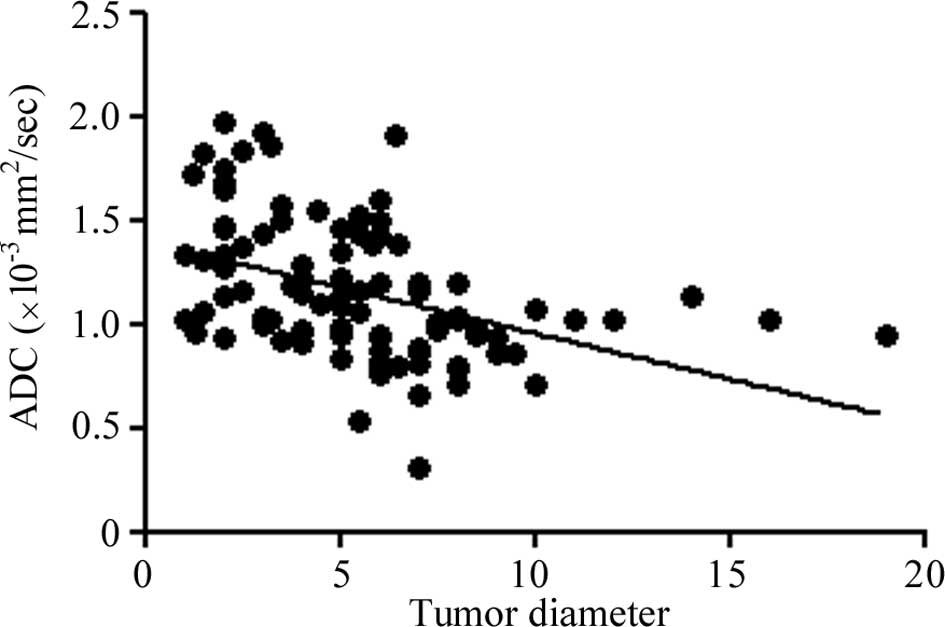
The ADC values were compared to the clinical tumor
characteristics, tumor diameter, serum levels of tumor markers and
the SUV of FDG-PET. The ADC value decreased as the tumor advanced
in stage. A negative correlation was found between the ADC values
of the tumors and tumor diameter (R2=0.1859,
P<0.0001; Fig. 3).
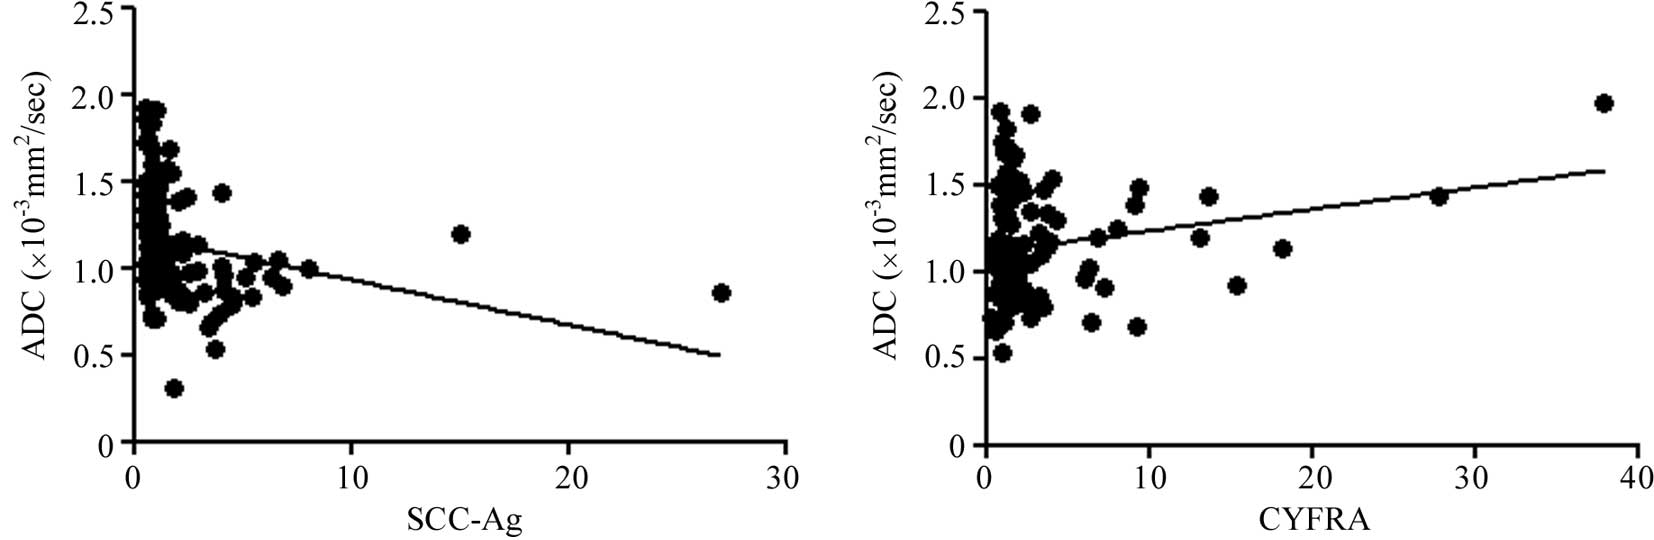
Regarding the tumor markers, a negative correlation
was also noted between the ADC of the tumors and SCC antigen
(R2=0.0646, P=0.0074) and CYFRA (R2=0.0445,
P=0.0341). However, a significant correlation with serum CEA was
not observed (R2=0.0133 and P=0.6990, respectively)
(Fig. 4).
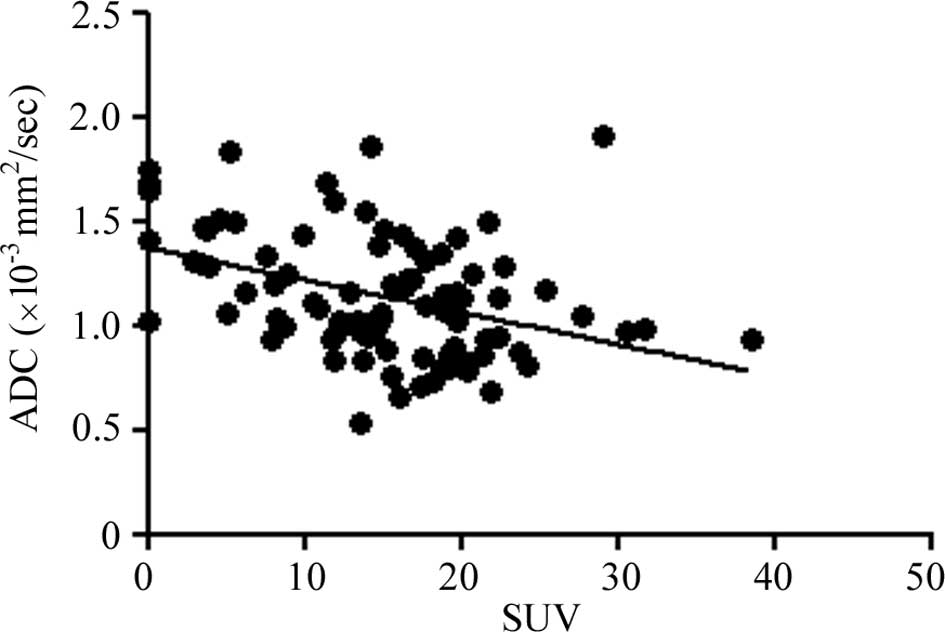
The SUV of FDG-PET showed a negative correlation
with ADC (R2=0.1581, P<0.0001; Fig. 5). The SUV of FDG-PET presented
maximum values of the tumors.
Clinical TNM staging and ADC value
The ADC values between the cancer samples and
different clinical TNM stages were compared. The ADC values of
clinical (c)T1, 2, 3 and 4 were 1.443±0.247, 1.439±0.375,
1.074±0.246 and 1.016±0.287×10⁻³ mm2/sec,
respectively. The ADC of cT1 tumors was significantly higher than
that of cT3 (P<0.05) and cT4 (P<0.05) tumors, while the ADC
value of cT2 tumors was higher than cT3 (P<0.05) and T4
(P<0.05) tumors (Table I).
Additionally, the ADC of tumors of cN0 was higher than that of cN1
tumors (1.390±0.293 and 1.073±0.294×10⁻³
mm2/sec, respectively; P<0.0001) (Table I). The ADC values of cStages I, II,
III and IV were 1.443±0.328, 1.347±0.333, 1.062±0.253 and
1.030±0.307×10⁻³ mm2/sec, respectively. ADC
values of advanced-stage tumors were significantly lower than those
early-stage tumors, and a significant difference between cStage I
and III (P<0.05), I and IV (P<0.05), II and III (P<0.05)
and II and IV (P<0.05) was observed (Table I).
 | Table I.Clinical TNM staging and the ADC
value. |
Table I.
Clinical TNM staging and the ADC
value.
| Clinical
findings | ADC (×10−3
mm2/sec) | P-value |
|---|
| Tumor depth | | <0.0001a |
| cT1 | 1.443±0.247 | |
| cT2 | 1.439±0.375 | |
| cT3 | 1.074±0.246 | |
| cT4 | 1.016±0.287 | |
| Node metastasis | | <0.0001b |
| cN0 | 1.390±0.293 | |
| cN1 | 1.030±0.307 | |
| TNM stages | | <0.0001a |
| cT1 | 1.443±0.328 | |
| cT2 | 1.347±0.333 | |
| cT3 | 1.062±0.253 | |
| cT4 | 1.030±0.307 | |
Discussion
By applying a pair of strong magnetic field gradient
pulses within the imaging sequence, imaging is sensitized to random
spin displacements of diffusing free water molecules (1,9). ADC
values are calculated from DWI measurements, and depend on the
impediment of the free diffusion of water molecules in a single
voxel due to restricting barriers, such as membranes,
macromolecules and fibers inside different tissue compartments.
Therefore, DWI has been suggested as a tool to distinguish
different tissue compartments and to detect changes in cellular
tissue structure, which are used to monitor the effects of
radiation in tumor tissue. Various tissues have unique diffusion
characteristics as measured using ADC. We did not perform a
perfusion study of the tumors since, according to De Vries et
al, there was no apparent association between changes in the
ADC values and perfusion data obtained for the same patients
(10). The ADC value seemed to
represent mainly changes in water molecule mobility.
DWI and ADC mapping in the radiologic diagnosis of
neoplasms was initially suggested to be useful for the analysis of
the central nervous system, and the difference in tissue diffusion
was thought to depend on the difference in the structure of the
tumor tissue (11–16). There have been few reports of DWI
applied to the gastrointestinal tract. Some reports have been
published on DWI in colorectal cancer (17–19),
but DWI in esophageal cancer has only been reported once (20). The reason for this may be that the
esophagus is surrounded by air in the lung, and the MR images are
greatly distorted since the uniformity of the magnetic field is
disturbed. Recent improvements and the introduction of DWI with
background body signal suppression allows for the acquisition of
satisfactory DWI of the esophagus. In this study, we confirmed that
DWI was useful for detecting esophageal cancer, despite respiratory
and cardiac motion.
The tissue ADC value is thought to be based mainly
on independent contributions of the extracellular and intracellular
tissue compartments (21,22). Due to the larger volume content of
relatively impermeable impeding barriers, such as cell and matrix
fibers, lower ADC values have been observed in the intracellular
compartment (23). Thus, changes
in ADC value are thought to reflect changes in the extracellular
volume (ECV)/intracellular volume (ICV) ratio; increased ICV
ultimately leads to a lower ADC value. The ADC value is a reference
for restrictions in molecular diffusion caused by structures,
allowing inferences to be made about the microstructure of the
cellular environment. In other words, the ADC value reflects
cellularity and cell density. The minimum ADC value of high-grade
gliomas was reported to be lower than that of low-grade gliomas
(14). Published data on
intracranial tumors indicate that a high ADC value may be
attributable to low cellularity, while lower values are
attributable to dense and high cellularity (15,16).
In this study, we measured ADC values in viable
areas of esophageal cancer, excluding necrotic areas identified by
esophagoscopy and enhanced MDCT, since the viable area of the
cancer tissue is what reflects the malignant potential, clinically
manifested as growth in size, an increased serum tumor marker
level, increased SUV and advanced TNM stage. However, visible
necrotic areas were rarely found, and the microscopic necrotic
areas were not excluded. The ADC values of the normal esophagus
were higher than that of the cancer tissue.
We found a negative correlation between the ADC
values and tumor diameter, the SUV of the FDG-PET, serum SCC
antigen and CYFRA levels, and the clinical staging of ESCC. Many
studies have suggested an independent association between SUV and
proliferative activity or cellularity in SCC (24–27).
Higher cellularity was noted in advanced ESCC, with extensive
infiltration and increased lymph node involvement, and higher
malignant potential. SCC-Ag concentration and SCC-Ag positivity
rates in ESCC are known to be significantly elevated in patients
with advanced-stage tumors. SCC-Ag concentrations and SCC-Ag
positivity rates were found to be significantly elevated in tumors
with increased size, tumor depth, positive lymph node metastasis
and distant metastasis (28). We
compared ADC values between cancers and different clinical TNM
stages. The ADC values of clinical T and N stages decreased with
increasing clinical stage. Advanced-stage tumors were anticipated
to have high cellularity, thus we interpreted that the ADC values
had a negative correlation among clinical stages. According to the
variance of measured ADC values, 10 ROIs per lesion were measured
by two investigators with extensive experience in MRI. The ADC
values of one lesion per person tended to be similar. Therefore, we
regarded possible image artifacts and measurement errors as
minimal.
In conclusion, this study showed that the
calculation of ADC values using DWI is useful for assessing the
stage of ESCC, since the ADC values corresponded to clinical
findings such as tumor diameter, serum tumor marker levels and
clinical T and N stages. Further study of non-invasive radiological
assessment is required to improve the management of malignant
tumors by predicting response to therapy with optimum
characterization of the tumor.
DWI enables the visualization of changes in
molecular diffusion within tissues related to ESCC progression.
Moreover, it is a valuable modality, as there is no exposure to
radiation, the examination duration is short and the test is
relatively inexpensive. There are many diagnostic imaging methods,
but we often use MDCT, esophagography, esophagoscopy, endoscopic
ultrasound, MRI and FDG-PET for clinical staging. MDCT, FDG-PET and
esophagography are associated with exposure to radiation and
contrast agents, and endoscopic ultrasound and esophagoscopy are
invasive methods of diagnosis. For these reasons, this non-invasive
modality may be an appropriate method for screening malignancies,
and a substitute for FDG-PET. To the best of our knowledge, there
are no prior reports on DWI in esophageal cancer, while only a few
on rectal cancer in response to treatment can be found (17,18).
In conclusion, DWI may be used as a valid clinical imaging modality
to evaluate the malignant potential of ESCC.
References
|
1.
|
Mori S and Barker PB: Diffusion magnetic
resonance imaging: its principle and applications. Anat Rec.
257:102–109. 1999. View Article : Google Scholar : PubMed/NCBI
|
|
2.
|
Butts K, Riederer SJ, Ehman RL, Felmlee JP
and Grimm RC: Echo-planar imaging of the liver with a standard MR
imaging system. Radiology. 189:259–264. 1993. View Article : Google Scholar : PubMed/NCBI
|
|
3.
|
Edelman RR, Wielopolski P and Schmitt F:
Echo-planar MR imaging. Radiology. 192:600–612. 1994. View Article : Google Scholar : PubMed/NCBI
|
|
4.
|
Muller MF, Prasad P, Siewert B, Nissenbaum
MA, Raptopoulos V and Edelman RR: Abdominal diffusion mapping with
use of a whole-body echo-planar system. Radiology. 190:475–478.
1994. View Article : Google Scholar : PubMed/NCBI
|
|
5.
|
Keogan MT and Edelman RR: Technologic
advances in abdominal MR imaging. Radiology. 220:310–320. 2001.
View Article : Google Scholar : PubMed/NCBI
|
|
6.
|
Folpe AL, Lyles RH, Sprouse JT, Conrad EU
III and Eary JF: (F-18) fluorodeoxyglucose positron emission
tomography as a predictor of pathologic grade and other prognostic
variables in bone and soft tissue sarcoma. Clin Cancer Res.
6:1279–1287. 2000.
|
|
7.
|
Sobin LH and Fleming ID: TNM
Classification of Malignant Tumors, 5th edition (1997). Union
Internationale Contre le Cancer and the American Joint Committee on
Cancer. Cancer. 80:1803–1804. 1997. View Article : Google Scholar
|
|
8.
|
Takahara T, Imai Y, Yamashita T, Yasuda S,
Nasu S and van Cauteren M: Diffusion weighted whole body imaging
with background body signal suppression (DWIBS): technical
improvement using free breathing, stir and high resolution 3D
display. Radiat Med. 22:275–282. 2004.PubMed/NCBI
|
|
9.
|
Eo S and Je T: Spin diffusion
measurements: spin echoes in the presence of time-dependent field
gradients. J Chem Phys. 42:288–292. 1965. View Article : Google Scholar
|
|
10.
|
De Vries A, Griebel J, Kremser C, et al:
Monitoring of tumor microcirculation during fractionated radiation
therapy in patients with rectal carcinoma: preliminary results and
implications for therapy. Radiology. 217:385–391. 2000.
|
|
11.
|
Hayashida Y, Hirai T, Morishita S, et al:
Diffusion-weighted imaging of metastatic brain tumors: comparison
with histologic type and tumor cellularity. AJNR Am J Neuroradiol.
27:1419–1425. 2006.PubMed/NCBI
|
|
12.
|
Mardor Y, Pfeffer R, Spiegelmann R, et al:
Early detection of response to radiation therapy in patients with
brain malignancies using conventional and high b-value
diffusion-weighted magnetic resonance imaging. J Clin Oncol.
21:1094–1100. 2003. View Article : Google Scholar
|
|
13.
|
Asao C, Korogi Y, Kitajima M, et al:
Diffusion-weighted imaging of radiation-induced brain injury for
differentiation from tumor recurrence. AJNR Am J Neuroradiol.
26:1455–1460. 2005.PubMed/NCBI
|
|
14.
|
Yang D, Korogi Y, Sugahara T, et al:
Cerebral gliomas: Prospective comparison of multivoxel 2D
chemical-shift imaging proton MR spectroscopy, echoplanar perfusion
and diffusion-weighted MRI. Neuroradiology. 44:656–666. 2002.
View Article : Google Scholar
|
|
15.
|
Tien RD, Felsberg GJ, Friedman H, Brown M
and MacFall J: MR imaging of high-grade cerebral gliomas: value of
diffusion-weighted echoplanar pulse sequences. AJR Am J Roentgenol.
162:671–677. 1994. View Article : Google Scholar : PubMed/NCBI
|
|
16.
|
Sugahara T, Korogi Y, Kochi M, et al:
Usefulness of diffusion-weighted MRI with echo-planar technique in
the evaluation of cellularity in gliomas. J Magn Reson Imaging.
9:53–60. 1999. View Article : Google Scholar : PubMed/NCBI
|
|
17.
|
Dzik-Jurasz A, Domenig C, George M, et al:
Diffusion MRI for prediction of response of rectal cancer to
chemoradiation. Lancet. 360:307–308. 2002. View Article : Google Scholar : PubMed/NCBI
|
|
18.
|
Hein PA, Kremser C, Judmaier W, et al:
Diffusion-weighted magnetic resonance imaging for monitoring
diffusion changes in rectal carcinoma during combined, preoperative
chemoradiation: preliminary results of a prospective study. Eur J
Radiol. 45:214–222. 2003. View Article : Google Scholar
|
|
19.
|
Kremser C, Judmaier W, Hein P, Griebel J,
Lukas P and de Vries A: Preliminary results on the influence of
chemoradiation on apparent diffusion coefficients of primary rectal
carcinoma measured by magnetic resonance imaging. Strahlenther
Onkol. 179:641–649. 2003. View Article : Google Scholar
|
|
20.
|
Sakurada ATT, Kwee TC, Yamashita T, Nasu
S, Horie T, van Cauteren M and Imai Y: Diagnostic performance of
diffusion-weighted magnetic resonance imaging in esophageal cancer.
Eur Radiol. 19:1461–1469. 2009. View Article : Google Scholar : PubMed/NCBI
|
|
21.
|
Gideon P, Sorensen PS, Thomsen C,
Stahlberg F, Gjerris F and Henriksen O: Increased brain water
self-diffusion in patients with idiopathic intracranial
hypertension. AJNR Am J Neuroradiol. 16:381–387. 1995.PubMed/NCBI
|
|
22.
|
Szafer A, Zhong J and Gore JC: Theoretical
model for water diffusion in tissues. Magn Reson Med. 33:697–712.
1995. View Article : Google Scholar
|
|
23.
|
Duong TQ, Ackerman JJ, Ying HS and Neil
JJ: Evaluation of extra- and intracellular apparent diffusion in
normal and globally ischemic rat brain via 19F NMR. Magn Reson Med.
40:1–13. 1998. View Article : Google Scholar : PubMed/NCBI
|
|
24.
|
Haberkorn U, Strauss LG, Reisser C, et al:
Glucose uptake, perfusion, and cell proliferation in head and neck
tumors: relation of positron emission tomography to flow cytometry.
J Nucl Med. 32:1548–1555. 1991.PubMed/NCBI
|
|
25.
|
Jacob R, Welkoborsky HJ, Mann WJ, Jauch M
and Amedee R: [Fluorine-18]fluorodeoxyglucose positron emission
tomography, DNA ploidy and growth fraction in squamous-cell
carcinomas of the head and neck. ORL J Otorhinolaryngol Relat Spec.
63:307–313. 2001.
|
|
26.
|
Kitagawa Y, Sano K, Nishizawa S, et al:
FDG-PET for prediction of tumour aggressiveness and response to
intra-arterial chemotherapy and radiotherapy in head and neck
cancer. Eur J Nucl Med Mol Imaging. 30:63–71. 2003. View Article : Google Scholar : PubMed/NCBI
|
|
27.
|
Minn H, Joensuu H, Ahonen A and Klemi P:
Fluorodeoxyglucose imaging: a method to assess the proliferative
activity of human cancer in vivo. Comparison with DNA flow
cytometry in head and neck tumors. Cancer. 61:1776–1781. 1988.
View Article : Google Scholar : PubMed/NCBI
|
|
28.
|
Shimada H, Nabeya Y, Okazumi S, et al:
Prediction of survival with squamous cell carcinoma antigen in
patients with resectable esophageal squamous cell carcinoma.
Surgery. 133:486–494. 2003. View Article : Google Scholar : PubMed/NCBI
|