Introduction
Measurements of hepatitis B virus (HBV) DNA levels
are routinely used to identify infectious, chronic carriers and to
predict and monitor efficacies of antiviral treatment regimens
(1–4). In addition, when serological testing
could be inconclusive for the diagnosis of a HBV infection (e.g.,
due to the presence of genetic variants of HBV), the detection of
HBV DNA may help to resolve these uncertainties (5). In recent years, real-time polymerase
chain reaction (PCR) has been widely accepted as the gold standard
for quantification of viral nucleic acids due to its improved
speed, sensitivity and reproducibility, and its reduced risk of
contamination (6,7). In the present study, we developed and
evaluated a sensitive locked nucleic acid (LNA) real-time PCR probe
for the accurate detection of HBV in plasma or serum samples, and
compared it with the TaqMan probe.
Materials and methods
Samples
For the present study, a total of 39 human serum
samples were obtained from chronic hepatitis B patients, which were
previously assayed by enzyme-linked immunosor-bent assay (ELISA)
(Kehua, Shanghai, China) at the Clinical Laboratory Qingdao Medical
School Affiliated Hospital (China). The clinical serum samples were
divided into 3 groups: group I contained 15 cases with hepatitis B
surface antigen (HBsAg) (+) alone; group II contained 10 cases with
HBsAg (+), HBeAg (+) and HBc (+); and group III contained 14 cases
with HBsAg (+), HBeAb (+) and HBc (+). A further 19 cases of normal
serum were obtained from volunteers. All samples were stored at
−20°C until use.
Human cytomegalovirus-, herpes simplex virus-,
hepatitis A virus-, hepatitis C virus- and human immunodeficiency
virus type 1 (HIV-1)-positive specimens, as well as human genomic
DNA were used to determine the specificity provided by the Shandong
Provincial Key Laboratory of Molecular Virology (China).
Primers and probes
The primers (P1, P2) and probes were selected from
the X gene of the HBV genome (GenBank ID: NC-00962), which
generated a product of 114 bp. The primer and probe sequences are
provided for LNA and TaqMan real-time PCR in Table I.
 | Table I.Primers and probes for the detection
of HBV by real-time PCR. |
Table I.
Primers and probes for the detection
of HBV by real-time PCR.
| Primers/probes | Sequence | Bases | Tm (°C) | Manufacturer |
|---|
| P1 |
GACCACCAAATGCCCCTAT | 19 | 55 | Shanghai Biotech
Inc. |
| P2 |
CCRAGAYYGAGATCTTCTGCGAC | 23 | 53 | Shanghai Biotech
Inc. |
| LNAa | FAM-TCGTCTAACAACAGT-BHQ1 | 15 | 66 | Takara |
| TaqMan |
FAM-TCGTCTAACAACAGT(TAMMRA) | | | Shanghai Biotech
Inc. |
|
AGTTTCCGGAAGTGT-P | 30 | 64 | |
In-house HBV DNA standard
We constructed the recombinant plasmid pUCm-T-HBV
containing the HBV X gene region. The HBV plasmid DNA was isolated
using the Takara MiniBEST Plasmid Purification Kit (Takara, Dalian,
China). The extracted DNA was examined with ultraviolet (UV)
spectrometry, and DNA samples with a UV reading A260:A280 ratio in
the range of 1.6 to 1.8 were retained for use. The purified
recombinant plasmid pUCm-T-HBV concentration was tested in
triplicate (in parallel) with HBV DNA reference standards
(3.83x10³, 2.69x10⁴, 1.33x10⁵,
3.53x10⁶ and 1.33x10⁷ IU/ml; Beijing Control
& Standards Biotechnology Co., Ltd; China). The standards were
tested in duplicate in order to generate the standard curve.
Following quantification, the HBV plasmid was serially diluted
10-fold from 40 to 4x10⁷ IU/ml, and 2 μl of each diluted
HBV plasmid were used as PCR templates.
HBV DNA extraction
The DNA was extracted using the polyethylene glycol
(PEG) precipitation method. A total of 100 μl of serum or plasma
was mixed with 100 μl of extraction I followed by centrifugation of
the mixture at 13,000 x g for 10 min. The supernatant was removed
and discarded. A total of 25 ml of extraction II was added to the
pellet, mixed well and boiled for 10 min. The boiled samples were
then spun down at 13,000 x g for 10 min and 2 μl supernatant was
used as the PCR template.
LNA real-time PCR probe examination
Real-time PCR was performed with 40 μl PCR mixture
[200 nM of each primer; 75 nM LNA probe; 200 μM of dGTP, dATP and
dCTP; 400 μM dUTP; 3.5 mM MgCl2; 2 U of HotStarTaq DNA
polymerase (Takara); 0.5 U uracil DNA glycosylase (UDG; MBI
Fermentas, Burlington, ON, Canada) and 2 μl DNA sample]. The
amplification was performed in the iCycler iQ5 (Bio-Rad, Hercules,
CA, USA), and the protocol was as follows: initial activation of
UDG at 37°C for 5 min; UDG inactivation; activation of HotStarTaq
DNA polymerase and template denaturation at 95°C for 3 min; 40
cycles in two steps: 95°C for 5 sec, 60°C for 30 sec. For each
cycle, standard curves were created in the range of
40-4x10⁷ IU/ml by 1:10 serial dilutions of the
pUCm-T-HBV standard, and all samples were run in duplicate.
Standard curves were created by using the threshold cycle (Ct) as
the Y axis and the log of HBV DNA concentration as the X axis. The
potential sample was examined using Ct values corresponding to HBV
DNA.
TaqMan real-time PCR probe
examination
The PCR protocol was the same as the LNA probe
real-time PCR examination; however, a 200 nM TaqMan probe was used
instead of a 75 nM LNA probe.
Data analysis and statistics
The Ct values and amplification data were analyzed
using the Bio-Rad iQ5 optical system software version 2.0
(Bio-Rad). Data were collected at the extension step of every
cycle, and Ct values were determined with the PCR baseline
subtracted curve fit analysis method using fluorescein-normalized
data. A standard curve was created automatically with the Bio-Rad
software for each run by plotting the Ct value threshold cycle
numbers against virus loadings (IU/ml) for each standard, and
quantification of HBV DNA for unknown samples was inferred from the
regression line.
Pearson's correlation coefficient was used to assess
the strength of linear correlations between the log transformed
values of the two data sets using SPSS software (version 16.0).
p<0.05 was considered to indicate a statistically significant
difference.
Results
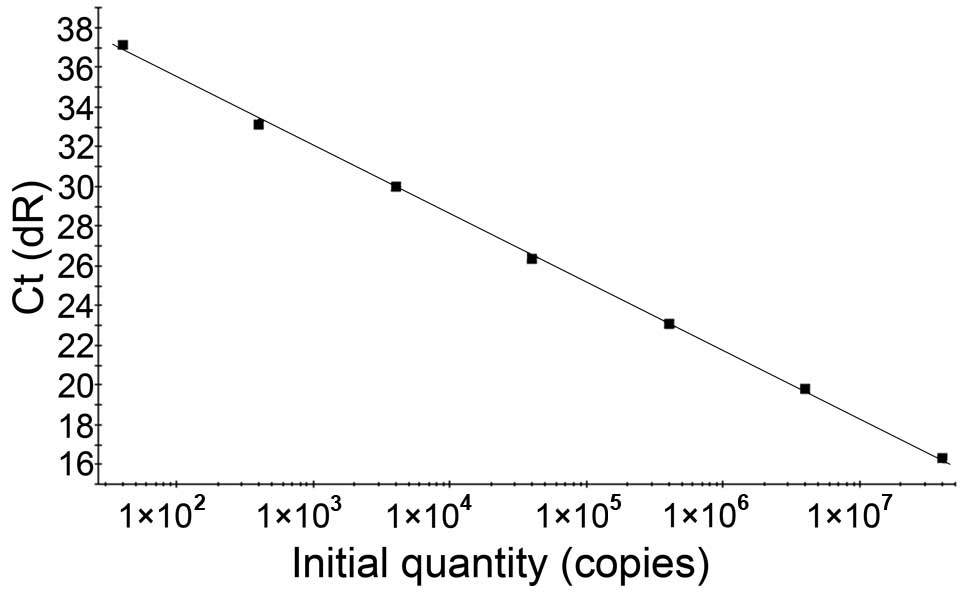
Calibration of in-house standards against
reference standards for HBV DNA
The concentration of HBV plasmid DNA assessed
against reference standards was 4.0x10⁷ IU/ml. With
optimized LNA real-time PCR probe conditions, the recombinant HBV
plasmid was serially diluted 1:10, 6 times and 7 standard products
(40-4.0x10⁷ IU/ml) were obtained in order to create a
standard curve. A linear relationship was obtained between the Ct
values and the log10 concentrations of HBV DNA, which displayed a
positive correlation in the region of 40 to 4.0x10⁷
IU/ml per reaction. A typical standard curve amplification plot and
linear regression analysis of the data are shown in Figs. 1 and 2, respectively. The regression analysis
yielded a correlation co-efficient of 0.999 and a Y-intercept value
of 45.72. The slope of −3.425 closely approximates the theoretical
maximum amplification efficiency of 95.9%. This standard curve over
a dynamic range of 40 to 4.0x10⁷ IU/ml was used for the
quantification of HBV DNA in the test samples. The minimum cut-off
for quantification of HBV DNA was 40 IU/ml. The linear detection
range for the TaqMan probe was typically from 4x10² to
4x10⁷ DNA IU/ml per reaction. The minimum cut-off for
the quantification of HBV DNA for the TaqMan probe was
4x10² IU/ml.
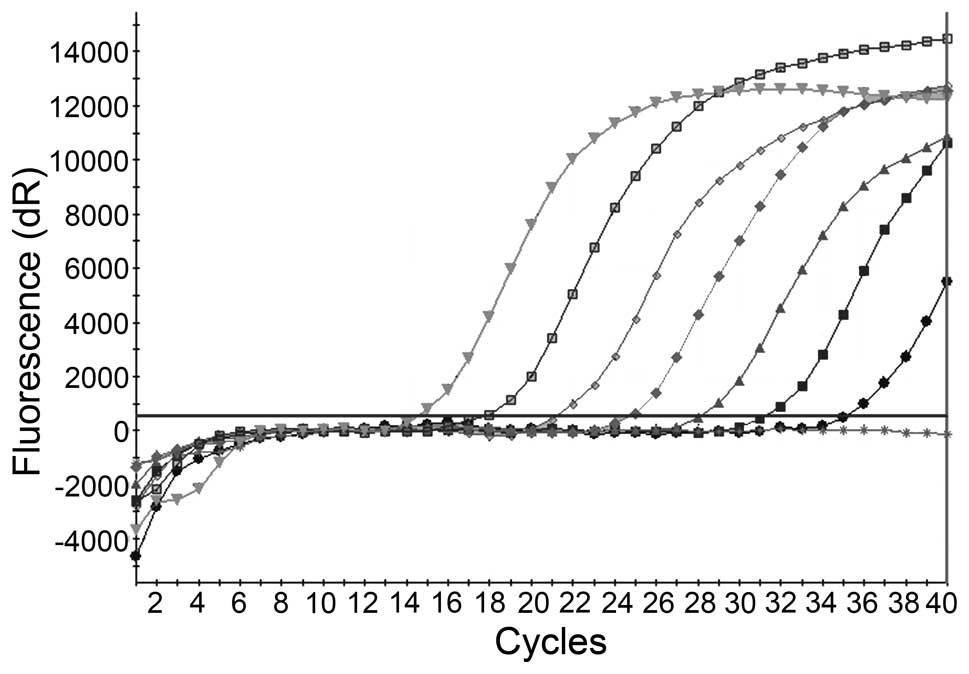 | Figure 1.Amplification plots of in-house HBV
standards using the TaqMan and LNA real-time PCR probes. The X axis
denotes the number of cycles, and the Y axis denotes fluorescent
intensity values. The horizontal line across the graph denotes the
threshold line. The plots from left to right are 4x10⁷,
4x10⁶, 4x10⁵, 4x10⁴,
4x10³, 4x10², 40 IU/ml and water. HBV,
hepatitis B virus; PCR, polymerase chain reaction; LNA, locked
nucleic acid; dR, double ratio. |
Sensitivity (the lowest examination
limit)
To evaluate the sensitivity of the LNA real-time PCR
probe, serial dilutions of HBV plasmid DNA ranging from 4 to 640
(4, 40, 80, 160, 320 and 640) IU/ml were tested in 20 replicates.
Following 40 amplification cycles, when the lowest plasmid
amplification S-shaped plots and concentrations were able to be
consistently differentiated from the double distilled water
(ddH2O)-negative controls, DNA concentration was set as
the lowest limit and used to evaluate the sensitivity of this
method. At times, amplification performance was capable of
quantifying HBV DNA with a sensitivity as low as 4 IU/ml using the
LNA and TaqMan PCR probes; however, this concentration was not
detected consistently. The number of positive cases at 4 IU/ml was
12 in the LNA PCR probe and 1 in the TaqMan PCR probe (Table II). The lowest concentration of HBV
DNA quantified at a frequency of 100% was 40 IU/ml. The lowest
concentration of HBV-positive DNA quantified at a frequency of 100%
was 40 IU/ml, using the LNA PCR probe and 80 IU/ml using the TaqMan
PCR probe.
| Table II.Number of replicate PCR analyses
performed and number of positives cases found with LNA and TaqMan
probes at various DNA concentrations. |
Table II.
Number of replicate PCR analyses
performed and number of positives cases found with LNA and TaqMan
probes at various DNA concentrations.
| HBV plasmid DNA
(IU/ml) | Total no. of
replicates | No. of positives
|
|---|
| LNA probe | TaqMan probe |
|---|
| 4 | 20 | 12 | 1 |
| 40 | 20 | 20 | 10 |
| 80 | 20 | 20 | 20 |
| 160 | 20 | 20 | 20 |
| 320 | 20 | 20 | 20 |
| 640 | 20 | 20 | 20 |
Specificity
The extractions from HBV HBeAg (+) patients,
cytomegalovirus, herpes simplex virus, hepatitis A virus, hepatitis
C virus (genotype 1), HIV-1 positive samples and human genomic DNA
were examined in order to determine the specificity using the LNA
real-time PCR probe system. Our method was able to detect HBeAg (+)
serum samples. It revealed negative results with cytomegalovirus,
herpes simplex, hepatitis A and hepatitis C viruses (genotype 1),
as well as HIV-1-positive samples and human genomic DNA.
Reproducibility
High, middle and low concentration samples,
including A01, A02 and A03 (HBV DNA virus load of 104,
105 and 107 IU/ml), were examined in order to
determine reproducibility between the same and different batch
samples. Every sample was examined 5 times per day for 3 days.
The intra-assay co-efficient of variation (CV) for
the LNA PCR probe ranged from 0.6 to 2.82% (Table III). The inter-assay CV for the LNA
PCR probe ranged from 1.09 to 2.54% (Table IV).
| Table III.Intra-assay variation of HBV viral
DNA load in LNA real-time PCR (Ct values). |
Table III.
Intra-assay variation of HBV viral
DNA load in LNA real-time PCR (Ct values).
| Assay no.
(day) | Sample ID | Replicates
| Mean Ct | SD | CV (%) |
|---|
| 1 | 2 | 3 | 4 | 5 |
|---|
| 1 | A01 | 31.33 | 31.42 | 31.69 | - | - | 31.48 | 0.187 | 0.6 |
| A02 | 26.86 | 26.69 | 25.87 | 26.47 | - | 26.34 | 0.432 | 1.63 |
| A03 | 18.47 | 19.54 | 18.95 | - | - | 19.25 | 0.457 | 2.82 |
| 2 | A01 | 31.28 | 31.77 | 30.72 | 31.27 | 31.57 | 31.32 | 0.355 | 1.27 |
| A02 | 25.76 | 25.89 | 25.99 | 26.38 | 26.17 | 26.04 | 0.217 | 0.93 |
| A03 | 17.88 | 18.70 | 18.38 | 18.55 | 18.08 | 18.32 | 0.301 | 1.84 |
| 3 | A01 | 31.66 | 31.94 | 32.02 | 32.29 | 31.99 | 31.98 | 0.201 | 0.70 |
| A02 | 27.19 | 27.99 | 27.16 | 27.12 | 27.05 | 27.30 | 0.347 | 1.42 |
| A03 | 18.73 | 19.42 | 19.14 | 19.10 | 18.59 | 18.99 | 0.299 | 1.76 |
| Table IV.Inter-assay variation of HBV viral
DNA load in LNA real-time PCR (Ct values). |
Table IV.
Inter-assay variation of HBV viral
DNA load in LNA real-time PCR (Ct values).
| Sample ID | Assay no. (day)
| Mean | SD | CV (%) |
|---|
| 1 | 2 | 3 |
|---|
| A01 | 31.48 | 31.32 | 31.98 | 31.59 | 0.344 | 1.09 |
| A02 | 26.34 | 26.04 | 27.3 | 26.56 | 0.658 | 2.48 |
| A03 | 19.25 | 18.32 | 18.99 | 18.85 | 0.480 | 2.54 |
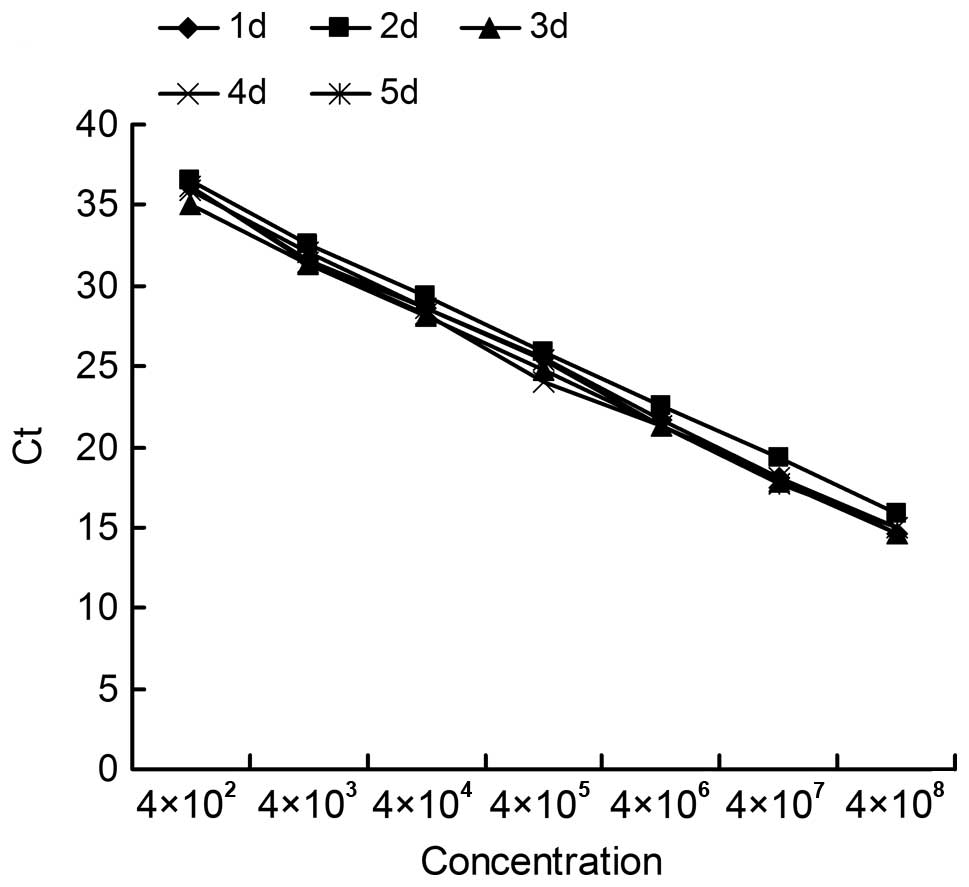
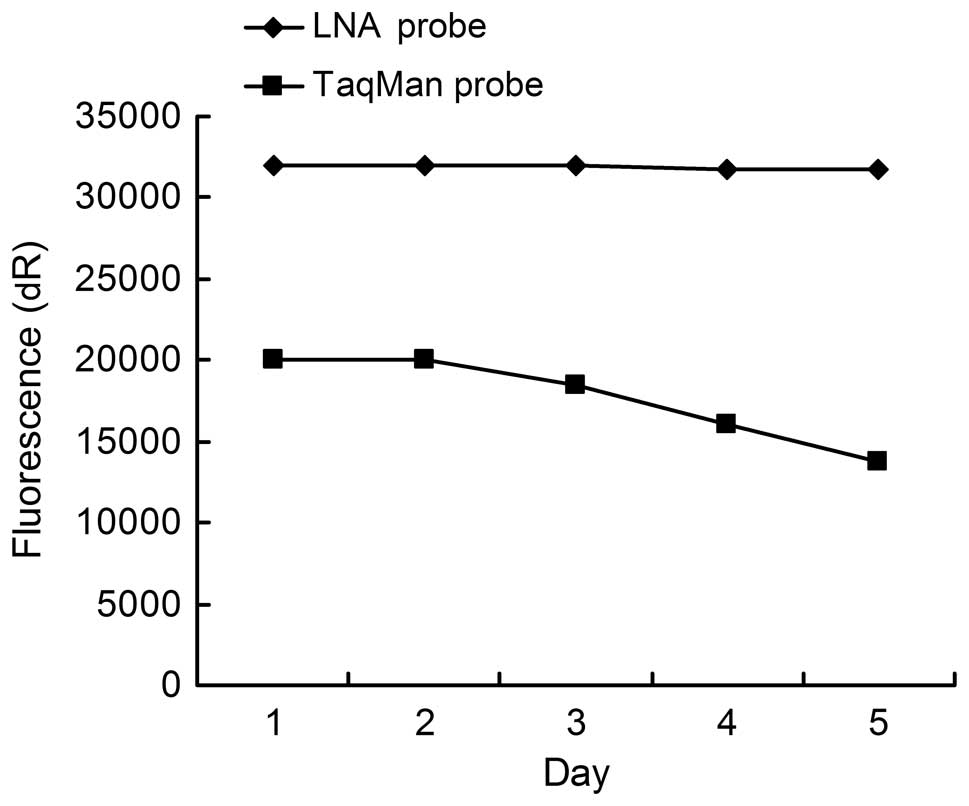
Stability
To evaluate the stability of the LNA and TaqMan
probes, the PCR mixture including the probe was repeatedly frozen
and thawed once a day for 5 days. A comparison of threshold Ct
values of the 7 standard products prior to and following reagent
freezing and thawing, displayed no significant difference
(p>0.05) (Table V). There was a
minor affect of on the standard curves (Fig. 3). Prior to freezing and thawing the
reagents, background fluorescence of the LNA probe (16,000 to
34,000 fluorescence units) was higher than the TaqMan probe (12,000
to 20,000 fluorescence units) and, compared to the TaqMan probe
(~36%), the LNA probe fluorescence slightly decreased (~1%) with
freezing and thawing (5 times; Fig.
4).
| Table V.The changes in Ct values prior to and
following reagent freezing and thawing. |
Table V.
The changes in Ct values prior to and
following reagent freezing and thawing.
| Standards | Day 1 | Day 2 | Day 3 | Day 4 | Day 5a |
|---|
| 4.00E+01 | 36.21 | 36.51 | 35.1 | 36.2 | 35.9 |
| 4.00E+02 | 31.57 | 32.63 | 31.35 | 31.5 | 32.1 |
| 4.00E+03 | 28.63 | 29.39 | 28.07 | 28.21 | 28.55 |
| 4.00E+04 | 25.49 | 25.92 | 24.82 | 23.99 | 25.36 |
| 4.00E+05 | 21.63 | 22.51 | 21.25 | 21.27 | 21.31 |
| 4.00E+06 | 18.06 | 19.26 | 17.82 | 18.04 | 17.71 |
| 4.00E+07 | 14.65 | 15.79 | 14.63 | 15.0 | 15.0 |
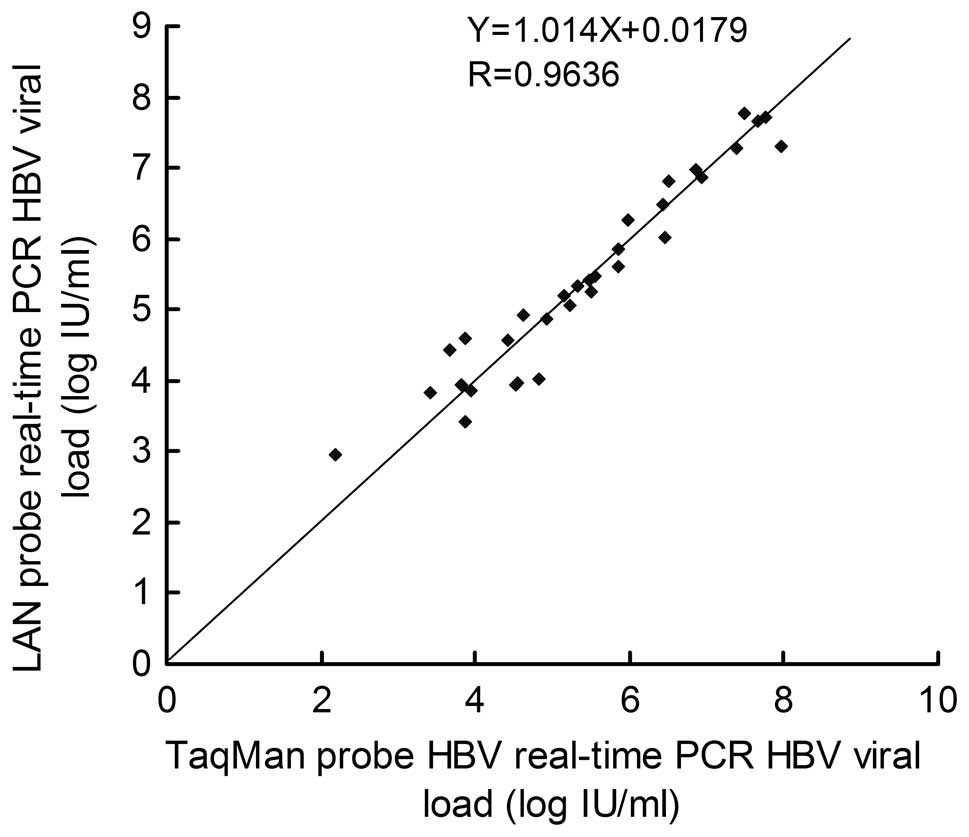
Comparative evaluation of LNA and TaqMan
real-time PCR assays
Among the 39 cases of known chronic hepatitis B,
100% of the cases (39/39) were shown to be positive by LNA
real-time PCR and 76.9% of cases (35/39) were shown to be positive
by TaqMan real-time PCR. Out of the 15 cases of chronic hepatitis B
HBsAg (+), 4 were shown to be negative by TaqMan real-time PCR and
positive by LNA real-time PCR (p<0.05). A positive correlation
was observed between the viral load measurements for 35 samples,
where both LNA and TaqMan real-time PCR detected HBV-positive DNA.
HBV-positive DNA within the linearity ranges was observed in both
the LNA and TaqMan real-time PCR assays (Fig. 5).
The results of 19 cases with normal serum from the
two methods were below the minimum cut-off value (TaqMan: 80 IU/ml
and LNA: 40 IU/ml).
Discussion
LNA is a recently developed technology. It is a
nucleotide chemical modification technology (also known as 3rd
generation reverse oligonucleotide) (8). The modification occurs through a
2-methyl sugar link between O2 and C4. With LNA modification, the
stability and affinity for DNA molecules has been increased in PCR
reactions. It has been reported that the oligonucleotide melting
temperature increased by 9.6°C following each extra nucleotide
insertion (9). Mutation
modification has enabled the significant amplification of test
environments and the recognition of single base mismatches. In
addition, it has allowed for more complicated experiments to be
carried out in a single test tube. Reported advantages of these
short probes include improved sensitivity towards single base
mismatches (specificity), ease of design and improved
signal-to-noise ratio, partly due to reduced fluorescence from
spurious binding and the close proximity of the quencher and
reporter dye (10). This opinion
has been in accordance with the findings of Costa et al, who
demonstrated LNA probes to be more sensitive than conventional DNA
probes when testing fetal DNA in maternal serum samples. This
result was attributed to improved PCR efficiency when using shorter
probes as a result of less amplification interference (11). A comparative study on sensitivity
(12), indicated an improved
performance of LNA probes compared to TaqMan probes when detecting
Salmonella in a range of sample matrices. The LNA probe
reached higher fluorescence plateaus and produced lower Ct values
and standard deviations. Josefsen et al published the same
conclusion, that the LNA real-time PCR probes were the most
sensitive assay of 4 real-time PCR probes (LNA, MGB, Scorpion and
TaqMan) (13). Nevertheless, the
reported sensitivity of the LNA probes was not significantly better
compared to other probes, when comparing 9 different real-time PCR
chemistries for qualitative and quantitative applications (14).
In the present study, we presented a quantitative
assay based on the LNA real-time PCR probe for the detection of HBV
DNA. Due to the advantages mentioned previously, LNA probe
technology should have greater detection performance for HBV DNA
than common probes, and we have demonstrated this result through
our research. The assay detection limit of LNA probes was capable
of reaching 40 IU/ml DNA per reaction, which could not occur with
TaqMan probes. In addition, the assay based on the LNA probe had a
wider linear detection range. The linear standard curve was
obtained between 40 and 4x10⁷ DNA IU/ml per reaction
(r=0.999), while the 1inear detection range based on the TaqMan
probe was typically from 4x10² to 4x10⁷ DNA
IU/ml per reaction. Furthermore, the advantages of LNA real-time
PCR probes were higher sensitivity, stability, amplification
efficiency and lower concentration of probes (Table VI).
| Table VI.Comparative studies on sensitivity,
stability, background Ct values and amplification efficiency
between LNA and TaqMan. |
Table VI.
Comparative studies on sensitivity,
stability, background Ct values and amplification efficiency
between LNA and TaqMan.
| Probe | Sensitivity
(IU/ml) | Stability
(fluorescence decrease) | Optimal probe
concentration | Ct values of sample
A02 | Amplification
efficiency |
|---|
| LNA | 40 | 1% | 75 | 26.56a | 95.9 |
| TaqMan | 80 | 36% | 200 | 28.67 | 88.2 |
In 35 samples, HBV-positive DNA was detected by both
LNA and TaqMan real-time PCR. According to the related reference
standard (15–18), the LNA real-time PCR viral load in
35 HBV DNA-positive samples compared well with the TaqMan real-time
PCR assay viral load (r=0.9636, p<0.05) (Fig. 5). Due to the lower virus quantities
in the serum of patients from group I than the other 2 groups, the
quantification of HBV DNA in group I patients required higher
sensitivity real-time PCR. Out of the 15 HBsAg (+) cases, 4 were
shown to be negative by TaqMan real-time PCR and positive by LNA
real-time PCR (p<0.05), which further demonstrates that LNA
real-time PCR probes have greater sensitivity than TaqMan
probes.
Collectively, our data demonstrate that the LNA
real-time PCR probe for the quantitative detection of HBV DNA
exhibits greater advantages, including a high degree of precision,
wide range of linearity, clinically relevant detection limit, ease
of design and an improved signal-to-noise ratio, compared to TaqMan
real-time PCR.
References
|
1.
|
SW SchalmTreatment of chronic hepatitis
BNeth J Med4410310919948202205
|
|
2.
|
R JardiM ButiF Rodriguez-FriasThe value of
quantitative detection of HBV-DNA amplified by PCR in the study of
hepatitis B infectionJ
Hepatol24680685199610.1016/S0168-8278(96)80263-78835742
|
|
3.
|
A BergerJ BranerHW DoerrB
WeberQuantification of viral load: clinical relevance for human
immunodeficiency virus, hepatitis B virus and hepatitis C virus
infectionIntervirology412434199810.1159/0000249129705562
|
|
4.
|
HH KesslerS PreiningerE
StelzlIdentification of different states of hepatitis B virus
infection with a quantitative PCR assayClin Diagn Lab
Immunol7298300200010702509
|
|
5.
|
FJ Van DeursenK HinoD WyattUse of PCR in
resolving diagnostic difficulties potentially caused by genetic
variation of hepatitis B virusJ Clin Pathol5114915319989602690
|
|
6.
|
IM MackayKE ArdenA NitscheReal-time PCR in
virologyNucleic Acids
Res3012921305200210.1093/nar/30.6.129211884626
|
|
7.
|
T NolanRE HandsSA BustinQuantification of
mRNA using real-time RT-PCRNat
Protoc115591582200610.1038/nprot.2006.23617406449
|
|
8.
|
JB RodriguezVE MarquezMC NicklausH
MitsuyaJJ Barchi JrConformationally locked nucleoside analogues.
Synthesis of dideoxycarbocyclic nucleoside analogues structurally
related to neplanocinC J Med
Chem3733893399199410.1021/jm00046a024
|
|
9.
|
J KurreckE WyszkoC GillenVA ErdmannDesign
of antisense oligonucleotides stabilized by locked nucleic
acidsNucleic Acids
Res3019111918200210.1093/nar/30.9.191111972327
|
|
10.
|
IV KutyavinIA AfoninaA Mills3′-minor
groove binder-DNA probes increase sequence specificity at PCR
extension temperaturesNucleic Acids Res286556612000
|
|
11.
|
JM CostaP ErnaultM OliviT GaillonK
ArarChimeric LNA/DNA probes as a detection system for real-time
PCRClin
Biochem37930932200410.1016/j.clinbiochem.2004.05.02015369726
|
|
12.
|
E ReynissonMH JosefsenM KrauseJ
HoorfarEvaluation of probe chemistries and platforms to improve the
detection limit of real-time PCRJ Microbiol
Methods66206216200610.1016/j.mimet.2005.11.00616364478
|
|
13.
|
MH JosefsenC LofstromHM SommerJ
HoorfarDiagnostic PCR: comparative sensitivity of four probe
chemistriesMol Cell
Probes23201203200910.1016/j.mcp.2009.02.00319269316
|
|
14.
|
M Buh GasparicT TengsJL La PazComparison
of nine different real-time PCR chemistries for qualitative and
quantitative applications in GMO detectionAnal Bioanal
Chem39620232029201020087729
|
|
15.
|
SD PasE FriesRA De ManAD OsterhausHG
NiestersDevelopment of a quantitative real-time detection assay for
hepatitis B virus DNA and comparison with two commercial assaysJ
Clin Microbiol3828972901200010921947
|
|
16.
|
V ShyamalaP ArcangelJ CottrellAssessment
of the target-capture PCR hepatitis B virus (HBV) DNA quantitative
assay and comparison with commercial HBV DNA quantitative assaysJ
Clin
Microbiol4251995204200410.1128/JCM.42.11.5199-5204.200415528715
|
|
17.
|
C RonsinA PilletC BaliGA DenoyelEvaluation
of the COBAS AmpliPrep-total nucleic acid isolation-COBAS TaqMan
hepatitis B virus (HBV) quantitative test and comparison to the
VERSANT HBV DNA 3.0 assayJ Clin
Microbiol4413901399200610.1128/JCM.44.4.1390-1399.200616597867
|
|
18.
|
D OliosoM BoarettiM LigozziG Lo CascioR
FontanaDetection and quantification of hepatitis B virus DNA by
SYBR green real-time polymerase chain reactionEur J Clin Microbiol
Infect Dis264350200710.1007/s10096-006-0223-y
|