Introduction
In recent years, obesity and type 2 diabetes have
become the most common human health problems worldwide (1). Obesity is a well-established risk
factor for many chronic diseases, such as hyperinsulinemia,
hypertension, abnormalities in lipid metabolism, glucose
intolerance and type 2 diabetes (2,3).
The contribution of obesity to type 2 diabetes may
be due to the dysregulation of adipocytokines which are synthesized
and secreted by adipose tissue. Adipose tissue secretes several
major hormones, most notably adiponectin and leptin. Adiponectin is
synthesized only in adipose tissue and is known to modulate insulin
and appears to have an anti-inflammatory effect by inhibiting
phagocytic activity and production of tumor necrosis factor α
(TNF-α) in macrophages. The major role of leptin is that of a
central regulator of adiposity (4). TNF-α is overproduced by adipose
tissue and causes inflammation and, therefore, systemic insulin
resistance by interfering with the insulin signaling cascade
(5). These metabolic disorders are
regulated by peroxisome proliferator-activated receptor α (PPAR-α),
which controls fatty acid oxidation, lipid and lipoprotein
metabolism and inflammatory responses (6).
Ephedra sinica (Ma Huang) has been
established for thousands of years in traditional uses in Korea and
China (7). Ephedra sinica
has been found to have sympathomimetic, anti-inflammatory,
hypoglycemic and antitussive/antiasthmatic effects (7). There have been reports that the use
of Ephedra promotes weight loss in selected populations
(8). In healthy overweight and
obese populations Ephedra decreased body weight, fasting
glucose levels and insulin levels (9). These findings indicate that
Ephedra decreases the risks of glucose intolerance and
obesity (8,9). However, there has been no study
concerning the anti-obesity and anti-hyperglycemic effects of
Ephedra and its related mechanism in diet-induced
obesity-related type 2 diabetes.
In this study, we evaluated the influence of
Ephedra sinica on body weight, epididymal fat weight,
glucose metabolism, lipid metabolism, liver function, and the
expression of PPAR-α, leptin, adiponectin and TNF-α of adipose
tissue, in obese type 2 diabetic mice under normal and high-fat
feeding conditions.
Materials and methods
Preparation of Ephedra aqueous
extracts
Ephedra sinica was obtained from the
Department of Pharmaceutical Preparation of Oriental Medicine,
Oriental Medical Hospital, Kyung Hee University, Seoul, Korea. Drug
quality was tested according to the standards of the Korea Food and
Drug Administration and those of our hospital. The dried Ephedra
sinica (1,000 g) was added to ethanol (1,500 ml, 80%) and
boiled for 2 h at 100°C using a heating mantle. The sieve-filtrated
solvents were concentrated with a rotary evaporator (Model NE-1;
EYELA Co., Japan) and dried with a freeze dryer (Model FD-1, EYELA
Co.). Those extracts were added to distilled water (1 g/10 ml) and
boiled for 2 h at 95°C. The boiled solution was centrifuged at
14,000 rpm for 20 min and the supernatant was obtained. After
filtering through a 0.2-μm filter, the extracts were kept at
−70°C for assay experiments.
Experimental design and animals
Male ICR mice (2-months old) weighing 30±5 g were
purchased from the Central Lab. Animal Inc. (Seoul, Korea) and were
housed in stainless- steel cages in an air-conditioned room
controlled at 22±1°C and at 40–70% relative humidity under a 12:12
h dark:light schedule. Animals freely received diet and water for 1
week. After adapting to the lighting conditions for that 1 week,
the mice were divided into four groups according to body weight.
The normal group continued to be fed a normal diet ad
libitum. High-fat diet (Surwit's Rodent Diet, product #D12331,
% kcal; carbohydrate:protein:fat = 25.5:16.5:58.0) was administered
to the other three groups for 6 weeks. The diet for the
Ephedra group contained 5% Ephedra and the diet for
the acarbose group (positive control) contained 0.5% acarbose. The
body weight of each mouse was measured once a week and the total
amount of food consumption was recorded every day using an
electronic scale (CAS 2.5D, Korea). To minimize the error caused by
animal movement, the mouse was put in a plastic bowl and measured
while resting. After 6 weeks, the mice were sacrificed and the
epididymal fat pad weight was recorded using an electronic scale.
All experiments were carried out according to the protocols
approved by the Animal Care Committee of the Animal Center at Kyung
Hee University and in accordance with the principles outlined in
the NIH Guide for the Care and Use of Laboratory Animals.
Oral glucose tolerance test and blood
analysis
The concentration of fasting glucose was monitored
at baseline, week 3 and week 6 after 8 h of fasting. Furthermore,
an oral glucose tolerance test (OGTT) was carried out at the 6th
week. Glucose was added to distilled water (1.3 g/2 ml) and
administered to each mouse (0.1 ml) through a stomach tube after 8
h of fasting. Blood glucose was determined at 0, 30 and 60 min
after administration. Blood was collected from the tail vein of
each mouse. To measure the lipid profiles and liver functions,
blood was collected from the hearts, while the mice were under
anesthesia with diethyl ether. The blood was centrifuged at 3,000
rpm for 20 min to obtain plasma. These samples were frozen at −40°C
until used in the analysis. Aspartate transaminase (AST), alanine
transaminase (ALT), total cholesterol, HDL-cholesterol,
LDL-cholesterol and triglyceride levels were measured.
RNA isolation
Total RNA was extracted from epididymal fat pads
using a Mini RNA Isolation II™ (Zymo Research, CA, USA) according
to the manufacturer's instructions. After 6 weeks, the mice were
sacrificed and the epididymal fat pad was quickly removed, placed
in a tube (15 mg in each group), and ZR RNA buffer (300 μl)
was added. These samples were pulverized by a homogenizer and
centrifuged at 1,000 rpm. The supernatant was moved to a Zymo-Spin
III Column, put in a 2-ml collection tube and centrifuged at 2,000
rpm for 60 min. After adding 350 μl of RNA wash buffer, the
samples were centrifuged for 1 min, washed twice and put in a
1.5-ml collection tube. Finally, the samples were centrifuged at
1,000 rpm after adding 50 μl of RNA-free water. The RNA
which was extracted from this process was stored at −70°C until
analysis.
Reverse transcription-polymerase chain
reaction (RT-PCR) of PPAR-α, leptin, adiponectin and TNF-α mRNA in
epididymal fat
To evaluate the expression levels of PPAR-α, leptin,
adiponectin and TNF-α mRNA, we performed semi-quantitative RT-PCR.
The reaction mixture, containing 1 μg of RNA, PCR buffer, 5
mM of MgCl2, 1 mM dNTP, 20 units of RNasin, 2.5
μM Oligo(dT) and 100 units of Moloney murine leukemia virus
reverse transcriptase, was incubated at 42°C for 50 min, then
heated at 70°C for 15 min. PCR was carried out in an Eppendorf
Mastercycler Gradient PCR device (Eppendorf, Hamburg, Germany).
Each sample mixture contained PCR buffer, 2.5 mM dNTP, 2 units of
Taq polymerase and 5 pM primers. The primers used were as
follows: PPAR-α, 5′-AATGGGCACTTCTAAGACTACCTG-3′ and 5′-GTG
CAGATTAGTTTTCAGGGATTT-3′; leptin, 5′-AGTGGG AATGAGAAATCACTTAGC-3′
and 5′-GTGTATTGC TTTCCATCAAGTGTC-3′;adiponectin,5′-ACCTACGACCAG
TATCAGGAAAAG-3′ and 5′-ACTAAGCTGAAAGTGTGT CGACTG-3′; TNF-α,
5′-TCTTCTCAAAATTCGAGTGAC AAG-3′ and 5′-GAGAACCTGGGAGTAGACAAGGTA-3′;
EF-1α (housekeeping gene), 5′-CTCAGGTGATTATCCTGA ACCATC-3′ and
5′-AACAGTTCTGAGACCGTT CTTCCA-3′. The PCR consisted of 33 cycles for
PPAR-α at 59°C, 30 cycles for leptin at 65°C, 25 cycles for
adiponectin at 59°C, 40 cycles for TNF-α at 59°C and 25 cycles for
EF-1α at 58°C. The expected PCR product sizes were 254 bp (for
PPAR-α), 212 bp (for leptin), 248 bp (for adiponectin) and 180 bp
(for TNF-α). The reaction products were subjected to densitometry
after electrophoresis on a 2% agarose gel and stained with ethidium
bromide. The amount of gene expression was quantified relative to
EF-1α.
Statistical analysis
Statistical comparisons were performed using one-way
analysis of variance (ANOVA) followed by Tukey's post hoc test
using the GraphPad PRISM statistical package (version 4.03;
GraphPad Software Inc., San Diego, CA, USA). All data are presented
as the means ± standard deviation (SD). All p-values are
two-tailed, and significance was determined at p<0.05.
Results
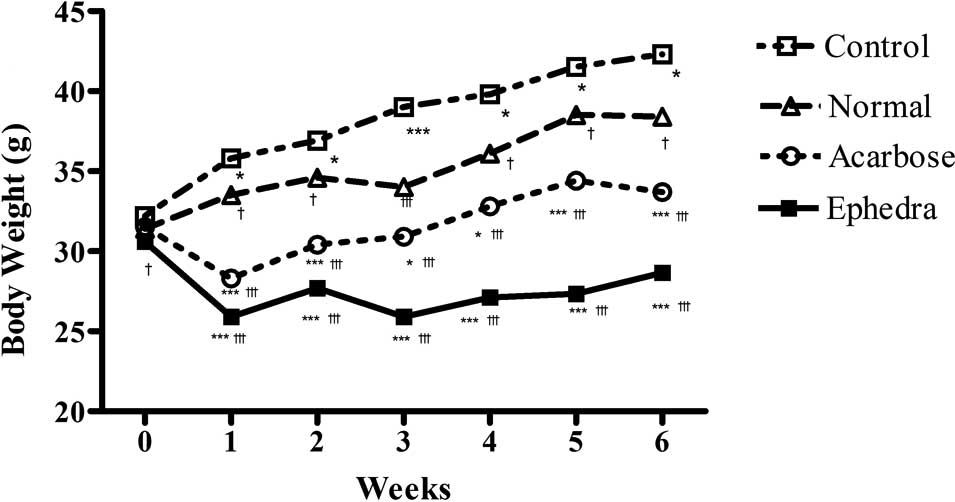
Surwit's high-fat, high-fat diet significantly
increased body weight at week 6 in the control group compared to
the normal group (42.3±2.67 vs. 38.4±0.84 g, p<0.01). This
difference was present by the first week and was maintained to the
completion of the study (p<0.05 at weeks 1, 2, 4 and 5,
p<0.01 at week 6, p<0.001 at week 3) (Fig. 1, Table
I). Body weight at week 6 was significantly reduced in the
Ephedra group and the acarbose group compared to that of the
control group (33.7±2.75, 42.3±2.67 and 28.7±2.60 g, for control,
acarbose- and Ephedra-treated groups, respectively;
p<0.001). In the Ephedra group, body weight gain was
significantly suppressed compared to the acarbose and the control
groups (p<0.05 at week 6, p<0.01 at weeks 1 and 2, p<0.001
at weeks 3, 4 and 5 compared to the acarbose group, and p<0.001
during all 6 weeks compared to the control group). The mean food
consumption per day per mouse was decreased in the acarbose group
compared to the other groups (5.8±0.89, 5.1±0.92, 3.5±0.84 and
5.4±0.97 g for normal, control, acarbose- and
Ephedra-treated groups, respectively; p<0.01, compared to
the normal and control groups, p<0.0001 compared to the
Ephedra group) (Table I).
Food consumption was not reduced in the Ephedra group.
 | Table I.Effects of Ephedra sinica on
body weight change, food intake and epididymal fat in obese
diabetic mice. |
Table I.
Effects of Ephedra sinica on
body weight change, food intake and epididymal fat in obese
diabetic mice.
| Normal | Control | Acarbose | Ephedra |
|---|
| Body weight change
(g) | | | | |
| Baseline | 31.4±1.17 | 32.0±1.14 | 31.5±1.43 | 30.6±0.97d |
| 1st week | 33.5±1.43d | 35.8±2.20a |
28.3±1.49c,f |
25.9±1.20c,f |
| 2nd week | 34.6±1.71d | 36.9±2.96a |
30.4±2.07c,f |
27.7±2.20c,f |
| 3rd week | 34.0±2.16f | 39.0±4.40c |
30.9±2.73a,f |
25.9±1.45c,f |
| 4th week | 36.1±2.18d | 39.8±2.70a |
32.8±3.19a,f |
27.1±2.20c,f |
| 5th week | 38.5±2.17d | 41.5±2.59a |
34.4±3.20b,f |
27.3±2.40c,f |
| 6th week | 38.4±0.84e | 42.3±2.67b |
33.7±2.75c,f |
28.7±2.60c,f |
| Food
consumption | | | | |
| Food intake | 5.8±0.89 | 5.1±0.92 |
3.5±0.84b,e | 5.4±0.97 |
| Epididymal | | | | |
| Grams | 0.57±0.16f | 1.19±0.45c | 0.44±0.18f | 0.47±2.21f |
| Precentage of
body weight | 1.50±0.44f | 3.05±1.15c | 1.14±0.47f | 1.19±0.55f |
Surwit's high-fat, high-fat diet significantly
increased the epididymal fat weight in the control group compared
to the normal group (1.19±0.45 vs. 0.57±0.16 g, p<0.001).
Compared to the control group, Ephedra and acarbose reduced
the epididymal fat weight (1.19±0.45, 0.44±0.18 and 0.47±2.21 g for
control, acarbose- and Ephedra-treated groups, respectively;
p<0.001). The difference between the Ephedra and the
acarbose groups was not significant. The ratio of the epididymal
fat weight to the total body weight also decreased in the same
manner (Table I).
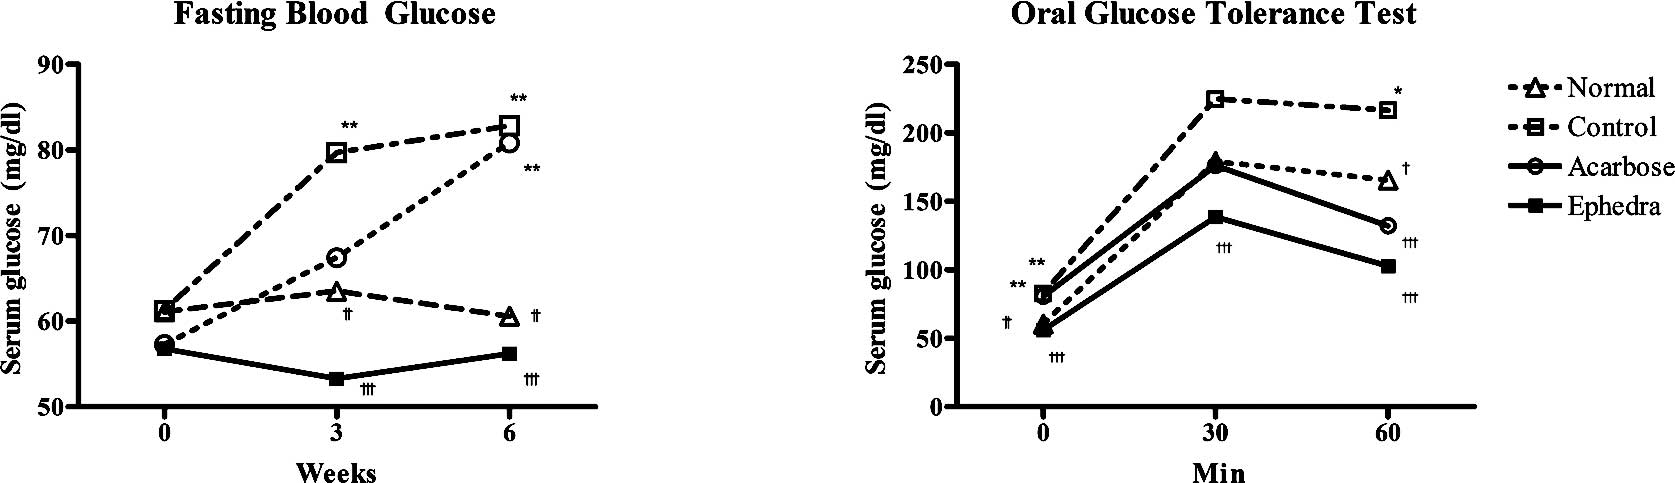
Fasting blood glucose levels were measured at weeks
1, 3 and 6. There were no differences among the groups at week 1.
Surwit's high-fat, high-fat diet increased fasting blood glucose
levels in the control group compared to that of the normal group at
week 3 (79.7±13.0 vs. 63.5±10.3 mg/dl, p<0.01) and at week 6
(82.8±18.2 vs. 60.6±10.2 mg/dl, p<0.01). Ephedra reduced
fasting glucose compared to the control group at weeks 3 (53.3±5.7
vs. 79.7±13.0 mg/dl, p<0.001) and 6 (56.2±13.0 vs. 82.8±18.2
mg/dl, p<0.001). However, in the acarbose group, fasting blood
glucose was elevated compared to the normal group only at week 6
(80.9±10.2 vs. 60.6±10.2 mg/dl, p<0.01) (Fig. 2, Table
II).
| Table II.Effects of Ephedra sinica on
biochemical parameters in obese diabetic mice. |
Table II.
Effects of Ephedra sinica on
biochemical parameters in obese diabetic mice.
| Normal | Control | Acarbose | Ephedra |
|---|
| Fasting blood
glucose (mg/dl) | | | | |
| Week 1 | 61.1±9.80 | 61.3±3.70 | 57.3±13.60 | 56.8±16.60 |
| Week 3 | 63.5±10.30e | 79.7±13.00b | 67.4±11.50 | 53.3±5.70f |
| Week 6 | 60.6±10.20e | 82.8±18.20b | 80.8±10.20b | 56.2±9.70f |
| Oral glucose
tolerance test (mg/dl) | | | | |
| 0 min | 60.6±10.20e | 82.8±18.20b | 80.8±10.20b | 56.2±9.70f |
| 30 min | 179.1±44.30 | 224.6±66.20 | 176.1±27.20 | 138.6±18.50f |
| 60 min | 165.6±38.00d | 216.6±50.80a | 132.0±33.70f | 102.8±16.80f |
| Lipid profile
(mg/dl) | | | | |
| Total
cholesterol | 142.6±24.50 | 146.3±25.50 | 114.1±14.70 |
197.7±14.40c,f |
| TG | 176.3±37.50a | 233.0±59.70 | 135.0±43.60d | 129.6±28.10e |
|
HDL-cholesterol | 131.6±14.40 | 109.1±29.50 | 113.7±15.70 | 149.9±22.20e |
| TG/HDL ratio | 1.35±0.23f | 2.51±0.81c | 1.19±0.40f | 0.87±0.19f |
| AST (mg/dl) | 116.8±20.07 | 133.12±30.12 | 91.2±25.86d | 90.8±16.83d |
| ALT (mg/dl) | 27.9±4.70f | 39.1±6.41c | 23.9±4.81f | 25.1±4.38f |
An oral glucose test was carried out at week 6. In
the control group, blood glucose levels were elevated compared to
the normal group at 0 and 60 min (82.8±18.2 vs. 60.6±10.2 mg/dl at
0 min, p<0.001; 216.6±50.8 vs. 165.6±38.0 mg/dl at 60 min,
p<0.01). Ephedra reduced blood glucose levels compared to
the control group at 0, 30 and 60 min (56.2±13.0 vs. 82.8±18.2
mg/dl; 56.2±13.0 vs. 82.8±18.2 mg/dl; 102.8±16.8 vs. 216.6±50.8
mg/dl at 0, 30 and 60 min, respectively; p<0.001). Acarbose
reduced blood glucose levels compared to the control group only at
60 min (132.1±33.7 vs. 216.6±50.8 mg/ dl, p<0.001) (Fig. 2, Table
II).
Total cholesterol (TC) was elevated only in the
Ephedra group compared to the control group (197.7±14.4 vs.
146.3±25.5 mg/dl, p<0.001). Triglyceride (TG) was elevated in
the control group compared to the normal group, but was reduced
significantly in the Ephedra and the acarbose groups
(176.3±37.5, 233.0±59.7, 135.0±43.6 and 129.6±28.1 mg/dl for
normal, control, acarbose- and Ephedra-treated groups,
respectively; p<0.05 compared to the normal and acarbose groups,
p<0.01 compared to the Ephedra group). High-density
lipoprotein cholesterol (HDL) was reduced in the control group
compared to the normal group, but the difference was not
significant. By contrast, the Ephedra group demonstrated
significantly elevated HDL levels compared to those of the normal
and control groups (131.6±14.4, 109.1±29.5 and 149.9±22.2 mg/dl for
the normal, control and Ephedra-treated groups, respectively;
p<0.01). There was no significant difference in the acarbose
group (113.7±15.7 mg/dl) compared to the others. Finally, the
TG/HDL ratio was significantly elevated in the control group, but
reduced in the Ephedra and acarbose groups (1.35±0.23,
2.51±0.81, 1.19±0.40 and 0.87±0.19 for the normal, control,
acarbose- and Ephedra-treated groups, respectively;
p<0.001) (Table II).
AST was elevated in the control group compared to
the normal group (133.12±30.12 vs. 116.8±20.07 mg/dl), but the
difference was not statistically significant. However,
Ephedra and acarbose reduced AST levels compared to the
control group (133.12±30.12, 91.2±25.86 and 90.8±16.83 mg/ dl for
the control, acarbose- and Ephedra-treated groups,
respectively; p<0.05) (Table
II). ALT was elevated in the control group compared to the
normal group, but significantly reduced in the Ephedra and
the acarbose groups (27.9±4.70, 39.1±6.41, 23.9±4.81 and 25.1±4.38
mg/dl for the normal, control, acarbose- and Ephedra-treated
groups, respectively; p<0.001). There was no significant
difference in ALT levels between the Ephedra group and the
acarbose group (Table II).
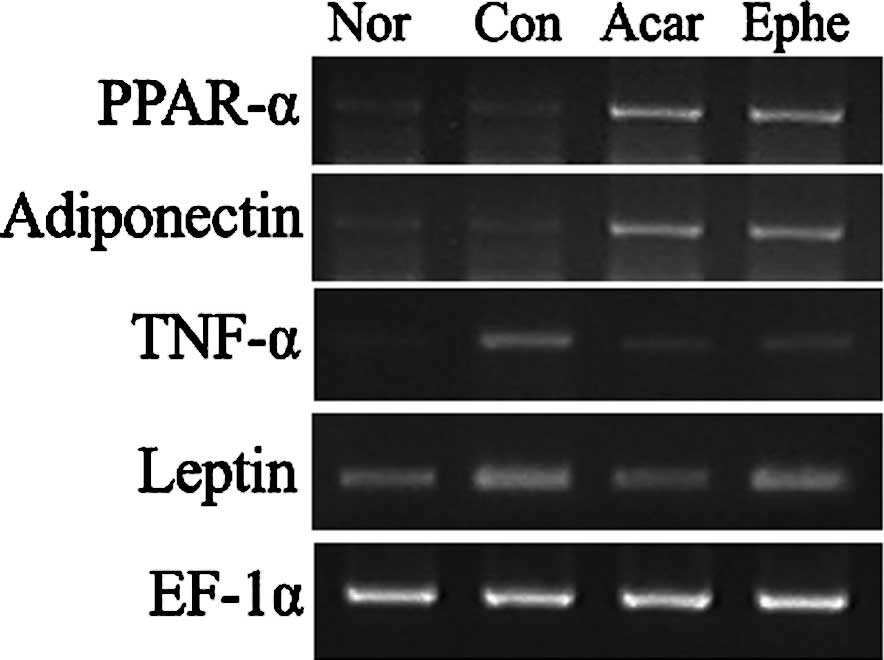
Compared to the mRNA levels in the control group,
the PPAR-α and adiponectin mRNA levels were significantly elevated
by Ephedra treatment, while the TNF-α mRNA levels were
reduced. The change in leptin mRNA levels was not significant
(Fig. 3). Acarbose also elevated
transcription of PPAR-α and adiponectin and caused a decrease in
both TNF-α and leptin mRNA levels.
Discussion
Obesity is clearly associated with increased
morbidity and mortality (10).
However, in obesity-related type 2 diabetes, weight loss is
difficult to achieve since most anti-diabetic drugs act by
increasing weight (11,12); therefore, the development of
anti-obesity and anti-hyperglycemic strategies is of great
importance.
Ephedra was found to promote weight loss in a
healthy obese population (8), but
its effects on and mechanisms involved in diet-induced
obesity-related type 2 diabetes have not been clarified. The
present study expands our understanding concerning the anti-obesity
and anti-hyperglycemic effects of Ephedra under high-fat and
high-glucose diets. We found that Ephedra suppressed weight
gain for all 6 weeks of the study compared to the high-fat and
high-glucose diet-fed control group, without food intake reduction.
In parallel with the effects of Ephedra on body weight gain,
epididymal fat weight and the ratio of the epididymal fat weight to
the total body weight was also decreased. Furthermore,
Ephedra improved insulin responsiveness. Ephedra
reduced both fasting and post-prandial glucose levels, decreased
TG, increased HDL and suppressed ALT elevation compared to the
control group. In particular, Ephedra reduced weight gain
and fasting glucose levels and improved HDL-cholesterol levels to a
greater extent than was noted with acarbose treatment.
Acarbose is the first of a new class of
anti-diabetic agents, the α-glucosidase inhibitors (13). Acarbose reduces the post-prandial
rise in plasma glucose and triglycerides, and decreases the toxic
effects of glucose, thus delaying conversion of impaired glucose
tolerance to diabetes (12,13).
Acarbose also prevents obesity, and the weight loss effects of
acarbose may help delay the onset of diabetes (12,13).
In this study, we used a high-fat and high-glucose
diet-fed mouse model, which resulted in increased weight gain,
stable hyperglycemia and insulin resistance (14). Furthermore, after just 1 week on
the high-fat diet, baseline plasma glucose was significantly
elevated (14). Additionally, the
metabolic efficiency index was lower in mice fed a high-fat diet,
and the weight gain observed in these mice cannot be fully
explained by increased energy intake, but must also be the result
of a reduced metabolic rate (14).
Obesity is traditionally defined as the presence of
excessive body fat, and fat cells in obese individuals become
dysfunctional for a number of reasons. One influencing factor is
the development of large, insulin-resistant fat cells that lose
their capacity to store triglycerides. Another problem is the
infiltration of fat cells by cytokine-secreting macrophages, which
results in low-grade inflammation and increased endoplasmic
reticulum stress. In these adipocytes, there is decreased
production of certain factors that are normally synthesized, such
as adiponectin, while there is an accelerated release of other
adipocytokines, such as TNF-α and leptin (15). In obesity-related disorders, PPAR-α
holds a central role in the regulation of several key factors,
including lipids, lipoprotein metabolism and inflammation (6).
Our findings showed that Ephedra reduced
obesity and hyperglycemia by increasing the expression of PPAR-α
and adiponectin, and reducing the expression of TNF-α. PPAR-α has
emerged as an important player in the convergence of obesity,
diabetes and cardiovascular disease. PPAR-α is mainly expressed in
tissues with a high degree of fatty acid metabolism, such as the
liver and heart (16). Activation
of PPAR-α improves regulation of fatty acid oxidation, inflammatory
response and lipid and lipoprotein metabolism, including fatty acid
uptake and β-oxidation. In this way, PPAR-α activation increases
HDL-cholesterol and decreases TG levels, lipid accumulation and
central obesity (6). Therefore,
the use of PPAR-α activators, such as fibrates, offers the
possibility of coordinated modification to repress inflammatory
mechanisms with insulin-resistant conditions (6). To evaluate whether the effects of
Ephedra on obesity-related type 2 diabetes were mediated by
alterations in PPAR-α expression, we analyzed the mRNA levels of
PPAR-α. We found that PPAR-α expression was elevated; it is
therefore likely that Ephedra decreased fat accumulation,
weight gain and TG levels, and increased HDL-cholesterol levels by
enhancing PPAR-α.
Adiponectin, a 30-kDa adipokine with anti-diabetic
properties similar to those of leptin, is expressed primarily in
adipose tissue. Its concentrations exceed those of other adipokines
by 100-fold and are closely correlated to the amount of visceral
fat (17). Adiponectin increases
insulin sensitivity by increasing tissue fat oxidation which
results in reduced circulating fatty acid levels and intracellular
triglyceride content (18).
Furthermore, adiponectin levels are independently predictive of
HDL-cholesterol levels and glucose area beyond the contribution of
visceral adiposity. Thus, adiponectin plays a central role as an
anti-diabetic and anti-atherogenic adipokine (19). From the present study, it appears
that Ephedra may improve glucose tolerance and
HDL-cholesterol levels by elevating adiponectin mRNA
expression.
An important recent development in our understanding
of obesity has been the emergence of the concept that obesity with
diabetes is characterized by a state of chronic low-grade
inflammation (4). TNF-α, a
powerful local regulator within adipose tissue, contributes to
insulin resistance and inflammation (4). TNF-α is overexpressed in adipose
tissue and is reduced by weight loss (20). It has also been found that high
TNF-α impairs insulin-mediated whole-body glucose disposal and
insulin-stimulated suppression of hepatic glucose output (21). Similarly, TNF-α mRNA expression was
elevated in the control group and reduced by Ephedra and
acarbose treatments, which mediated the improvement of insulin
responsiveness and the reduction of weight gain.
Based on these results, we conclude that
Ephedra reduced weight gain and improved hyperglycemia in
mice with obesity-related glucose intolerance induced by high-fat
feeding. Our findings suggest that these anti-obesity and
anti-hyperglycemic effects of Ephedra could be mediated by
the elevated expression of PPAR-α and adiponectin and the
suppression of TNF-α expression.
Acknowledgements
This study was supported by the Kyung
Hee University Research Fund in 2010 (KHU-2010-0676).
References
|
1.
|
Costacou T and Mayer-Davis EJ: Nutrition
and prevention of type 2 diabetes. Annu Rev Nutr. 23:147–170. 2003.
View Article : Google Scholar : PubMed/NCBI
|
|
2.
|
Kahn BB and Flier JS: Obesity and insulin
resistance. J Clin Invest. 106:473–481. 2000. View Article : Google Scholar : PubMed/NCBI
|
|
3.
|
Bray GA and Bellanger T: Epidemiology,
trends, and morbidities of obesity and the metabolic syndrome.
Endocrine. 29:109–117. 2006. View Article : Google Scholar : PubMed/NCBI
|
|
4.
|
Trayhurn P and Wood IS: Adipokines:
inflammation and the pleiotropic role of white adipose tissue. Br J
Nutr. 92:347–355. 2004. View Article : Google Scholar : PubMed/NCBI
|
|
5.
|
Maeda N, Takahashi M, Funahashi T, et al:
PPARgamma ligands increase expression and plasma concentrations of
adiponectin, an adipose-derived protein. Diabetes. 50:2094–2099.
2001. View Article : Google Scholar : PubMed/NCBI
|
|
6.
|
Fruchart JC: Peroxisome
proliferator-activated receptor-alpha (PPARalpha): at the
crossroads of obesity, diabetes and cardiovascular disease.
Atherosclerosis. 205:1–8. 2009. View Article : Google Scholar : PubMed/NCBI
|
|
7.
|
Abourashed EA, El-Alfy AT, Khan IA and
Walker L: Ephedra in perspective – a current review. Phytother Res.
17:703–712. 2003.
|
|
8.
|
Shekelle PG, Hardy ML, Morton SC, et al:
Efficacy and safety of ephedra and ephedrine for weight loss and
athletic performance: a meta-analysis. JAMA. 289:1537–1545.
2003.PubMed/NCBI
|
|
9.
|
Hackman RM, Havel PJ, Schwartz HJ, et al:
Multinutrient supplement containing ephedra and caffeine causes
weight loss and improves metabolic risk factors in obese women: a
randomized controlled trial. Int J Obes (Lond). 30:1545–1556. 2006.
View Article : Google Scholar
|
|
10.
|
Higgins M, D'Agostino R, Kannel W, Cobb J
and Pinsky J: Benefits and adverse effects of weight loss.
Observations from the Framingham Study. Ann Intern Med.
119:758–763. 1993. View Article : Google Scholar : PubMed/NCBI
|
|
11.
|
Nilsson PM: Is weight loss beneficial for
reduction of morbidity and mortality? What is the controversy
about? Diabetes Care. 31(Suppl 2): 278–283. 2008. View Article : Google Scholar : PubMed/NCBI
|
|
12.
|
Chiasson JL, Josse RG, Gomis R, et al:
Acarbose for prevention of type 2 diabetes mellitus: the STOP-NIDDM
randomised trial. Lancet. 359:2072–2077. 2002. View Article : Google Scholar : PubMed/NCBI
|
|
13.
|
Hanefeld M: The role of acarbose in the
treatment of non-insulin-dependent diabetes mellitus. J Diabetes
Complications. 12:228–237. 1998. View Article : Google Scholar : PubMed/NCBI
|
|
14.
|
Winzell MS and Ahren B: The high-fat
diet-fed mouse: a model for studying mechanisms and treatment of
impaired glucose tolerance and type 2 diabetes. Diabetes. 53(Suppl
3): 215–219. 2004. View Article : Google Scholar : PubMed/NCBI
|
|
15.
|
Ioannidis I: The road from obesity to type
2 diabetes. Angiology. 59:S39–S43. 2008. View Article : Google Scholar : PubMed/NCBI
|
|
16.
|
Braissant O, Foufelle F, Scotto C, Dauca M
and Wahli W: Differential expression of peroxisome
proliferator-activated receptors (PPARs): tissue distribution of
PPAR-alpha, -beta, and -gamma in the adult rat. Endocrinology.
137:354–366. 1996.
|
|
17.
|
Dyck DJ: Adipokines as regulators of
muscle metabolism and insulin sensitivity. Appl Physiol Nutr Metab.
34:396–402. 2009.PubMed/NCBI
|
|
18.
|
Diez JJ and Iglesias P: The role of the
novel adipocyte-derived hormone adiponectin in human disease. Eur J
Endocrinol. 148:293–300. 2003. View Article : Google Scholar : PubMed/NCBI
|
|
19.
|
Yamauchi T, Nio Y, Maki T, et al: Targeted
disruption of AdipoR1 and AdipoR2 causes abrogation of adiponectin
binding and metabolic actions. Nat Med. 13:332–339. 2007.
View Article : Google Scholar : PubMed/NCBI
|
|
20.
|
Ziccardi P, Nappo F, Giugliano G, et al:
Reduction of inflammatory cytokine concentrations and improvement
of endothelial functions in obese women after weight loss over one
year. Circulation. 105:804–809. 2002.PubMed/NCBI
|
|
21.
|
Londos C, Brasaemle DL, Schultz CJ, et al:
On the control of lipolysis in adipocytes. Ann NY Acad Sci.
892:155–168. 1999. View Article : Google Scholar : PubMed/NCBI
|