Introduction
Colorectal cancer (CRC) is one of the most common
types of malignant neoplasm in developed countries and the
incidence of CRC has increased in China due to the adoption of a
Western lifestyle. Previous studies have demonstrated that several
aberrant genes, including APC, β-catenin, K-Ras and certain MMR
genes, are involved in carcinogenesis of the colorectum (1–3).
However, at present, few molecules are considered as biomarkers
able to differentiate early malignant CRC from normal tissue.
A new class of non-coding RNAs, known as microRNAs
(miRNAs), was recently discovered and have been demonstrated to be
involved in various human diseases, including cancer, through the
regulation of target gene expression at the post-transcriptional
level (4). miRNAs are 19- to 25-nt
molecules cleaved from 70- to 100-nt hairpin pre-miRNA precursors
generated from primary transcript miRNAs in the nucleus. The
precursor is cleaved by the cytoplasmic RNase III, Dicer, into a
22-nt miRNA duplex; one strand of short-lived duplex is degraded,
while the other strand, which serves as the mature miRNA, is
incorporated into the RNA-induced silencing complex (RISC), and
drives the selection of target mRNAs containing antisense sequences
(5). Previous studies have
indicated that over 30% of mRNAs in the mammalian genome may be
regulated by individual miRNAs (6). However, only a small number of target
mRNAs have been identified. The first evidence for miRNA
involvement in human cancer was demonstrated by Calin et al
in 2002 (7). Since then, the
carcinogenic role of miRNAs has been identified not only in
malignant hematopoietic disease, but also in solid tumors (8,9).
Several miRNA expression signatures have been recently reported in
CRC (10–12). However, due to the different study
procedures and samples, the definite miRNAs associated with CRC
pathogenesis remain largely unknown.
Celecoxib, an inhibitor of cyclooxygenase-2 (COX-2),
may prevent CRC, and even prohibits the growth of tumor cells,
through the inhibition of angiogenesis, apoptosis and blockage of
the cell cycle (13–15). However, to date, its exact
anti-cancer mechanism in malignant neoplasms, including CRC, is
poorly understood. To our knowledge, few studies have focused on
the pathological role of miRNAs in the process of celecoxib
treatment of CRC cells.
Recently, with the development of miRNA microarray
technologies, expression profiling studies have been conducted
which recognize miRNAs differentially expressed between normal and
tumor samples, and identify cancer-specific miRNA signatures
associated with well-defined clinicopathological features (16,17).
In this study, we present the results of genome-wide miRNA
expression profiles of a set of CRC and normal colorectal tissues,
in order to reveal the specific miRNAs correlated with CRC.
Furthermore, the miRNA expression profiles of HT-29 cells before
and after intervention with celecoxib were also determined in order
to investigate the underlying role of miRNAs.
Materials and methods
CRC samples and cell line
With the approval of the Institutional Review Board
of the First Hospital Affiliated to Soochow University, malignant
colorectal tissues were obtained from patients undergoing
colorectal resection for CRC. The match-paired normal colorectal
mucosae were obtained from the colorectum more than 5 cm away from
the carcinoma tissue site in these patients, whose histology was
confirmed using H&E staining concurrently with the carcinoma
tissues. Written informed consent was obtained from all patients
according to the guidelines approved by the Institutional Research
Board. All tissue samples were collected and immediately
snap-frozen in liquid nitrogen, and stored at −80°C until RNA
extraction. The clinicopathological characteristics of the CRC
patients are shown in Table I. The
exclusion criteria included a previous history of local or systemic
treatment for CRC.
 | Table I.Clinicopathological data of 25
colorectal cancer patients. |
Table I.
Clinicopathological data of 25
colorectal cancer patients.
| Characteristics | No. of cases
(n=25) |
|---|
| Age (years) | |
| Median | 63 |
| Range | 43–83 |
| Gender | |
| Male | 6 |
| Female | 19 |
| Tumor size (cm) | |
| ≥5 | 14 |
| <5 | 11 |
| Depth of tumor
invasiona | |
| Serosa | 19 |
| Mucosa | 6 |
| Histological
type | |
| High | 1 |
| Moderate | 19 |
| Poor | 5 |
| Lymphatic
invasion | |
| (−) | 15 |
| (+) | 10 |
| Liver
metastasis | |
| (−) | 20 |
| (+) | 5 |
| Clinical
stageb | |
| I | 5 |
| II | 8 |
| III | 7 |
| IV | 5 |
The HT-29 cells were maintained in McCoy’s 5A
modified medium (Gibco-BRL, USA) supplemented with 10% fetal bovine
serum (FBS; Sigma, USA). The cultures were incubated at 37°C in a
humidified 5% CO2 incubator. Celecoxib was obtained from
Sigma and dissolved in dimethyl sulfoxide (DMSO) with a final
concentration of 0.1% DMSO in the culture medium. The HT-29 cells
were separated into eight groups, including the control (cells
without intervention), DMSO (cells treated with the same dose of
DMSO as the control group) and celecoxib groups treated with
concentrations 50–350 μmol/l. Cells in each group were seeded at
1×10⁴ cells per well in a 96-well culture plate.
Twenty-four hours later, each well was incubated with DMSO or
celecoxib at different concentrations for 24, 48 or 72 h. Cell
viability in 96-well plates was evaluated using the Cell Counting
Kit 8 (CCK-8) assay.
RNA extraction and miRNA array
analysis
Total RNAs from 6 human CRCs and 6 paired normal
colorectal tissues and 2 groups of HT-29 cells (control group and
cells treated with 237.73 μmol/l celecoxib for 48 h) were analyzed
by miRNA microarray. Total RNA isolation was conducted with TRIzol
(Invitrogen, Carlsbad, CA, USA) according to the manufacturer’s
instructions. The concentration and purity of the total RNAs were
assessed using a spectrophotometer, and RNA integrity was verified
using an Eppendorf Biophotometer (Eppendorf, Germany). RNA labeling
and hybridization on miRNA microarray chips were conducted
according to the miRNA expression profiling assay guide (Illumina,
USA). The assay was initiated by polyadenylating 200 ng of total
RNA with a poly-A polymerase enzyme (PAP). The polyadenylated RNA
was then converted to cDNA using a biotinylated oligo-dT primer
with a universal PCR sequence at its 5′-end. Following PCR
amplification, the labeled, single-stranded product was hybridized
to Illumina miRNA microarrays, which contained probes for 1146
human miRNAs representing a majority of known miRNAs (described in
the Sanger Institute’s miRBase database, Release 12.018), plus
additional novel content derived using Illumina sequencing
technology for 14 h at 45°C. The microarrays were then washed using
Illumina-prepared buffers. The Illumina iScan System (Illumina,
USA) was further used to measure the fluorescence intensity at each
addressed bead location. Normalization was performed using the
average normalization method. The intensity of each hybridization
signal was evaluated using Feature Extraction Software. The average
values of the replicate spots of each miRNA were background
subtracted, normalized and subjected to further analysis.
Quantitative real-time polymerase chain
reaction (Q-RT-PCR)
For miR-552, miR-142-3p, miR-139-3p, miR-133b,
miR-26a-1*, miR-142-5P and RNU6B (internal control)
specific cDNA synthesis was conducted using an miScript Reverse
Transcription kit (Qiagen, Hilden, Germany) according to the
manufacturer’s instructions. Q-RT-PCR was performed using an
miScript SYBR Green PCR kit (Qiagen). The reactions were incubated
in a 96-well optical plate for 15 min at 95°C followed by 40 cycles
of 5 sec at 95°C, 31 sec at 61°C and then were held constant at
4°C. Expression analysis was performed in triplicate for each
sample. A melting curve analysis and agarose gel electrophoresis
were conducted to confirm the specificity of the amplification
reactions. The U6 small nuclear RNA was used as the normalization
control. The miRNA expression level was quantified using the ABI
Prism 7300 Sequence Detection System (Applied Biosystems, Foster
City, CA, USA). The relative expression of each miRNA was
calculated using the 2−ΔΔCt method, with the ratio of
the median expression sample among all the cancer and paired normal
tissue samples used as the calibrator.
miRNA target functional analysis through
enrichment analysis and GeneGo pathway annotation based on miRNA
expression profiles in HT-29 cells following celecoxib
treatment
According to the results from the bioinformatic
techniques, the target genes of the deregulated miRNAs in the HT-29
cells following intervention of celecoxib compared to HT-29 cells
without treatment were selected based on three miRNA target gene
prediction software databases (miRNAs, RNAHybrid and Targetscan).
Furthermore, enrichment analysis was applied in order to organize
the target genes into three categories, including common, similar
and unique, and in order to match them to functional pathways in
the MetaCore gene pool evaluated with the P-value. The smaller the
P-value, the greater possibility that the target gene is in a
certain pathway. Meanwhile, the target genes of the aberrant miRNAs
were collected, and subjected to GeneGo pathway annotation. We
chose to illustrate only pathways that had P<0.001.
Statistical analysis
All results are expressed as mean ± standard
deviation (SD). Statistical analysis was conducted using the
Student’s t-test for the comparison of the cancer group and the
normal tissues in the microarray analysis; P<0.001 was
considered to indicate a statistically significant difference. The
Illumina custom error model was used to analyse the differences in
expression between the HT-29 cells treated with celecoxib and
non-treated cells; P-value <0.01 was considered to indicate a
statistically significant difference. Analysis of variance (ANOVA)
was used to compare the expression of selected aberrant miRNAs as
determined by the Q-RT-PCR assay. Using RT-PCR analysis, an miRNA
was designated as overexpressed if the expression was >2.0-fold,
and under-expressed if the expression was <0.5-fold when
compared to 10 paired normal tissues in all 25 clinical CRC samples
and two different groups of HT-29 cells. P-value <0.05 was
considered to indicate a statistically significant difference, and
was calculated using SPSS software 16.0 (SPSS, Chicago, IL,
USA).
Results
Celecoxib induces growth arrest in HT-29
cells
We first examined the effect of celecoxib on the
growth of HT-29 cells. All cells were treated with different
concentrations of celecoxib (0–300 μmol/l) for 24, 48 and 72 h in
the absence of FBS in the culture medium. The CKK-8 assay
demonstrated that upon the increase in concentration of celecoxib
and treatment time, the inhibitory effect of celecoxib on HT-29
cells gradually increased. Celecoxib (300 μmol/l) demonstrated the
greatest inhibitory effect with a 72-h survival rate of only
19.72%. The results summarized in Table II further suggest that celecoxib
suppresses the HT-29 cell growth in a time- and dose-dependent
manner. According to the dose-effect curves, the 50% inhibition
concentration (IC50) of celecoxib in HT-29 cells at 48 h
was 237.73±1.65 μmol/l.
| Table II.Inhibitory effect of celecoxib on the
growth of HT-29 cells (n=3, mean ± SD). |
Table II.
Inhibitory effect of celecoxib on the
growth of HT-29 cells (n=3, mean ± SD).
| Groupsa | Inhibitory rate at
variable times (%)b
|
|---|
| 0 h | 24 h | 48 h | 72 h |
|---|
| Negative
control | 0 | 0 | 0 | 0 |
| DMSO control | 0 | 0 | 0 | 0 |
| Celecoxib
groups | | | | |
| 50 μmol/l | 0 | 2.01±0.78 | 2.53±1.02 | 3.17±1.78 |
| 100 μmol/l | 0 | 4.76±1.37 | 9.50±0.98 | 20.17±2.01 |
| 150 μmol/l | 0 | 7.43±0.65 | 17.64±1.05 | 43.47±1.45 |
| 200 μmol/l | 0 | 29.43±0.74 | 44.08±1.01 | 64.06±1.21 |
| 250 μmol/l | 0 | 40.22±0.24 | 58.11±0.23 | 75.23±1.22 |
| 300 μmol/l | 0 | 43.37±1.69 | 62.77±1.86 | 82.07±0.98 |
miRNA expression in CRC and normal
colorectal tissues and alteration in HT-29 cells treated with
celecoxib
An Illumina microarray platform containing 1146
probes was used to evaluate the miRNA expression profiles of the
colorectal tissues, including 6 CRCs, 6 matched normal colorectal
mucosae and 2 groups of HT-29 cells either treated or untreated
with celecoxib. The microarray analysis demonstrated that miRNAs
were differentially expressed between the CRCs and the normal
tissues. The analysis identified that 35 miRNAs were upregulated
and 30 were downregulated in the cancer tissues compared with their
matched benign mucosa tissues (P<0.001) (Table III). When the HT-29 cells exposed
to celecoxib were compared with the untreated cells, 20 miRNAs were
found to be overexpressed while 8 miRNAs were underexpressed
(P<0.01) (Table IV).
| Table III.Aberrantly expressed miRNAs in
colorectal cancer compared with paired normal samples. |
Table III.
Aberrantly expressed miRNAs in
colorectal cancer compared with paired normal samples.
| miRNAs | P-value | FDR | Fold
difference |
|---|
| Upregulated
miRNAs | | | |
| hsa-miR-552 | 0.0007325 | 0.0083292 | 30.991 |
|
solexa-2580-353 | 0.0000681 | 0.0022763 | 25.040 |
| hsa-miR-96 | 0.0000856 | 0.0023462 | 17.273 |
| hsa-miR-592 | 0.0002807 | 0.0047352 | 14.624 |
| hsa-miR-549 | 0.0000388 | 0.0021269 | 9.075 |
|
hsa-miR-452*:9.1 | 0.0000694 | 0.0022763 | 8.779 |
|
solexa-3277-272 | 0.0000129 | 0.0011112 | 8.395 |
| hsa-miR-622 | 0.0000826 | 0.0023462 | 8.090 |
|
hsa-miR-142-5p | 0.0002650 | 0.0047352 | 7.886 |
|
hsa-miR-183* | 0.0000633 | 0.0022763 | 7.467 |
| hsa-miR-31 | 0.0006344 | 0.0082695 | 7.218 |
| hsa-miR-183 | 0.0007148 | 0.0083292 | 6.667 |
| hsa-miR-135b | 0.0008084 | 0.0085520 | 6.351 |
| hsa-miR-431 | 0.0000003 | 0.0000904 | 6.270 |
|
hsa-miR-142-3p | 0.0002952 | 0.0048110 | 5.975 |
|
hsa-miR-219-5p | 0.0004407 | 0.0063272 | 5.966 |
| hsa-miR-660 | 0.0001536 | 0.0033122 | 5.569 |
|
hsa-miR-21* | 0.0000175 | 0.0013191 | 5.019 |
| hsa-miR-452 | 0.0001538 | 0.0033122 | 4.964 |
|
hsa-miR-154* | 0.0001741 | 0.0034994 | 4.535 |
|
hsa-miR-16-1* | 0.0003140 | 0.0049827 | 4.495 |
|
hsa-miR-182* | 0.0008058 | 0.0085520 | 4.054 |
| hsa-miR-335 | 0.0001095 | 0.0027512 | 3.963 |
| hsa-miR-32 | 0.0006454 | 0.0082695 | 3.947 |
|
hsa-miR-337-5p | 0.0001608 | 0.0033435 | 3.904 |
|
hsa-miR-17* | 0.0006857 | 0.0082695 | 3.782 |
|
hsa-miR-801:9.1 | 0.0008589 | 0.0087782 | 3.461 |
| HS_48.1 | 0.0008559 | 0.0087782 | 3.416 |
| hsa-miR-584 | 0.0009022 | 0.0090124 | 3.242 |
| hsa-miR-493 | 0.0000688 | 0.0022763 | 3.191 |
| hsa-miR-494 | 0.0000451 | 0.0022663 | 3.177 |
| hsa-miR-376c | 0.0009386 | 0.0091286 | 3.034 |
|
hsa-miR-221* | 0.0006731 | 0.0082695 | 2.856 |
|
hsa-miR-501-5p | 0.0007310 | 0.0083292 | 2.767 |
|
hsa-miR-376* | 0.0009989 | 0.0092487 | 2.293 |
| Downregulated
miRNAs | | | |
|
hsa-miR-145* | 0.0007459 | 0.0083292 | 0.372 |
| hsa-miR-571 | 0.0009117 | 0.0090124 | 0.348 |
|
hsa-miR-29b-2* | 0.0002152 | 0.0041860 | 0.329 |
| hsa-miR-328 | 0.0003520 | 0.0054425 | 0.321 |
| hsa-miR-766 | 0.0005702 | 0.0076407 | 0.311 |
|
hsa-miR-195* | 0.0004025 | 0.0059197 | 0.279 |
|
hsa-miR-9* | 0.0002684 | 0.0047352 | 0.265 |
|
hsa-miR-30c-2* | 0.0003862 | 0.0058220 | 0.263 |
| hsa-miR-1272 | 0.0002412 | 0.0045451 | 0.238 |
| hsa-miR-1270 | 0.0009629 | 0.0092163 | 0.229 |
| hsa-miR-363 | 0.0009986 | 0.0092487 | 0.229 |
|
hsa-miR-138-1* | 0.0004803 | 0.0065823 | 0.215 |
| hsa-miR-20b | 0.0008063 | 0.0085520 | 0.212 |
| hsa-miR-597 | 0.0002827 | 0.0047352 | 0.200 |
|
hsa-miR-30a* | 0.0000755 | 0.0022763 | 0.195 |
| hsa-miR-9 | 0.0006589 | 0.0082695 | 0.180 |
| HS_182.1 | 0.0000926 | 0.0024277 | 0.163 |
|
solexa-3695-237 | 0.0000065 | 0.0008341 | 0.159 |
|
hsa-miR-885-5p | 0.0000755 | 0.0022763 | 0.146 |
| hsa-miR-133a | 0.0001340 | 0.0032321 | 0.134 |
| HS_132.1 | 0.0001420 | 0.0032933 | 0.133 |
|
hsa-miR-139-3p | 0.0000612 | 0.0022763 | 0.129 |
| hsa-miR-504 | 0.0000633 | 0.0022763 | 0.119 |
|
hsa-miR-129* | 0.0000233 | 0.0015611 | 0.091 |
| hsa-miR-383 | 0.0000259 | 0.0015618 | 0.073 |
| hsa-miR-1 | 0.0004601 | 0.0064521 | 0.049 |
| hsa-miR-133b | 0.0000082 | 0.0008341 | 0.044 |
| hsa-miR-187 | 0.0000083 | 0.0008341 | 0.030 |
|
hsa-miR-490-5p | 0.0000012 | 0.0002412 | 0.019 |
|
hsa-miR-490-3p | 0.0000002 | 0.0000904 | 0.015 |
| Table IV.Aberrantly expressed miRNAs in HT-29
cells exposed to celecoxib campared with the control groupa. |
Table IV.
Aberrantly expressed miRNAs in HT-29
cells exposed to celecoxib campared with the control groupa.
| miRNAs | Fold
differenceb |
|---|
| Upregulated
miRNAs | |
| HS_188 | 2.92 |
| HS_203 | 2.34 |
| HS_22.1 | 2.21 |
| HS_243.1 | 2.74 |
| HS_43.1 | 2.24 |
|
hsa-let-7f-1* | 2.44 |
|
hsa-let-7i* | 4.62 |
|
hsa-miR-129-3p | 3.54 |
| hsa-miR-1303 | 2.44 |
| hsa-miR-141 | 3.37 |
|
hsa-miR-142-5p | 5.33 |
| hsa-miR-301a | 2.11 |
|
hsa-miR-30c-1* | 2.71 |
| hsa-miR-33b | 2.38 |
| hsa-miR-570 | 2.25 |
| hsa-miR-647 | 2.98 |
|
hsa-miR-886-3p | 2.58 |
|
solexa-2526-361 | 2.33 |
|
solexa-499-2217 | 2.42 |
|
solexa-826-1288 | 4.08 |
| Downregulated
miRNAs | |
| HS_58 | 0.39 |
| hsa-miR-1244 | 0.20 |
| hsa-miR-1268 | 0.35 |
|
hsa-miR-26a-1* | 0.38 |
| hsa-miR-552 | 0.47 |
| hsa-miR-622 | 0.43 |
|
solexa-3044-295 | 0.25 |
|
solexa-603-1846 | 0.31 |
Validation of the microarray data by
miRNA RT-PCR analysis
To confirm the results from the microarray analysis,
the expression levels of miR-552, miR-142-3p, miR-139-3p and
miR-133b (the novel and major miRNAs of particular interest in the
CRC of these specimens identified in the microarray study described
above) were measured using Q-RT-PCR in all 25 CRC cases and 10
normal colorectal mucosae (Table
V). The major deregulated miRNAs, miR-26a-1* and
miR-142-5p, in the HT-29 cells treated with celecoxib were also
confirmed using the same method. As expected, a statistically
significant upregulation in the expression of miR-552 and
miR-142-3p was observed in the cancer group compared with the
normal tissue group (miR-552: cancer group, 2.97±2.72 vs. normal
group, 0.98±0.48; miR-142-3p: cancer group, 3.64±3.41 vs. normal
group, 1.31±0.61; P<0.05), while miR-139-3p and miR-133b were
downregulated (miR-139-3p: cancer group, 0.81±0.67 vs. normal
group, 1.71±1.29; miR-133b: cancer group, 0.10±0.26 vs. normal
group, 0.82±0.70; P<0.05). Similarly, miR-142-5p was found to be
upregulated, while miR-26a-1* was downregulated in the
HT-29 cells exposed to celecoxib (miR-142-5p: control group,
1.4±0.26 vs. treated group, 5.16±0.47; miR-26a-1*:
control group, 0.95±0.09 vs. treated group 0.34±0.06). Q-RT-PCR
results were found to be in accordance with the microarray analysis
results.
| Table V.Verification of the expression of
various miRNAs using Q-RT-PCR. |
Table V.
Verification of the expression of
various miRNAs using Q-RT-PCR.
| miRNA expression
level (mean ± SD)a
|
| miRNA | Colorectal
cancer | Normal tissue |
|
| miR-552 | 2.97±2.72 | 0.98±0.48 |
| miR-142-3p | 3.64±3.41 | 1.31±0.61 |
| miR-139-3p | 0.81±0.67 | 1.71±1.29 |
| miR-133b | 0.10±0.26 | 0.82±0.70 |
|
| HT-29 cells exposed
to celecoxib | HT-29 cells exposed
to DMSO |
|
| miR-142-5p | 5.16±0.47 | 1.4±0.26 |
|
miR-26a-1* | 0.34±0.06 | 0.95±0.09 |
Clinicopathological features and miRNA
expression
Certain major miRNAs detected in the CRC through
microarray analysis, including miR-552, miR-142-3p, miR-139-3p and
miR-133b, that may have potential clinical significance were
further analyzed according to the clinicopathological features of
the patients, including age, gender, tumor size, lymph node and
distance metastases, clinical stage and histological grade
(Table VI). miR-552 was found to
be correlated with TNM stage, lymph node and distance metastasis
(P<0.05), but not with age, gender, size of tumor or
histological grade. TNM stage and distant metastasis were
associated with the differential expression of miR-139-3p, and
histological grade disclosed aberrant expression of miR-142-3p. The
other features did not demonstrate any association with the
differentially expressed miRNAs.
| Table VI.Correlation between
clinicopathological features and expression of four miRNAs. |
Table VI.
Correlation between
clinicopathological features and expression of four miRNAs.
| | P-valuea
|
|---|
| Clinicopathological
feature | No. of cases | miR-552 | miR-142-3p | miR-133b | miR-139-3p |
|---|
| Age (years) | | | | | |
| >50 | 21 | 0.642 | 0.193 | 0.028* | 0.429 |
| ≤50 | 4 | | | | |
| Gender | | | | | |
| Male | 6 | 0.471 | 0.391 | 0.567 | 0.252 |
| Female | 19 | | | | |
| Histological
grade | | | | | |
| High | 1 | 0.755 | 0d | 0.68 | 0.303 |
| Moderate | 19 | | | | |
| Poor | 5 | | | | |
| TNM stageb | | | | | |
| I | 5 | 0.024d | 0.856 | 0.476 | 0.012d |
| II | 8 | | | | |
| III | 7 | | | | |
| IV | 5 | | | | |
| Lymph node
involvement | | | | | |
| (+) | 12 | 0.004d | 0.728 | 0.255 | 0.057 |
| (−) | 13 | | | | |
| Liver
metastasis | | | | | |
| (+) | 5 | 0.016d | 0.882 | 0.466 | 0.001d |
| (−) | 20 | | | | |
| Tumor size
(cm) | | | | | |
| >5 | 14 | 0.136 | 0.239 | 0.585 | 0.811 |
| ≤5 | 11 | | | | |
| Depth of tumor
invasionc | | | | | |
| Mucosa | 6 | 0.268 | 0.542 | 0.614 | 0.178 |
| Serosa | 19 | | | | |
miRNA target prediction, enrichment
analysis and GeneGo pathway annotation based on HT-29 cell miRNA
expression alteration
The computer and bioinformatic based predictions
demonstrated that numerous mRNAs are able to be regulated by one
miRNA and one mRNA simultaneously can been manipulated by several
miRNAs, which indicates the complicated regulation network between
miRNAs and their target mRNAs. Using six mature deregulated miRNAs,
miR-142-5p, miR-33b, miR-570, miR-647, miR-622 and miR-552, we
listed several of their target genes (Table VII) according to predictions from
three databases. To overcome this, two functional analyses,
enrichment and GeneGo pathway analysis, were then used to further
detect the predicted genes targeted by the aberrant miRNAs in the
HT-29 cell treated with celecoxib.
| Table VII.Target genes of six selected
deregulated miRNAs in the HT-29 cells treated with celecoxib. |
Table VII.
Target genes of six selected
deregulated miRNAs in the HT-29 cells treated with celecoxib.
| miRNA | Target
genesa |
|---|
| Upregulated
miRNAs | | | | | |
|
hsa-miR-142-5p | RAD50 | WWWP1 | PRKCB | FGF13 | FAM70A |
| MYO3B | RNF128 | RPS6KA4 | PRPF4B | TMF1 |
| hsa-miR-33b | ABCA1 | UBE2D1 | SEMA5B | ROD1 | MEIS2 |
| PTK7 | RAD10 | YWHAH | LRRC4 | MKRN1 |
| miR-570 | STIM2 | MKRN1 | PCNXL2 | CPEB2 | ANKRD12 |
| AXIN1 | P4HA1 | SLC6A15 | PAN3 | PLOD2 |
| miR-647 | APPBP2 | GTDC1 | DPF2 | ATP8A2 | DAGLA |
| NFIX | SRF | ODZ4 | ATP8A2 | CRRC8A |
| Downregulated
miRNAs | | | | | |
| miR-552 | RALBP1 | PRDM1 | CELSR3 | RPS6KB1 | SMARCD2 |
| NUP210 | SBF2 | CYP46A1 | DIP2C | ATM |
| hsa-miR-622 | MYH9 | ATXN1 | MAPK8IP3 | NFX1 | NFIX |
| ODZ4 | MBNL1 | ZER1 | CLPB | PPM1E |
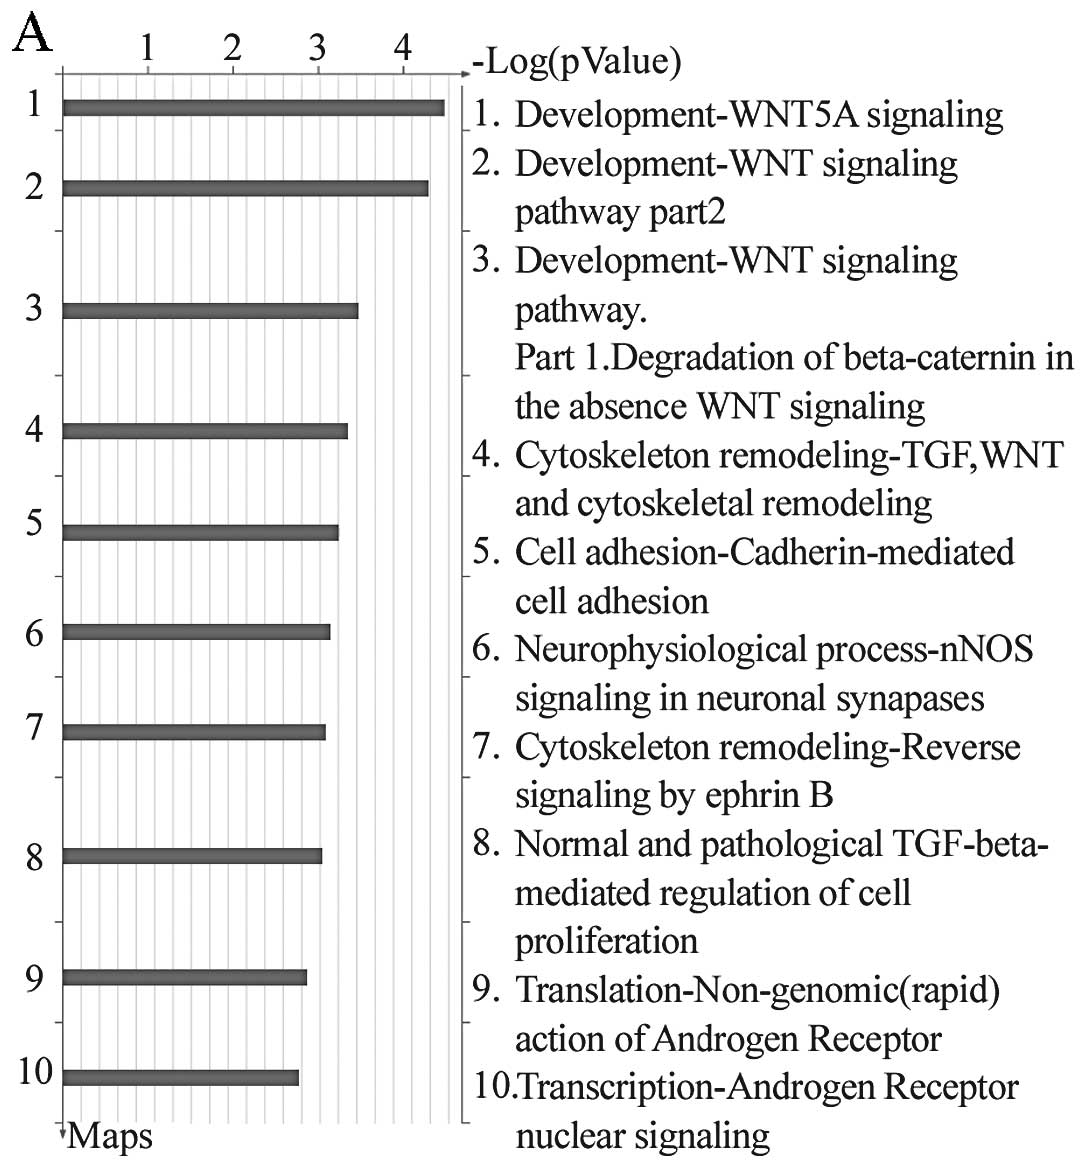
The high-enrichment analysis demonstrated that genes
targeted by aberrant miRNAs following celecoxib intervention were
involved in carbohydrate, protein and lipid metabolism, cell
proliferation and regulation, apoptosis and cell cycle regulation,
cell differentiation, cell adhesion regulation and angiogenesis.
For example, target genes of miR-622 determined by the MetaCore
database, were involved in cytoskeletal remodeling and cell
adhesion-chemokine and adhesion pathways. However, target genes of
miR-570 were involved in pathways for WNT5A-development signaling
and WNT-development signaling (Fig.
1). Furthermore, GeneGo analysis revealed that almost 650
pathways, including metabolism, growth, differentiation, apoptosis
and signal transduction, may participate in CRC carcinogenesis.
Discussion
In the present study, we identified 65 miRNAs that
were deregulated in CRCs compared with normal tissues, of which, 35
miRNAs were upregulated and 30 miRNAs were downregulated. These
results demonstrated that aberrant expression of miRNAs is involved
in human carcinogenesis of the colorectum, and that expression of
specific miRNAs could have the potential to select early-stage CRC.
However, at present, the expression profiles of miRNAs in previous
studies focusing on aberrant miRNAs in CRCs were not identical and
certain studies even revealed contrasting results (19–21).
Although expression of 13 miRNAs, including miR-96, miR-31,
miR-592, miR-135b, miR-183, miR-142-3p, miR-335, miR-32, miR-1,
miR-9, miR-133a, miR-133b and miR-187, demonstrated no difference
compared to previous studies, other aberrant miRNAs in our study
were not consistent with previously reported results. We consider
this to be due to differences in patient ethnicities, locations,
genes, research methods and screening criteria. Therefore, this
could be solved through perfecting the study methods and
establishing unanimous screening standards in the near future.
Regarding the tissue specificity of miRNAs, previous
studies have suggested that different miRNAs are likely to be
deregulated in cancers of different cellular origins. For example,
miR-21 and miR-155 were found to be uniquely over-expressed in
pancreatic cancer compared to normal pancreas and chronic
pancreatitis (9), while miR-125b
and miR-145 were significantly deregulated in breast cancer
(16). Moreover, due to the
smaller number of miRNAs than the protein-coding genes, unique yet
differential miRNA expression patterns may correlate more
accurately with cancer type, stage and clinicopathological
variables than gene profiling, which implied the specificity of the
miRNAs as confirmed by Rosenfeld et al and Lu et al
in their recent respective studies (22,23).
In our study, certain aberrantly expressed miRNAs in the cancer
tissues compared with normal mucosa, including upregulated miRNAs,
miR-549, miR-662, miR-142-5p, miR-431, miR-219-5p, miR-660,
miR-21*, miR-452, miR-154*, miR-182*,
miR-584, miR-494, miR-376c and miR-376a, and downregulated miRNAs,
miR-29b-2*, miR-328, miR-363, miR-20b, miR-597, miR-504
and miR-383, identified in CRCs were also found to be deregulated
in other malignancies in previous studies, which did not display
the specificity phenomenon. However, the other 13 miRNAs, miR-96,
miR-31, miR-183, miR-135b, miR-142-3p, miR-335, miR-32, miR-9/9*,
miR-1, miR-133a, miR-133b and miR-187, were found to be deregulated
in CRC in our study and several previous studies targeting CRCs and
have been seldom demonstrated in other cancer types (21,24–26),
which might infer the tissue specificity of these aberrant miRNAs
in human CRCs. Therefore, a small set of aberrant miRNAs mentioned
above in our study not only distinguishing malignant tissues from
normal tissue in the human colorectum, but also could be used to
differentiate CRC tissues from the advanced cancer pool with
unknown origin.
In addition to identifying the deregulated miRNAs in
the CRC tissues, certain miRNAs which might have potential clinical
significance as suggested by the functional analysis were found to
be differentially expressed in distinct clinicopathological
features. In this study, miR-552 was mostly overexpressed in lymph
node and distant metastasis-positive colon cancers, suggesting that
upregulation of this miRNA could be associated with a poorer
prognosis. Furthermore, miR-139-3p, whose expression identified
cancer tissue from normal tissue, was differentially expressed in
cancers of different stages and grades. These findings indicate
that deregulation of these two miRNAs are not only involved in the
development of CRC, but also affect the molecular events in the
progression of CRC. However, the comprehensive significance of all
of these aberrant miRNAs in our study require further confirmation
through further studies involving a greater number of clinical
patients.
Studies have revealed that aberrant miRNAs involved
in tumorgenesis play a role as either an oncogene or a tumor
suppressor depending on which genes they are targeting. Certain
miRNAs, including let-7, miR-16, miR-10b, miR-125b and miR-145,
were found to be downregulated and demonstrated a tumor-suppressor
role in several types of cancers (27,28),
while others, including miR-17, miR-19, miR-21 and miR-155 may play
a role as oncogenes through overexpression (29,30).
In this study, 65 aberrant miRNAs in CRCs as compared to normal
tissues were observed to be oncogenes or tumor suppressors. Among
these, 8 overexpressed miRNAs, including miR-96, miR-31, miR-592,
miR-135b, miR-183, miR-142-3p, miR-335 and miR-32, may play roles
as oncogenes and 5 downregulated miRNAs, including miR-1, miR-9,
miR-133a, miR-133b and miR-187, may act as tumor suppressors; this
was consistent with previous studies, therefore warranting further
study.
In this study, we further found that following 48 h
of exposure to celecoxib, the HT-29 cell growth was inhibited,
accompanied with an alteration of the miRNA expression profile. The
microarray results identified 28 aberrantly expressed miRNAs, of
which 20 miRNAs were upregulated and 8 were downregulated.
Therefore, we speculated that miRNA may be involved in the growth
inhibitory role of celecoxib in CRC which elucidated additional
mechanisms in the prevention and even treatment of CRC apart from
inducing apoptosis and retarding the cell cycle. Four mature
miRNAs, miR-33b, miR-30c-1, miR-647, miR-142-5p, have been reported
to be associated with certain other cancer types, including
endometrial, familial breast, non-small cell lung cancer and
chronic lymphocytic leukemia, but CRC in previous studies (31–34).
However, in our study, these four molecules were found to be
upregulated in CRC cells treated with celecoxib. In addition,
studies have revealed that colon cancer tumors and a variety of
in vitro cultured tumor cell lines exhibited low expression
of let7, while it was highly expressed in adjacent normal tissues
(35). let7 targets a number of
genes, including K-RAS, H-RAS, HMGA2, C-MYC and NF2, playing a
negative regulatory role (36–39).
Notably, upon intervention with celecoxib, expression of let-7i, a
member of of the let-7 family, in HT-29 cells was significantly
increased, indicating its role as a tumor-suppressor gene in our
study.
In order to comprehensively understand the roles of
the differentially expressed miRNAs during HT-29 cell growth
inhibition folowing celecoxib intervention, the target genes and
mechanism of regulation require further exploration. Through the
use of three miRNA databases, we identified that a number of
molecules involved in cell growth, apoptosis, metabolism and signal
transduction, were target genes of these aberrantly expressed
miRNAs, and each differentially expressed miRNA was able to
regulate multiple target genes. Several genes, including PDGFRA,
ROCK-2, EPHA3, AXIN1, CTNNB1, ACTN1, EIF4G1 and RASA3, previously
involved in the pathogenesis of certain types of cancer were found
to be targeted by miR-33b, miR-570 and miR-647 in our study,
demonstrating their anti-tumor role in CRC.
Results from the GeneGo analysis revealed that
target genes regulated by deregulated miRNAs could participate in
several signaling pathways, including cytoskeletal remodeling, cell
adhesion-chemokine and adhesion, neurophysiological
process-receptor mediated axon growth repulsion, Wnt/β-catenin
pathway, cytoskeletal remodeling-role of PDGFs in cell migration,
cytoskeletal remodeling-TGF, WNT and cytoskeletal remodeling
involving several biological processes, including cell
proliferation and regulation, apoptosis cell cycle regulation, cell
differentiation, cell adhesion regulation and angiogenesis.
Furthermore, following further enrichment analysis, one result
which aroused great interest was that one of the downregulated
miRNAs, miR-570, targeted genes CTNNB1, β-catenin, AXIN1 and FZD7.
Therefore, we have reason to consider that miR-570 may modulate the
WNT/β-catenin pathway, which could then inhibit the growth of CRC
cells. miR-570 may become a potential therapeutic target for CRC,
however, further studies are required to determine this.
In conclusion, the results of the present study
require validation by further investigation using larger CRC
patient cohorts. However, despite its limitations, this study
suggests that miRNAs affect the carcinogenesis of human CRC, and
these cancer-associated miRNA signatures may become useful tools
for identifying patients with early-stage CRC, and may thus improve
the clinical outcome. miRNAs are involved in the celecoxib
intervention process in CRC and may add new mechanism to its
inhibitory role. The findings of the present study have expanded
our knowledge of the molecular alterations involved in human CRC
pathogenesis and the role of miRNAs in human cancer.
Acknowledgements
The authors thank the National
Engineering Center for Biochip at Shanghai and Genminix Co. for
providing technical assistance. This work is supported by the 333
Program of Science and Research Foundation of Jiangsu Province,
China (no. 37RC2002037), the Medical Foundation of the Public
Health Department of Jiangsu Province, China (no. H200959) and the
Foundation of Science and Technology Burea of Suzhou, Jiangsu
Province, China (no. YJS0915).
References
|
1.
|
Lee HK, Choi YS, Park YA and Jeong S:
Modulation of oncogenic transcription and alternative splicing by
β-catenin and an RNA aptamer in colon cancer cells. Cancer Res.
66:10560–10566. 2006.
|
|
2.
|
Casey G, Lindor NM, Papadopoulos N,
Thibodeau SN, Moskow J, Steelman S, Buzin CH, Sommer SS, Collins
CE, Butz M, Aronson M, Gallinger S, Barker MA, Young JP, Jass JR,
Hopper JL, Diep A, Bapat B, Salem M and Seminara D: Conversion
analysis formutation detection in MLH1 and MSH2 in patients with
colorectal cancer. JAMA. 293:799–809. 2005. View Article : Google Scholar : PubMed/NCBI
|
|
3.
|
Hung KE and Chung DC: New insights into
the molecular pathogenesis of colorectal cancer. Drug Discov Today
Dis Mech. 3:439–445. 2006. View Article : Google Scholar : PubMed/NCBI
|
|
4.
|
Bartel DP: MicroRNAs: genomic, biogenesis,
mechanism, and function. Cell. 116:281–297. 2004. View Article : Google Scholar : PubMed/NCBI
|
|
5.
|
Gregory RI, Yan KP, Amuthan G, Chendrimada
T, Doratotaj B, Cooch N and Shiekhattar R: The microprocessor
complex mediates the genesis of microRNAs. Nature. 432:235–240.
2004. View Article : Google Scholar : PubMed/NCBI
|
|
6.
|
Lewis BP, Burge CB and Bartel DP:
Conserved seed pairing, often flanked by adenosines, indicates that
thousands of human genes are microRNA targets. Cell. 120:15–20.
2005. View Article : Google Scholar : PubMed/NCBI
|
|
7.
|
Calin GA, Dumitru CD, Shimizu M, Bichi R,
Zupo S, Noch E, Aldler H, Rattan S, Keating M, Rai K, et al:
Frequent deletions and down-regulation of microRNA genes miR15 and
miR16 at 13q14 in chronic lymphocytic leukemia. Proc Natl Acad Sci
USA. 99:15524–15529. 2002. View Article : Google Scholar : PubMed/NCBI
|
|
8.
|
Takamizawa J, Konishi H, Yanagisawa K,
Tomida S, Osada H, Endoh H, Harano T, Yatabe Y, Nagino M, Nimura Y,
Mitsudomi T and Takahashi T: Reduced expression of the let-7
microRNAs in human lung cancers in association with shortened
postoperative survival. Cancer Res. 64:3753–3756. 2004. View Article : Google Scholar : PubMed/NCBI
|
|
9.
|
Bloomston M, Frankel WL, Petrocca F,
Volinia S, Alder H, Hagan JP, Liu CG, Bhatt D, Taccioli C and Croce
CM: MicroRNA expression patterns to differentiate pancreatic
adenocarcinoma from normal pancreas and chronic pancreatitis. JAMA.
297:1901–1908. 2007. View Article : Google Scholar
|
|
10.
|
Nagel R, Le Sage C, Diosdado B, van der
Waal M, Oude Vrielink JA, Bolijn A, Meijer GA and Agami R:
Regulation of the adenomatous polyposis coli gene by the miR-135
family in colorectal cancer. Cancer Res. 68:5795–5802. 2008.
View Article : Google Scholar : PubMed/NCBI
|
|
11.
|
Motoyama K, Inoue H, Takatsuno Y, Tanaka
F, Mimori K, Uetake H, Sugihara K and Mori M: Over- and
under-expressed microRNAs in human colorectal cancer. Int J Oncol.
34:1069–1075. 2009.PubMed/NCBI
|
|
12.
|
Valeri N, Croce CM and Fabbri M:
Pathogenetic and clinical relevance of microRNAs in colorectal
cancer. Cancer Genomics Proteomics. 6:195–204. 2009.PubMed/NCBI
|
|
13.
|
Toyoshima T, Kamijo R, Takizawa K,
Sumitani K, Ito D and Nagumo M: Inhibitor of cyclooxygenase-2
induces cell-cycle arrest in the epithelial cancer cell line via
up-regulation of cyclin dependent kinase inhibitor p21. Br J
Cancer. 6:1150–1156. 2002. View Article : Google Scholar : PubMed/NCBI
|
|
14.
|
Johnson AJ, Hsu AL, Lin HP, Song X and
Chen CS: The cyclooxygenase-2 inhibitor celecoxib perturbs
intracellular calcium by inhibiting endoplasmic reticulum
Ca2+-ATPases: a plausible link with its antitumor effect
and cardiovascular risks. Biochem J. 366:831–837. 2002.PubMed/NCBI
|
|
15.
|
Zhu J, Huang JW, Tseng PH, Yang YT, Fowble
J, Shiau CW, Shaw Y, Kulp SK and Chen CS: From the cyclooxygenase-2
inhibitor celecoxib to a novel class of
3-phosphoinositide-dependent protein kinase-1 inhibitors. Cancer
Res. 64:4309–4318. 2004. View Article : Google Scholar : PubMed/NCBI
|
|
16.
|
Iorio MV, Manuela F, Liu CG, Angelo V,
Spizzo R, Sabbioni S, Magri E, Pedriali M, Fabbri M, Campiglio M,
Ménard S, Palazzo JP, Rosenberg A, Musiani P, Volinia S, Nenci I,
Calin GA, Querzoli P, Negrini M and Croce CM: MicroRNA gene
expression deregulation in human breast cancer. Cancer Res.
65:7065–7070. 2005. View Article : Google Scholar : PubMed/NCBI
|
|
17.
|
Feber A, Xi L, Luketich JD, Pennathur A,
Landreneau RJ, Wu M, Swanson SJ, Godfrey TE and Litle VR: MicroRNA
expression profiles of esophageal cancer. J Thorac Cardiovasc Surg.
135:255–260. 2008. View Article : Google Scholar
|
|
18.
|
Griffiths-Jones S, Grocock RJ, van Dongen
S, Bateman A and Enright AJ: miRBase: microNRA sequences, target
and gene nomenclature. Nucleic Acids Res. 34:140–144. 2006.
View Article : Google Scholar : PubMed/NCBI
|
|
19.
|
Michael MZ, O’Connor SM, van Holst
Pellekaan NG, Young GP and James RJ: Reduced accumulation of
specific microRNAs in colorectal neoplasia. Mol Cancer Res.
1:882–891. 2003.PubMed/NCBI
|
|
20.
|
Schetter AJ, Leung SY, Sohn JJ, Zanetti
KA, Bowman ED, Yanaihara N, Yuen ST, Chan TL, Kwong DLW, Au GKH, et
al: MicroRNA expression profiles associated with prognosis and
therapeutic outcome in colon adenocarcinoma. JAMA. 299:425–436.
2008. View Article : Google Scholar : PubMed/NCBI
|
|
21.
|
Sarver AL, French AJ, Borralho PM,
Thayanithy V, Oberg AL, Bergemann TL, Gupta M, O’Sullivan MG,
Matise I, Dupuy AJ, et al: Human colon cancer profiles show
differential microRNA expression depending on mismatch repair
status and are characteristic of undifferentiated proliferative
states. BMC Cancer. 9:401–406. 2009. View Article : Google Scholar
|
|
22.
|
Rosenfeld N, Aharonov R, Meiri E,
Rosenwald S, Spector Y, Zepeniuk M, Benjamin H, Shabes N, Tabak S,
Levy A, et al: MicroRNAs accurately identify cancer tissue origin.
Nat Biotechnol. 26:462–469. 2008. View
Article : Google Scholar : PubMed/NCBI
|
|
23.
|
Lu J, Getz G, Miska EA, Alvarez-Saavedra
E, Lamb J, Peck D, Sweet-Cordero A, Ebert BL, Mak RH, Ferrando AA,
et al: MicroRNA expression profiles classify human cancers. Nature.
435:834–838. 2005. View Article : Google Scholar : PubMed/NCBI
|
|
24.
|
Bandres E, Cubedo E, Agirre X, Malumbres
R, Zarate R, Ramirez N, Abajo A, Navarro A, Moreno I, Monzo M and
Garcia-Foncillas J: Identification by real-time PCR of 13 mature
microRNAs differentially expressed in colorectal cancer and
non-tumoral tissues. Mol Cancer. 5:292006. View Article : Google Scholar : PubMed/NCBI
|
|
25.
|
Bandres E, Agirre X, Bitarte N, Ramirez N,
Zarate R, Roman-Gomez J, Prosper F and Garcia-Foncillas J:
Epigenetic regulation of microRNA expression in colorectal cancer.
Int J Cancer. 125:2737–2743. 2009. View Article : Google Scholar : PubMed/NCBI
|
|
26.
|
Schepeler T, Reinert JT, Ostenfeld MS,
Christensen LL, Silahtaroglu AN, Dyrskjøt L, Wiuf C, Sørensen FJ,
Kruhøffer M, Laurberg S, et al: Diagnostic and prognostic microRNAs
in stage II colon cancer. Cancer Res. 68:6416–6124. 2008.
View Article : Google Scholar : PubMed/NCBI
|
|
27.
|
Johnson SM, Grosshans H, Shingara J, Byrom
M, Jarvis R, Cheng A, Labourier E, Reinert KL, Brown D and Slack
FJ: RAS is regulated by the let-7 microRNA family. Cell.
120:635–647. 2005. View Article : Google Scholar : PubMed/NCBI
|
|
28.
|
Cimmino A, Calin GA, Fabbri M, Iorio MV,
Ferracin M, Shimizu M, Wojcik SE, Aqeilan RI, Zupo S, Dono M, et
al: miR-15 and miR-16 induce apoptosis by targeting BCL2. Proc Natl
Acad Sci USA. 102:13944–13949. 2005. View Article : Google Scholar : PubMed/NCBI
|
|
29.
|
He L, Thomson JM, Hemann MT, Hernando-Mong
E, Mu D, Goodson S, Powers S, Cordon-Cardo C, Lowe SW, Hannon GJ
and Hammond SM: A microRNA polyistron as a potential human
oncogene. Nature. 435:828–833. 2005. View Article : Google Scholar : PubMed/NCBI
|
|
30.
|
Huang GL, Zhang XH, Guo GL, Huang KT, Yang
KY, Shen X, You J and Hu XQ: Clinical significance of miR-21
expression in breast cancer: SYBR-Green I-based real-time RT-PCR
study of invasive ductal carcinoma. Oncol Rep. 21:673–679.
2009.PubMed/NCBI
|
|
31.
|
Calin GA, Sevignani C, Ferrai JG, Hyslop
T, Noch E, Yendamuri S, Shimizu M, Rattan S, Bullrich F, Negrini M
and Croce CM: Human microRNA genes are frequently located at
fragile sites and genomic regions involved in cancers. Proc Natl
Acad Sci USA. 101:2999–3004. 2004. View Article : Google Scholar : PubMed/NCBI
|
|
32.
|
Shen J, Ambrosone CB and Zhao H: Novel
genetic variants in microRNA genes and familial breast cancer. Int
J Cancer. 124:1178–1182. 2009. View Article : Google Scholar : PubMed/NCBI
|
|
33.
|
Patnaik SK, Kannisto E, Knudsen S and
Yendamuri S: Evaluation of microRNA expression profiles that may
predict recurrence of localized stage I non-small cell lung cancer
after surgical resection. Cancer Res. 70:36–45. 2010. View Article : Google Scholar : PubMed/NCBI
|
|
34.
|
Zanette DL, Rivadavia F, Jacoby S,
Barbuzano FG, Proto-Siqueira R, Silva WA Jr, Falcao RP and Zago MA:
MiRNA expression profiles in chronic lymphocytic and acute
lymphocytic leukemia. Braz J Med Bio Res. 40:1435–1440. 2007.
View Article : Google Scholar : PubMed/NCBI
|
|
35.
|
Bussing I, Slack FJ and Grosshans H: Let-7
microRNAs in development stem cells and cancer. Trends Mol Med.
14:400–409. 2008. View Article : Google Scholar : PubMed/NCBI
|
|
36.
|
Johnson SM, Grosshans H, Shingara J, Byrom
M, Jarvis R, Cheng A, Labourier E, Reinert KL, Brown D and Slack
FJ: RAS is regulated by the let-7 microRNA family. Cell.
120:635–647. 2005. View Article : Google Scholar : PubMed/NCBI
|
|
37.
|
Lee YS and Dutta A: The tumor suppressor
microRNA let-7 represses the HMGA2 oncogene. Genes Dev.
21:1025–1030. 2007. View Article : Google Scholar : PubMed/NCBI
|
|
38.
|
Sampson VB, Rong NH, Han J, Yang Q, Aris
V, Soteropoulos P, Petrelli NJ, Dunn SP and Krueger LJ: MicroRNA
let-7a down regulates MYC and reverts MYC-induced growth in Burkitt
lymphoma cells. Cancer Res. 67:9762–9770. 2007. View Article : Google Scholar : PubMed/NCBI
|
|
39.
|
Meng F, Henson R, Iinuma M, Smith H, Ueno
Y and Patel T: The microRNA let-7a modulates interleukin-6
dependent STAT-3 survival signaling in malignant human
cholangiocytes. J Biol Chem. 282:8256–8264. 2007. View Article : Google Scholar : PubMed/NCBI
|