Introduction
Diabetes mellitus is a complex metabolic disorder
that has become a major public health problem worldwide (1–3).
Characterized by insulin resistance, type 2 diabetes (T2D) is the
most common subtype of this chronic disease (1,3).
Dysfunction of pancreatic β-cells plays a central role in the
pathogenesis of diabetes and the individual genetic basis also
contributes to the development of this disease (1,4). T2D
usually results in numerous complications, including nephropathy,
retinopathy and the increased risk of renal failure, blindness and
thrombotic disease (1). Although a
number of studies have provided valuable information concerning the
pathogenesis and clinical treatment of T2D, the current preventive
and therapeutic methods are far from satisfactory.
MicroRNAs (miRNAs) are small single-stranded RNA
molecules that were first identified in Caenorhabditis
elegans(5,6). miRNAs are typically 18–26 nucleotides
in length and play a crucial role in gene expression by inducing
translational arrest and degradation of the mRNAs of target genes
(4,7). A number of studies have shown that
miRNAs regulate numerous key biological processes, including
embryonic development, cellular differentiation, apoptosis and
metabolic homeostasis (7–9).
miR-375 is a powerful regulator of pancreatic β-cell
function and is essential for normal glucose homeostasis (8,10).
miR-375 targets the mRNAs of myotrophin (Mtpn),
phosphoinositide-dependent protein kinase-1 (PDK-1) and
extracellular signal-regulated kinases 1/2 (ERK1/2) to perform
physiological and pathological processes, including insulin
secretion, the glucose effect and adipocyte differentiation
(4,7). miR-375 is abnormally expressed in the
serum of Chinese T2D patients (11). However, the precise regulation
mechanism of miR-375 expression is poorly understood in
diabetes.
Abnormal DNA methylation changes have been shown to
be involved in pancreatic β-cell dysfunction and apoptosis
(12,13). Peripheral DNA methylation
alterations were shown to predict the risk of coronary heart
disease (CHD) (14). Blood-based
epigenetic diabetes studies have the potential value of forecasting
the predisposition to the disease, including T2D (14). The miR-375 gene
(chr2:219866367–219866430) is located in the intergenic regions of
the CRYBA2 and CCDC108 genes (15). This locus and its vicinal area are
rich in CpGs that may regulate the expression of the miR-375 gene.
In the present study, we hypothesize that the methylation levels of
the miR-375 promoter region may contribute to the risk of T2D. We
used a non-invasive approach to compare the miR-375 methylation
levels of T2D patients with those of gender- and age-matched
healthy individuals. This study provides new evidence regarding the
identification of epigenetic biomarkers in T2D with a guidance
value in prevention and treatment.
Materials and methods
Subjects
This study included 48 T2D cases and 48 age- and
gender-matched healthy controls who were enrolled at The Affiliated
Hospital of Ningbo University (Ningbo, China). The detailed
characteristics of the subjects are described in Table I. All individuals were Han Chinese
living in Ningbo City for at least three generations. T2D patients
were recruited if the plasma glucose levels were >7.0 mmol/l at
fasting or >11.1 mmol/l at 2 h after glucose loading (16). All healthy controls were recruited
according to the standard of fasting blood glucose <6.1 mmol/l.
None of the controls had a family history of T2D in the first
degree relatives or had received any medication. Subjects were
excluded from this study if they had hypertension, CHD, renal
inadequacy, drug abuse or any other serious diseases. Our study was
approved by the ethics committee of Ningbo University and written
informed consent was obtained from all subjects. Blood samples were
collected in 3.2% citrate sodium-treated tubes and then stored at
−80°C for DNA extraction.
 | Table ICharacteristics of all subjects
(n=96). |
Table I
Characteristics of all subjects
(n=96).
| Characteristics | Mean ± SE | Range |
|---|
| Age (years) | 59.2±7.5 | 35–69 |
| Gender (M/F) | 48/48 | |
| BMI
(kg/m2)a | 23.71±3.28 | 17.15–42.96 |
| Total cholesterol
(mmol/l) | 5.19±0.96 | 2.95–7.90 |
| Total triglycerides
(mmol/l) | 1.60±1.36 | 0.40–9.92 |
| Glucose (mmol/l) | 6.76±2.65 | 4.38–22.84 |
| ALT (IU/l) | 21.5±15.9 | 5.0–99.0 |
| Uric acid
(μmol/l) | 294.9±81.1 | 132.0–531.0 |
| Methylation level
(%) | | |
| CpG1 | 6.81±2.13 | 2–13 |
| CpG2 | 6.94±2.73 | 3–19 |
| CpG3 | 8.57±2.56 | 5–20 |
| CpG4 | 15.35±4.56 | 5–26 |
| CpG5 | 13.40±4.78 | 5–35 |
| CpG6 | 13.08±5.18 | 6–38 |
| CpG7 | 4.49±1.74 | 0–12 |
| CpG8 | 5.83±1.99 | 2–12 |
Phenotype collection
Blood samples were obtained after a 12 h overnight
fast from the antecubital vein into vacutainer tubes containing
ethylenediamine tetraacetic acid (EDTA). Plasma levels of
cholesterol, triglycerides, alanine aminotransferase (ALT), uric
acid and glucose were enzymatically measured using a CX7 Analyzer
(Beckman Diagnostics, Fullerton, CA, USA).
DNA methylation assay
Human genomic DNA was isolated from peripheral blood
samples using the nucleic acid extraction automatic analyzer
(Lab-Aid 820, Zeesan, Xiamen, China). DNA was quantified using the
PicoGreen® double-strand (dsDNA) DNA Quantification kit
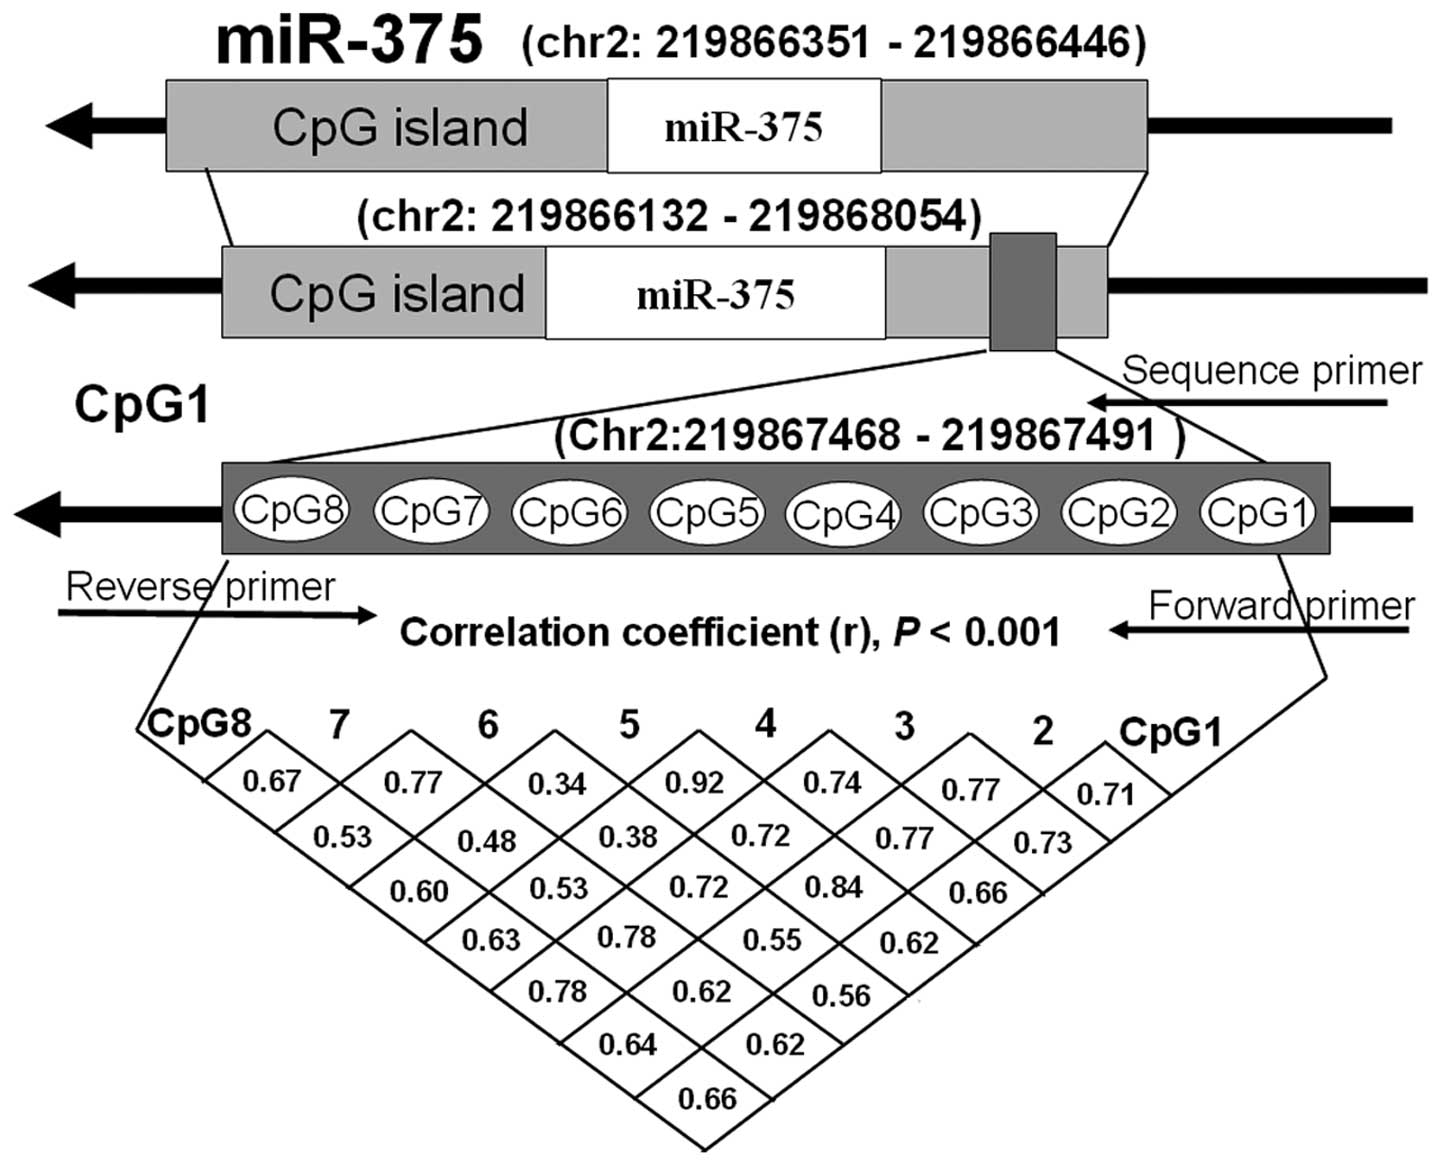
(Molecular Probes Inc., Eugene, OR, USA). Bisulfite pyrosequencing
technology was used to determine the methylation levels of the
eight CpG dinucleotide on the fragment (Chr2:219867468–219867491)
within the promoter of the miR-375 gene (Fig. 1). Pyrosequencing assays combined
sodium bisulfite DNA conversion chemistry, polymerase chain
reaction (PCR) amplification and sequencing by synthesis assay of
the target sequence. Sodium bisulfite preferentially deaminated
unmethylated cytosine residues to thymines (following PCR
amplification), whereas methylcytosines remained unmodified. PCR
primers were selected using PyroMark Assay Design software
v2.0.1.15 (Qiagen, Germany). The primers used in the PCR and
pyrosequencing assay are described in Table II.
| Table IIPrimers for miR-375 methylation
analysis. |
Table II
Primers for miR-375 methylation
analysis.
| Primer | Sequence |
|---|
| Forward |
5′-AGGAGGAGTTGTTGGAGAATATGA-3′ |
| Reverse |
5′-Biotin-ACTACCCCCCTAACCCCTCT-3′ |
| Sequencing |
5′-GTTTTGAGTGTTTAGGTAAGG-3′ |
Statistical analysis
Pearson’s Chi-square test was used to compare the
categorical variables. Differences in the mean values of continuous
variables between the two groups were compared with the Student’s
t-test. Using Pearson’s correlation analysis, the associations
between miR-375 methylation and metabolic characteristics of T2D
subjects were assessed. P<0.05 was considered to indicate a
statistically significant difference. All statistical analyses were
performed using Statistical Program for Social Sciences (SPSS)
software 17.0 (SPSS, Inc., Chicago, IL, USA).
Results
A total of 96 subjects consisting of 48 T2D cases
and 48 ageand gender-matched controls were recruited for the
present study. A fragment harboring eight CpG dinucleotides was
selected to measure the DNA methylation level of the miR-375 gene
promoter (Fig. 1). The clinical
characteristics and miR-375 DNA methylation levels of all subjects
are shown in Table I. As shown in
Table III, the majority of CpGs
(with the exception of CpG7) had significantly higher methylation
levels in women than in men (P<0.05).
| Table IIICharacteristics of all subjects
according to gender (n=96). |
Table III
Characteristics of all subjects
according to gender (n=96).
|
Characteristics | Male (n=48) | Female (n=48) | P-value |
|---|
| Age (years) | 59.1±8.6 | 59.4±6.3 | 0.850 |
| BMI
(kg/m2)a | 24.12±4.03 | 23.37±2.49 | 0.292 |
| Total cholesterol
(mmol/l) | 4.96±0.94 | 5.43±0.93 | 0.015 |
| Total triglycerides
(mmol/l) | 1.59±1.28 | 1.61±1.45 | 0.959 |
| Glucose
(mmol/l) | 6.77±3.07 | 6.76±2.19 | 0.995 |
| ALT (IU/l) | 25.8±20.6 | 17.3±7.4 | 0.009 |
| Uric acid
(μmol/l) | 325.6±79.0 | 264.3±71.6 | 0.000 |
| Methylation level
(%) | | | |
| CpG1 | 5.88±1.81 | 7.75±2.04 | 0.000 |
| CpG2 | 5.85±1.91 | 8.02±2.99 | 0.000 |
| CpG3 | 7.71±1.95 | 9.44±2.82 | 0.001 |
| CpG4 | 13.98±3.36 | 16.73±5.18 | 0.003 |
| CpG5 | 11.94±3.03 | 14.85±5.72 | 0.003 |
| CpG6 | 11.65±4.21 | 14.52±5.69 | 0.006 |
| CpG7 | 4.17±1.62 | 4.81±1.79 | 0.068 |
| CpG8 | 5.33±1.69 | 6.33±2.16 | 0.013 |
Although CpG6 had a relatively higher level of
methylation in the controls than in the T2D cases (Table IV, P=0.034), there were no
significant differences in the methylation levels of the other
seven CpGs (CpG1-5 and CpG7-8) between the T2D cases and the
healthy controls (P>0.05; Table
IV). The methylation levels of the eight CpGs were
significantly correlated with each other (r>0.30, P<0.001;
Fig. 1).
| Table IVCharacteristics of all subjects
according to the previous history of diabetes (n=96). |
Table IV
Characteristics of all subjects
according to the previous history of diabetes (n=96).
|
Characteristics | T2D (n=48) | Non-diabetic
(n=48) | P-value |
|---|
| Age (years) | 59.2±7.5 | 59.2±7.5 | 1.000 |
| BMI
(kg/m2)a | 24.17±4.18 | 23.18±1.64 | 0.146 |
| Total cholesterol
(mmol/l) | 5.34±0.83 | 5.05±1.06 | 0.140 |
| Total triglycerides
(mmol/l) | 1.90±1.69 | 1.31±0.82 | 0.034 |
| Glucose
(mmol/l) | 8.31±2.91 | 5.22±0.92 | 0.000 |
| ALT (IU/l) | 25.1±18.5 | 18.0±12.1 | 0.028 |
| Uric acid
(μmol/l) | 289.3±70.5 | 300.6±90.9 | 0.499 |
| Average methylation
level (%) | 9.09±2.07 | 9.53±3.15 | 0.417 |
| Methylation level
(%) | | | |
| CpG1 | 6.85±1.94 | 6.77±2.34 | 0.849 |
| CpG2 | 6.85±2.32 | 7.02±3.10 | 0.766 |
| CpG3 | 8.35±1.95 | 8.79±3.06 | 0.406 |
| CpG4 | 15.29±3.92 | 15.42±5.16 | 0.894 |
| CpG5 | 13.42±4.35 | 13.38±5.23 | 0.966 |
| CpG6 | 11.96±3.12 | 14.21±6.48 | 0.034 |
| CpG7 | 4.27±1.22 | 4.71±2.12 | 0.219 |
| CpG8 | 5.71±1.83 | 5.96±2.15 | 0.542 |
A breakdown analysis by gender demonstrated that the
methylation levels of all eight CpGs were not associated with an
increased risk of T2D in men (P>0.10; Table VA). Similar results were observed
in women (P>0.05; Table VB),
with the exception of a tendency of a higher methylation level of
CpG7 (P=0.046; Table V).
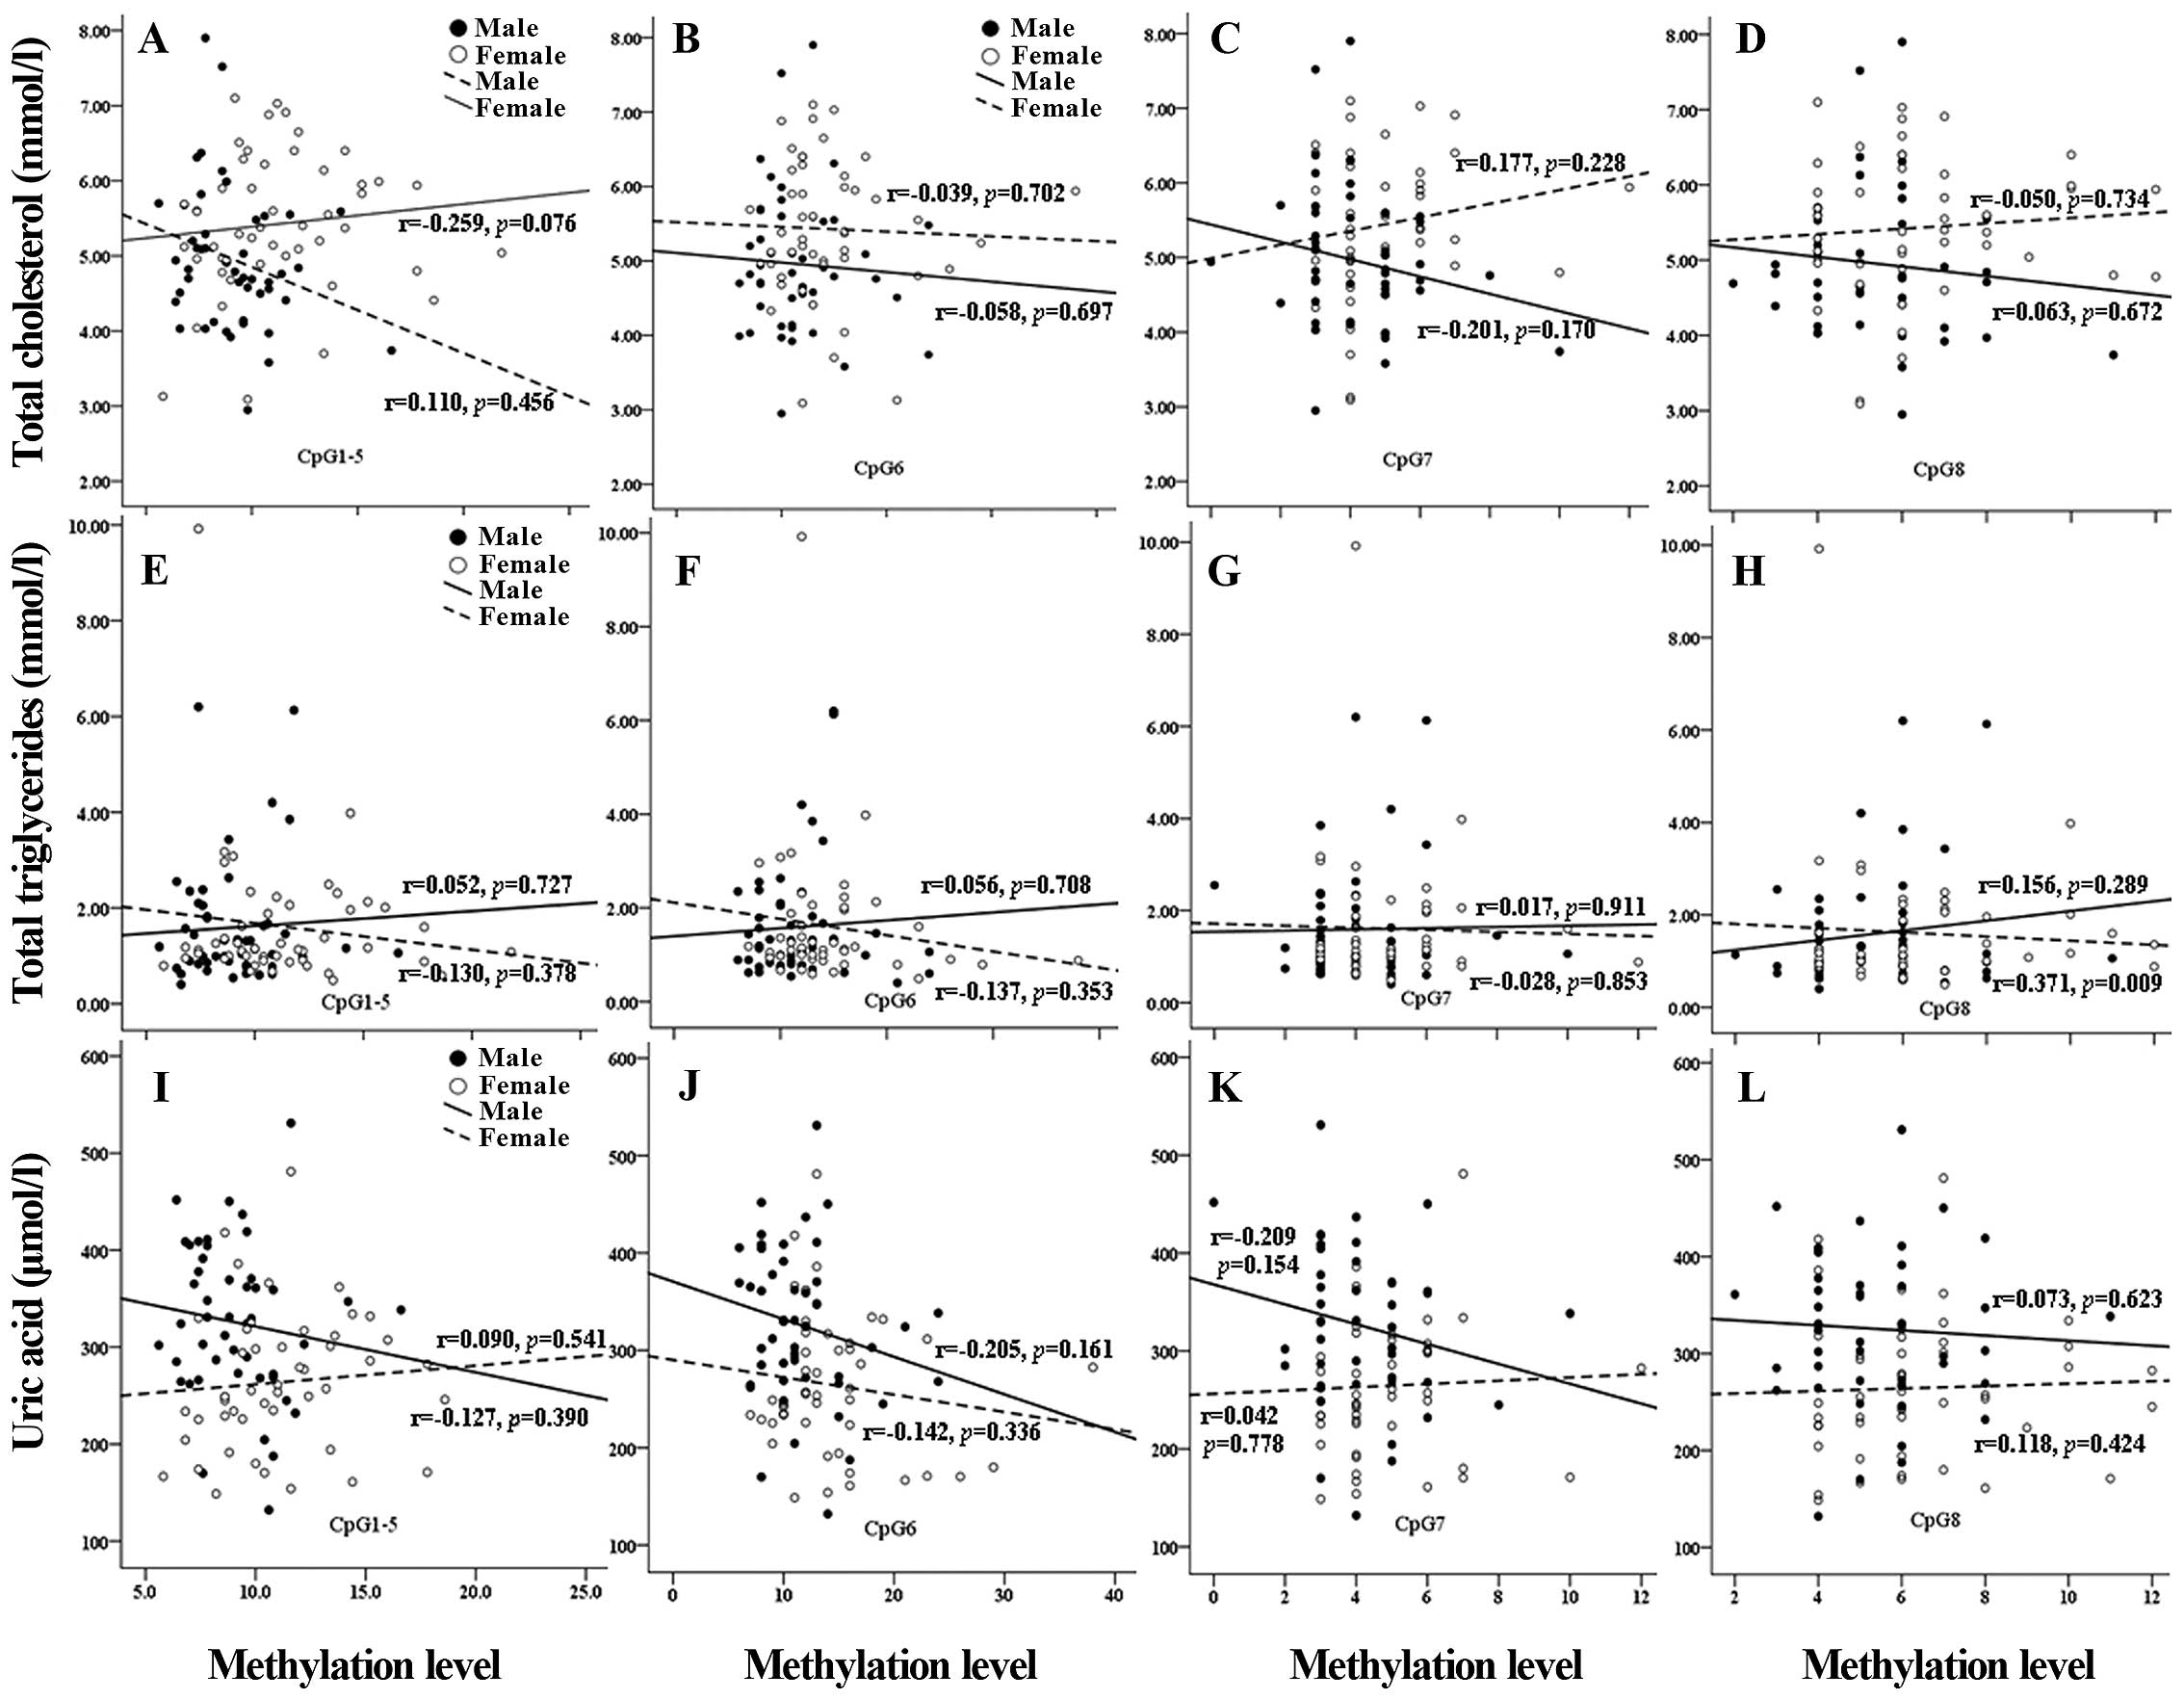
Furthermore, we analyzed the association between the CpG
methylation levels of miR-375 and clinical metabolic features
(total cholesterol, total triglycerides and uric acid levels) in
the two gender groups. No significant correlation was identified in
the above analysis (Fig. 2), with
the exception that there was a significant correlation between the
CpG8 methylation level of miR-375 and total triglyceride level in
women (r=0.371, P=0.009; Fig.
2).
| Table VCharacteristics of all subjects
according to gender (n=96). |
Table V
Characteristics of all subjects
according to gender (n=96).
| A. Male (n=48) |
|---|
|
|---|
|
Characteristics | T2D (n=24) | Non-diabetic
(n=24) | P-value |
|---|
| Age (years) | 59.1±8.7 | 59.1±8.7 | |
| BMI
(kg/m2)a | 24.92±5.17 | 23.10±1.21 | 0.124 |
| Total cholesterol
(mmol/l) | 5.06±0.74 | 4.86±1.11 | 0.464 |
| Total triglycerides
(mmol/l) | 1.81±1.56 | 1.38±0.90 | 0.254 |
| Glucose
(mmol/l) | 8.59±3.49 | 4.94±0.34 | 0.000 |
| ALT (IU/l) | 30.4±23.8 | 21.1±15.9 | 0.119 |
| Uric acid
(μmol/l) | 304.7±70.6 | 346.5±82.7 | 0.066 |
| Average methylation
level (%) | 8.37±1.80 | 8.26±2.18 | 0.844 |
| Methylation level
(%) | | | |
| CpG1 | 6.04±1.90 | 5.71±1.73 | 0.528 |
| CpG2 | 6.25±2.05 | 5.46±1.72 | 0.154 |
| CpG3 | 7.83±1.88 | 7.58±2.04 | 0.661 |
| CpG4 | 14.04±3.03 | 13.92±3.72 | 0.899 |
| CpG5 | 12.33±2.91 | 11.54±3.15 | 0.371 |
| CpG6 | 10.79±3.15 | 12.50±4.97 | 0.162 |
| CpG7 | 4.25±1.45 | 4.08±1.82 | 0.727 |
| CpG8 | 5.42±1.77 | 5.25±1.65 | 0.737 |
| B. Female
(n=48) |
|---|
|
|---|
|
Characteristics | T2D (n=24) | Non-diabetic
(n=24) | P-value |
|---|
| Age (years) | 59.4±6.4 | 59.4±6.4 | |
| BMI
(kg/m2)b | 23.49±2.97 | 23.25±1.93 | 0.747 |
| Total cholesterol
(mmol/l) | 5.62±0.83 | 5.24±1.00 | 0.161 |
| Total triglycerides
(mmol/l) | 1.98±1.85 | 1.23±0.75 | 0.071 |
| Glucose
(mmol/l) | 8.04±2.22 | 5.49±1.20 | 0.000 |
| ALT (IU/l) | 19.8±8.6 | 14.8±4.8 | 0.019 |
| Uric acid
(umol/l) | 273.9±68.3 | 254.6±75.0 | 0.357 |
| Average methylation
level (%) | 9.81±2.10 | 10.81±3.48 | 0.234 |
| Methylation level
(%) | | | |
| CpG1 | 7.67±1.63 | 7.83±2.4 | 0.780 |
| CpG2 | 7.46±2.45 | 8.58±3.41 | 0.196 |
| CpG3 | 8.88±1.92 | 10.00±3.45 | 0.171 |
| CpG4 | 16.54±4.35 | 16.92±5.99 | 0.805 |
| CpG5 | 14.50±5.26 | 15.21±6.23 | 0.672 |
| CpG6 | 13.13±2.66 | 15.92±7.42 | 0.094 |
| CpG7 | 4.29±0.95 | 5.33±2.26 | 0.046 |
| CpG8 | 6.00±1.89 | 6.67±2.39 | 0.289 |
Discussion
DNA methylation and miRNA expression are important
mechanisms of epigenetic regulation in T2D (9–15). A
crucial role of miR-375 has been reported in pancreatic islet
development (8). However, little
is known concerning its methylation status in T2D. In this study,
we evaluated the contribution of miR-375 to the risk of T2D.
In the current study, a significant difference in
the DNA methylation of miR-375 between male and female subjects was
observed (Table III). The majority
of the miR-375 CpGs (with the exception of CpG7) demonstrated
higher methylation levels in women than in men. This suggests that
the methylation regulation mechanism of miR-375 may differ between
genders. Previously, estrogen exposure was considered to impact the
modulation of the epigenetic modification in the progression of
human disease (17–19). The long-term exposure to various
types of sex hormone may be one of the causes of this result. In
metabolism research, expression of miR-375 has been reported to
regulate glucose-induced insulin secretion by targeted silencing of
the Mtpn gene (7,11,20).
Although there was a slight tendency of a higher methylation level
of CpG6 in the miR-375 promoter, we identified no significant
differences in the the DNA methylation levels of the majority of
CpGs between T2D patients and healthy controls (Table IV).
miR-375 is essential for normal glucose homeostasis
and adaptive β-cell expansion in insulin resistance (10). Bioinformatic analysis revealed that
miR-375 regulates a number of functional genes that control
cellular growth and proliferation (10). In order to further identify the
epigenetic role of miR-375 in T2D, we performed a case-control
comparison of the miR-375 methylation levels in two gender
subgroups. Although our results demonstrated that CpG-7 exhibits a
relatively higher methylation level in healthy control women than
in women with T2D (P=0.046; Table
V), there were no other significant differences between healthy
controls and T2D patients in the DNA methylation levels of CpGs and
T2D across genders (Table V). This
phenomenon suggests that there may be no gender-specific role of
miR-375 methylation in the process of T2D, and DNA methylation may
not be the major mechanism of regulation during its biological
function in T2D.
miR-375 has been shown to regulate blood glucose
homeostasis and induce adipogenic differentiation, which are
associated with the pathophysiological process of T2D (21). Human blood-based aberrant
expression of miR-375 was observed in a clinical study (11). The serum miR-375 level in T2D
patients was significantly higher in quantitative real-time RT-PCR
analysis (11). However, the DNA
methylation patterns may act as a tissue-specific feature in
disease (22,23). For instance, all the CpG sites of
the insulin-2 gene (Ins2) promoter presented an unmethylated
status in pancreatic islet β-cells; however, they were methylated
in other tissues (22,23). A similar tissue-specific
methylation pattern was identified in a study of Ins2 exon 2
(22).
Analysis of candidate gene DNA methylation levels
using a case-control study provides knowledge of disease-related
mechanisms and is helpful for determining biomarkers of disease and
therapy response (24). A number
of miRNAs are dysregulated in numerous human organs and tissues
during T2D development (7,9). As a member of this family, miR-375
has diverse biological roles in this metabolic disease. However,
our results indicated that the methylated CpGs of miR-375 should
not be regarded as epigenetic targets in T2D treatment.
In summary, we identified no differential DNA
methylation levels of miR-375 between healthy controls and T2D
patients; therefore, this type of epigenetic process is not the
main regulatory mechanism of miR-375 in T2D. This study provides
new information concerning the miRNA epigenetic process which may
prove useful in the genetic-based pharmacological development of
future T2D treatments.
Abbreviations:
|
T2D
|
type 2 diabetes;
|
|
ALT
|
alanine aminotransferase
|
Acknowledgements
This study was supported by grants
from the National Natural Science Foundation of China (31100919),
Ningbo Social Development Research Projects (2012C50032) and KC
Wong Magna Fund in Ningbo University.
References
|
1.
|
Shantikumar S, Caporali A and Emanueli C:
Role of microRNAs in diabetes and its cardiovascular complications.
Cardiovasc Res. 93:583–593. 2012. View Article : Google Scholar : PubMed/NCBI
|
|
2.
|
Shaw JE, Sicree RA and Zimmet PZ: Global
estimates of the prevalence of diabetes for 2010 and 2030. Diabetes
Res Clin Pract. 87:4–14. 2010. View Article : Google Scholar : PubMed/NCBI
|
|
3.
|
Wild S, Roglic G, Green A, et al: Global
prevalence of diabetes: estimates for the year 2000 and projections
for 2030. Diabetes Care. 27:1047–1053. 2004.PubMed/NCBI
|
|
4.
|
Fernandez-Valverde SL, Taft RJ and Mattick
JS: MicroRNAs in β-cell biology, insulin resistance, diabetes and
its complications. Diabetes. 60:1825–1831. 2011.
|
|
5.
|
Lee RC, Feinbaum RL and Ambros V: The
C. elegans heterochronic gene lin-4 encodes small RNAs with
antisense complementarity to lin-14. Cell. 75:843–854. 1993.
|
|
6.
|
Wightman B, Ha I and Ruvkun G:
Posttranscriptional regulation of the heterochronic gene lin-14 by
lin-4 mediates temporal pattern formation in C. elegans.
Cell. 75:855–862. 1993. View Article : Google Scholar : PubMed/NCBI
|
|
7.
|
Dehwah MA, Xu A and Huang Q: MicroRNAs and
type 2 diabetes/obesity. J Genet Genomics. 39:11–18. 2012.
View Article : Google Scholar : PubMed/NCBI
|
|
8.
|
Avnit-Sagi T, Kantorovich L, Kredo-Russo
S, et al: The promoter of the pri-miR-375 gene directs expression
selectively to the endocrine pancreas. PLoS One. 4:e50332009.
View Article : Google Scholar : PubMed/NCBI
|
|
9.
|
Krutzfeldt J and Stoffel M: MicroRNAs: a
new class of regulatory genes affecting metabolism. Cell Metab.
4:9–12. 2006. View Article : Google Scholar : PubMed/NCBI
|
|
10.
|
Poy MN, Hausser J, Trajkovski M, et al:
miR-375 maintains normal pancreatic alpha- and beta-cell mass. Proc
Natl Acad Sci USA. 106:5813–5818. 2009. View Article : Google Scholar : PubMed/NCBI
|
|
11.
|
Kong L, Zhu J, Han W, et al: Significance
of serum microRNAs in pre-diabetes and newly diagnosed type 2
diabetes: a clinical study. Acta Diabetol. 48:61–69. 2011.
View Article : Google Scholar : PubMed/NCBI
|
|
12.
|
Barres R and Zierath JR: DNA methylation
in metabolic disorders. Am J Clin Nutr. 93:897S–900S. 2011.
View Article : Google Scholar : PubMed/NCBI
|
|
13.
|
Volkmar M, Dedeurwaerder S, Cunha DA, et
al: DNA methylation profiling identifies epigenetic dysregulation
in pancreatic islets from type 2 diabetic patients. EMBO J.
31:1405–1426. 2012. View Article : Google Scholar : PubMed/NCBI
|
|
14.
|
Toperoff G, Aran D, Kark JD, et al:
Genome-wide survey reveals predisposing diabetes type 2-related DNA
methylation variations in human peripheral blood. Hum Mol Genet.
21:371–383. 2012. View Article : Google Scholar : PubMed/NCBI
|
|
15.
|
Baroukh NN and Van Obberghen E: Function
of microRNA-375 and microRNA-124a in pancreas and brain. FEBS J.
276:6509–6521. 2009. View Article : Google Scholar : PubMed/NCBI
|
|
16.
|
World Health Organization: Definition,
Diagnosis and Classification of Diabetes mellitus and its
Complications; Part 1: Diagnosis and Classification of Diabetes
Mellitus. Department of Noncommunicable Disease Surveillance;
Geneva: 1999
|
|
17.
|
Bredfeldt TG, Greathouse KL, Safe SH, et
al: Xenoestrogen-induced regulation of EZH2 and histone methylation
via estrogen receptor signaling to PI3K/AKT. Mol Endocrinol.
24:993–1006. 2010. View Article : Google Scholar : PubMed/NCBI
|
|
18.
|
Li L, Lee KM, Han W, et al: Estrogen and
progesterone receptor status affect genome-wide DNA methylation
profile in breast cancer. Hum Mol Genet. 19:4273–4277. 2010.
View Article : Google Scholar : PubMed/NCBI
|
|
19.
|
Starlard-Davenport A, Tryndyak VP, James
SR, et al: Mechanisms of epigenetic silencing of the Rassf1a gene
during estrogen-induced breast carcinogenesis in ACI rats.
Carcinogenesis. 31:376–381. 2010. View Article : Google Scholar : PubMed/NCBI
|
|
20.
|
Poy MN, Eliasson L, Krutzfeldt J, et al: A
pancreatic islet-specific microRNA regulates insulin secretion.
Nature. 432:226–230. 2004. View Article : Google Scholar : PubMed/NCBI
|
|
21.
|
Ling HY, Wen GB, Feng SD, et al:
MicroRNA-375 promotes 3T3-L1 adipocyte differentiation through
modulation of extra-cellular signal-regulated kinase signalling.
Clin Exp Pharmacol Physiol. 38:239–246. 2011. View Article : Google Scholar : PubMed/NCBI
|
|
22.
|
Husseiny MI, Kuroda A, Kaye AN, et al:
Development of a quantitative methylation-specific polymerase chain
reaction method for monitoring beta cell death in type 1 diabetes.
PLoS One. 7:e479422012. View Article : Google Scholar : PubMed/NCBI
|
|
23.
|
Kuroda A, Rauch TA, Todorov I, et al:
Insulin gene expression is regulated by DNA methylation. PLoS One.
4:e69532009. View Article : Google Scholar : PubMed/NCBI
|
|
24.
|
Ekstrom TJ, Lavebratt C and Schalling M:
The importance of epigenomic studies in schizophrenia. Epigenomics.
4:359–362. 2012. View Article : Google Scholar : PubMed/NCBI
|