Introduction
Glaucoma is an eye disease manifested by the
apoptosis of retinal ganglion cells (RGCs) and loss of the retinal
nerve fiber layer (RNFL). These pathological changes lead to
progressive expansion of the optic cup relative to the size of the
optic disc and the characteristic pattern of visual field loss.
Non-arteritic anterior ischemic neuropathy (NAION), another optic
nerve disease, may also cause degeneration of RGCs after the acute
phase. Therefore, similarities in the morphology of the optic
nerve, such as the expansion of the optic cup and reduction of RNFL
thickness, are often observed in NAION eyes and glaucomatous eyes
(1). Previous studies identified
no difference in the size of the optic disc between NAION and
glaucomatous eyes, but the cup-to-disc (C/D) ratio of NAION eyes
was reported to be lower than that of normal or glaucomatous eyes
(2,3). In those studies, special training was
required for the examiners to determine the exact boundary of the
optic disc by using traditional methods (e.g. stereoscopic fundus
photography and Heidelberg retina tomography), which lead to human
error. Therefore, new tools that are more objective and accurate
will be useful for investigating the morphology of the optic nerve
in glaucomatous and NAION eyes.
Optical coherent tomography (OCT) is a non-invasive,
rapid and reliable technique for imaging biological tissues. It has
been widely used in the diagnosis of optic neuropathy, including
glaucoma. Fourier domain OCT (FDOCT) is a new generation of OCT
system which has higher resolution (5 μm) and faster
scanning speed (26,000 A-scan/sec) compared with the previous
generation. It has been shown that FDOCT has high repeatability for
the measurement of RNFL thickness and optic disc parameters
(4). The high sensitivity and
specificity make FDOCT a valuable tool for detecting pathological
changes of the optic nerve, including glaucoma and NAION (5). Although comparisons of the optic
nerve morphology between glaucoma and NAION have previously been
reported (6–9), to the best of our knowledge, no
studies have analyzed the characteristics of the optic disc and
RNFL with FDOCT. In the current study, we measured the parameters
of the optic disc and RNFL thickness in glaucomatous and NAION eyes
and described the clinical characteristics of these two
diseases.
Subjects and methods
Clinical data
Adult patients (age ≥40) diagnosed in The First
Affiliated Hospital of Xinxiang Medical University (Weihui, China)
between October 2011 and September 2012, were considered for
inclusion. One eye was randomly chosen for analysis. Subjects were
divided into three groups: the glaucoma, NAION and normal control
groups. Subjects that presented with the following conditions were
excluded from analysis: a visual field defect larger than one
hemifield, spherical equivalent (SE) more than ±6 D, or the onset
of NAION within 6 months.
The glaucoma group included eyes with: i)
characteristic changes in rim morphology and RNFL thickness; ii)
characteristic visual field defects (e.g. nasal steps, Bjerrum
scotoma, and paracentral scotoma); iii) increased or normal
intraocular pressure; and iv) at least three visible quadrants
revealed by gonioscopy. NAION was diagnosed based on sudden loss of
visual acuity, disc edema on fundus ophthalmoscopy during the acute
stage, visual field defects consistent with NAION, erythrocyte
sedimentation rate and reactive protein C levels within normal
values with no signs of giant cell arteritis, at least 6 months
after the acute phase. Healthy eyes without glaucoma, fundus
disease or history of laser therapy or eye surgery were used as
controls. These eyes had an intra-ocular pressure ≤21 mmHg and
normal optic disc morphology and visual field. This study was
conducted in accordance with the Declaration of Helsinki and with
approval from the Ethics Committee of the First Affiliated Hospital
of Xinxiang Medical University (Weihui, China). Written informed
consent was obtained from all participants.
Methods
Tests for glaucoma were performed on all subjects.
These tests included visual acuity examination, optometry,
tonometry, slit lamp, gonioscopy, non-mydriatic fundus photography
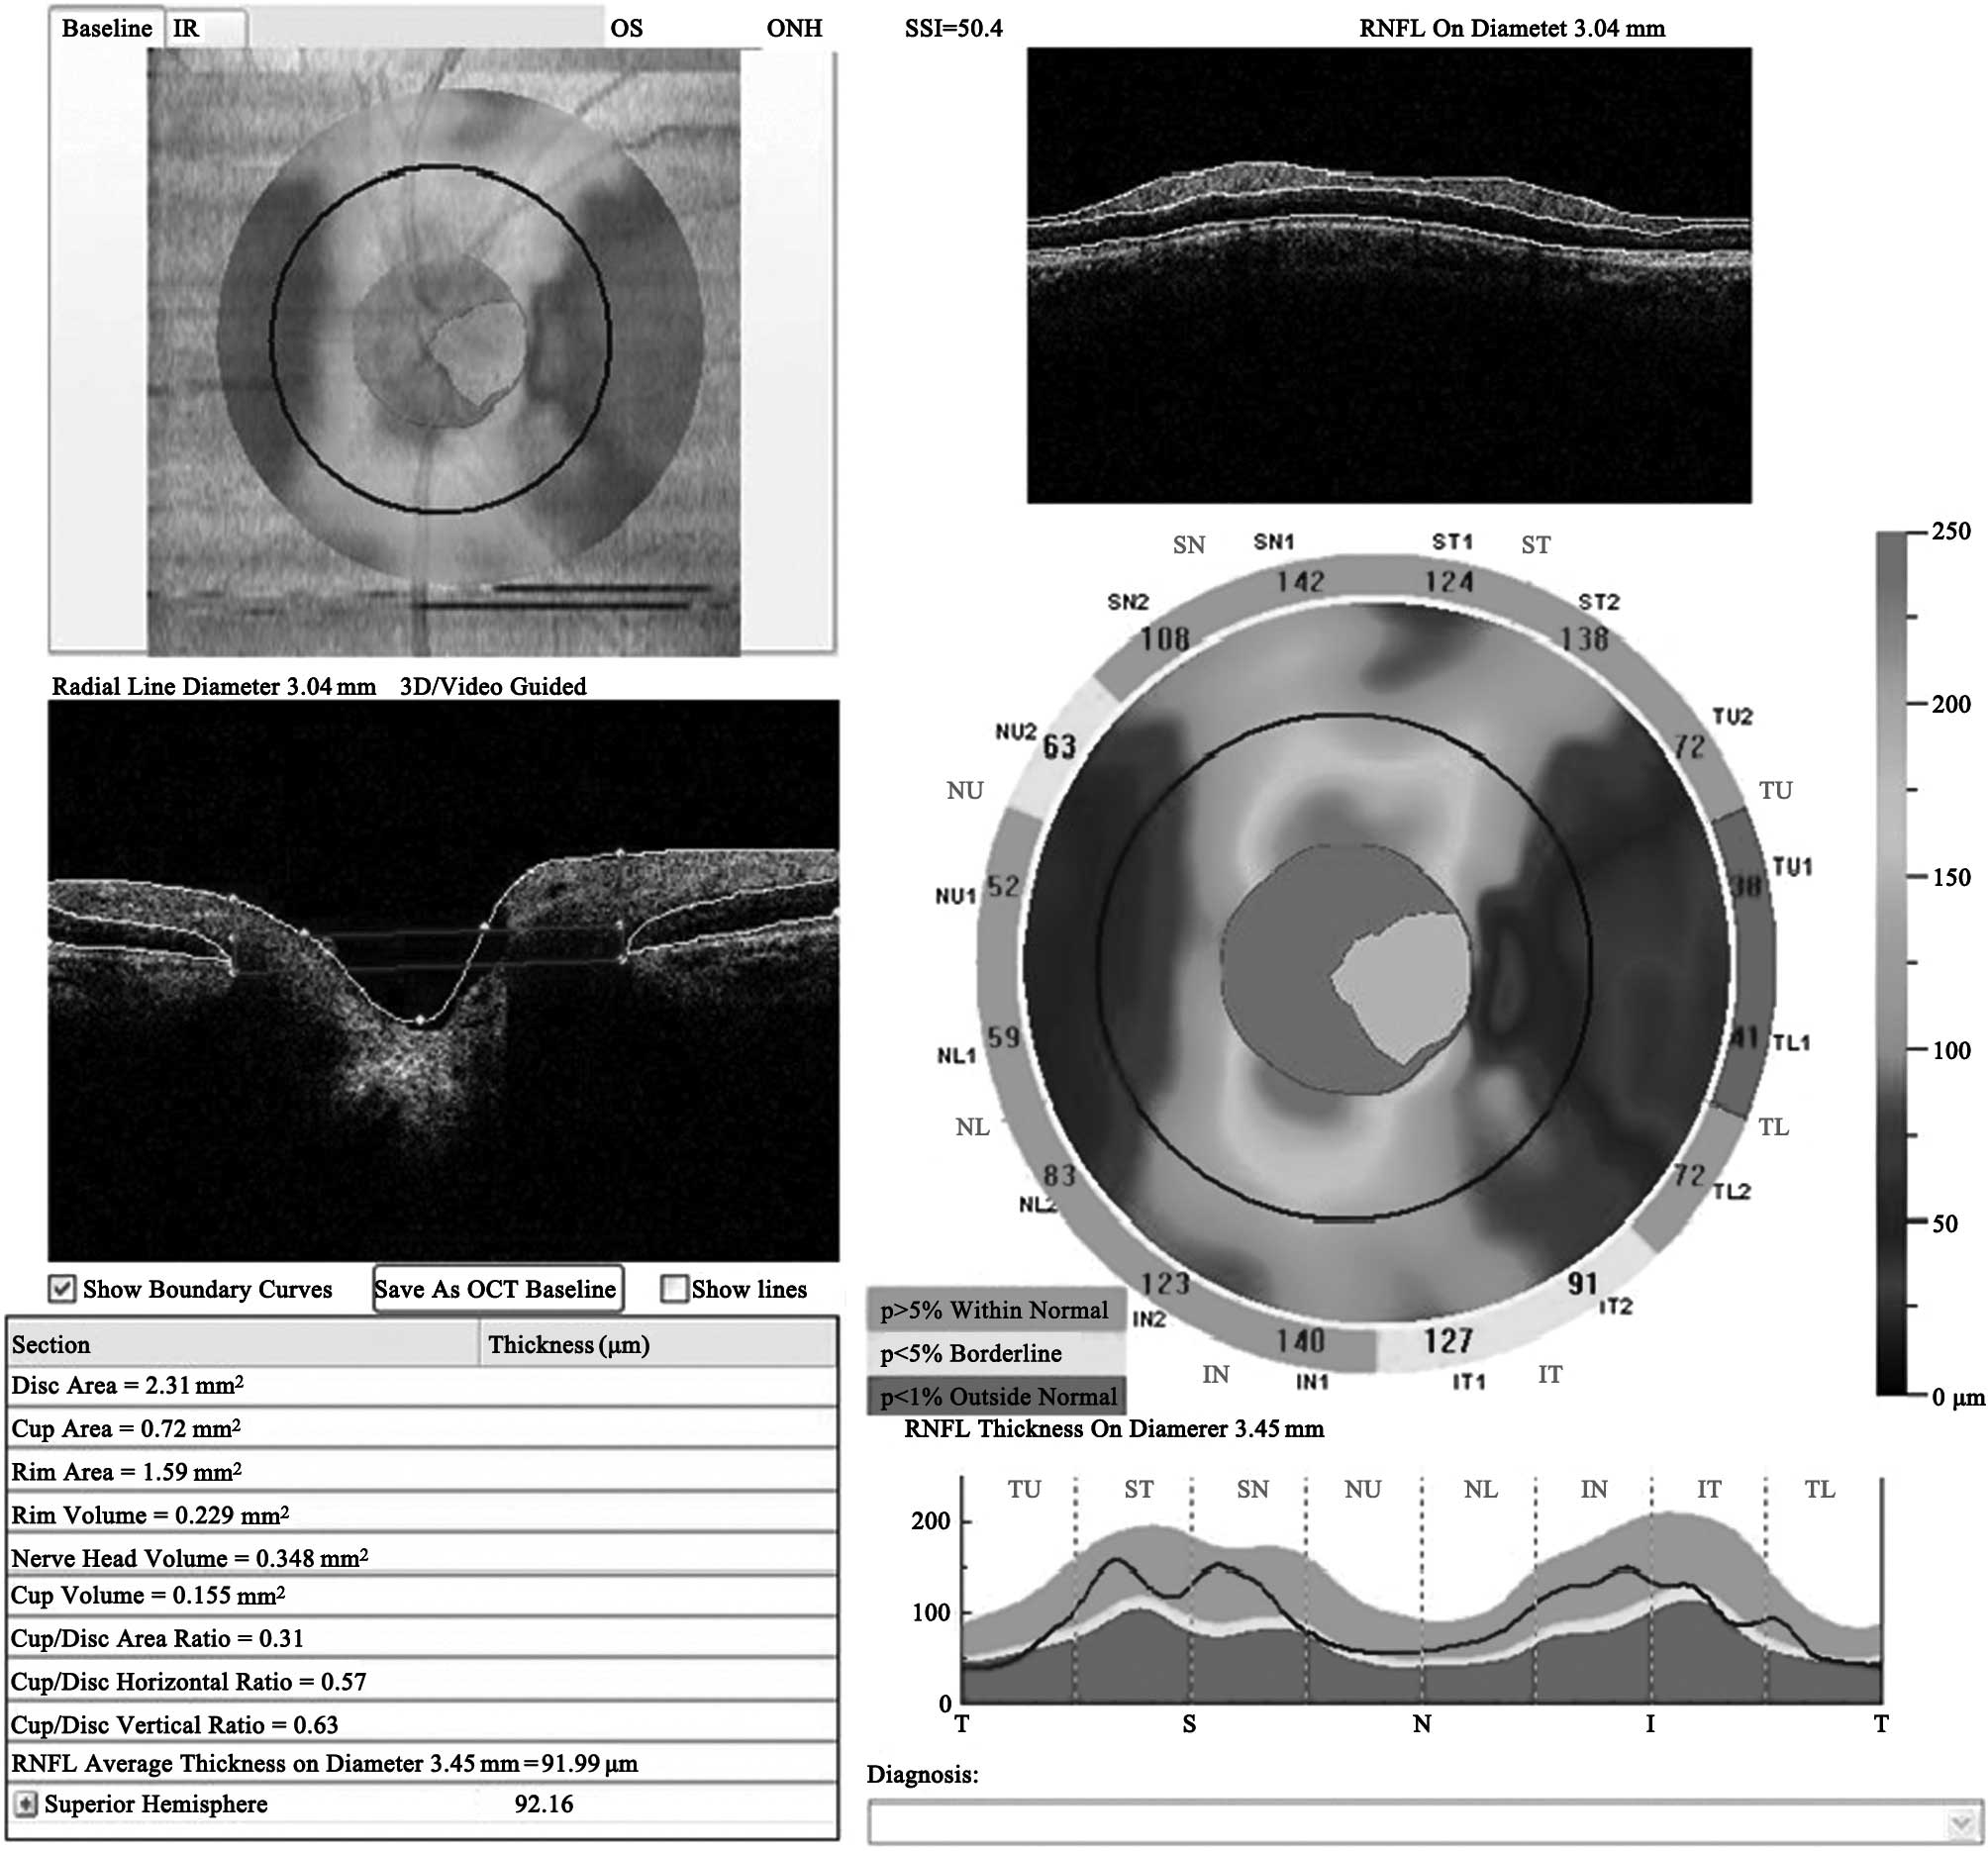
and Humphrey perimeter test. The parameters of optic nerve
morphology, including optic disc and RNFL (diameter 3.45 mm)
thickness, were obtained with RTVue FDOCT (4.0 version; Optovue
Inc., Fremont, CA, USA) set in a program for measuring the optic
nerve head (ONH). The parameters, including disc area, cup area,
rim area, disc volume, cup volume, rim volume, C/D area ratio, C/D
horizontal ratio, C/D vertical ratio and mean and localized RNFL
thickness, were recorded (Fig.
1).
Statistical analysis
Data analysis was performed using SPSS 16.0 (SPSS,
Inc., Chicago, IL, USA). The χ2 test was used to compare
the male to female gender ratio. One-way analysis of variance
(ANOVA) and least significant difference (LSD) were used to compare
age, SE or OCT parameters between two groups. The area under the
receiver operating characteristic curve (AROC) was used to assess
the diagnostic capacity of each parameter. The AROCs were
calculated and analyzed using MedCalc 9.6.2.0 (MedCalc Software,
Mariakerke, Belgium). P<0.05 was considered to indicate a
statistically significant result.
Results
Characteristics of the subjects
Seventy-one subjects (38 men and 33 women) were
evaluated. The mean age was 53.3±14.4 years. There were 26 cases of
glaucoma (36.6%), 15 cases of NAION (21.1%) and 30 control cases
(42.3%). There was no difference in gender ratio, age and SE among
the groups (P>0.05). There were significant differences in the
mean deviation (MD) and pattern standard deviation (PSD) of the
Humphrey visual field analyzer among the three groups (P<0.01).
The demographic data and optical characteristics of the patients
and controls are listed in Table
I.
 | Table I.Demographics and optic characteristics
of glaucoma, NAION and normal subjects. |
Table I.
Demographics and optic characteristics
of glaucoma, NAION and normal subjects.
| Variable | Glaucoma | NAION | Control | F-statistic | P-value |
|---|
| Age, mean ± SD
(years) | 50.7±19.3 | 57.5±9.10 | 51.4±16.1 | 0.620 | 0.541 |
| Gender (n, %
male) | 14, 53.8% | 7, 46.7% | 17, 56.7% | 0.404 | 0.817 |
| SE (D) | 2.05±0.71 | 1.94±0.81 | 2.40±1.25 | 0.461 | 0.645 |
| MD (dB) | 10.2±7.8 | 9.6±7.1 | 1.2±1.3 | 20.786 | 0.000 |
| PSD (dB) | 9.7±4.2 | 7.9±4.2 | 2.8±0.9 | 34.351 | 0.000 |
Comparison of optic nerve morphology
parameters
The parameters of the optic disc and RNFL thickness
measured in glaucomatous, NAION and normal control eyes are
summarized in Table II. Using LSD
analysis of the three groups, we observed that glaucomatous eyes
had the largest cup area (1.438±0.714 mm2; P<0.05)
and the smallest rim area (0.965±0.652 mm2; P<0.05).
NAION eyes had the smallest cup area (0.493±0.344 mm2;
P<0.05) and a rim area (1.255±0.294 mm2) that was
larger than that of glaucomatous eyes, but comparable to that of
control eyes (1.243±0.509 mm2; P>0.05). There was no
significant difference in disc area between control eyes
(2.194±0.618 mm2) and glaucomatous eyes (2.203±0.557
mm2; P>0.05) or NAION eyes (1.945±0.458
mm2; P>0.05). Glaucomatous eyes had the smallest ONH
volume (0.195±0.168 mm3; P<0.05) and rim volume
(0.103±0.089 mm3; P<0.05), and the largest cup volume
(0.482±0.420 mm3; P<0.05). The NAION eyes had the
smallest cup volume (0.083±0.073 mm3; P<0.05), but
there was no significant difference in ONH volume (0.339±0.109
mm3) and rim volume (0.196±0.094 mm3) between
NAION eyes and control eyes (P>0.05). The C/D ratio was the
highest in glaucomatous eyes (C/D area ratio 0.591±0.256, C/D
horizontal ratio 0.799±0.190 and C/D vertical ratio 0.764±0.196)
and the lowest in NAION eyes (C/D area ratio 0.258±0.182, C/D
horizontal ratio 0.445±0.302 and C/D vertical ratio
0.480±0.321).
| Table II.Comparison of Fourier domain optical
coherence tomography (FDOCT) parameters in glaucomatous, NAION and
normal eyes. |
Table II.
Comparison of Fourier domain optical
coherence tomography (FDOCT) parameters in glaucomatous, NAION and
normal eyes.
| Variable | NAION | Glaucoma | Control | F-statistic | P-value |
|---|
| ONH | | | | | |
| Disc-area
(mm2) | 1.945±0.458 | 2.203±0.557 | 2.194±0.618 | 3.068 | 0.059 |
| Cup-area
(mm2) | 0.493±0.344 | 1.438±0.714 | 0.952±0.605 | 9.967 | 0.000 |
| Rim-area
(mm2) | 1.255±0.294 | 0.965±0.652 | 1.243±0.509 | 3.312 | 0.041 |
| Rim-volume
(mm3) | 0.196±0.094 | 0.103±0.089 | 0.175±0.119 | 7.714 | 0.001 |
| Nerve head-volume
(mm3) | 0.339±0.109 | 0.195±0.168 | 0.318±0.219 | 0.345 | 0.002 |
| Cup-volume
(mm3) | 0.083±0.073 | 0.482±0.420 | 0.287±0.257 | 5.793 | 0.004 |
| C/D area | 0.258±0.182 | 0.591±0.256 | 0.416±0.239 | 9.225 | 0.000 |
| C/D horizontal | 0.445±0.302 | 0.799±0.190 | 0.689±0.298 | 5.844 | 0.004 |
| C/D vertical | 0.480±0.321 | 0.764±0.196 | 0.605±0.256 | 8.672 | 0.000 |
| RNFL (μm) | | | | | |
| Mean | 55.75±26.16 | 88.79±17.37 | 113.80±10.25 | 54.990 | 0.000 |
| TU | 108.62±32.84 | 64.89±19.22 | 91.58±14.42 | 37.756 | 0.000 |
| ST | 113.38±32.57 | 105.85±23.96 | 144.53±16.12 | 46.954 | 0.000 |
| SN | 79.38±17.86 | 100.66±19.62 | 129.34±16.75 | 40.774 | 0.000 |
| NU | 48.50±11.40 | 68.16±16.15 | 77.52±13.11 | 10.581 | 0.000 |
| NL | 81.00±21.55 | 69.50±14.13 | 80.18±14.81 | 7.926 | 0.001 |
| IN | 131.50±18.43 | 119.57±32.48 | 143.67±21.98 | 10.331 | 0.000 |
| IT | 113.62±25.42 | 118.53±32.57 | 159.95±22.45 | 30.992 | 0.000 |
| TL | 72.55±17.87 | 63.67±14.40 | 83.33±12.09 | 29.633 | 0.000 |
The parameters of RNFL thickness in all regions of
NAION eyes [except in the nasal lower (NL), inferior nasal (IN) and
temporal lower (TL) regions] and glaucomatous eyes were lower than
those in control eyes (P<0.05). The greatest loss of RNFL
thickness was in the temporal upper (TU), superior temporal (ST)
and TL regions of glaucomatous eyes and the superior nasal (SN) and
nasal upper (NU) regions of NAION eyes.
Diagnostic capabilities analysis of optic
nerve morphology parameters in glaucoma and NAION
By analyzing the AROCs of glaucomatous eyes and
control eyes, we observed that all parameters of the optic disc
(with the exception of disc area) and RNFL thickness were
significantly different between the two groups (P<0.05; Table III). Further analysis revealed that
there was no difference in the AROC between the two parameters of
the optic disc (P>0.05). However, the AROCs of RNFL thickness
were higher than that of the optic disc (P<0.05). In detail, the
AROCs of the superior (ST and SN), temporal (TU, TL and IT) and
mean RNFL were significantly higher than those of nasal (NU and NL)
RNFL (P<0.05).
| Table III.AROCs for ONH and RNFL thickness in
glaucomatous eyes compared with control eyes. |
Table III.
AROCs for ONH and RNFL thickness in
glaucomatous eyes compared with control eyes.
| Variable | AROC | SE | 95% CI | P-value |
|---|
| ONH | | | | |
| Disc-area | 0.604 | 0.054 | 0.498–0.710 | 0.056 |
| Cup-area | 0.693 | 0.048 | 0.598–0.788 | 0.000 |
| Rim-area | 0.664 | 0.051 | 0.565–0.763 | 0.003 |
| Rim-volume | 0.700 | 0.049 | 0.605–0.795 | 0.000 |
| Nerve
head-volume | 0.691 | 0.049 | 0.595–0.787 | 0.000 |
| Cup-volume | 0.634 | 0.051 | 0.533–0.735 | 0.014 |
| C/D area | 0.698 | 0.048 | 0.604–0.792 | 0.000 |
| C/D
horizontal | 0.628 | 0.053 | 0.524–0.732 | 0.019 |
| C/D vertical | 0.706 | 0.048 | 0.612–0.800 | 0.000 |
| pRNFL | | | | |
| Mean | 0.891 | 0.029 | 0.834–0.949 | 0.000 |
| TU | 0.876 | 0.033 | 0.810–0.941 | 0.000 |
| ST | 0.904 | 0.029 | 0.847–0.961 | 0.000 |
| SN | 0.868 | 0.034 | 0.802–0.933 | 0.000 |
| NU | 0.660 | 0.050 | 0.561–0.758 | 0.003 |
| NL | 0.692 | 0.049 | 0.596–0.788 | 0.000 |
| IN | 0.728 | 0.046 | 0.637–0.819 | 0.000 |
| IT | 0.837 | 0.036 | 0.766–0.908 | 0.000 |
| TL | 0.867 | 0.034 | 0.801–0.933 | 0.000 |
By comparing the AROCs of NAION and control eyes, as
shown in Table IV, we observed
that there were no differences in any of the parameters of the
optic disc. There was a significant difference only in the AROCs of
the superior (ST and SN), nasal (NU) and inferior temporal (IT)
RNFL (P<0.05).
| Table IV.AROCs for ONH and RNFL thickness in
NAION eyes compared with control eyes. |
Table IV.
AROCs for ONH and RNFL thickness in
NAION eyes compared with control eyes.
| Variable | AROC | SE | 95% CI | P-value |
|---|
| ONH | | | | |
| Disc-area | 0.750 | 0.107 | 0.539–0.961 | 0.099 |
| Cup-area | 0.750 | 0.081 | 0.591–0.909 | 0.099 |
| Rim-area | 0.508 | 0.105 | 0.302–0.713 | 0.960 |
| Rim-volume | 0.605 | 0.144 | 0.323–0.887 | 0.488 |
| Nerve
head-volume | 0.585 | 0.105 | 0.379–0.791 | 0.574 |
| Cup-volume | 0.737 | 0.086 | 0.570–0.905 | 0.117 |
| C/D area | 0.700 | 0.098 | 0.508–0.892 | 0.186 |
| C/D
horizontal | 0.770 | 0.078 | 0.618–0.922 | 0.074 |
| C/D vertical | 0.667 | 0.103 | 0.466–0.869 | 0.269 |
| pRNFL | | | | |
| Mean | 0.900 | 0.057 | 0.789–1.011 | 0.900 |
| TU | 0.295 | 0.207 | −0.110–0.700 | 0.176 |
| ST | 0.822 | 0.094 | 0.639–1.006 | 0.033 |
| SN | 0.990 | 0.012 | 0.966–1.014 | 0.001 |
| NU | 0.990 | 0.012 | 0.967–1.013 | 0.001 |
| NL | 0.495 | 0.193 | 0.118–0.872 | 0.974 |
| IN | 0.655 | 0.108 | 0.443–0.867 | 0.306 |
| IT | 0.932 | 0.057 | 0.820–1.045 | 0.004 |
| TL | 0.680 | 0.151 | 0.383–0.977 | 0.234 |
We then compared the AROCs of the parameters in
NAION and glaucomatous eyes. As shown in Table V, there were significant
differences in the AROCs of the cup area, cup volume and C/D ratio
(P<0.05). For the parameters of RNFL thickness, there were
significant differences in the AROCs of the temporal (TU), nasal
(NU) and mean RNFL thickness (P<0.05).
| Table V.AROCs for ONH and RNFL thickness in
NAION eyes compared with glaucomatous eyes. |
Table V.
AROCs for ONH and RNFL thickness in
NAION eyes compared with glaucomatous eyes.
| Variable | AROC | SE | 95% CI | P-value |
|---|
| ONH | | | | |
| Disc-area | 0.778 | 0.087 | 0.618–0.979 | 0.064 |
| Cup-area | 0.881 | 0.051 | 0.781–0.980 | 0.011 |
| Rim-area | 0.685 | 0.073 | 0.542–0.827 | 0.218 |
| Rim-volume | 0.792 | 0.092 | 0.613–0.972 | 0.051 |
| Nerve
head-volume | 0.762 | 0.077 | 0.610–0.913 | 0.081 |
| Cup-volume | 0.833 | 0.067 | 0.702–0.963 | 0.026 |
| C/D area | 0.850 | 0.061 | 0.730–0.970 | 0.019 |
| C/D
horizontal | 0.887 | 0.049 | 0.790–0.984 | 0.010 |
| C/D vertical | 0.827 | 0.064 | 0.701–0.953 | 0.029 |
| pRNFL | | | | |
| Mean | 0.823 | 0.099 | 0.629–1.018 | 0.031 |
| TU | 0.867 | 0.109 | 0.665–1.080 | 0.014 |
| ST | 0.606 | 0.188 | 0.238–0.974 | 0.480 |
| SN | 0.775 | 0.090 | 0.599–0.951 | 0.066 |
| NU | 0.844 | 0.060 | 0.727–0.962 | 0.022 |
| NL | 0.675 | 0.168 | 0.346–1.004 | 0.243 |
| IN | 0.619 | 0.088 | 0.447–0.791 | 0.426 |
| IT | 0.558 | 0.124 | 0.316–0.800 | 0.700 |
| TL | 0.642 | 0.165 | 0.319–0.965 | 0.342 |
Discussion
The typical characteristics of NAION include sudden
vision loss, visual field defect and optic edema. Following the
acute phase, optic disc pallor arises. Certain patients have no
apparent vision loss and the visual field defects are seldom
detected when patients receive professional diagnosis. The
characteristics of NAION in the atrophic phase are similar to those
of glaucomatous damage (1).
Therefore, NAION patients are sometimes suspected of having
glaucoma. In recent years, OCT has been used to detect the
pathological changes of NAION. With the use of Stratus OCT,
Contreras et al observed that the RNFL thickness
(particularly the superior RNFL thickness) in NAION eyes was the
highest in the acute phase, became thinner thereafter and reached
its lowest level 6 months after the acute phase (10). There was a gradual reduction of the
vertical rim area from the acute phase to the sixth month
thereafter, whereas the C/D area ratio increased from the start of
the acute phase. There was no change in the size of optic disc
(11).
Due to the similarities between optic nerve
morphology in NAION and glaucomatous eyes, comparison studies have
been performed. Using HRT and Stratus OCT, Danesh-Meyer et
al observed that with the same visual field defect, open-angle
glaucomatous eyes had a larger cup area and volume, smaller rim
area and rim volume, and higher RNFL thickness compared with NAION
eyes (7). Horowitz et al
used Stratus OCT to study NAION and glaucoma patients with a visual
field defect less than a hemifield. The authors observed that there
was no difference in RNFL thickness at corresponding areas of
damage. However, the RNFL thickness in the non-damaged areas of
glaucomatous eyes was less than that of NAION eyes and both were
higher than that of control eyes (8). The results of the two studies were
not consistent, likely due to the difference in the time at which
the NAION patients were analyzed. The patients in the former study
were examined at least 6 weeks after the acute phase, whereas the
patients in the latter study were examined at >6 months after
the acute phase. Contreras et al suggested that the RNFL in
NAION patients was the thinnest at 6 months after the acute phase
(10). In the present study,
patients were examined at least 6 months after the acute phase. We
observed that the RNFL thickness in NAION eyes was less than that
of glaucomatous eyes. In addition, the acute ischemia of the optic
nerve in NAION results in reduction of the function and death of
retinal ganglia cells (RGCs) (12). The RNFL thickness in glaucomatous
eyes was higher than expected, possibly since glaucoma does not
kill RGCs, but reduces the function of their axons.
By comparing the parameters of NAION eyes and
glaucomatous eyes to control eyes, we observed that the
glaucomatous eyes had the largest cup area and C/D ratio and the
smallest rim area. There was no difference in disc area among the
three groups of eyes. The cup area and C/D ratio in NAION eyes were
the smallest, but the rim area and disc area of the NAION eyes were
similar to those of the control. These conclusions were consistent
with the findings of previous studies (6,7). We
also observed that the mean RNFL thickness, the thickness of the
majority of RNFL regions in NAION eyes and all regions of RNFL in
glaucomatous eyes were lower than those of the control. Among the
three groups, the greatest loss of RNFL thickness was in the TU, ST
and TL regions in glaucomatous eyes (P<0.05), and in the SN and
NU regions of NAION eyes (P<0.05). Our data, together with
previous studies (10,13,14),
demonstrate that the temporal RNFL in glaucomatous eyes and the
superior RNFL in NAION eyes are the most vulnerable to damage.
We observed that all the parameters were useful for
the diagnosis of glaucoma, with the exception of disc area, and the
parameters of RNFL were the most valuable. Previous studies suggest
that the AROCs of mean, superior and inferior RNFL thickness in
glaucomatous eyes were larger than those of control eyes (13). After investigating 88 cases of
glaucoma, Lisboa et al (14) observed that among the parameters
obtained from SD-OCT measurement, the diagnostic capacity (from
excellent to poor) was ST, mean and IT RNFL thickness. Among the
parameters of optic disc morphology obtained using HRT-III, the
diagnostic capacity (from excellent to poor) was rim area, rim
volume and linear C/D ratio. The diagnostic capacity of superior
temporal RNFL thickness measured by OCT was more accurate than that
of the rim area measured by HRT (0.88 vs. 0.72; P=0.008). Our
results also suggest that RNFL thickness has a more accurate
diagnostic capacity.
In the current study, we observed that the regions
that were useful in the diagnosis of NAION were ST, SN, NU and IT.
The parameters that were useful for distinguishing NAION and
glaucoma were cup area, cup volume, C/D ratio (area, horizontal and
vertical) and RNFL thickness (TU, NU and mean). Previous studies
suggest that NAION eyes have a small optic disc, optic cup and C/D
ratio (2,3,6). The
changes in superior RNFL were more evident in NAION eyes. Thus,
these changes are valuable in diagnosis.
In addition, in the current study, we used a new
generation of FDOCT, which has faster scanning speed and improved
sensitivity. The parameters collected using this new tool were more
accurate than those from the previous generation. However, we only
collected data from patients 6 months after the NAION acute phase.
Information concerning dynamic changes in the acute phase is
lacking. Further studies to examine the characteristic changes of
NAION diseases are required.
In conclusion, by using FDOCT, we observed that
compared with the control, the glaucomatous eyes had a larger cup
area, smaller rim area and larger C/D ratio. NAION eyes had a
smaller cup area and C/D ratio. The RNFL thickness in glaucomatous
eyes was the most reduced in the ST and IT regions, and in NAION
eyes in the SN region. Thus, the characteristics of cup area, cup
volume, C/D ratio and RNFL thickness may distinguish between these
two similar diseases.
Acknowledgements
This study was supported by the grants
from the Department of Science and Technology of Henan Province
(No. 112102310212) and the Provincial Key Opening Project of
Xinxiang Medical University (No. ZD200985).
References
|
1.
|
Pasol J: Neuro-ophthalmic disease and
optical coherence tomography: glaucoma look-alikes. Curr Opin
Ophthalmol. 22:124–132. 2011. View Article : Google Scholar : PubMed/NCBI
|
|
2.
|
González-García AO, Vizzeri G, Bowd C,
Medeiros FA, Zangwill LM and Weinreb RN: Reproducibility of RTVue
retinal nerve fiber layer thickness and optic disc measurements and
agreement with Stratus optical coherence tomography measurements.
Am J Ophthalmol. 147:1067–1074. 2009.PubMed/NCBI
|
|
3.
|
Garas A, Kóthy P and Holló G: Accuracy of
the RTVue-100 Fourier-domain optical coherence tomograph in an
optic neuropathy screening trial. Int Ophthalmol. 31:175–182. 2011.
View Article : Google Scholar : PubMed/NCBI
|
|
4.
|
Saito H, Tomidokoro A, Sugimoto E, et al:
Optic disc topography and peripapillary retinal nerve fiber layer
thickness in nonarteritic ischemic optic neuropathy and open-angle
glaucoma. Ophthalmology. 113:1340–1344. 2006. View Article : Google Scholar : PubMed/NCBI
|
|
5.
|
Danesh-Meyer H, Savino PJ, Spaeth GL and
Gamble GD: Comparison of arteritis and nonarteritic anterior
ischemic optic neuropathies with the Heidelberg Retina Tomograph.
Ophthalmology. 112:1104–1112. 2005. View Article : Google Scholar
|
|
6.
|
Chan CK, Cheng AC, Leung CK, Cheung CY,
Yung AY, Gong B and Lam DS: Quantitative assessment of optic nerve
head morphology and retinal nerve fibre layer in non-arteritic
anterior ischaemic optic neuropathy with optical coherence
tomography and confocal scanning laser ophthalmoloscopy. Br J
Ophthalmol. 93:731–735. 2009. View Article : Google Scholar
|
|
7.
|
Danesh-Meyer HV, Boland MV, Savino PJ,
Miller NR, Subramanian PS, Girkin CA and Quigley HA: Optic disc
morphology in open-angle glaucoma compared with anterior ischemic
optic neuropathies. Invest Ophthalmol Vis Sci. 51:2003–2010. 2010.
View Article : Google Scholar
|
|
8.
|
Horowitz J, Fishelzon-Arev T, Rath EZ,
Segev E and Geyer O: Comparison of optic nerve head topography
findings in eyes with non-arteritic anterior ischemic optic
neuropathy and eyes with glaucoma. Graefes Arch Clin Exp
Ophthalmol. 248:845–851. 2010. View Article : Google Scholar : PubMed/NCBI
|
|
9.
|
Suh MH, Kim SH, Park KH, Kim SJ, Kim TW,
Hwang SS and Kim DM: Comparison of the correlations between optic
disc rim area and retinal nerve fiber layer thickness in glaucoma
and nonarteritic anterior ischemic optic neuropathy. Am J
Ophthalmol. 151:277–286. 2011. View Article : Google Scholar : PubMed/NCBI
|
|
10.
|
Contreras I, Noval S, Rebolleda G and
Muñoz-Negrete FJ: Follow-up of nonarteritic anterior ischemic optic
neuropathy with optical coherence tomography. Ophthalmology.
114:2338–2344. 2007. View Article : Google Scholar : PubMed/NCBI
|
|
11.
|
Contreras I, Rebolleda G, Noval S and
Muñoz-Negrete FJ: Optic disc evaluation by optical coherence
tomography in nonarteritic anterior ischemic optic neuropathy.
Invest Ophthalmol Vis Sci. 48:4087–4092. 2007. View Article : Google Scholar : PubMed/NCBI
|
|
12.
|
Hood DC, Anderson S, Rouleau J, et al:
Retinal nerve fiber structure versus visual field function in
patients with ischemic optic neuropathy. A test of a linear model.
Ophthalmology. 115:904–910. 2008. View Article : Google Scholar : PubMed/NCBI
|
|
13.
|
Leung CK, Cheung CY, Weinreb RN, et al:
Retinal nerve fiber layer imaging with spectral-domain optical
coherence tomography: a variability and diagnostic performance
study. Ophthalmology. 116:1257–1263. 2009. View Article : Google Scholar : PubMed/NCBI
|
|
14.
|
Lisboa R, Leite MT, Zangwill LM, Tafreshi
A, Weinreb RN and Medeiros FA: Diagnosing preperimetric glaucoma
with spectral domain optical coherence tomography. Ophthalmology.
119:2261–2269. 2012. View Article : Google Scholar : PubMed/NCBI
|