Introduction
Splenic siderotic nodules, also known as Gamna-Gandy
bodies (GGBs), are small granuloma-like nodules that most
frequently occur within the spleen. GGBs were first observed in a
patient with biliary cirrhosis and were described by the French
physician, Charles Gandy (1872–1943), in 1905. The nature of the
GGBs was further investigated in 1921 by the Italian pathologist,
Carlo Gamna (1866–1950). GGBs have been revealed to measure a few
millimeters in size and be composed of hemosiderin, calcium and
fibrous tissue, with a crystal structure of CaPO4.FeOH.
The iron inclusions favor the deposition of calcium salts (1,2).
There have been relatively few studies concerning
the imaging of siderotic nodules in the spleen, although due to the
hemosiderin inclusion within the nodules, it has been suggested
that gradient-echo (GRE) magnetic resonance imaging (MRI) sequence
may be more sensitive to this type of nodule than alternative
imaging modalities (3–7). In the past decade, a novel MRI
sequence, enhanced-susceptibility weighted angiography (ESWAN), has
been widely used in clinical practice (8,9). Due
to its sensitivity to the susceptibility differences between
substances, such as deoxyhemoglobin, iron and calcium, this new
sequence is able to enhance the susceptibility contrast between
tissues and highlight lesions, such as hemorrhages and hemosiderin.
The sequence has been predominantly utilized for brain imaging,
although other applications have also been described (10–15).
In 2011, a new 3.0 T MRI scanner was installed in the Department of
Radiology, Renmin Hospital of Wuhan University (Wuhan, China) and
the ESWAN sequence was utilized for the detection and assessment of
liver siderotic nodules and iron deposition in patients with liver
cirrhosis, in addition to being used for brain imaging. Following
the observation of abnormal signals (siderotic nodules) in the
spleen, a number of patients were retrospectively reviewed, the MRI
appearances, liver function and blood cell counts were studied and
the correlation between splenic siderotic nodules and hypersplenism
was discussed. Furthermore, the interrelation between liver
function, thrombocytopenia and splenomegaly and the formation of
splenic siderotic nodules in patients with liver cirrhosis was
evaluated. To the best of our knowledge, there have been no
previous investigations into the interrelations between splenic
siderotic nodules and the clinical data from patients with liver
cirrhosis or into the application of the ESWAN sequence for splenic
imaging.
Materials and methods
Patients
Thirty-three patients with liver cirrhosis, who were
inpatients of the Department of Infectious Diseases (Renmin
Hospital of Wuhan University), were retrospectively studied from
May, 2011 to February, 2012. Patients with additional hematological
diseases and hemochromatosis were excluded from the study. Fifteen
healthy individuals, including four females and 11 males, with ages
ranging from 35 to 68 years (mean age, 55 years) were then
recruited as controls between January and February, 2012. The study
was reviewed and approved by the Medical Ethics Committee of the
Renmin Hospital of Wuhan University and informed consent was
obtained from all participants. Patient data, including demographic
details, hemoglobin levels, and white cell, red cell and platelet
counts were evaluated. Liver function was assessed using the
Child-Pugh scoring system. Hypersplenism was defined as
splenomegaly with a platelet count of <150,000 /mm3
and/or a white cell count of <3,500 /mm3.
Splenomegaly was defined as the craniocaudal length of the spleen
measuring >12.0 cm (the accepted value for adults in the
department). The splenic volume of patients was measured using the
MRI post-processing workstation tool.
MRI technique
MRI was performed using a Signa HDxt 3T scanner (GE
Healthcare, Wasukesha, WI, USA) with an HD cardiac coil (GE
Healthcare). The ESWAN sequence for the abdomen was an axial
two-dimensional (2D) multi-echo gradient-echo sequence with
six-echoes. The imaging parameters were as follows: Field of view,
35 cm; matrix, 320×288 pixels; repetition time (TR), 50 msec; echo
times (TEs), 2.9, 8.0, 13.0, 18.0, 23.1 and 28.1 msec,
respectively; flip angle, 20°; thickness, 5.0 mm and thickness gap,
20 mm. Six image slices of the spleen were obtained, with an
acquisition time of 45 sec. The acquisition time was split into
three consecutive blocks, with each block including a
breath-holding period of 15 sec, followed by the acquisition of the
data at the end-expiration. During each block, two image slices of
the spleen were obtained, with each slice including 12 individual
images (six raw magnitude and six corresponding phase images,
respectively). The corrected phase and merged magnitude images were
obtained using the post-processing station (GE Advantage
Workstation 4.4, GE Healthcare).
Conventional sequences included the axial
fat-suppressed fast spin-echo T2-weighted image (FS-FSE T2WI), with
a TE of 90 msec and a TR of 6,316 msec; the coronal single-shot
fast spin-echo T2-weighted image (SSFSE-T2WI), with a TE of 66.8
msec and a TR of 1,946 msec and the axial spoiled gradient-echo
T1-weighted image (SPGR-T1WI), with a TE of 2.4 msec and a TR of
235 msec. The matrix was 320×224 pixels, while the thickness was
6.0 mm and the thickness gap was 2.0 mm.
Imaging analysis
The images of the spleen obtained using the ESWAN
sequence and conventional MRI were reviewed in consensus by two
radiologists who were experienced in abdominal MRI imaging and who
were blinded to the patient history. The cases that were considered
to have ambiguous abnormal signals by the two reviewers were
categorized into the normal group. If the reviewers expressed
differing opinions, a third reviewer was consulted.
On the images obtained using ESWAN, signals that
were lower than those for normal spleen parenchyma and similar to
the spine in the same imaging slice were defined as dark signals.
The reviewers were asked to grade the abnormal signals in the
spleen into one of three categories (16): Grade A, normal, i.e. no dark signal
present; grade B, scattered dark signals, with <10 in one slice;
grade C, numerous dark signals, with >10 in one slice.
Statistical analysis
Data analyses were performed using SPSS software,
version 17.0 (SPSS, Inc., Chicago, IL, USA). P<0.05 was
considered to indicate a statistically significant difference. The
patients were classified into hypersplenism and non-hypersplenism
subgroups. The distribution of the splenic ESWAN image grades
across the two subgroups was evaluated using a Mann-Whitney U Test,
while the prevalence of the grade C images was evaluated using a
Fisher’s exact test. The application of the grade C images for the
diagnosis of hypersplenism was assessed, and the sensitivity and
specificity were calculated, respectively.
A comparison between the splenic volumes in patients
with and without siderotic nodules, according to the ESWAN images,
was performed using a t-test, while the distribution of the
Child-Pugh and serum albumin scores (calculated according to the
Child-Pugh scoring system) were evaluated using a Mann-Whitney U
Test. With regard to the patients with siderotic nodules, the
correlation between splenic volume and the grades of the ESWAN
images was evaluated using Spearman’s rho.
Results
MRI appearance
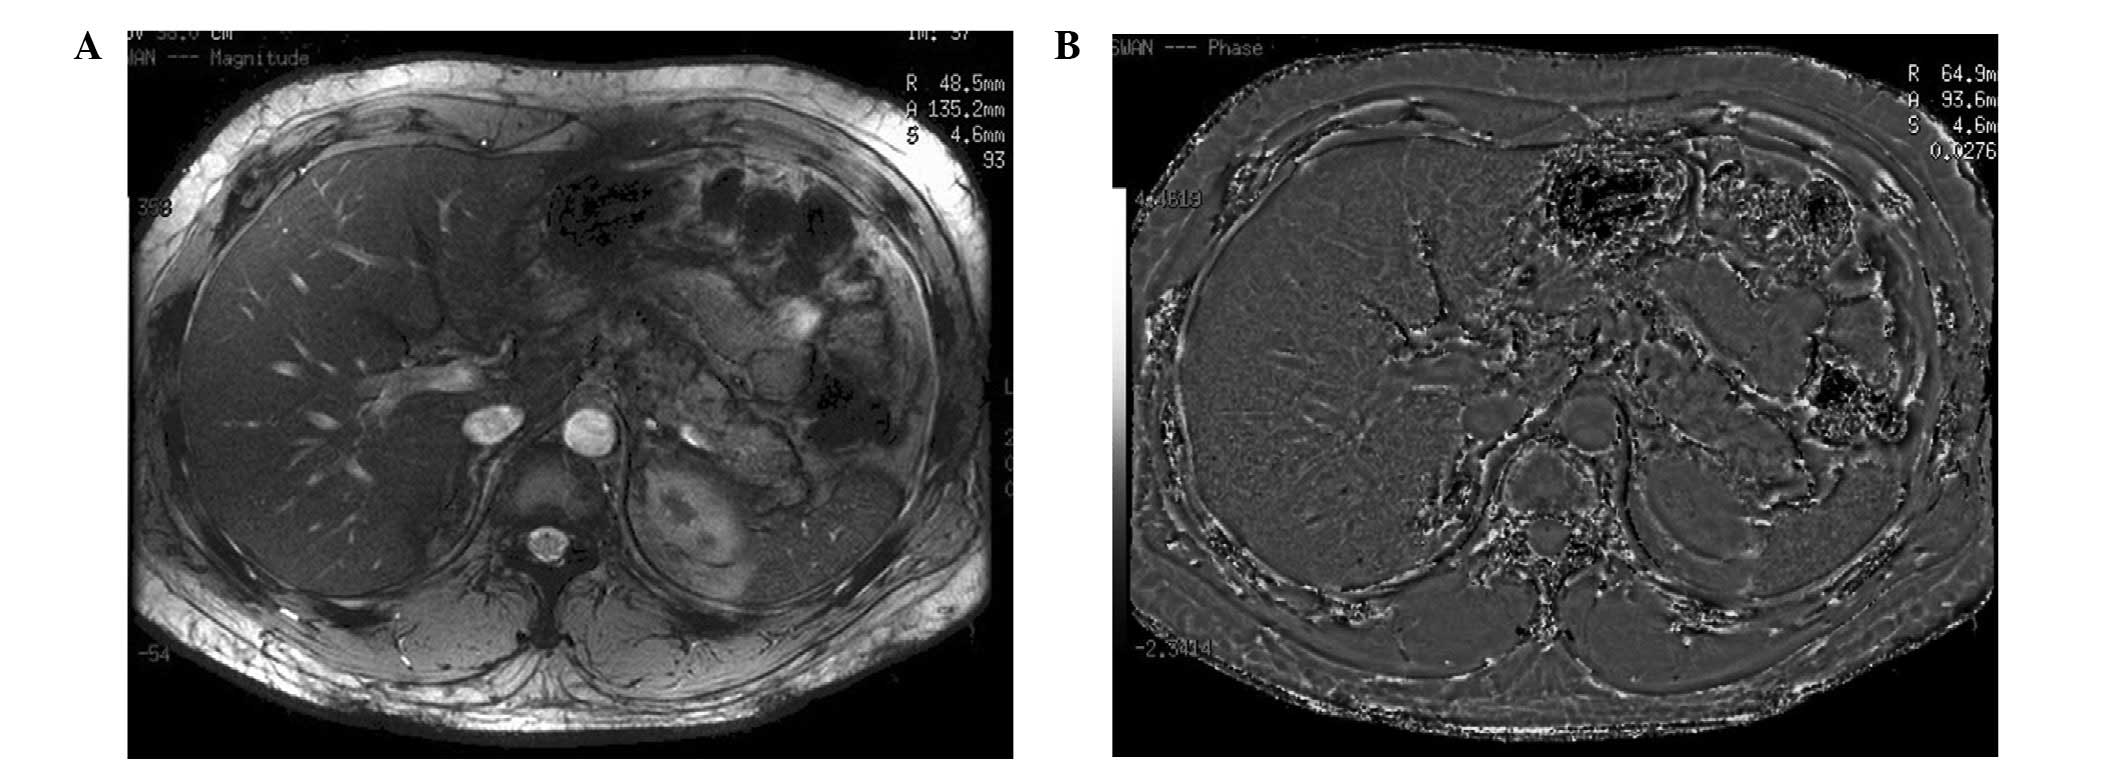
No splenic signal abnormalities were observed on the
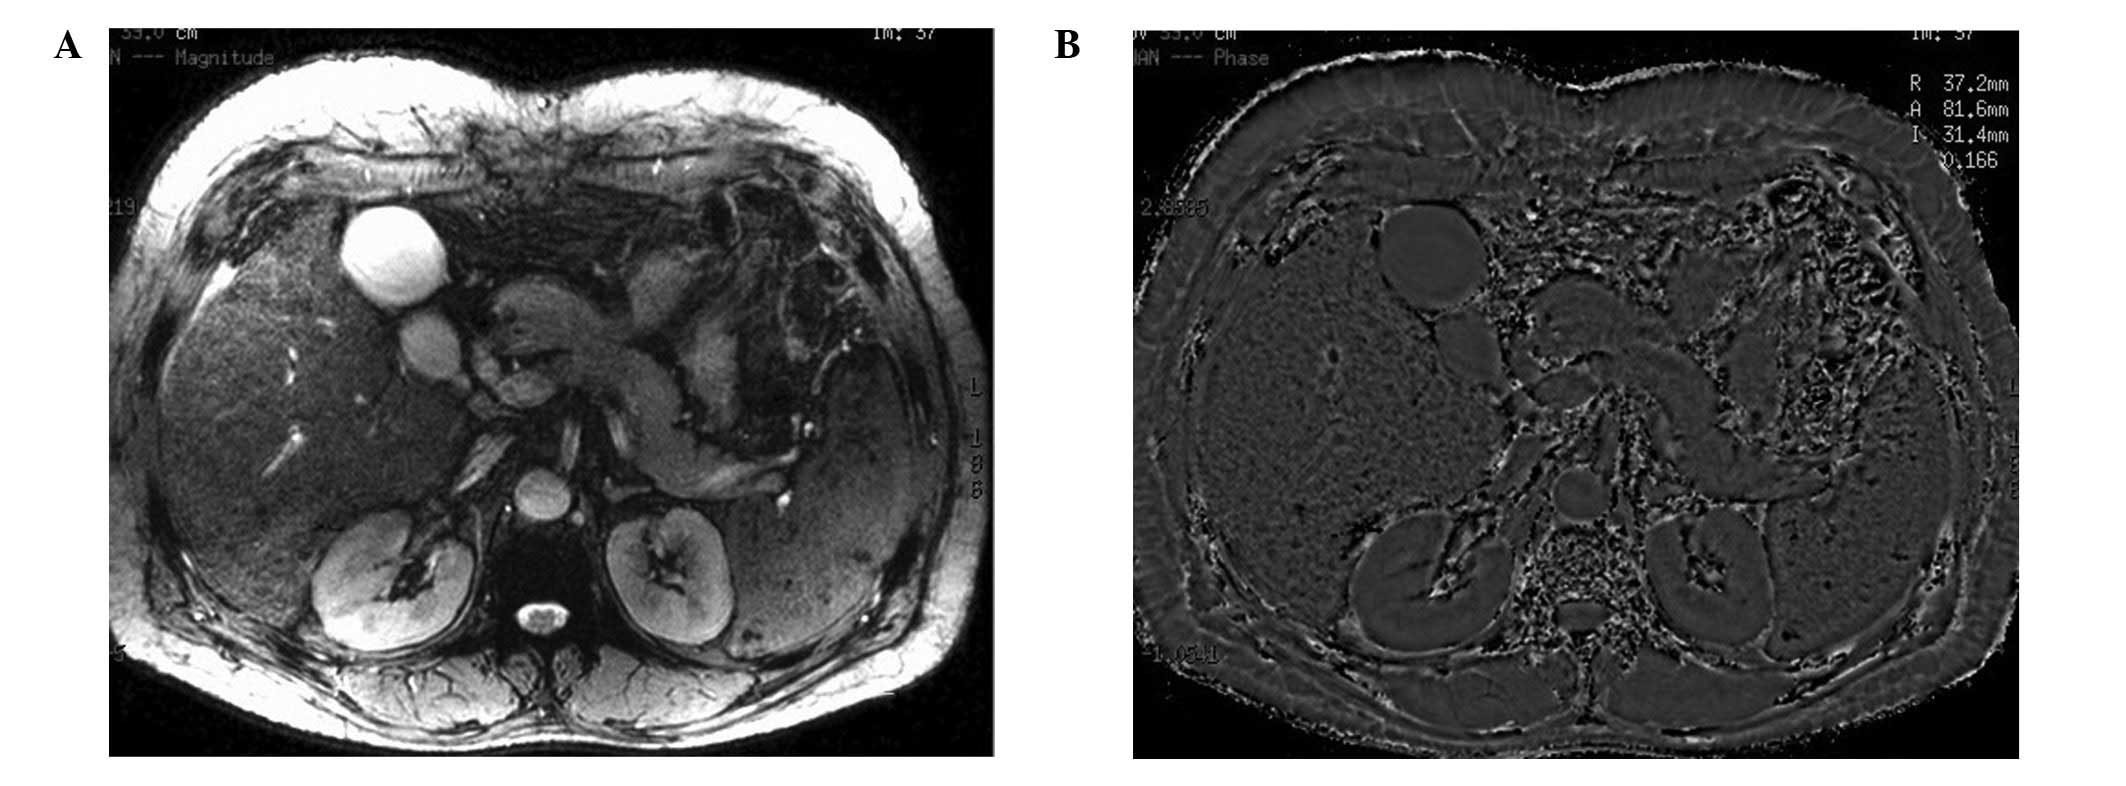
ESWAN images from the healthy control subjects (Fig. 1). With regard to the 33 patients,
speckled dark signals in the spleen were observed on the phase and
magnitude ESWAN images in 24 cases (72.7%) (Fig. 2), while normal splenic signals were
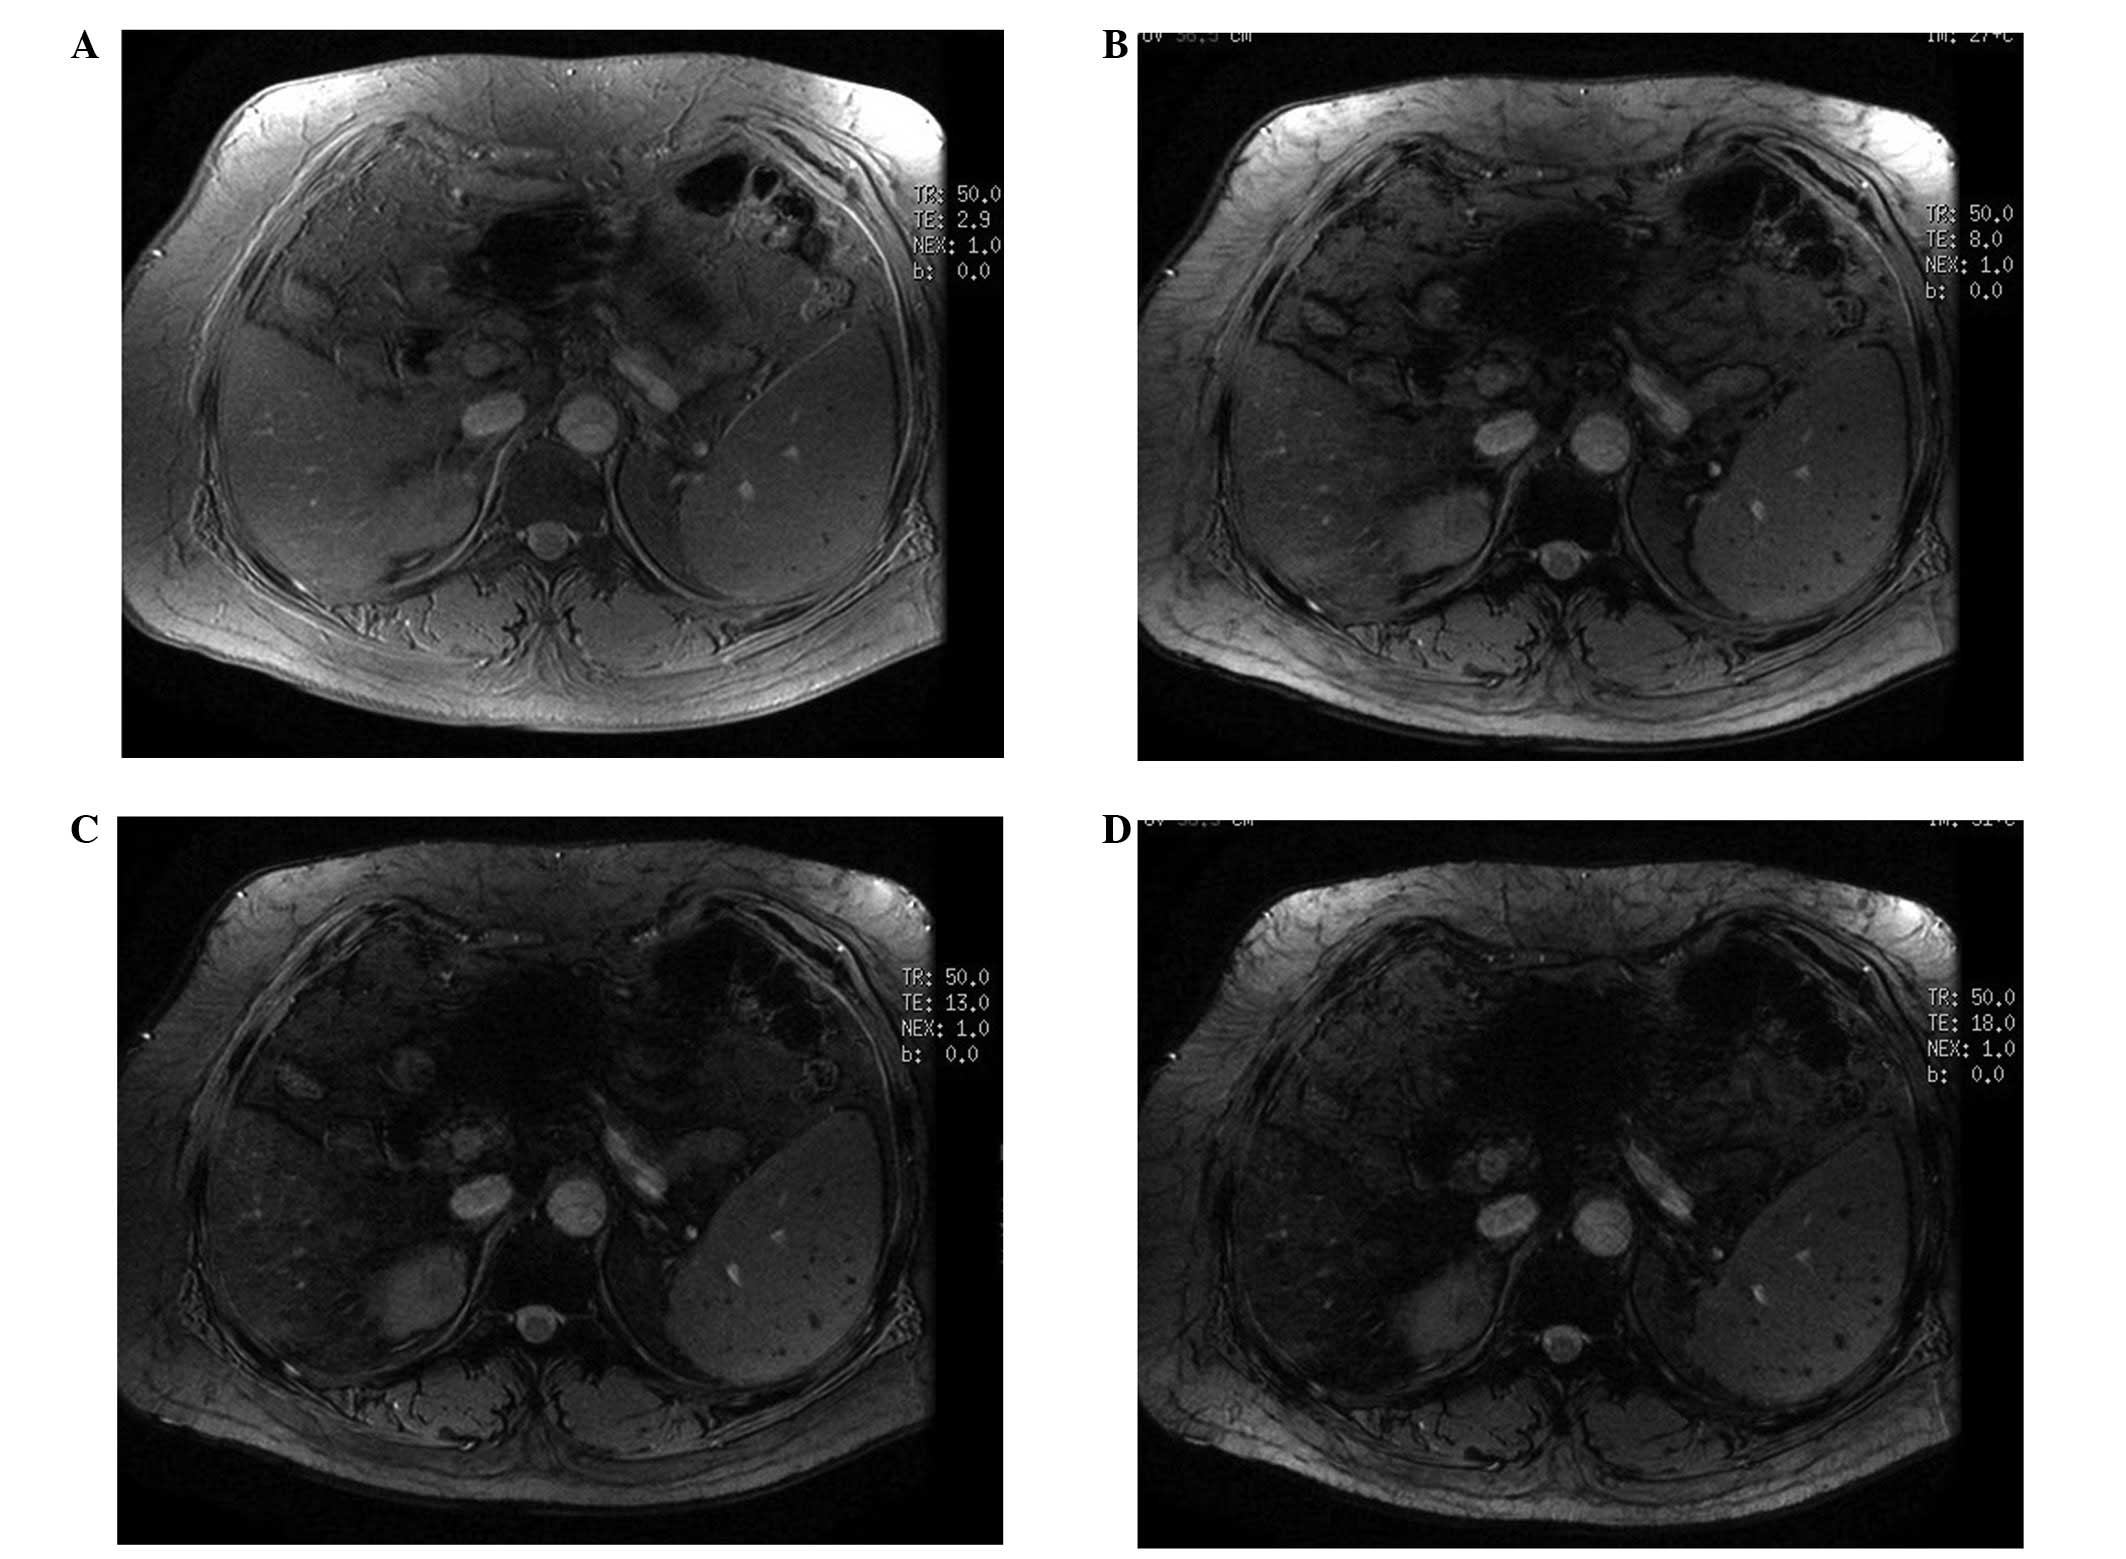
observed for the remaining nine cases. On the raw magnitude images,
the dark lesions in the spleen were more conspicuous on the long TE
images than on the short TE images (Fig. 3). With the conventional MRI, three
cases (9.1%) showed splenic dark signals with the SPGR-T1WI
sequence, while only one case (3.0%) demonstrated splenic dark
signals with the TSE-T2WI sequence. The magnitude of the splenic
dark signals was approximately a few millimeters and the
distribution of the signals was random.
The patient data, the incidences of splenomegaly and
hypersplenism and the grades of the splenic ESWAN images are shown
in Table I. Three patients were
observed to have a normal spleen size and did not exhibit any
splenic dark signals. Of the 16 patients with hypersplenism, there
were 14 grade C splenic ESWAN images, two grade B images and no
grade A images. Of the 14 patients without hypersplenism, but with
splenomegaly, there were eight grade B images and six grade A
images. However, there were no grade C images.
 | Table I.Patient data (n=33). |
Table I.
Patient data (n=33).
| Factor | Value |
|---|
| Mean age (years) | 54 |
| Gender | |
| Males (n) | 25 |
| Females (n) | 8 |
| Etiology | |
| Hepatitis (n) | 30 |
| Alcohol (n) | 2 |
| PSC (n) | 1 |
| Liver function:
Child-Pugh | |
| A (n) | 22 |
| B (n) | 10 |
| C (n) | 1 |
| Blood laboratory
examination | |
| Thrombocytopenia
(n) | 16 |
| Leukopenia (n) | 15 |
| Erythropenia
(n) | 7 |
| Hypohemoglobin
(n) | 5 |
| Splenomegaly (n) | 30 |
| Splenic ESWAN images:
Grades | |
| A (n) | 9 |
| B (n) | 10 |
| C (n) | 14 |
Statistical results
There were significant differences in the
distribution of the grades of the splenic ESWAN images (P<0.001)
between the hypersplenism and non-hypersplenism subgroups (Table II). Furthermore, there was a
significantly different prevalence of the grade C images
(P<0.001) (Table III) in the
hypersplenism, compared with the non-hypersplenism, subgroup. The
diagnostic sensitivity of the grade C images was 87.5%, while the
specificity was 100%.
| Table II.Distribution of the splenic ESWAN
image grades between the hypersplenism and non-hypersplenism
subgroups. |
Table II.
Distribution of the splenic ESWAN
image grades between the hypersplenism and non-hypersplenism
subgroups.
| Image grade | Subgroup
| Total (n) |
|---|
| Hypersplenism |
Non-hypersplenism |
|---|
| A (n) | 0 | 9a | 9 |
| B (n) | 2 | 8a | 10 |
| C (n) | 14 | 0a | 14 |
| Total (n) | 16 | 17a | - |
| Table III.Prevalence of grade C images in the
hypersplenism and non-hypersplenism subgroups. |
Table III.
Prevalence of grade C images in the
hypersplenism and non-hypersplenism subgroups.
| Subgroup | Grade C (n) | Other grades (n) | Total (n) |
|---|
| Hypersplenism | 14 | 2 | 16 |
|
Non-hypersplenism | 0a | 17 | 17 |
| Total (n) | 14 | 19 | 33 |
The splenic volume of the patients with siderotic
nodules was significantly larger than those without the nodules
(579.06±300.85 versus 323.74±179.10 ml, respectively; P<0.05).
However, splenic volume did not demonstrate any significant
correlation with the grades of the ESWAN images in the patients
with siderotic nodules (r=0.319, P>0.05).
There were significant differences in the
distributions of the Child-Pugh (Table
IV) and serum albumin (Table
V) scores (P<0.001 for each) between patients with and
without siderotic nodules.
| Table IV.Distribution of Child-Pugh scores
between patients with and without siderotic nodules (SNs). |
Table IV.
Distribution of Child-Pugh scores
between patients with and without siderotic nodules (SNs).
| Child-Pugh score | SN (−) | SN (+) | Total (n) |
|---|
| A (n) | 8 | 14a | 22 |
| B (n) | 1 | 9a | 10 |
| C (n) | 0 | 1a | 1 |
| Total (n) | 9 | 24 | 33 |
| Table V.Distribution of the serum albumin
scores between patients with and without siderotic nodules
(SNs). |
Table V.
Distribution of the serum albumin
scores between patients with and without siderotic nodules
(SNs).
| Albumin score | SN (−) | SN (+) | Total (n) |
|---|
| 1 (n) | 7 | 10a | 17 |
| 2 (n) | 2 | 13a | 15 |
| 3 (n) | 0 | 1a | 1 |
| Total (n) | 9 | 24 | 33 |
Discussion
The ESWAN sequence includes magnitude and phase
imaging. The magnitude imaging that was used in the present study
was a type of T2*WI sequence. This is most sensitive to local field
inhomogeneities, resulting in the phase changes with substances of
different susceptibility. The phase imaging provides the phase
shift information of the substances and is able to differentiate
between iron and calcium due to their opposing susceptibilities.
The former appears as a dark signal, while the latter results in a
high signal on phase images. In this study, the lesions of the
spleen were revealed to be small (<1 cm in size), with the
appearance of dark signals (signal-voids) on all the sequences
observed, although they were particularly conspicuous with the
ESWAN sequence. It was observed that the dark signals in the spleen
became darker and more conspicuous as the TE was increased on the
raw magnitude images, which was consistent with the nature of the
siderotic nodules (5–7,17).
The nodules did not appear as high signals on the phase images in
the study, which may be attributed to iron deposition being favored
over the deposition of calcium or to a lack of calcium deposition
within the nodule.
One factor that was not fully elucidated was whether
the splenic siderotic nodules on the MRI images in the present
study were identical to the GGBs described in previous studies.
Splenic GGBs have been described to appear in a number of
conditions, including chronic hemolysis, portal hypertension,
sickle cell anemia (SCA), leukemia and lymphoma. It has been
suggested that GGBs derive from red cell breakdown, and are a
chronic, late event occurring following hemorrhage and red cell
destruction (2). A histological
study on splenic GGBs in patients with SCA demonstrated that GGBs
were only detected by microscopy in patients >4 years of age,
and that patients younger than this did not develop GGBs.
Furthermore, hemosiderin deposits were observed in all patients,
whereas microscopy revealed the presence of GGBs in 58% of cases
(2). Hemosiderin deposition, old
hemorrhages and GGBs may coexist and correspond with the different
stages of hemolysis diseases, as well as liver cirrhosis, with
hemorrhage and hemosiderin occurring in the early stages and GGBs
appearing later. However, since all three are detected by a
signal-void on MRI, due to their iron content, the differentiation
may depend on histology. Therefore, the present study referred to
siderotic nodules rather than GGBs.
Based on the images obtained using the ESWAN
sequence, the prevalence of splenic siderotic nodules in patients
with liver cirrhosis in the present study was 72.7%, which was
higher than the prevalence observed in previous studies (9–13%),
obtained using the T1-SPGR sequence. However, the results obtained
with the T1-SPGR sequence in the present study were consistent with
those of the previous studies (3,4,7,18).
It was suggested that the ESWAN sequence was superior to the
T1-SPGR sequence in the detection of siderotic nodules in the
spleen.
Hypersplenism frequently occurs in patients with
liver cirrhosis and portal hypertension. It is an independent risk
factor for variceal bleeding, spontaneous bacterial peritonitis and
death in patients with cirrhosis (19). Hypersplenism is diagnosed on the
basis of clinical data that include splenomegaly with
thrombocytopenia (cytopenia). However, the detection of
splenomagely alone by imaging modalities is not representative of
hypersplenism. The present study revealed that the presence of
splenic siderotic nodules corresponded with the occurrence of
hypersplenism. Since grade C images were only observed in patients
with hypersplenism, the occurrence of these images may be applied
to the diagnosis of hypersplenism. This diagnostic method was
demonstrated to have desirable sensitivity and specificity.
It has been suggested that splenic siderotic nodules
in patients with cirrhosis may be attributed to portal
hypertension. It is possible to detect certain secondary signs of
portal hypertension, such as portal widening, splenomegaly and
variceal formation. In the present study, splenic siderotic nodules
were only observed in patients with splenomegaly, which was
consistent with previous invetigations (7,18).
The splenic volume of the patients with siderotic nodules was
demonstrated to be significantly larger than that of patients
without the nodules, which was consistent with the suggestion that
the formation of the siderotic nodules was interrelated with portal
hypertension, as well as with portal hypertension resulting in
splenomegaly, congestion and micro-hemorrhage in the spleen.
However, the number of siderotic nodules did not always correspond
with the increases in splenic volume, which may suggest that there
are additional contributory mechanisms and interrelated
factors.
Piccin et al (2) observed that patients with SCA and
GGBs had low platelet counts, which was consistent with the results
of the present study. This indicated that the presence of splenic
siderotic nodules corresponded with the occurrence of
thrombocytopenia in patients with liver cirrhosis. The mechanism of
thromobocytopenia is complicated and disputed. At present, the
suggestion is that hypersplenism, decreased thrombopoietin (TPO)
synthesis and bone suppression result in thrombocytopenia in
patients with liver cirrhosis (20–23).
Thrombocytopenia may induce and aggravate hemorrhage; thus, it was
proposed that, in addition to portal hypertension, thrombocytopenia
may be an independent or coordinated cause of splenic siderotic
nodules in patients with liver cirrhosis.
There were significant differences in reserved liver
function between patients with and without splenic siderotic
nodules, which demonstrated that the siderotic nodules were
interrelated with liver function. This result contrasted with that
described in a previous study by Laurent et al (18). It is likely that the poor reserved
liver function decreased the synthesis of coagulation factor and
TPO, which induced hemorrhages, including splenic hemorrhage.
In conclusion, the MRI ESWAN sequence was a
sensitive method of detecting siderotic nodules of the spleen in
patients with liver cirrhosis. A higher prevalence of splenic
siderotic nodules (72.7%) was revealed using this sequence than
with the sequence used in previous studies. The presence of splenic
siderotic nodules was consistent with the occurrence of
hypersplenism; therefore, the presence of splenic siderotic nodules
may be applied for the diagnosis of hypersplenism. The formation of
these nodules has been suggested to be attributed to portal
hypertension, which was consistent with the results from the
present study. In addition, it was suggested that an additional
potential cause for the formation of the nodules may be
thrombocytopenia. Moreover, it was observed that the presence of
siderotic nodules was interrelated with reserved liver function in
patients with liver cirrhosis.
There were two limitations in this study, including
the small sample size. Additional investigations with large groups
of patients are required to confirm the results of the present
study. In addition, the present study did not refer to the results
of splenic pathology, although it has been recognized in previous
studies that images obtained using MRI are sufficient to achieve a
specific diagnosis.
References
|
1.
|
Yilmaz S, Yekeler E and Rozanes I:
Education and imaging. Hepatobiliary and pancreatic: Gamna-Gandy
bodies of the spleen. J Gastroenterol Hepatol. 22:7582007.
View Article : Google Scholar : PubMed/NCBI
|
|
2.
|
Piccin A, Rizkalla H, Smith O, McMahon C,
Furlan C, Murphy C, et al: Composition and significance of splenic
Gamna-Gandy bodies in sickle cell anemia. Hum Pathol. 43:1028–1036.
2012. View Article : Google Scholar : PubMed/NCBI
|
|
3.
|
Minami M, Itai Y, Ohtomo K, Ohnishi S,
Niki T, Kokubo T, et al: Siderotic nodules in the spleen: MR
imaging of portal hypertension. Radiology. 172:681–684. 1989.
View Article : Google Scholar : PubMed/NCBI
|
|
4.
|
Sagoh T, Itoh K, Togashi K, Shibata T,
Nishimura K, Minami S, et al: Gamna-Gandy bodies of the spleen:
evaluation with MR imaging. Radiology. 172:685–687. 1989.
View Article : Google Scholar : PubMed/NCBI
|
|
5.
|
Selçuk D, Demirel K, Kantarci F, Mihmanli
I and Oğüt G: Gamna-Gandy bodies: a sign of portal hypertension.
Turk J Gastroenterol. 16:150–152. 2005.
|
|
6.
|
Dobritz M, Nömayr A, Bautz W and Fellner
FA: Gamna-Gandy bodies of the spleen detected with MR imaging: a
case report. Magn Reson Imaging. 19:1249–1251. 2001. View Article : Google Scholar : PubMed/NCBI
|
|
7.
|
Unsal NH, Erden A and Erden I: Evaluation
of the splenic vein diameter and longitudinal size of the spleen in
patients with Gamna-Gandy bodies. Diagn Interv Radiol. 12:125–128.
2006.PubMed/NCBI
|
|
8.
|
Haacke EM, Mittal S, Wu Z, Neelavalli J
and Cheng YC: Susceptibility-weighted imaging: technical aspects
and clinical applications, part 1. AJNR Am J Neuroradiol. 30:19–30.
2009. View Article : Google Scholar
|
|
9.
|
Mittal S, Wu Z, Neelavalli J and Haacke
EM: Susceptibility-weighted imaging: technical aspects and clinical
applications, part 2. AJNR Am J Neuroradiol. 30:232–252. 2009.
View Article : Google Scholar : PubMed/NCBI
|
|
10.
|
Gao T, Wang Y and Zhang Z: Silent cerebral
microbleeds on susceptibility-weighted imaging of patients with
ischemic stroke and leukoaraiosis. Neurol Res. 30:272–276. 2008.
View Article : Google Scholar : PubMed/NCBI
|
|
11.
|
Rauscher A, Sedlacik J, Barth M, Mentzel
HJ and Reichenbach JR: Magnetic susceptibility-weighted MR phase
imaging of the human brain. AJNR Am J Neuroradiol. 26:736–742.
2005.PubMed/NCBI
|
|
12.
|
Sehgal V, Delproposto Z, Haddar D, Haacke
EM, Sloan AE, Zamorano LJ, et al: Susceptibility-weighted imaging
to visualize blood products and improve tumor contrast in the study
of brain masses. J Magn Reson Imaging. 24:41–51. 2006. View Article : Google Scholar : PubMed/NCBI
|
|
13.
|
Mahmood NS, Kadavigere R, Avinash KR and
Rao VR: Magnetic resonance imaging in acute cervical spinal cord
injury: a correlative study on spinal cord changes and 1 month
motor recovery. Spinal Cord. 46:791–797. 2008. View Article : Google Scholar : PubMed/NCBI
|
|
14.
|
Yang Q, Liu J, Barnes SR, Wu Z, Li K,
Neelavalli J, et al: Imaging the vessel wall in major peripheral
arteries using susceptibility-weighted imaging. J Magn Reson
Imaging. 30:357–365. 2009. View Article : Google Scholar : PubMed/NCBI
|
|
15.
|
Dai Y, Zeng M, Li R, Rao S, Chen C,
DelProposto Z, et al: Improving detection of siderotic nodules in
cirrhotic liver with a multi-breath-hold susceptibility-weighted
imaging technique. J Magn Reson Imaging. 34:318–325. 2011.
View Article : Google Scholar : PubMed/NCBI
|
|
16.
|
Kim MJ, Mitchell DG, Ito K, Hann HW, Park
YN and Kim PN: Hepatic iron deposition on MR imaging in patients
with chronic liver disease: correlation with serial serum ferritin
concentration. Abdom Imaging. 26:149–156. 2001. View Article : Google Scholar : PubMed/NCBI
|
|
17.
|
Vitellas KM, Tzalonikou MT, Bennett WF,
Vaswani KK and Bova JG: Cirrhosis: spectrum of findings on
unenhanced and dynamic gadolinium-enhanced MR imaging. Abdom
Imaging. 26:601–615. 2001. View Article : Google Scholar : PubMed/NCBI
|
|
18.
|
Laurent O, Lubrano J, de Beauregard M,
Aubry S, Kastler B and Delabrousse É: Gamna-Gandy bodies in
cirrhosis: a meaningless finding? J Radiol. 92:909–914. 2011.(In
French).
|
|
19.
|
Liangpunsakul S, Ulmer BJ and Chalasani N:
Predictors and implications of severe hypersplenism in patients
with cirrhosis. Am J Med Sci. 326:111–116. 2003. View Article : Google Scholar : PubMed/NCBI
|
|
20.
|
Peck-Radosavljevic M: Hypersplenism. Eur J
Gastroenterol Hepatol. 13:317–323. 2001.
|
|
21.
|
Peck-Radosavljevic M: Thrombocytopenia in
liver disease. Can J Gastroenterol. 14(Suppl D): 60D–66D. 2000.
|
|
22.
|
Karasu Z, Tekin F, Ersoz G, Gunsar F,
Batur Y, Ilter T and Akarca US: Liver fibrosis is associated with
decreased peripheral platelet count in patients with chronic
hepatitis B and C. Dig Dis Sci. 52:1535–1539. 2007. View Article : Google Scholar : PubMed/NCBI
|
|
23.
|
Zucker ML, Hagedorn CH, Murphy CA, Stanley
SS, Reid KJ and Skikne BS: Mechanism of thrombocytopenia in chronic
hepatitis C as evaluated by the immature platelet fraction. Int J
Lab Hematol. 34:525–532. 2012. View Article : Google Scholar : PubMed/NCBI
|