Introduction
Tubulointerstitial fibrosis (TIF) is a common
process, it is the main pathological characteristic of end stage
renal disease (ESRD) (1), and is
the result of chronic and persistent renal damage. Injured tissues
are characterized by excessive proliferation of the extracellular
matrix (ECM) due to chronic and persistent damage, subsequently
resulting in fibrosis or sclerosis (2,3).
Iwano et al determined that ∼42% of renal TIF derived from
renal tubular epithelial cells (4). The renal tubule connects the
glomerulus and renal interstitium. Renal tubular epithelial cells
are directly involved in renal tubular atrophy, expansion of the
renal tubule cavity and are related to ECM proliferation.
Therefore, renal tubular epithelial cells have a significant impact
on the initiation of TIF, and the development and inhibition of TIF
is important to impede the processes of renal disease. The
mechanisms of TIF involve various renal inherent cells, cytokines
and bioactive substances, and an imbalance in the cytokines that
inhibit or facilitate fibrosis is important.
Hepatocyte growth factor (HGF) is a cytokine
indicated to be anti-fibrotic and may inhibit TIF; however, the
mechanism of anti-TIF has not been fully understood. Monocyte
chemoattractant protein-l (MCP-1) is an important medium for
monocyte/macrophage infiltration and a principle cytokine that may
induce TIF (5,6). The prevention and delayed occurence
of TIF is a worldwide difficulty. Therefore, studies aim to
determine novel therapeutic targets and develop drugs with strong
pertinence, efficacy and fewer side effects so as to prevent and
treat patients with TIF.
Modern clinical and pharmacological studies have
demonstrated that herba centellae contains triterpenoids, including
asiaticoside, madecassoside, madecassic acid and asiatic acid
(7–10). Herba centellae may inhibit
proliferation of the ECM and maintain the fibre composition by
decreasing aminotransferase activity, reducing acid
mucopolysaccharide and collagen, and inhibiting the expression of
transforming growth factor-β1 (TGF-β1). Expression of
TGF-β1 may be inhibited by enhancing Smad expression, which blocks
proliferation of the fibroblasts and prevents inflammation and
proliferation. Furthermore, herba centellae may promote normal
granulated tissue formation, activate epithelial cells, accelerate
wound healing and inhibit fibroblast proliferation and collagen
formation, thus inhibiting excessive proliferation of the
connective tissue matrix and maintain fibre composition. Herba
centellae is not expensive and has significant efficacy for
fibrotic diseases including the treatment of scarring from burns
and scleroderma, with no toxic effects. Therefore, herba centellae
is advantageous for the treatment of fibrotic diseases. Previous
studies have demonstrated that herba centellae may reduce the
expression of renal tissue connective tissue growth factor (CTGF)
and α-smooth muscle actin (α-SMA) in unilateral ureteral
obstruction (UUO) rats, inhibit the expression of TGF-β1 in tubular
epithelial cells in vitro, and maintain the expression of
bone morphogenetic protein-7 (BMP-7). Thus, herba centellae may
reduce tubulointerstitial damage and exhibit anti-TIF effects.
However, whether herba centellae may promote ECM degradation
requires further study. In addition, herba centellae may regulate
the expression of HGF and MCP-1 in ECM degradation and prevent and
delay TIF; however, the potential mechanisms have not been
studied.
In the present study, based on previous work model
animals with tubulointerstitial damage were established in
vivo and in vitro. The protein and mRNA expression of
HGF and MCP-1 in the renal tissue of these models was determined
using qPCR, immunohistochemistry (IHC) and immunocytochemistry
(ICC). This study aimed to identify significant mechanisms for the
prevention and delay of TIF.
Materials and methods
General data
Eighty male Sprague-Dawley rats at 6–8 weeks old
(weight, 200±20 g) were supplied by the Henan animal experiment
center (Henan, China). This study was carried out in strict
accordance with the recommendations in the Guide for the Care and
Use of Laboratory Animals of the National Institutes of Health. The
animal use protocol was reviewed and approved by the Institutional
Animal Care and Use Committee (IACUC) of The First Affiliated
Hospital, Henan University of Traditional Chinese Medicine
(Zhengzhou, Henan, China). The animal model was established in 50
rats among which, 10 rats were randomly selected as the control
group and the remaining 40 rats were evenly and randomly divided
into the model group, high-dose herba centellae, low-dose herba
centellae and fosinopril groups. The rats were sacrificed 21 days
following drug application and the kidneys were dissected. Blood
samples were collected from the abdominal aorta for biochemical
testing. An additional 30 rats were used to prepare the rat serum
containing drug by cell culture. The epithelial cell strain-NRK52E
of proximal convoluted tubule from normal rats was a gift from
Professor Xueqing of Zhongshan University (Guangzhou, Guangdong,
China).
Animal model establishment
Rats from the surgery group were anesthetized by
intraperitoneal injection using 10% chloral hydrate (0.3 ml/100 g).
An incision was made on the left abdomen to expose the left kidney
and ureter, which was subsequently ligated and cut from the
proximal inferior pole of the left kidney. The control group did
not undergo UUO surgery but followed a similar method to the
surgery group.
Tissue sample preparation
Rats were anesthetized as previously mentioned and
the abdominal cavity was exposed in the middle. Blood samples were
collected from the abdominal aorta and the left kidney was
dissected. A quarter of the renal tissue was fixed in 4%
paraformaldehyde, dehydrated by gradient alcohol, transparentized
using xylol and immersed in paraffin for 3 h at 62°C prior to
embeddeding. The expression of HGF and MCP-1 was examined in the
tissue sections using hematoxylin and eosin (HE) staining and
immunohistochemistry (IHC). The remaining renal tissue was frozen
in liquid nitrogen and stored in a freezer (−70°C) for subsequent
qPCR analysis.
IHC-streptavidin-peroxidase (SP)
The paraffin-embedded renal tissue section was cut
into 4 μm slides, deparaffinized and rehydrated. The slides
were incubated with primary antibodies of rabbit-anti-rat HGF and
rabbit-anti-rat MCP-1 (1:200, Wuhan Boster Biological Engineering
Co., Ltd., Hubei, China) at 40°C overnight. Then, biotinylated
sheep-anti-rabbit IgG (Wuhan Boster Bioengineering Co., Ltd.) was
added to the tissue sections for 20 min at 37°C. Diaminobenzidine
(DAB)-H2O2 (Wuhan Boster Biological
engineering Co., Ltd.) was used to develop the color and
hematoxylin was applied for counterstaining, and the slides were
covered for examination. Ten fields of renal tubulointerstitial on
each slide were recorded randomly under high magnification (×400)
and Taimeng multimedia pathology analysis software (Taimeng
Technology Ltd., Chengdu, Sichuan China) was used for image
analysis. Yellow or brown granules in the cytoplasm were recorded
as a positive signal, and the average optical density (OD) of
positive and background staining was measured following
chromaticity transformation.
qPCR
The total RNA of rat renal tissue was extracted by
TRIzol (Shanghai Sangon Biological Engineering Technology and
Services Co., Ltd., Shanghai, China) and the purity and content was
measured by ultraviolet-visible (UV-VIS) spectrophotometer. qPCR
was performed according to the method from the real-time kit
(Shanghai Sangon Biological Engineering Technology and Services
Co., Ltd., Shanghai, China). Total RNA from each group (2
μl) was obtained and reverse transcribed to cDNA. The total
volume was 21 μl under the conditions of 70°C for 5 min,
37°C for 5 min, 37°C for 60 min and 70°C for 10 min. The cDNA was
used as a template for the PCR reaction with a total volume of 25
μl. The primer of rat HGF was designed as follows: forward:
5′-TACACTCTTGACCCT GACACCC-3′, and reverse 5′-TTTCCCATTGCCACGATA
ACA-3′; length of PCR amplified fragment, 378 bp. The primer of rat
MCP-1 was designed as follows: forward:
5′-TCTCTGTCATACTGGTCACTTC-3′, and reverse 5′-GGT
GTCCCAAAGAAGCTGTAG-3′; length of PCR amplified fragment, 270 bp.
The primer of rat glyceraldehyde 3-phosphate dehydrogenase (GAPDH)
was designed as follows: forward: 5′-TGACATCAAGAAGGTGGTGA-3′, and
reverse 5′-TCATACCAGGAAATGAGCT-3′; length of the PCR amplified
fragment, 177 bp. The reaction was carried out over 34 cycles for
HGF in the following conditions: 3 min at 95°C, 30 sec at 94°C, 60
sec at 55°C and 60 sec at 72°C. The reaction for MCP-1 was carried
out over 33 cycles for 3 min at 95°C, 30 sec at 94°C, 60 sec at
55°C and 60 sec at 72°C. The reaction for GAPDH was carried out
over 30 cycles for 2 min at 94°C, 45 sec at 94°C, 30 sec at 60°C
and 1 min at 72°C. The product of the PCR was added to 2% agarose
and run in gel electrophoresis. The DNA fragments were then set in
the gel image analysis system (UVP Inc., PA, USA) to scan the
absorbance. GAPDH was considered as internal reference, and the
ratio of the target gene absorbance and GAPDH absorbance was
recorded as the relative target gene expression.
Preparation of rat serum containing
drug
Thirty healthy SD rats were randomly divided into
the herba centellae, fosinopril and control groups. According to
the Traditional Chinese medicine pharmacological research
methodology, 10 times herba centellae granules of adult dose/kg
were dissolved in triple distilled water and gavaged with a dose of
2 ml/(100 g/d) (0.25 g raw herba centellae/m; Jiangyin Tianjiang
Pharmaceutical Co., Ltd., Jiangsu, China) twice per day for three
days. The interval between administration on the last day was 2 h
and the rats were sacrificed 1–2 h following the final dose. Blood
samples were collected from the abdominal aorta and the serum was
isolated. The complement of serum with drug was inactivated in a
water bath for 30 min at 56°C, followed by 0.22 μm
filtration and sterilization and then stored in the freezer (−70°C)
for further use. In the fosinopril group (Sino-US Shanghai
Bristol-Myers Squibb Pharmaceutical Co., Ltd., Shanghai China)
samples were prepared as previously mentioned and in the control
group physiological saline was used to gavage the rats.
Cell culture
NRK52E cells were cultured in Dulbecco’s modified
Eagle’s medium (DMEM)/nutrient mixture F-12 media (contained 100
U/ml penicillin, 100 ttg/ml streptomycin) with 10% fetal bovine
serum (FBS) at 37°C and 5% CO2. Following passage, cells
were inoculated into six 25 cm2 culture flasks.
Moreover, cells were synchronized in the non-serum media for 12 h
and divided into five groups stochastically when they reached 80%
confluence. In the control group (DZ) cell culture was determined
as DMEM/nutrient mixture F-12 + 10% blank serum; in the
TGF-β1 (PeproTech Inc., NJ USA) stimulation group (T) as
DMEM/F-12 (with 10 ng/ml TGF-β1) + 10% blank serum; in
the low-dose group as DMEM/F-12 (with 10 ng/ml TGF-β1) +
serum with 2.5% herba centellae; in the high-dose group as
DMEM/F-12 (with 10 ng/ml TGF-β1) + serum with 10% herba
centellae; and in the fosinopril group (M) as DMEM/F-12 (with 10
ng/ml TGF-β1) + serum with 10% fosinopril. In addition,
blank serum was replenished to 10% serum concentration in each
group. The cells were cultured for 48 h in 5% CO2 at
37°C. Following cultivation, the HGF and MCP-1 protein and mRNA
expression levels were assayed by qPCR and ICC methods. The
experiments were repeated 10 times independently.
ICC
Following 48 h of cell stimulation with drugs, the
sterile cover glass for cell culture was placed over a six-well
plate. The culture media were drained away and the six-well plate
was washed twice with phosphate-buffered saline (PBS), and cells
were fixed with 4% paraformaldehyde for 15 min at 4°C. The cover
glass was removed and washed with 0.01 M PBS (pH=7.4) three times
(3–5 min each time). Following inactivation of endogenous
peroxidase, the slides were incubated with primary antibodies
(rabbit IgG, 1:100) at 4°C overnight. In addition, the horseradish
peroxidase (HRP)-labeled anti-rabbit IgG was added to the cover
glass for 30 min at 37°C. DAB-H2O2 was
utilized to develop the color and hematoxylin was applied for
counterstaining. The slides were covered for examination. Ten
fields of renal tubulointerstitial on each slide were recorded
randomly by Olympus microscope (Japan) and Taimeng multimedia
pathology analysis software (Taimeng Technology Ltd, Chengdu,
Sichuan, China) was used for image analysis. Yellow or brown
granules in the cytoplasm were recorded as a positive signal, and
the average optical density (OD) of positive and background
staining were measured following chromaticity transformation.
Darker staining correlated with a higher OD level.
Fluorescent quantification (FQ) qPCR
Following collection, the cells were washed with PBS
and the total RNA was extracted following the RNAiso reagent
(Takara Bio, Inc., Japan) protocol. RNA concentration was
calculated based on the A260/A280 value measured by an ultraviolet
spectrophotometer. HiFi-MMLV-cDNA First-Strand cDNA Synthesis Kit
(Shanghai Sangon Biological Engineering Technology & Services
Co., Ltd.) was utilized to synthesize the first-strand cDNA, and
the PCR kit was used to perform the PCP reaction. The primers used
were: MCP-1: forward: 5′-TACAAGAGAATCACCAGCAGCA-3′, and reverse:
5′-TACAAGAGAATCACCAGCAGCA-3′; product length, 90 bp; HGF: forward:
5′-TTCCCGTTGTGAAGGAGAT ACT-3′, and reverse:
5′-ACCATCCACCCTACTGTTGTTT-3′; product length, 129 bp; GAPDH:
forward: 5′-TGACATCAA GAAGGTGGTGA-3′; and reverse: 5′-TCATACCAGGAAA
TGAGCT-3′; product length, 177 bp. The reaction occurred for 2 min
at 50°C, followed by 40 cycles of 10 min at 95°C, 15 sec at 95°C
and 1 min at 60°C. The end of the reaction included 15 sec at 95°C
and 15 sec at 60°C. The fluorescent signal was obtained during the
annealing process. The results from FQ qPCR were represented by the
Ct value, which was the number of cycles in each reaction when the
fluorescent signal reached the set threshold. The Ct value was
calculated as: average Ct value of a gene-Ct value of GAPDH.
Statistic analysis
Data were presented as means ± SD. Statistical
significance was performed using SPSS software version 18.0 (SPSS,
Inc., Chicago, Il USA). Comparison between groups was examined
using the one-way analysis of variance (ANOVA). P<0.05 indicates
a statistically significant difference.
Results
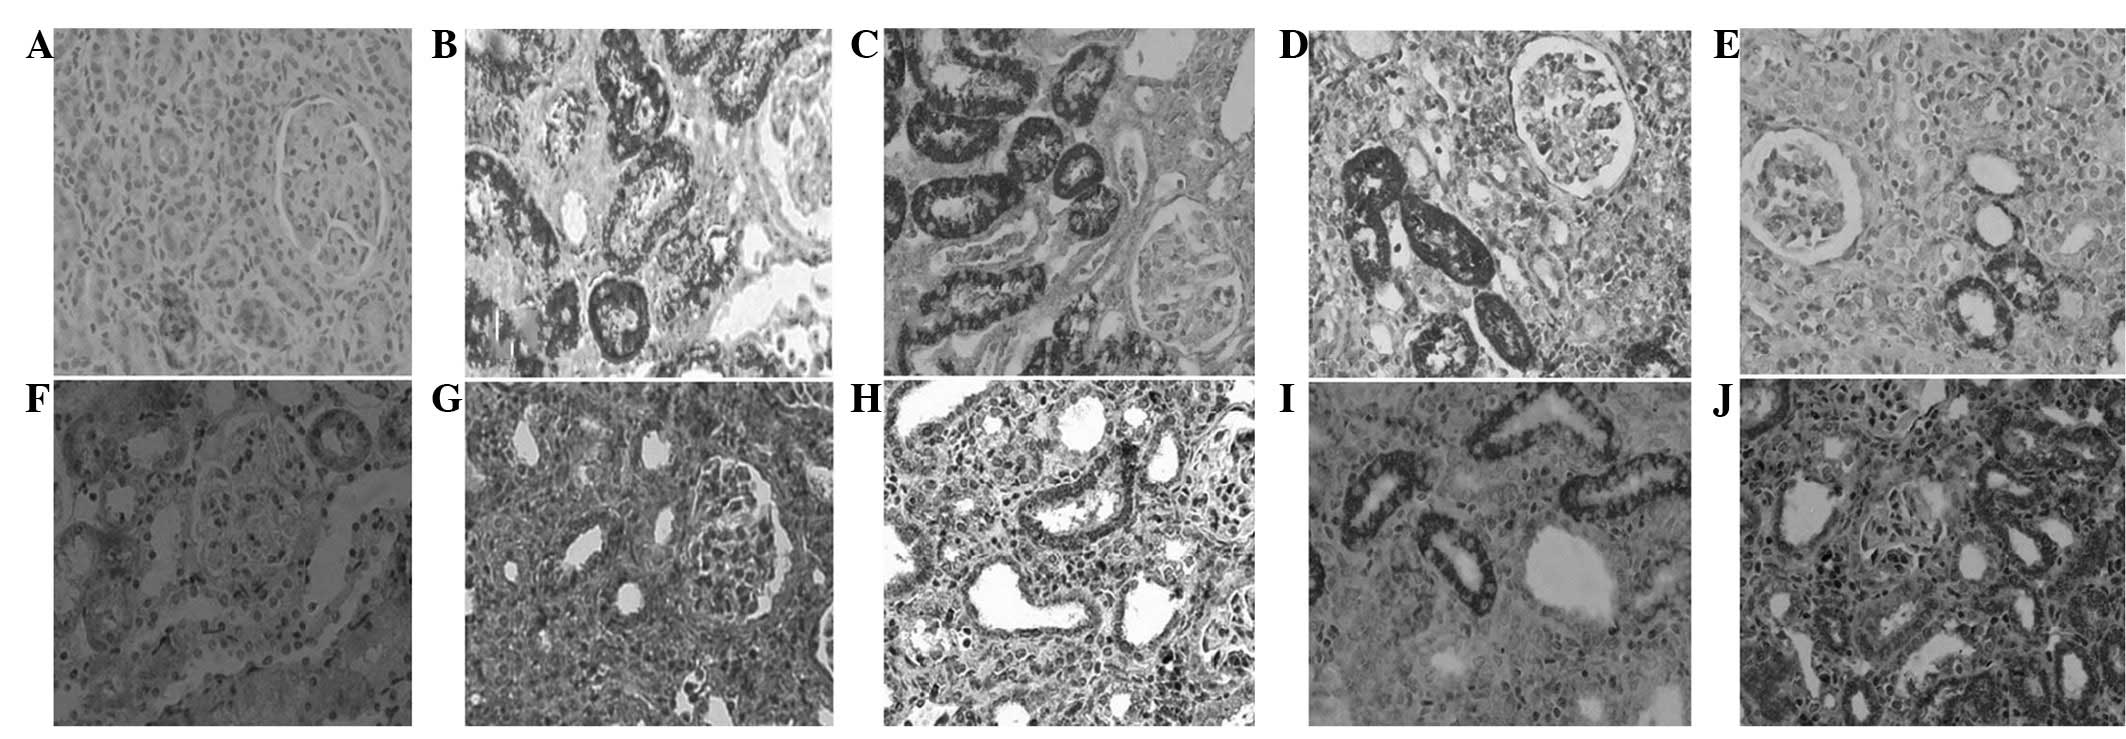
Protein expression of HGF and MCP-1 in
rat renal tissue
The IHC demonstrated a low expression of HGF in
renal tubulointerstitial cells of the control group; however,
following UUO surgery HGF was mainly expressed in the cytoplasm of
the renal tubular epithelial cells. In addition, there was a low
expression of HGF in renal tubulointerstitial cells in the model
group. However, the expression of HGF had significantly increased
in the drug intervention group (P<0.01) compared with that of
the control group. Expression in the high-dose group was
significantly higher compared with that of the low-dose group
(P<0.01), but similar to that of the fosinopril group
(P>0.05). MCP-1 was predominantly expressed in the cytoplasm of
renal tubular epithelial cells; however, a low expression was
indicated in the renal tissue, and no expression was observed in
the glomerulus and renal interstitial cells in the control group.
MCP-1 expression in renal tissue significantly increased 21 days
following surgery in the model group compared with that of the
control group, and a particularly significant increase was
demonstrated in the medulla tubule epithelial cells (P<0.01).
Statistical analysis determined that MCP-1 expression in the drug
intervention group was significantly reduced compared with that of
the UUO model group (P<0.01). However, expression of MCP-1 in
the high-dose group was significantly lower compared with that of
the low-dose group (P<0.01), and that of the fosinopril group,
(P>0.05; Fig. 1, Table I).
 | Table I.Comparison of HGF and MCP-1 expression
in renal tissue of each group (mean ± SD). |
Table I.
Comparison of HGF and MCP-1 expression
in renal tissue of each group (mean ± SD).
| Groups | n | HGF | MCP-1 |
|---|
| Control | 10 | 0.1174±0.0296 | 0.0778±0.0432 |
| Model | 10 | 0.0703±0.0274 | 0.6545±0.0768a |
| High-dose | 10 |
0.1255±0.0283a–d |
0.3473±0.0424a–d |
| Low-dose | 10 |
0.1709±0.0521a,b |
0.4632±0.0156a,b |
| Fosinopril | 10 |
0.2512±0.0659a,b |
0.2797±0.0348a,b |
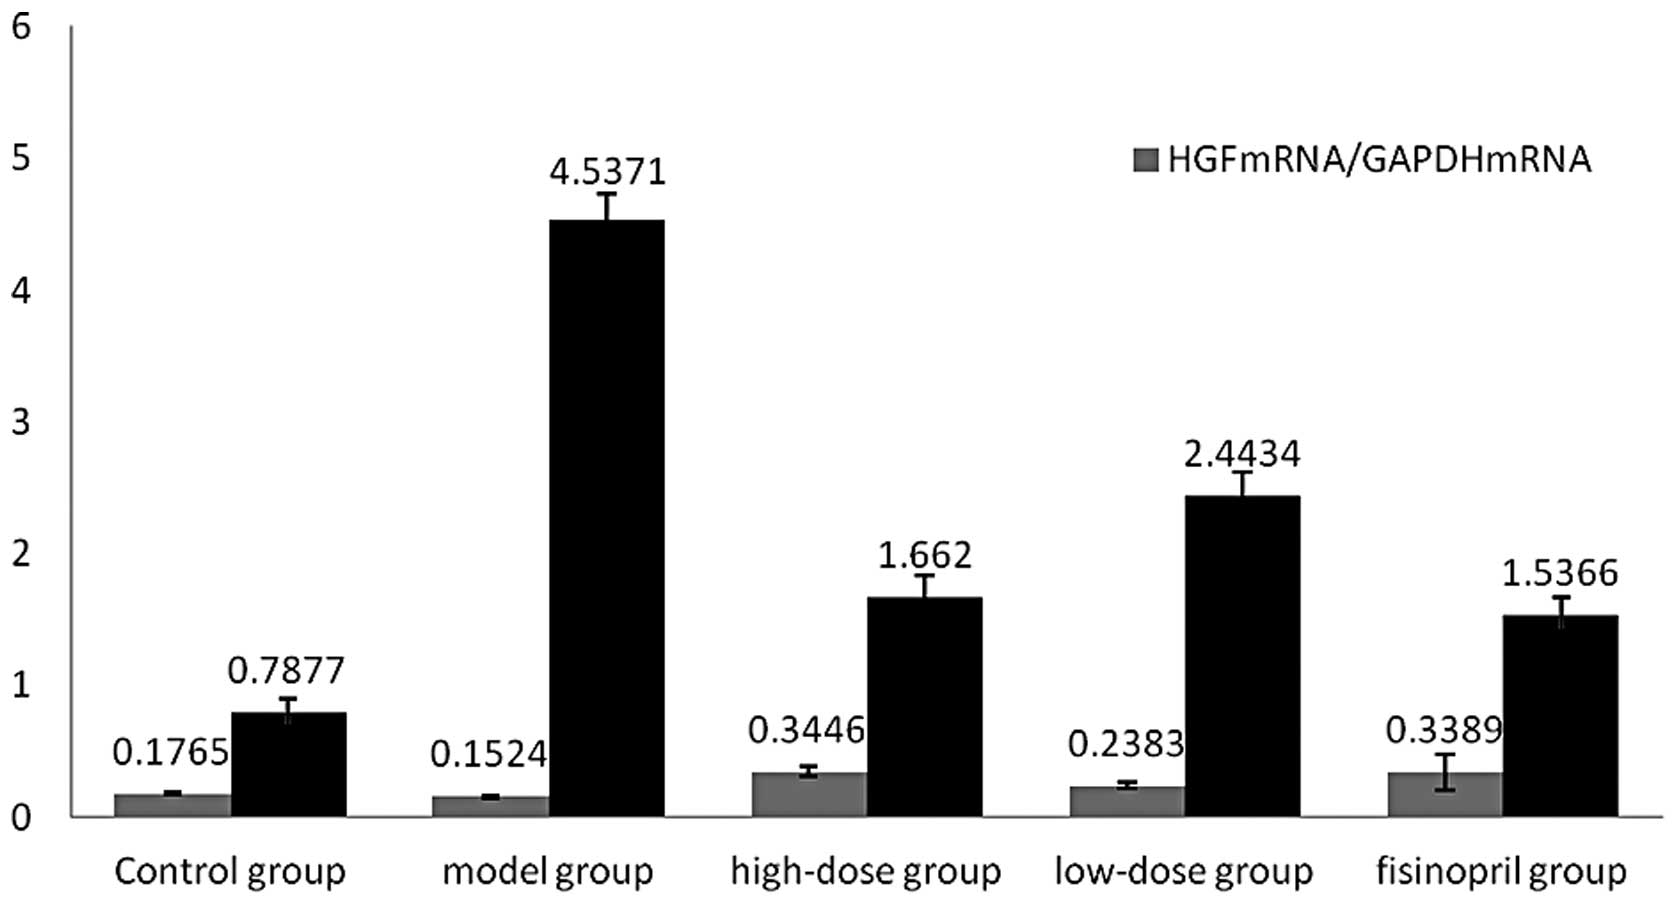
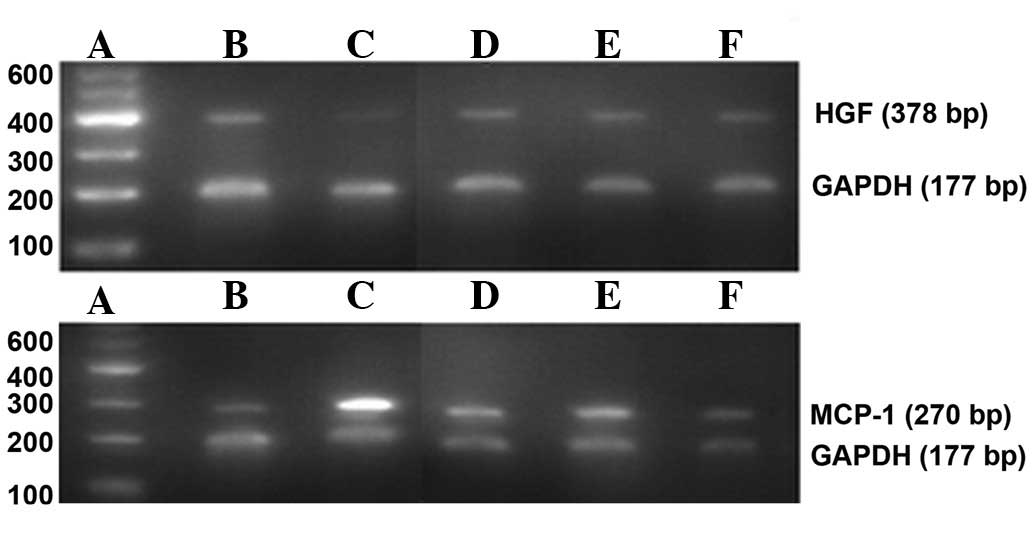
mRNA expression of HGF and MCP-1 in rat
renal tissue
The results of the qPCR demonstrated that mRNA
expression of HGF had significantly increased in the drug
intervention group (P<0.01) compared with that of the control
group. In addition, a low mRNA expression of HGF was indicated in
the model group, whereas mRNA expression was significantly higher
in the high-dose group compared with that of the low-dose group
(P<0.01), and similar to that of the fosinopril group
(P>0.05). The mRNA expression of MCP-1 in renal tissue
significantly increased in the model group compared with that of
the control group which indicated marginal mRNA expression of
MCP-1. Statistical analysis determined that mRNA expression of
MCP-1 in renal tissue on the obstruction side in the drug
intervention group was significantly reduced compared with that of
the UUO model group (P<0.01). Moreover, MCP-1 mRNA expression in
the high-dose group was significantly lower than that of the
low-dose group (P<0.01), but marginally higher than that of the
fosinopril group (P>0.05; Table
II, Figs. 2 and 3).
| Table II.Comparison of HGF and MCP-1 mRNA
expression in renal tissue of each group (mean ± SD). |
Table II.
Comparison of HGF and MCP-1 mRNA
expression in renal tissue of each group (mean ± SD).
| Groups | n | HGF mRNA/GAPDH
mRNA | MCP-1 mRNA/GAPDH
mRNA |
|---|
| Control | 10 | 0.1765±0.0121 | 0.7877±0.1059 |
| Model | 9 | 0.1524±0.0088 | 4.5371±0.3158a |
| High-dose | 9 |
0.2292±0.0215a,b |
2.3954±0.1792a–d |
| Low-dose | 10 |
0.1986±0.0149a,b |
2.9647±0.1476a,b |
| Fosinopril | 10 |
0.3389±0.1340a,b |
1.5336±0.1340a,b |
Biochemical index changes
The blood urea nitrogen (BUN) levels significantly
increased in the model group and a change in the level of BUN was
evident in the drug intervention group. The BUN level was
significantly lower in the low-dose group (P<0.05) as well as
the high-dose and fosinopril groups (P<0.01), compared with that
of the control group. An increase in BUN levels in the control
group was indicated; however, it was the smallest increase among
all the groups. The level of serum creatinine (Scr) was in a normal
range for all the rats, and the changes of aspartate
aminotransferase (AST) and alanine aminotranferase (ALT) levels
were not significant among the groups (P>0.05; Table III).
| Table III.Comparison of biochemical indexes of
rats in each group (mean ± SD). |
Table III.
Comparison of biochemical indexes of
rats in each group (mean ± SD).
| Groups | n | BUN | Scr | AST | ALT |
|---|
| Control | 10 | 6.48±0.53a | 51.48±2.51 | 124.14±19.10 | 29.23±3.02 |
| Model | 10 | 12.51±1.34 | 61.75±2.85 | 125.61±13.98 | 29.42±5.29 |
| High-dose | 10 | 9.27±0.64a | 58.16±1.37 | 130.83±10.79 | 30.55±4.73 |
| Low-dose | 10 | 9.89±0.99b | 59.91±1.14 | 126.28±15.00 | 29.59±5.65 |
| Fosinopril | 10 | 7.89±0.75a | 51.00±1.96 | 130.44±16.04 | 30.27±4.64 |
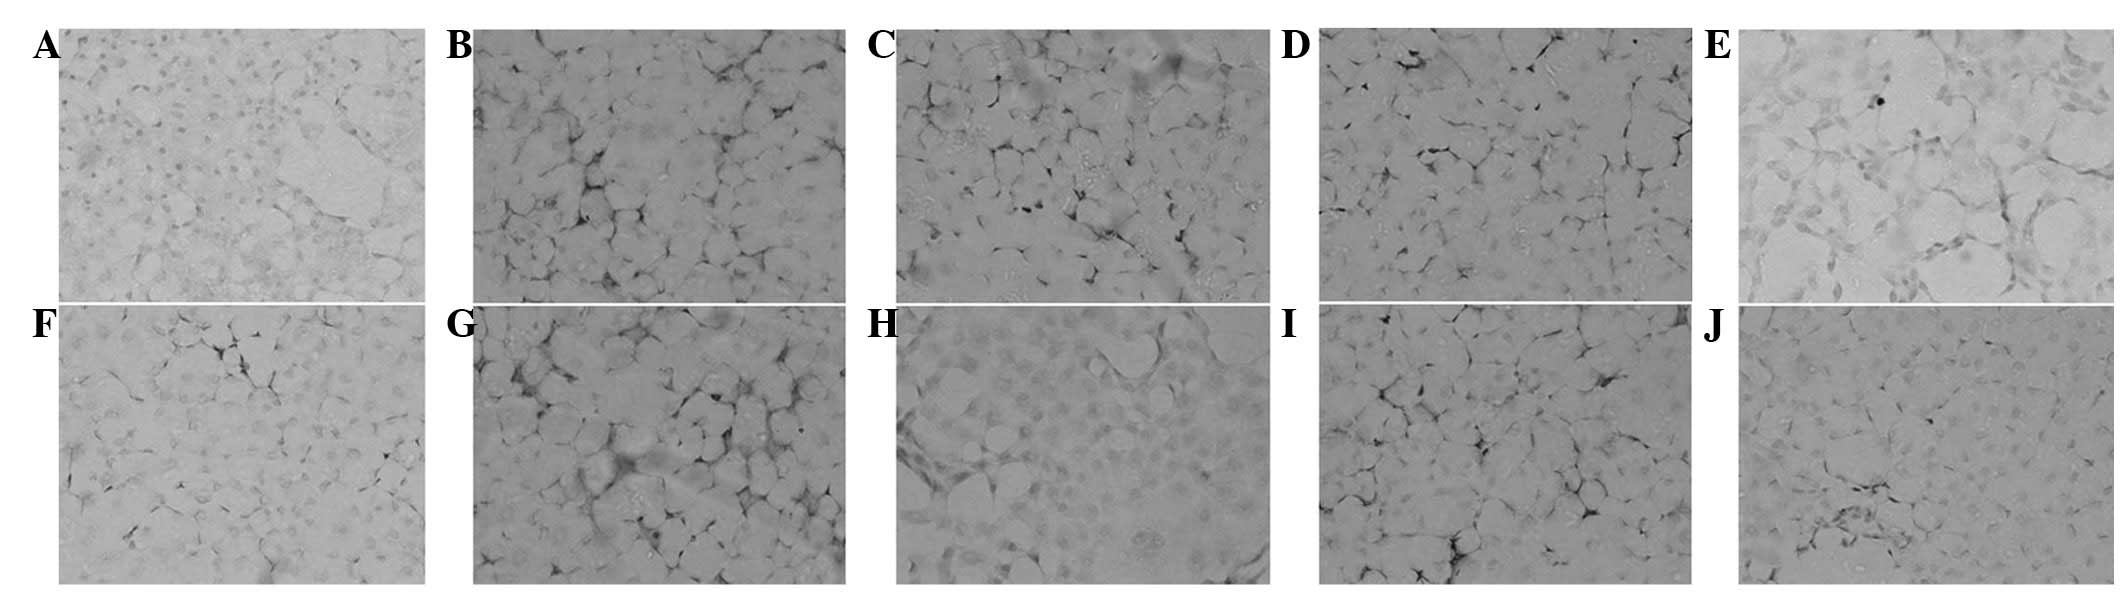
HGF and MCP-1 expression induced by
TGF-β1 in NRK52E cells by ICC
ICC demonstrated a marginal expression of HGF in the
control group. In the TGF-β1 group the expression of HGF was mainly
located in the cytoplasm of NRK52E cells. In the drug intervention
group, the expression of HGF had significantly increased compared
with that of the control group (P<0.01). Additionally, the
expression of HGF in the high-dose group was significantly higher
than that of the low-dose group (P<0.01); but similar to that of
the fosinopril group (P>0.05). ICC determined the expression of
MCP-1 which was indicated in cells with brown cytoplasm. Marginal
expression of MCP-1 was identified in the control group. However, a
higher expression was indicated in the TGF-β1 stimulation group as
the cells characterized by brown cytoplasm (shown as darker
staining) transformed into fibroblasts. The expression of MCP-1 in
the high-dose group was significantly lower than that of the
low-dose group (P<0.01), and marginally lower than that of the
fosinopril group (P>0.05; Table
IV, Fig. 4).
| Table IV.Comparison of HGF and MCP-1
expression in the cells of each group (mean ± SD). |
Table IV.
Comparison of HGF and MCP-1
expression in the cells of each group (mean ± SD).
| Group | n | HGF | MCP-1 |
|---|
| Control | 10 | 63.903±0.0296 |
48.026±1.524a |
| TGF-β1 | 10 | 35.605±1.0910 | 146.177±3.694 |
| High-dose | 10 |
117.575±4.1940a–d |
77.817±5.292a–d |
| Low-dose | 10 |
141.140±3.6910a,b |
65.115±3.179a,b |
| Fosinopril | 10 |
184.467±3.2900a,b |
58.221±3.726a,b |
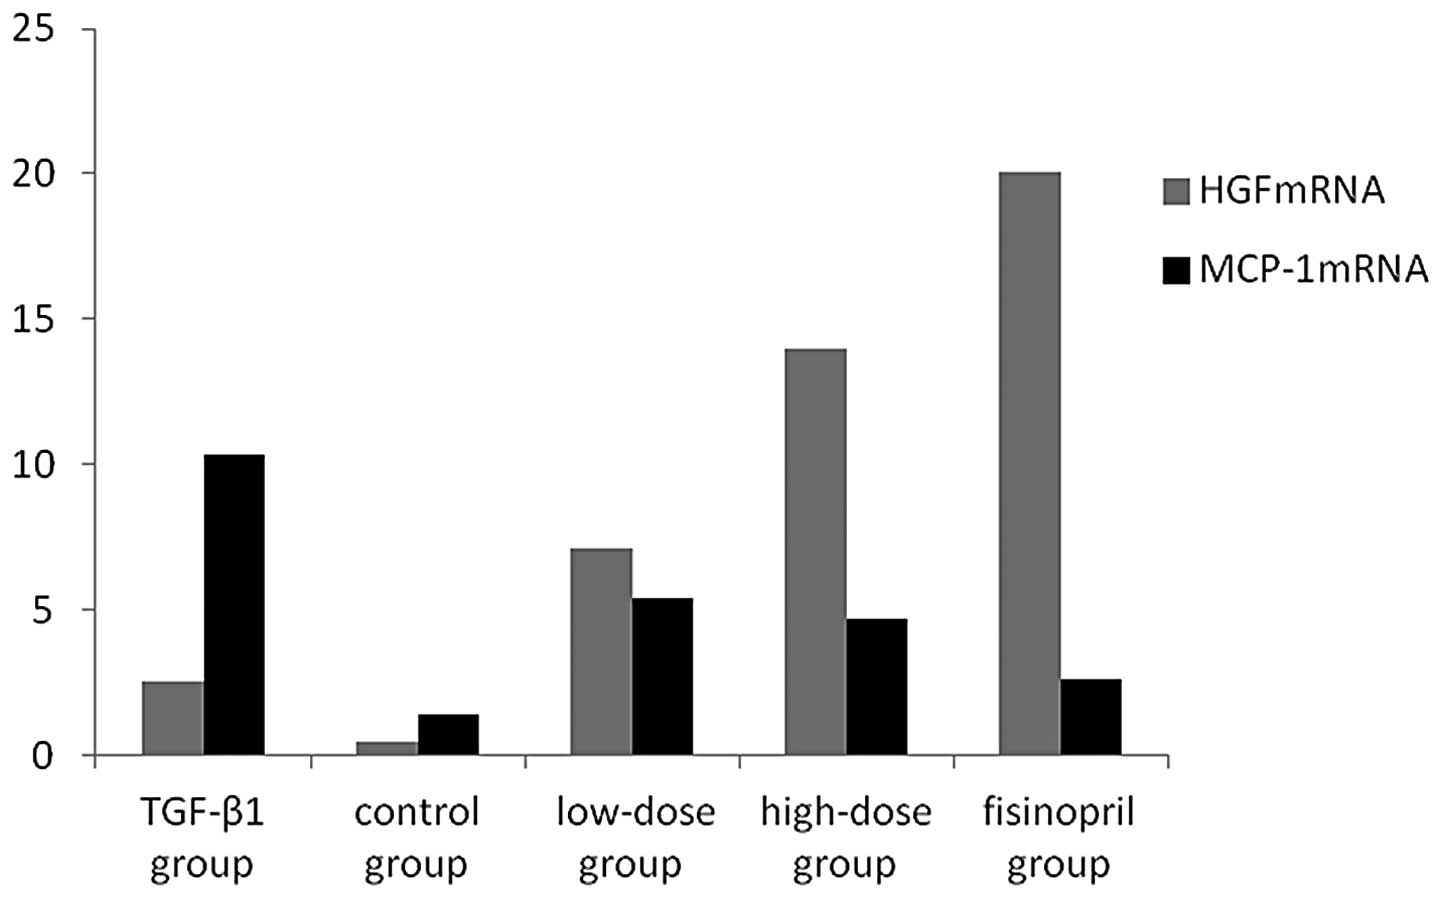
HGF and MCP-1 mRNA expression by FQ
qPCR
FQ qPCR indicated marginal mRNA expression of HGF in
the control group. Administration of high- and low-doses of herba
centellae may have promoted NRK52E cells to stimulate TGF-β1, which
subsequently induced mRNA expression of HGF. The mRNA expression of
HGF in the high-dose group was significantly higher than that of
the low-dose group (P<0.05), and similar to that of the
fosinopril group (P>0.05). The mRNA expression of MCP-1 was
significantly higher in the TGF-β1 stimulation group compared with
that of the drug intervention groups (P<0.01), in a
dose-dependent manner. FQ qPCR determined no significant
differences between the high-dose group and the fosinopril group
(P>0.05, Figs. 5 and 6, Table
V).
| Table V.Comparison of HGF and MCP-1 mRNA
expression in the cells of each group (mean ± SD). |
Table V.
Comparison of HGF and MCP-1 mRNA
expression in the cells of each group (mean ± SD).
| Groups | n | HGF mRNA/GAPDH
mRNA | MCP-1 mRNA/GAPDH
mRNA |
|---|
| Control | 10 |
0.4760±0.135b | 1.357±0.594 |
|
TGF-β1 | 10 |
2.4975±0.826a |
10.314±0.931a |
| High-dose | 10 |
13.9810±1.584a–c |
4.712±0.821a–d |
| Low-dose | 10 |
7.1250±1.038a,b |
5.367±1.187a,b |
| Fosinopril | 10 |
20.0910±2.0138a,b |
2.631±0.835a,b |
Discussion
TIF is a tubular injury resulting from inflammatory
cell infiltration, fibroblast proliferation, and conversion to
fibrocytes which are caused by a variety of kidney damage factors
(11). Progressive and
irreversible renal damage is the result of TIF. Bohle et al
(12) demonstrated that renal
failure was closely correlated with TIF, which was an etiological
factor-independent process. Studies worldwide have achieved great
progress in investigating TIF. TIF is characterized by fibroblast
proliferation and excess of the ECM including collagen I, II, III,
IV, fibronectin and laminin, which accumulates in the renal
interstitium. A previous theory was that fibrosis could not be
reversed. However, a large number of experiments have indicated
that fibrosis may be reversed at a certain stage. Therefore, the
prevention and delay of TIF initiation and development, is one of
the predominant measures for retarding the deterioration of renal
function. However, the mechanism of TIF has yet to be fully
understood. A previous study (13)
demonstrated that the mechanism of TIF may include
transdifferentiation of renal tubular epithelial cells (TEC). It
demonstrated that TEC may transdifferentiate into myofibroblasts
which, subsequently promoted fibrosis formation by EMC synthesis.
In addition, the study showed that cytokines and growth factors are
important for TIF initiation and development. The growth factors
[TGF-β, connective tissue growth factor (CTGF), platelet-derived
growth factor (PDGF)], MCP-1, Angiotensin II (Ang II) and
endothelin-1 (ET-1) promote TIF initiation, and TGF-β was
identified as the most important promoter. Furthermore,
interferon-γ (IFN-γ), HGF, bone morphogenetic protein-7 (BMP-7) and
decorin demonstrated the ability to delay TIF initiation. Moreover,
the study showed there is monocyte/macrophage infiltration in the
renal interstitium at the early stages of TIF in animal models and
in a clinical setting. Active monocyte/macrophage infiltration is
an important TIF-promoting factor. Zeisberg et al determined
that cell proliferation and apoptosis included fibroblast
proliferation and TEC apoptosis. Additionally, TIF mechanisms may
include dysfunction of the EMC hydrolase system (13).
Renal damages induced by UUO include atrophy and
apoptosis of renal tubule cells, and TIF and mild pathologic
changes of the glomerulus, which is considered an ideal TIF model.
TIF is a common result of chronic and persistent renal diseases and
is the main pathological feature of end stage renal disease (ESRD).
ESRD is characterized by the degeneration, atrophy and
disappearance of TEC, the infiltration of renal interstitial
lymphatic mononuclear cells and excessive accumulation of the ECM
(14). The pathogenesis of TIF has
not been completely understood, but studies have shown that the
degree of renal tubulointerstitial damage was positively correlated
with renal function, and a prognosis may be determined when
compared with the glomerulus. Therefore, pathological changes of
TIF are a significant index to determine the degree of reduced
renal function and a prognosis of the disease.
HGF, a TIF-inhibiting pleiotropic and polypeptide
cytokine, may block the TGF-β1/Smad signaling pathway by
suppressing the expression of TGF-β1, and in turn reduce the levels
of CTGF (15). HGF may prevent the
epithelial mesenchymal transition (EMT) of kidney tubules induced
by TGF-β1, reverse the phenotypic transformation caused by TGF-β1,
restart the expression of E-cadherin, inhibit the expression of the
marker of interstitial fibrosis α-SMA, and restore the expression
of vimentin and fibronectin (16).
HGF has a potent antifibrotic effect. In many animal models with
TIF, injection of exogenous recombinant HGF may block the
occurrence of fibrosis, inhibit scar formation, and improve renal
function (17).
Studies have demonstrated that MCP-1 mediate
lysosomes to release and produce oxygen-free radicals, thus
promoting mononuclear macrophages to express TGF-β1. Therefore,
thickening of the glomerular basement membrane and accumulation of
the ECM was aggravated, resulting in glomerulosclerosis and
interstitial fibrosis (18). In
the anti-glomerular basement membrane (GMB) nephritis model,
macrophage infiltration increased in the glomerulus along with
elevated MCP-1 expression, while the macrophages decreased
following anti-MCP-1 antibody treatment (19). An enhanced number of macrophages
and expression of MCP-1 has been determined in the glomerulus and
renal tubulointerstitial of the UUO model (20). In addition to the recruiting
macrophage, MCP-1 may also be important in fibrosis. The present
study demonstrated that MCP-1 may reduce the accumulation of
macrophages in renal tissue and limit renal damage by blocking
MCP-1 expression (9). Ranieri
et al (10) indicated that
MCP-1 may stimulate TCE culture in vitro to express
interleukin-6 (IL-6) and intercellular adhesion molecule-1 (ICAM-1)
in a time- and dose-dependent manner. Furthermore, IL-6 is a
cytokine causing mesangial cell proliferation and TEC atrophy;
therefore, MCP-1 is important for the formation of TIF.
The present study applied herba centellae granules
in a clinical setting for the treatment of chronic kidney disease
(CKD). Herba centellae may reduce proteinuria to some extent, and
improve renal function; however, the mechanism is not clear. The
UUO model and TGF-β1 stimulation experiments in vitro,
indicated that herba centellae may upregulate HGF and its mRNA
expression in rat renal interstitium, and downregulate MCP-1 and
its mRNA expression. Therefore, this delayed the progress of TIF in
a dose-dependent manner, determining that a high drug dose had a
stronger effect on the promotion of HGF and inhibition of MCP-1,
compared with a low drug dose and is similar to that of the
fosinopril group (P>0.05). Both low- or high-doses of herba
centellae may have promoted NRK52E cells to express HGF and its
RNA. The expression in the high-dose group was significantly higher
compared with that of the low-dose group (P<0.05). In addition,
MCP-1 and its mRNA expression in the drug intervention group was
significantly reduced compared with that of the TGF-β1 stimulation
group (P<0.01) in a dose-dependent manner. Moreover, MCP-1 and
its mRNA expression in the high-dose group was similar to that of
the fosinopril group (P>0.05). The in vivo and in
vitro experiment results are consistent with previous
hypotheses, and are in accordance with other relevant studies
(21–23). This study demonstrated that herba
centellae reduced the levels of BUN, to some extent, in UUO rats
without causing a significant change in Scr, ALT and AST
expression. Therefore, this study determined that herba centellae
may inhibit MCP-1 and its mRNA expression through the upregulation
of HGF and its mRNA expression, in order to achieve resistance to
TIF without showing evident hepatorenal toxicity.
Acknowledgements
This study was supported by the
National Natural Science Foundation of the mechanism of Centella
asiatica on tubulointerstitial fibrosis research based on TGF-β
signaling pathway no. 81173409.
References
|
1.
|
Eddy AA: Molecular basis of renal
fibrosis. Pediatr Nephrol. 15:290–301. 2000. View Article : Google Scholar
|
|
2.
|
Klahr S and Morrissey J: Obstructive
nephropathy and renal fibrosis. Am J Physiol Renal Physiol.
283:F861–F875. 2002. View Article : Google Scholar : PubMed/NCBI
|
|
3.
|
Kobayashi E, Sasamura H, Mifune M, et al:
Hepatocyte growth factor regulates proteoglycan synthesis in
interstitial fibroblasts. Kidney Int. 64:1179–1788. 2003.
View Article : Google Scholar : PubMed/NCBI
|
|
4.
|
Iwano M, Plieth D, Danoff TM, Xue C, Okada
H and Neilson EG: Evidence that fibroblasts derive from epithelium
during tissue fibrosis. J Clin lnvest. 11:341–350. 2002. View Article : Google Scholar : PubMed/NCBI
|
|
5.
|
Wada T, Furuichi K, Sakai N, et al: Gene
therapy via blockade of monocyte chemoattractant protein-1 for
renal fibrosis. J Am Soc Nephrol. 15:940–948. 2004. View Article : Google Scholar : PubMed/NCBI
|
|
6.
|
Liu Y: Epithelial to mesenchymal
transition in renal fibrogenesis: pathologic significance,
molecular mechanism, and therapeutic intervention. J Am Soc
Nephrol. 15:1–12. 2004. View Article : Google Scholar
|
|
7.
|
Zhang Z, Wan JY, Luo FL, Li HZ and Zhou
QX: Studies on analgesic effect and mechanism of asiaticoside on
lipopolysaccharide induced hyperalgesia in mice. Clin Pharm J.
43:751–753. 2008.
|
|
8.
|
Liu ZF, Zhao HN and Nie SL: Progress in
the research on the mechanism of the pharmacological effects of
asiaticoside. Guangdong Med J. 30:649–651. 2009.
|
|
9.
|
Dadfar E, Lundahl J and Jacobson SH:
Monocyte adhesion molecule expression in interstitial inflammation
in patients with renal failure. Nephrol Dial Transplant.
19:614–622. 2004. View Article : Google Scholar : PubMed/NCBI
|
|
10.
|
Ranieri E, Gesualdo L, Petrarulo F and
Schena FP: Urinary IL-6/EGF ratio: a useful prognostic marker for
the progression of renal damage in IgA nephropathy. Kidney Int.
50:1990–2001. 1996. View Article : Google Scholar : PubMed/NCBI
|
|
11.
|
Chevalier RL, Forbes MS and Thornhill BA:
Ureteral obstruction as a model of renal interstitial fibrosis and
obstructive nephropathy. Kidney Int. 75:1145–1152. 2009. View Article : Google Scholar : PubMed/NCBI
|
|
12.
|
Bohle A, Müller GA, Wehrmann M,
Mackensen-Haen S and Xiao JC: Pathogenesis of chronic renal failure
in the primary glomerulopathies, renal vasculopathies and chronic
interstitial nephritides. Kidney Int Suppl. 54:S2–S9.
1996.PubMed/NCBI
|
|
13.
|
Zeisberg M, Maeshima Y, Mosterman B and
Kalluri R: Renal fibrosis: extracellular matrix microenvironment
regulates migratory behavior of activated tubular epithelial cells.
Am J Pathol. 160:2001–2008. 2002. View Article : Google Scholar
|
|
14.
|
Okada H and Kalluri R: Cellular and
molecular pathways that lead to progression and regression of renal
fibrogenesis. Curr Mol Med. 5:467–474. 2005. View Article : Google Scholar : PubMed/NCBI
|
|
15.
|
Kroening S, Solomovitch S, Sachs M,
Wullich B and Goppelt-Struebe M: Regulation of connective tissue
growth factor (CTGF) by hepatocyte growth factor in human tubular
epithelial cells. Nephrol Dial Transplant. 24:755–762. 2009.
View Article : Google Scholar : PubMed/NCBI
|
|
16.
|
Yang J, Dai C and Liu Y: A novel mechanism
by which hepatocyte growth factor blocks tubular epithelial to
mesenchymal transition. J Am Soc Nephrol. 16:68–78. 2005.
View Article : Google Scholar : PubMed/NCBI
|
|
17.
|
Yang J, Dai C and Liu Y: Hepatocyte growth
factor suppresses renal interstitial myofibroblast activation and
intercepts Smad signal transduction. Am J Pathol. 163:621–632.
2003. View Article : Google Scholar : PubMed/NCBI
|
|
18.
|
Kaschina E and Unger T: Pathophysiologic
link between atherosclerosis and nephrosclerosis. Cardiorenal
Syndrome. 5:245–253. 2010. View Article : Google Scholar
|
|
19.
|
Panzer U, Thaiss F, Zahner G, et al:
Monocyte chemoattractant protein-1 and osteopontin differentially
regulate monocytes recruitment in experimental glomerulonephritis.
Kidney Int. 59:1762–1769. 2001. View Article : Google Scholar
|
|
20.
|
Huang YY, Xu AP, Zhou SS, Fu JZ and Du H:
Effect of losartan on renal expression of monocyte chemoattractant
protein-1 and transforming growth factor-β(1) in rats after
unilateral ureteral obstruction. J South Med Univ. 31:1405–1410.
2011.
|
|
21.
|
Zhang Z, Zhao L, Wang B, et al: Effects of
Centella asiatica on expression of connective colledge
tissue growth factor in UUO rats. Chin J Integr Tradit Western
Nephrol. 9:118–120. 2008.
|
|
22.
|
Zhang Z, Wang SG, Wang B, et al: Effects
of Centella asiatica Granule on renal tissue in rats with
unilateral ureteral obstruction alpha-smooth muscle actin
expression. Tradit Chin Med Res. 22:15–18. 2009.
|
|
23.
|
Wang LL, Liu PN, Ma JW, et al: Effect of
Centella asiatica granula on TGF-β1-induced expression of
bone morphogenetic protein-7 in renal tubular epithelial cells.
Shandong Med J. 49:13–15. 2009.
|