Introduction
Diabetic nephropathy (DN) is a common microvascular
complication of diabetes mellitus, as well as the leading cause of
renal failure worldwide (1,2). It
occurs in approximately one-third of all patients with diabetes and
is independently correlated with an increased risk of end-stage
renal disease (1,3). The prognosis of DN has been poor due
to diagnosis at an advanced stage and the high rate of recurrence.
Although significant efforts have been made to develop novel
diagnostic and therapeutic approaches, DN remains a severe
condition with high rates of morbidity and mortality (1–3).
Accordingly, the early diagnosis of DN is critical to prevent the
long-term damaging effects of kidney loss in patients with diabetes
(4,5).
The pathogenesis of DN is complex and not fully
understood. It has been demonstrated that a number of metabolic and
hemodynamic perturbations are important in the functional and
structural changes of the kidney in DN, which are associated with
the development and outcomes of the disease (6). Currently, the dysfunction of the
glomerular filtration barrier, which results in increased urinary
albumin excretion (UAE), is considered to be an early sign of DN
(5–7). As DN progresses, gradual increases in
UAE and a decline in renal function may be observed, ultimately
leading to end-stage renal disease (2,8).
Accordingly, microalbuminuria is considered to be an important
prognostic marker for the early detection of DN (5,8–10).
However, it has been shown that many patients with diabetes may
still develop DN, even if their urinary albumin levels are within
the normal range (7,11,12).
Moreover, it has also been suggested that albuminuria is not a good
early marker, since it is only possible to observe microalbuminuria
when significant damage to glomerular function has already occurred
(13). Therefore, more sensitive
and specific biomarkers are required to detect DN at an earlier
stage (5,9).
It has been demonstrated that renal injuries in DN
are particularly heterogeneous and that almost all of the cellular
elements in a diabetic kidney may be affected (4,5,12).
In addition to glomerular dysfunction, tubulointerstitial damage
may also be important in the pathogenesis and progression of DN
(5,9,14,15).
A number of markers of tubular damage have been identified and
there is growing evidence to support the use of these markers as
early predictors of DN (5,14). Neutrophil gelatinase-associated
lipocalin (NGAL) is a member of the lipocalin protein family that
is produced in epithelial cells and neutrophils (16,17).
Previous studies have shown NGAL to be one of the most
significantly upregulated proteins in the kidney tubules following
ischemic injury, indicating that it is a sensitive marker for acute
kidney injury (AKI) (18–20). Interestingly, in a number of
patients with type 1 diabetes mellitus, the urinary NGAL level was
already elevated, irrespective of whether micro- or
macroalbuminuria was apparent, indicating that tubular damage may
occur independently and earlier than glomerular dysfunction
(16,17).
Moreover, a number of studies have suggested that
inflammation is crucial in promoting the development and
progression of DN (5,21,22).
Activated by the metabolic and hemodynamic derangements in the
diabetic kidney, an inflammatory response may occur at a very early
stage of diabetes mellitus (21).
This results in several devastating effects, involving the
dysregulation of different immune and inflammatory cells,
inflammatory cytokines and stress-activated protein kinases
(5,21,23).
Consistent with this, it has been shown that patients with diabetes
who progress to DN exhibit signs of inflammation for years prior to
the onset of the disease. Tumor necrosis factor-α (TNF-α) is a
proinflammatory cytokine that is essential in the regulation of
inflammation, apoptosis and oxidative stress in the kidney
(16,23,24).
A high level of urinary TNF-α is correlated with renal injury and a
disruption of the glomerular permeability barrier in patients with
diabetes. This indicates that TNF-α is causally linked to renal
injury in patients with diabetes and may be used as an early
biomarker for the progression of DN.
Although these observations indicate that elevated
levels of NGAL and TNF-α are implicated in kidney injury, it has
not yet been elucidated whether NGAL and TNF-α are independently
predictive of the onset and progression of DN. Therefore, we
performed a prospective observational study to investigate the
relationship between different biomarkers and to determine the role
of urinary TNF-α and NGAL as predictors of a decline in the
estimated glomerular filtration rate (eGFR) in patients with type 2
diabetes. Specifically, we investigated whether, subsequent to
adjusting for other clinical factors such as albuminuria, TNF-α and
NGAL were able to provide additional prognostic information with
regard to the progression of DN at the early stage.
Materials and methods
Subjects
A total of 201 patients with diabetes (108 males and
93 females) who had been referred to the Department of
Endocrinology of the Shanghai Traditional Chinese Medicine
(TCM)-Integrated Hospital (Shanghai, China) between February 2009
and March 2013 were enrolled in this study. This study was approved
by the institutional review board of Shanghai TCM-Integrated
Hospital, and informed consent was obtained from patients or their
families as appropriate. All patients involved in this study
fulfilled the following inclusion criteria: age >18 years;
initial diagnosis of diabetes at >30 years of age; no sign of
renal disease other than DN; no history of cardiovascular disease,
including stroke, heart disease and arteriosclerosis and no
symptoms of acute inflammatory disease. Patients were stratified
according to urine albumin/urine creatinine (Cr) ratio (u-ACR) into
three groups: normoalbuminuria (<30 mg/g Cr), microalbuminuria
(30–300 mg/g Cr) and macroalbuminuria (>300 mg/g Cr). Baseline
u-ACRs levels were consistent in at least two consecutive
measurements in all patients tested. A total of 98 patients took
oral hypoglycemic agents and/or received insulin treatment, while
107 patients took antihypertensive agents.
Age- and gender-matched non-diabetic controls (n=63)
were randomly selected from the Shanghai TCM-Integrated Hospital
for a comprehensive medical check-up. They fulfilled the following
inclusion criteria: normal glucose tolerance [fasting plasma
glucose <6.0 mmol/l and glycated hemoglobin (HbA1c;
A1C) <6%]; normal blood pressure [systolic blood pressure (SBP)
<140 mmHg and diastolic blood pressure (DBP) <90 mmHg]; u-ACR
<30 mg/g Cr; eGFR >60 ml/min/1.73 m2; serum
creatinine <1.2 mg/dl; no prior history of diabetes or of renal
or cardiovascular diseases.
Measurements
Fasting plasma and random spot urine were collected
from subjects at their clinical visits when the anthropometric
measurements were performed. Medical histories were obtained from
direct interview with the patients. Concentrations of laboratorial
variables, such as urinary/serum creatinine and HbA1c,
were measured using conventional laboratory techniques. Urine
aliquots were stored at −80°C prior to being used for measurements
of urinary markers. The urinary concentration of TNF-α was
determined using an enzyme-linked immunosorbent assay (ELISA) with
a Human TNF-α Quantikine ELISA kit (DTA00C; R&D systems,
Minneapolis, MN, USA), while that of NGAL was measured with a Human
NGAL ELISA kit (KIT036; Thermo Fisher Scientific Inc., Rockford,
IL, USA), in accordance with the manufacturer's instructions. The
urine levels of the biomarkers were normalized to the urinary
creatinine concentration to control for variations in hydration
status.
The patients with diabetes (n=125) who had an eGFR
of >60 ml/min/1.73 m2 and with normo- or
microalbuminuria were subsequently followed-up for 28 (25–32)
months with routine measurements of creatinine and UAE. The
Modification of Diet in Renal Disease (MDRD) formula was used to
calculate the eGFR in Chinese people as follows: MDRD = 186 ×
[serum creatinine (mg/dl)]−1.154 × (age in
years)−0.203 × 0.742 (if female) (25). From the follow-up measurements of
eGFR, linear regression was used to calculate the annual changes in
eGFR.
Statistical analysis
Normally distributed data are expressed as the mean
± standard deviation or as a percentage, while non-normally
distributed values are presented as the median (interquartile
range). Logarithm-transformed values of urinary albumin, TNF-α and
NGAL levels were used for analyses due to their skewed
distribution. Variables between different groups were compared
using analysis of variance (ANOVA), followed by Bonferroni's test
for normally distributed values and by the Kruskal-Wallis test for
nonparametric values. Uni- or multivariate linear regression
analyses were used to determine the correlation between urinary
biomarkers and albumin or decline in eGFR, respectively. In
multivariate models, urinary markers were adjusted for progression
promoters, as indicated in each table, or all the clinical
parameters tested. Patients were divided into tertiles based on
levels of TNF-α or NGAL, in order to evaluate the decline in eGFR
in each group. P<0.05 was considered to indicate a statistically
significant difference (two-tailed). Data were analyzed using SPSS
version 15.0 statistical software (SPSS, Inc., Chicago, IL,
USA).
Results
Baseline clinical characteristics
The baseline clinical characteristics of the 63
non-diabetic control and 201 patients with type 2 diabetes,
stratified according to u-ACR levels, are shown in Table I. The control group and different
diabetic groups were well matched with regard to age, gender and
body mass index (BMI). Patients diagnosed with microalbuminuria and
macroalbuminuria were more likely to have greater SBP and a longer
duration of diabetes. As expected, higher levels of
HbA1c were observed in diabetic groups than the control.
However, no significant differences were observed with regard to
total cholesterol (TCHOL), low-density lipoprotein (LDL),
high-density lipoprotein (HDL) or triglycerides, except that the
triglyceride levels were significantly higher in the
macroalbuminuria group, while HDL levels were significantly lower
in the normo- and microalbuminuria groups than in the control
group. Notably, eGFR levels were significantly decreased in the
microalbuminuria and macroalbuminuria groups, indicating reduced
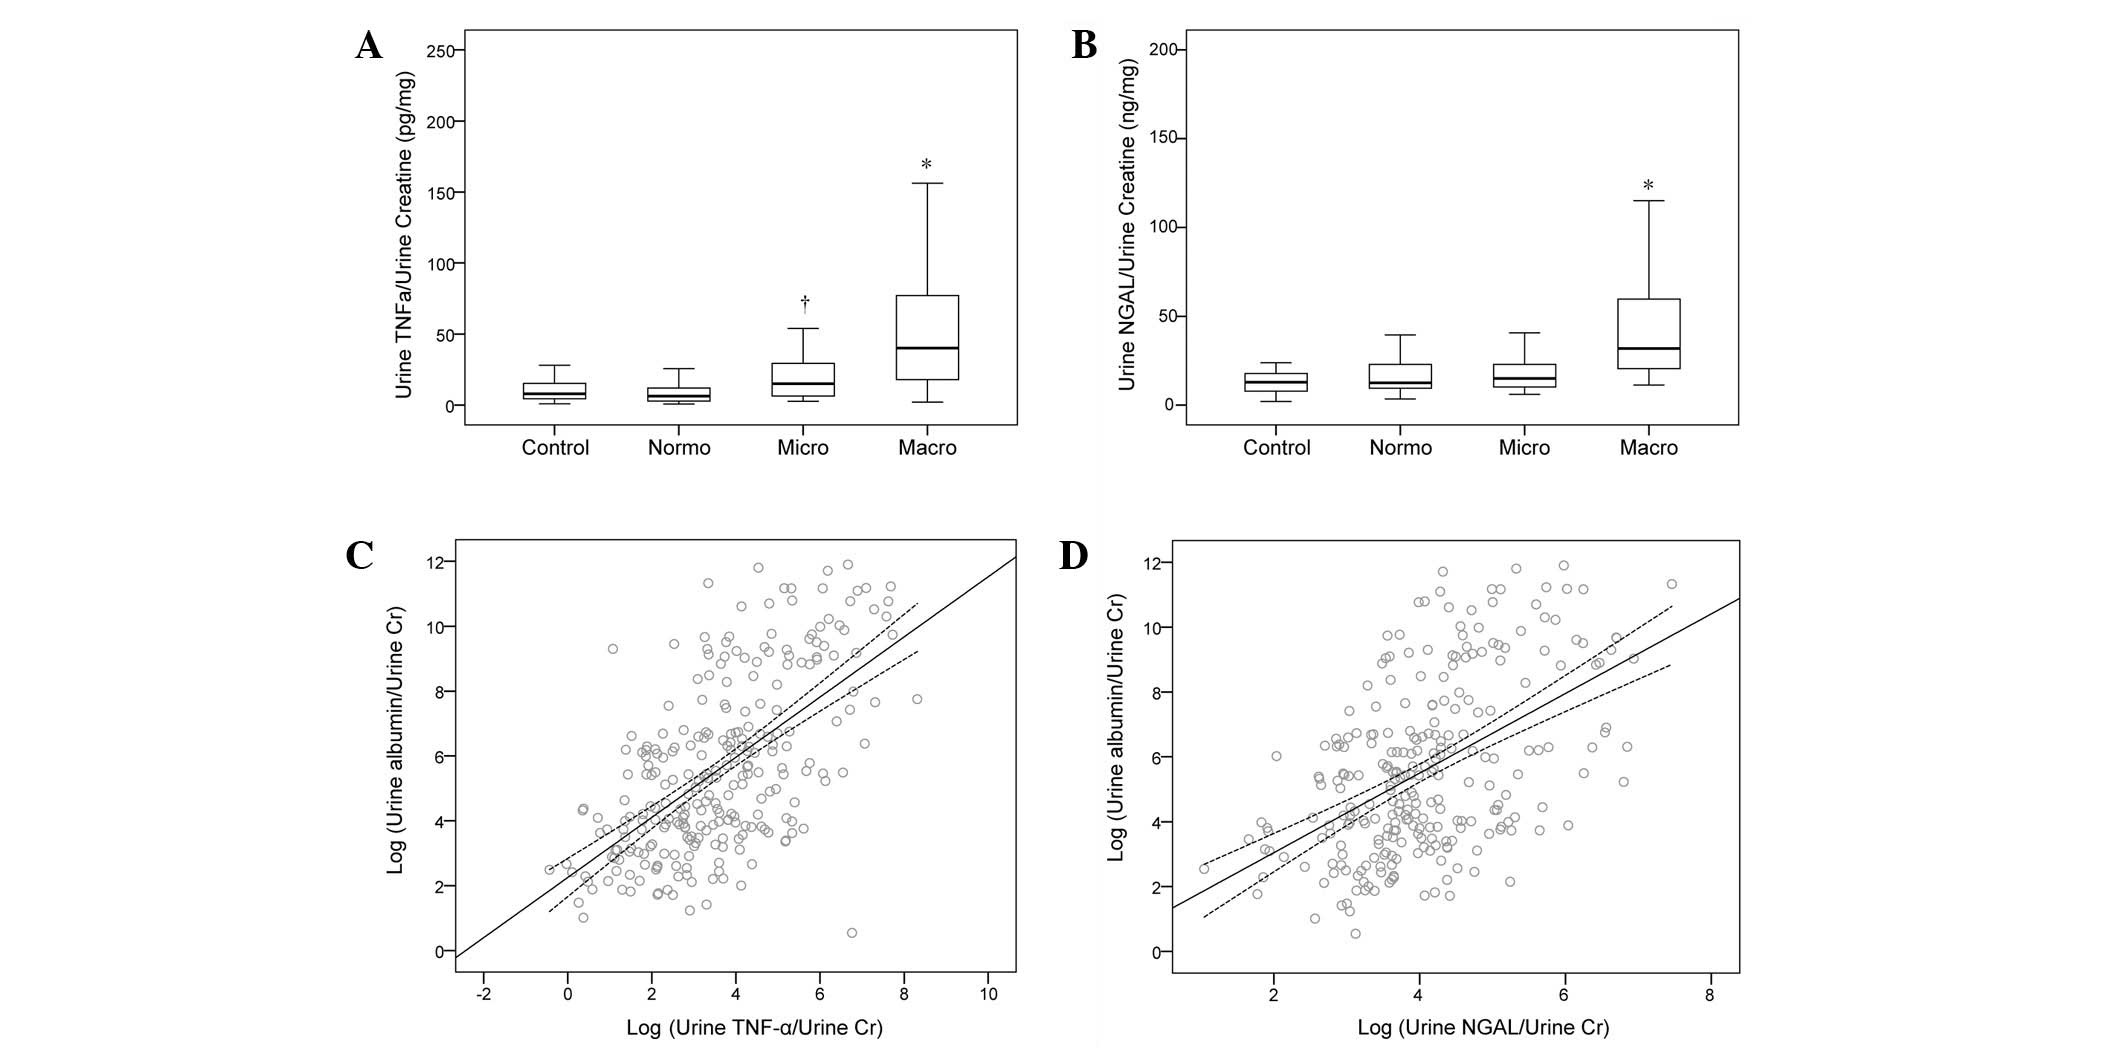
kidney function in these patients. Moreover, urine TNF-α/urine
creatinine (u-TCR) levels were significantly elevated in the macro-
and microalbuminuria groups compared with those in the
normoalbuminuria and control groups (Fig. 1A). Urine NGAL/urine creatinine
(u-NCR) levels were significantly increased in the macroalbuminuria
group, whereas no significant differences were observed between the
normoalbuminuria, microalbuminuria and control groups (Fig. 1B). In addition, it was observed
that hypoglycemic and antihypertensive agents were more widely used
in the micro- and macroalbuminuria groups.
 | Table IBaseline characteristics of controls
and patients with type 2 diabetes, stratified according to
albuminuria status. |
Table I
Baseline characteristics of controls
and patients with type 2 diabetes, stratified according to
albuminuria status.
| Characteristic | Control | Normoalbuminuria | Microalbuminuria | Macroalbuminuria | P-value |
|---|
| No. of patients | 63 | 77 | 72 | 52 | |
| Age (years) | 61.95±9.98 | 60.27±11.87 | 62.25±10.99 | 63.63±11.88 | 0.409 |
| Gender
(male/female) | 29/34 | 43/34 | 42/30 | 23/29 | 0.093 |
| BMI
(kg/m2) | 23.04±3.81 | 23.65±3.78 | 23.35±4.17 | 22.04±4.15d | 0.143 |
| Duration of
diabetes (years) | - | 5.25±5.31 | 7.07±4.13d | 8.94±3.87d,f | 0.003 |
| SBP (mmHg) | 119.35±9.15 | 122.32±16.52 | 125.43±9.84b |
126.33±12.10b | 0.011 |
| DBP (mmHg) | 74.76±8.89 | 78.33±10.88 | 77.54±8.02 | 80.46±9.41b | 0.013 |
| HbA1c
(%) | 6.05±2.27 | 7.01±1.89c | 7.42±2.46c | 7.61±2.42c | <0.001 |
| TCHOL | 201.65±25.94 | 190.87±48.17 | 191.24±48.17 | 200.48±47.34 | 0.246 |
| Triglyceride
(mg/dl)a | 123.3
(87.8–159.9) | 131.2
(91.2–187.5) | 138.3
(109.7–173.4) | 141.9
(105.1–189.8)b | 0.358 |
| LDL (mg/dl) | 116.43±27.97 | 113.92±41.53 | 110.45±28.64 | 115.27±42.41 | 0.605 |
| HDL (mg/dl) | 59.06±20.41 | 48.5±16.23b | 50.83±14.96b | 53.91±17.42 | 0.053 |
| eGFR (ml/min/1.73
m2) | 97.31±19.95 | 90.36±17.5b | 89.67±16.47c | 73.82±18.09c,e,f | <0.001 |
| u-ACR
(ng/mg)a | 15.1
(8.9–25.7) | 11.3
(5.9–17.1) | 73.5
(45.8–103.4)c,e | 729.1
(545.5–1703.1)c,e,g | <0.001 |
| u-TCR
(pg/mg)a | 8.04
(4.38–15.74) | 6.21
(2.82–12.12) | 15.09
(6.29–29.31)b,e | 40.42
(18.47–77.18)c,e,g | <0.001 |
| u-NCR
(ng/mg)a | 12.82
(6.52–19.62) | 12.54
(8.08–27.61) | 14.99
(8.7–25.88)b | 32.03
(21.11–63.71)c,e,g | <0.001 |
| Hypoglycemic
agents, n (%) | - | 23 (29.9) | 46 (63.9)e | 29 (55.8)e | <0.001 |
| Antihypertensive
agents, n (%) | - | 15 (19.5) | 58 (80.6)e | 34 (65.4)e | <0.001 |
TNF-α and NGAL are independently
correlated with albuminuria in patients with type 2 diabetes
A multivariable linear regression analysis was
performed to investigate the correlation between u-ACR and
different markers, with u-ACR as a dependent variable. It was
observed that high levels of u-TCR and u-NCR were significantly
correlated with u-ACR (β=0.628, P<0.001; β=0.493, P<0.001,
respectively) even after adjusting for variables known to be
associated with high u-ACR (β=0.526, P<0.001; β=0.382,
P<0.001, respectively) or for all clinical parameters tested
(β=0.482, P<0.001; β=0.339, P<0.001, respectively; Table II). In addition, consistent with
previous studies, it was observed that the duration of diabetes,
baseline eGFR and HbA1c were independently correlated
with u-ACR under different models (Table II). No significant correlation was
observed between SBP and u-ACR, which was most likely due to the
frequent use of antihypertensive agents. These results revealed
that urinary TNF-α and NGAL levels were elevated and independently
correlated with albuminuria status, indicating that they had the
potential to be used as DN markers.
| Table IIMultiple linear regression analyses
of u-ACR as a dependent variable in patients with type 2
diabetes. |
Table II
Multiple linear regression analyses
of u-ACR as a dependent variable in patients with type 2
diabetes.
| u-TCR | u-NCR |
|---|
|
|
|
|---|
| Variable | Model 1 | Model 2 | Model 3 | Model 1 | Model 2 | Model 3 |
|---|
| Marker | 0.628
(<0.001) | 0.526
(<0.001) | 0.482
(<0.001) | 0.493
(<0.001) | 0.382
(<0.001) | 0.339
(<0.001) |
| Age | | 0.001 (0.980) | 0.078 (0.938) | | 0.017 (0.768) | 0.025 (0.666) |
| Duration | | 0.198
(<0.001) | 0.182
(<0.001) | | 0.205
(<0.001) | 0.187 (0.002) |
|
HbA1c | | 0.092 (0.076) | 0.081 (0.122) | | 0.146 (0.011) | 0.122 (0.031) |
| eGFR | | −0.251
(<0.001) | −0.241
(<0.001) | | −0.274
(<0.001) | −0.246
(<0.001) |
| SBP | | −0.013 (0.808) | −0.017 (0.767) | | 0.032 (0.576) | −0.03 (0.633) |
| DBP | | | 0.039 (0.541) | | | 0.114 (0.095) |
| Gender | | | 0.019 (0.711) | | | 0.005 (0.93) |
| BMI | | | −0.087 (0.107) | | | −0.13 (0.027) |
| TCHOL | | | 0.027 (0.653) | | | 0.014 (0.827) |
| Triglyceride | | | −0.021 (0.741) | | | 0.065 (0.315) |
| LDL | | | - | | | - |
| HDL | | | −0.014 (0.831) | | | 0.007 (0.919) |
| Hypoglycemic
agents | | | 0.090 (0.086) | | | 0.045 (0.426) |
| Antihypertensive
agents | | | 0.126 (0.024) | | | 0.154 (0.013) |
High TNF-α and NGAL levels are correlated
with a greater decline in eGFR
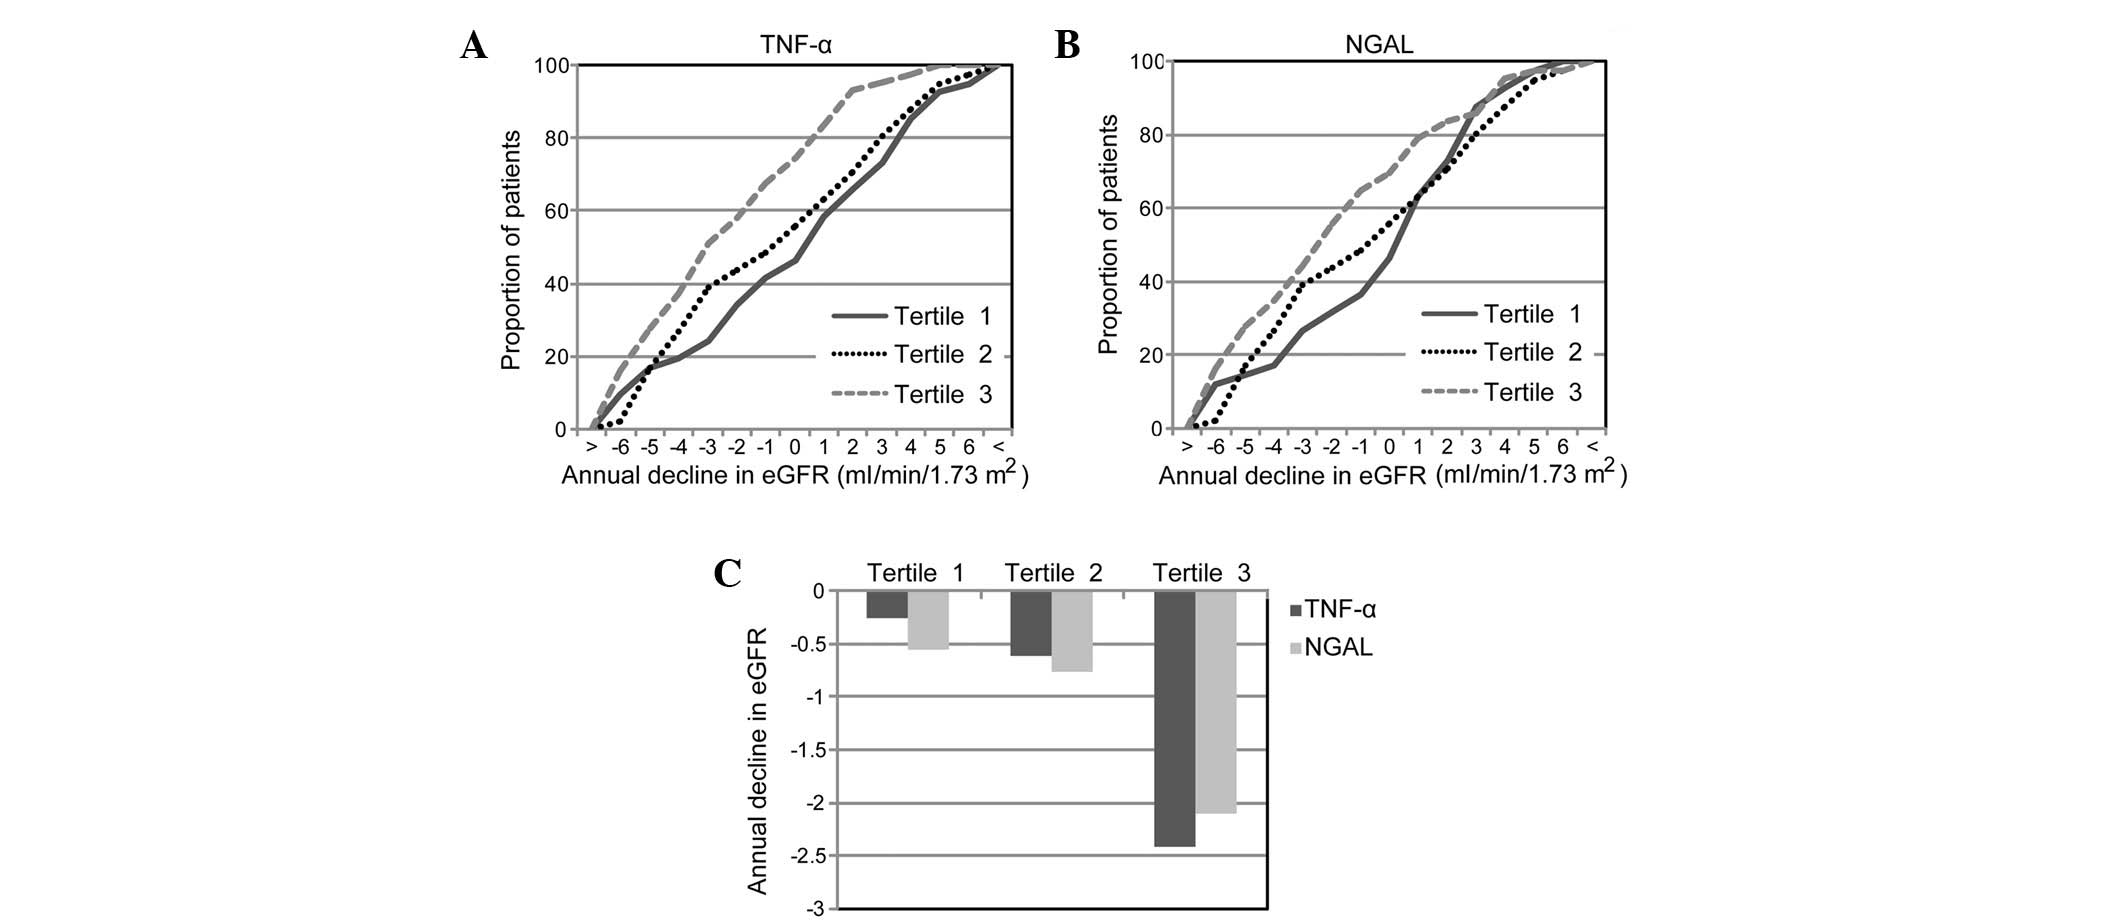
A decline in the eGFR was commonly observed and
closely correlated with the progression of DN in patients with type
2 diabetes. To investigate the predictive value of u-TCR and u-NCR
for DN progression at an early stage, 125 patients with diabetes
with no signs of severe renal damage (eGFR >60 ml/min/1.73
m2 with normo/microalbuminuria) were followed up for 28
(25–32) months. During the follow-up, a
median annual decline in eGFR of −1.03 ml/min/1.73 m2
was observed. Notably, it was identified that patients with u-TCR
in the highest tertile were more likely to have a faster decline in
eGFR than patients in the lowest tertile (−2.42 vs. −0.26, P=0.008,
Students' t-test) or in the middle tertile (−2.42 vs. −0.62,
P=0.016, Students' t-test), whereas no significant difference was
observed between the middle and lowest tertiles (−0.62 vs. −0.32,
P=0.617, Students' t-test) (Fig. 2A
and C). Compared with the expected occurrence due to chance,
patients with a u-NGAL in the highest tertile were more likely to
have a greater decline in eGFR than patients in the lowest tertile
(−2.11 vs. −0.55, P=0.056, Students' t-test). However, no
significant difference was observed between patients in the highest
and middle tertiles (−2.11 vs. −0.76, P=0.118, Students' t-test) or
between the middle and lowest tertiles (−0.76 vs. −0.55, P=0.611,
Students' t-test). These results indicate that high levels of
baseline u-TCR and u-NCR were correlated with a rapid decline in
eGFR in patients with diabetes.
TNF-α levels are independently predictive
of a decline in eGFR
It has been demonstrated that albuminuria is one of
the strongest predictors of eGFR decline during the development of
DN (6,10). Therefore, it was important to test
whether TNF-α and NGAL were able to provide additional prognostic
information concerning DN after controlling for the influence of
albuminuria and other risk factors. Thus, we performed a
multivariable linear regression analysis, with annual decline in
eGFR as a dependent variable (Table
III). It was observed that u-TCR (β=0.302, P<0.001) and
u-NCR (β=−0.213, P=0.017) alone were significantly correlated with
a decline in the eGFR (Table
III). Subsequent to adjusting for known progression promoters,
such as albuminuria, age and HbA1c, increased u-TCR
levels remained significantly correlated with a rapid decline in
eGFR (β=−0.212, P=0.024). By contrast, the influence of u-NCR was
not independent of other progression promoters (β=−0.113, P=0.219).
Similar results were observed even if adjustments were made for all
clinical parameters tested (u-TCR, β=−0.256, P=0.012; u-NCR,
β=−0.099, P=0.301). These results are consistent with prior
observations that TNF-α is important in the promotion of renal
injury and the disruption of the glomerular permeability barrier.
Accordingly, changes in TNF-α level may precede the development of
microalbuminuria in at least a subset of patients. It was thus
suggested that TNF-α was a sensitive, independent predictor for the
early stage of DN.
| Table IIIMultiple linear regression analyses
of the annual decline in eGFR as a dependent variable in patients
with type 2 diabetes. |
Table III
Multiple linear regression analyses
of the annual decline in eGFR as a dependent variable in patients
with type 2 diabetes.
| u-TCR | u-NCR |
|---|
|
|
|
|---|
| Variable | Model 1 | Model 2 | Model 3 | Model 1 | Model 2 | Model 3 |
|---|
| Markers | −0.302
(<0.001) | −0.212 (0.024) | −0.256 (0.012) | −0.213 (0.017) | −0.113 (0.219) | −0.099 (0.301) |
| u-ACR | | −0.228 (0.017) | −0.243 (0.017) | | −0.274 (0.004) | −0.295 (0.004) |
| Age | | −0.05 (0.57) | −0.066 (0.482) | | −0.036 (0.688) | −0.066 (0.494) |
| Duration of
diabetes | | 0.035 (0.691) | 0.02 (0.827) | | 0.024 (0.788) | −0.006 (0.947) |
|
HbA1c | | −0.058 (0.507) | −0.049 (0.581) | | −0.078 (0.375) | −0.065 (0.474) |
| eGFR | | 0.128 (0.143) | 0.13 (0.14) | | 0.105 (0.239) | 0.104 (0.246) |
| SBP | | 0.025 (0.769) | −0.03 (0.777) | | 0.02 (0.825) | −0.004 (0.97) |
| DBP | | | 0.111 (0.363) | | | 0.032 (0.792) |
| Gender | | | −0.055 (0.546) | | | −0.018 (0.847) |
| BMI | | | −0.158 (0.108) | | | −0.097 (0.329) |
| TCHOL | | | - | | | - |
| Triglyceride | | | −0.035 (0.728) | | | −0.062 (0.548) |
| LDL | | | −0.137 (0.153) | | | −0.164 (0.091) |
| HDL | | | 0.02 (0.848) | | | 0.029 (0.788) |
| Hypoglycemic
agents | | | −0.117 (0.2) | | | −0.098 (0.295) |
| Antihypertensive
agents | | | 0.184 (0.064) | | | 0.125 (0.204) |
Discussion
DN is a heterogeneous disease in which almost every
aspect of the renal structure and function may be disrupted
(1,4,5).
Various mechanisms that lead to the pathological changes in the
diabetic kidney have been proposed and are actively being
investigated. For example, it has been shown that hyperglycemia may
lead to increased oxidative stress and the activation of a number
of inflammatory and apoptotic pathways in the kidney, resulting in
podocyte malfunction and an excessive accumulation of extracellular
matrix in the glomerulus and tubulointerstitium (6,8,10,26,27).
It has also been proposed that high glomerular blood flow is likely
to cause glomerular capillary distention, as well as glomerular and
mesangial cell dysfunction (21,23).
Furthermore, there have been indications that the dysregulation of
signaling cascades involving a number of cytokines and growth
factors, such as protein kinase C (PKC) and transforming growth
factor-β (TGF-β), is also detrimental in glomerular hyperperfusion
and hyperfiltration (5,23,26,27).
Clinically, glomerular injury is considered to be an
early sign of DN and microalbuminuria is a strong predictor of DN
progression (6,10). However, it has increasingly been
suggested that many patients with normoalbuminuria are likely to
develop DN (17), while not all
patients with proteinuria are likely to develop progressive renal
dysfunction (14,16,18).
This indicates that different mechanisms may contribute to the
pathogenesis of the disease. Multiple structural and pathological
changes may occur concurrently and progress at different rates in
the diabetic kidney, leading to the high heterogeneity of the
disease. Accordingly, biomarkers with a high specificity to
different abnormalities are required to predict the onset and
progression of DN in different subsets of patients (13,28).
Recently, a number of potential biomarkers have been identified,
including markers of glomerular injury, tubular injury,
inflammation and oxidative stress (5). However, there remains a requirement
for the sensitivity and specificity of these markers to be compared
with albumin and each other.
In this study, we investigated the correlation of
the urinary inflammatory marker TNF-α and the tubular marker NGAL
with albuminuria as well as their clinical applicability in
predicting a decline in kidney function. Consistent with previous
studies (9,24), it was demonstrated that TNF-α and
NGAL levels were significantly elevated and correlated with the
severity of albuminuria in patients with diabetes. During the
follow-up, it was observed that albuminuria was the strongest
independent predictor for eGFR decline, indicating that glomerular
injury was one of the most important pathological changes in early
DN. Notably, it was revealed that high urinary levels of TNF-α were
significantly correlated with a rapid eGFR decline over time, even
subsequent to adjustment for other progression promoters. By
contrast, the influence of NGAL on eGFR decline was independent of
albuminuria. Highly correlated NGAL and albuminuria levels
indicated that glomerular injury and tubular injury may occur
concurrently in these patients. However, at least in a subset of
patients, kidney inflammation may occur prior to the onset of
microalbuminuria and be causally linked to a decline in kidney
function. This is consistent with previous studies, which suggested
that TNF-α may be important in the pathogenesis of DN by promoting
inflammation, apoptosis and oxidative stress in the diabetic kidney
(23,24).
During the follow-up, five patients (8.3%) with
microalbuminuria progressed to macroalbuminuria. Notably, our
results showed that urinary TNF-α (log transformed TCR) levels were
significantly higher in these patients than in the patients who did
not develop macroalbuminuria (5.42±0.52 vs. 3.64±1.04, P=0.008,
Students' t-test). However, no significant differences were
observed for NGAL (4.05±0.78 vs. 4.02±1.02, P=0.948, Students'
t-test). In the logistic regression analysis, baseline albuminuria
(P=0.129), TNF-α (P=0.135) and NGAL (P=0.803) were not
significantly correlated with macroalbuminuria. Although these
results should be interpreted with caution due to the small sample
size of the patients who progressed to macroalbuminuria, the role
of TNF-α as an early predictor for the development and progression
of DN may still be emphasized. These results were consistent with
inflammation being crucial in promoting the development and
progression of DN (5,21,29).
Advances in the proteomic-based biomarker discovery
approach have greatly facilitated the identification of novel
markers of DN (5,13,30,31).
However, the progression of DN in patients with diabetes is complex
and highly variable between different individuals. Accordingly,
there is still a requirement for the clinical applicability of
these markers to be validated in more longitudinal studies
(1,5). Using a panel of biomarkers
representing different pathological changes, instead of using
albumin alone, appears to be a desirable approach for the early
diagnosis of DN. However, more sensitive assays with high accuracy
and reproducibility are required. A number of novel approaches,
including targeted proteomics [multiple reaction monitoring (MRM)
assay], have been successfully shown to efficiently quantify
multiple biomarkers simultaneously from the same sample with high
accuracy (32). This is likely to
facilitate the diagnosis and treatment of early DN to prevent the
long-term devastating outcomes of renal loss.
In conclusion, our results showed that urinary
levels of the proinflammatory marker TNF-α and the tubular marker
NGAL were elevated and correlated with albuminuria in patients with
type 2 diabetes. Moreover, elevated levels of urinary TNF-α and
NGAL were predictive of a decline in eGFR. Following adjustment for
other progression promoters, a high TNF-α level remained an
independent predictor of a rapid eGFR decline. These results
suggest that TNF-α may be significant in the pathogenesis and
progression of the early stage of DN. An enhanced understanding of
the inflammatory response in the diabetic kidney may be beneficial
to facilitate the identification of novel therapeutic strategies
for the treatment of DN.
Acknowledgements
This study was supported by the Shanghai Basic
Research Foundation Grant 13401905500, the Translational Research
Initiative Grant from Shanghai Hongkou Health Bureau and a
Grant-in-Aid from Shanghai TCM-Integrated Hospital.
References
|
1
|
Gross JL, de Azevedo MJ, Silveiro SP,
Canani LH, Caramori ML and Zelmanovitz T: Diabetic nephropathy:
diagnosis, prevention, and treatment. Diabetes Care. 28:164–176.
2005. View Article : Google Scholar : PubMed/NCBI
|
|
2
|
Rossing P, Rossing K, Gaede P, Pedersen O
and Parving HH: Monitoring kidney function in type 2 diabetic
patients with incipient and overt diabetic nephropathy. Diabetes
Care. 29:1024–1030. 2006. View Article : Google Scholar : PubMed/NCBI
|
|
3
|
American Diabetes Association. Standards
of medical care in diabetes - 2011. Diabetes Care. 34(Suppl 1):
S11–S61. 2011.
|
|
4
|
Choudhury D, Tuncel M and Levi M: Diabetic
nephropathy - a multifaceted target of new therapies. Discov Med.
10:406–415. 2010.PubMed/NCBI
|
|
5
|
Moresco RN, Sangoi MB, De Carvalho JA,
Tatsch E and Bochi GV: Diabetic nephropathy: traditional to
proteomic markers. Clin Chim Acta. 421:17–30. 2013. View Article : Google Scholar : PubMed/NCBI
|
|
6
|
Booya F, Bandarian F, Larijani B, Pajouhi
M, Nooraei M and Lotfi J: Potential risk factors for diabetic
neuropathy: a case control study. BMC Neurol. 5:242005. View Article : Google Scholar : PubMed/NCBI
|
|
7
|
Retnakaran R, Cull CA, Thorne KI, Adler AI
and Holman RR; UKPDS Study Group. Risk factors for renal
dysfunction in type 2 diabetes: U.K. Prospective Diabetes Study 74.
Diabetes. 55:1832–1839. 2006. View Article : Google Scholar : PubMed/NCBI
|
|
8
|
Cohen-Bucay A and Viswanathan G: Urinary
markers of glomerular injury in diabetic nephropathy. Int J
Nephrol. 2012:1469872012. View Article : Google Scholar : PubMed/NCBI
|
|
9
|
Kim SS, Song SH, Kim IJ, et al: Clinical
implication of urinary tubular markers in the early stage of
nephropathy with type 2 diabetic patients. Diabetes Res Clin Pract.
97:251–257. 2012. View Article : Google Scholar : PubMed/NCBI
|
|
10
|
Garg JP and Bakris GL: Microalbuminuria:
marker of vascular dysfunction, risk factor for cardiovascular
disease. Vasc Med. 7:35–43. 2002. View Article : Google Scholar : PubMed/NCBI
|
|
11
|
Cohen MP, Lautenslager GT and Shearman CW:
Increased collagen IV excretion in diabetes. A marker of
compromised filtration function. Diabetes Care. 24:914–918. 2001.
View Article : Google Scholar : PubMed/NCBI
|
|
12
|
Isakova T, Xie H, Yang W, et al:
Fibroblast growth factor 23 and risks of mortality and end-stage
renal disease in patients with chronic kidney disease. JAMA.
305:2432–2439. 2011. View Article : Google Scholar : PubMed/NCBI
|
|
13
|
Barratt J and Topham P: Urine proteomics:
the present and future of measuring urinary protein components in
disease. CMAJ. 177:361–368. 2007. View Article : Google Scholar : PubMed/NCBI
|
|
14
|
Kim SS, Song SH, Kim IJ, et al: Urinary
cystatin C and tubular proteinuria predict progression of diabetic
nephropathy. Diabetes Care. 36:656–661. 2013. View Article : Google Scholar : PubMed/NCBI
|
|
15
|
Han WK, Wagener G, Zhu Y, Wang S and Lee
HT: Urinary biomarkers in the early detection of acute kidney
injury after cardiac surgery. Clin J Am Soc Nephrol. 4:873–882.
2009. View Article : Google Scholar : PubMed/NCBI
|
|
16
|
Nielsen SE, Reinhard H, Zdunek D, et al:
Tubular markers are associated with decline in kidney function in
proteinuric type 2 diabetic patients. Diabetes Res Clin Pract.
97:71–76. 2012. View Article : Google Scholar : PubMed/NCBI
|
|
17
|
Liangos O, Perianayagam MC, Vaidya VS, et
al: Urinary N-acetyl-beta-(D)-glucosaminidase activity and kidney
injury molecule-1 level are associated with adverse outcomes in
acute renal failure. J Am Soc Nephrol. 18:904–912. 2007. View Article : Google Scholar : PubMed/NCBI
|
|
18
|
Bennett M, Dent CL, Ma Q, et al: Urine
NGAL predicts severity of acute kidney injury after cardiac
surgery: a prospective study. Clin J Am Soc Nephrol. 3:665–673.
2008. View Article : Google Scholar : PubMed/NCBI
|
|
19
|
Bazzi C, Petrini C, Rizza V, et al:
Urinary N-acetyl-beta-glucosaminidase excretion is a marker of
tubular cell dysfunction and a predictor of outcome in primary
glomerulonephritis. Nephrol Dial Transplant. 17:1890–1896. 2002.
View Article : Google Scholar : PubMed/NCBI
|
|
20
|
Mori K and Nakao K: Neutrophil
gelatinase-associated lipocalin as the real-time indicator of
active kidney damage. Kidney Int. 71:967–970. 2007. View Article : Google Scholar : PubMed/NCBI
|
|
21
|
Lim AK and Tesch GH: Inflammation in
diabetic nephropathy. Mediators Inflamm. 2012:1461542012.PubMed/NCBI
|
|
22
|
Navarro JF, Mora C, Maca M and Garca J:
Inflammatory parameters are independently associated with urinary
albumin in type 2 diabetes mellitus. Am J Kidney Dis. 42:53–61.
2003. View Article : Google Scholar : PubMed/NCBI
|
|
23
|
Misseri R, Meldrum DR, Dinarello CA, et
al: TNF-alpha mediates obstruction-induced renal tubular cell
apoptosis and proapoptotic signaling. Am J Physiol Renal Physiol.
288:F406–F411. 2005. View Article : Google Scholar : PubMed/NCBI
|
|
24
|
Navarro JF and Mora-Fernández C: The role
of TNF-alpha in diabetic nephropathy: pathogenic and therapeutic
implications. Cytokine Growth Factor Rev. 17:441–450. 2006.
View Article : Google Scholar : PubMed/NCBI
|
|
25
|
Ma YC, Zuo L, Chen JH, et al: Modified
glomerular filtration rate estimating equation for Chinese patients
with chronic kidney disease. J Am Soc Nephrol. 17:2937–2944. 2006.
View Article : Google Scholar : PubMed/NCBI
|
|
26
|
Vaidya VS, Waikar SS, Ferguson MA, et al:
Urinary biomarkers for sensitive and specific detection of acute
kidney injury in humans. Clin Transl Sci. 1:200–208. 2008.
View Article : Google Scholar : PubMed/NCBI
|
|
27
|
Titan SM, Vieira JM Jr, Dominguez WV, et
al: Urinary MCP-1 and RBP: independent predictors of renal outcome
in macroalbuminuric diabetic nephropathy. J Diabetes Complications.
26:546–553. 2012. View Article : Google Scholar : PubMed/NCBI
|
|
28
|
Hong CY, Chia KS and Ling SL: Urinary
protein excretion in Type 2 diabetes with complications. J Diabetes
Complications. 14:259–265. 2000. View Article : Google Scholar : PubMed/NCBI
|
|
29
|
Nakamura A, Shikata K, Hiramatsu M, et al:
Serum interleukin-18 levels are associated with nephropathy and
atherosclerosis in Japanese patients with type 2 diabetes. Diabetes
Care. 28:2890–2895. 2005. View Article : Google Scholar : PubMed/NCBI
|
|
30
|
Deng WJ, Nie S, Dai J, Wu JR and Zeng R:
Proteome, phosphoproteome, and hydroxyproteome of liver
mitochondria in diabetic rats at early pathogenic stages. Mol Cell
Proteomics. 9:100–116. 2010. View Article : Google Scholar : PubMed/NCBI
|
|
31
|
Ben Ameur R, Molina L, Bolvin C, et al:
Proteomic approaches for discovering biomarkers of diabetic
nephropathy. Nephrol Dial Transplant. 25:2866–2875. 2010.PubMed/NCBI
|
|
32
|
Darde VM, Barderas MG and Vivanco F:
Multiple reaction monitoring (MRM) of plasma proteins in
cardiovascular proteomics. Methods Mol Biol. 1000:191–199. 2013.
View Article : Google Scholar : PubMed/NCBI
|