Introduction
Electrocardiogram (ECG) abnormalities are associated
with an increased risk of adverse cardiovascular outcomes,
including high resting heart rate (HR), prolonged PR interval, QRS
duration and QT interval and abnormal shift in electrocardiographic
axes (1). A prospective study has
reported that resting HR has a significant positive association
with cardiovascular and all-cause mortalities (2). A high HR is a strong indicator of
cardiovascular mortality while a low HR is associated with an
improved outcome (3). Prolonged PR
interval has been associated with an increased risk of heart
failure (HF), incident atrial fibrillation (AF), pacemaker
implantation and mortality in the Framingham Heart Study (4,5).
Prolonged PR interval is also correlated with endothelial
dysfunction and activation of vascular repair, which may be a cause
for adverse cardiovascular outcomes (6). QRS duration prolongation is a
potential marker of cardiac structural and functional
abnormalities, including left ventricular systolic dysfunction,
that may predispose individuals to an increased risk of HF
(7,8). A Framingham follow-up study
demonstrated that healthy individuals with prolonged QRS duration
were at a higher risk of future pacemaker implantation (9). Prolongation of corrected QT (QTc)
interval predicts the risk for development of diabetes mellitus
independently from conventional risk factors (10). It also predicts the risk of sudden
death in patients without evidence of cardiac dysfunction (11). Electrocardiographic axes are also
important markers in cardiovascular prognosis. For example, an
abnormal P-wave axis is predictive of future onset of AF (12) and its verticalization is an
effective electrocardiographic diagnostic tool for emphysema in the
general population (13). Frontal
QRS axis serves as a sign for left ventricular hypertrophy and
bundle branch block. The T axis is a general marker of
repolarization abnormality. A follow-up study on older patients
revealed that T-wave axis deviation is a strong independent risk
indicator of fatal and non-fatal cardiac events (14). Therefore, it is necessary to
investigate factors affecting or causing these electrocardiographic
changes.
Obesity is a strong independent risk factor for
cardiovascular disease mortality and it predisposes patients to
numerous cardiac complications, including hypertension, coronary
heart disease, HF, stroke and sudden death (15,16).
The association between obesity and ECG has been investigated in
previous studies. Obesity is closely associated with a wide variety
of ECG abnormalities, including ischemic ECG observations (17), leftward shifts in
electrocardiographic axes, markers of left ventricular hypertrophy
and flattening of the T wave (18). High resting HR and prolongation of
PR interval and QRS duration are changes in electrocardiographic
intervals induced by obesity (19–21).
A number of these ECG alterations may be reversed through weight
loss, including rightward shift of the mean P-wave, QRS and T-wave
axes (22).
Numerous studies have reported a correlation between
obesity and QTc interval prolongation (20,21);
however, one study showed no correlation between body mass index
(BMI) and QTc interval in a healthy population aged 22–25 years
(23). Similarly, the effect of
obesity on QTc interval in children is also controversial (24,25).
Furthermore, ECG has been associated with age, gender, ethnicity
and blood pressure (26,27). However, the subjects in the
majority of the previous studies were adults while the correlation
between obesity and ECG in children and adolescents has not been
studied in detail on a large-scale. An additional concern is that
waist circumference (WC) and waist-to-height ratio (WHtR), measures
of abdominal fat distribution, are more efficient risk factor
predictors of cardiovascular disease than BMI in children (28). However, there have been no studies
to date concerning the correlations between body fat distribution
and ECG in children and adolescents.
Therefore, in this study, the differences in
electrocardiographic intervals and axes associated with various
degrees of obesity in normotensive and hypertensive children and
adolescents were examined in a large-scale population. The final
aims were to determine the effect of obesity on
electrocardiographic variables besides the aforementioned possible
risk factors and identify the possible association with body fat
distribution in children and adolescents.
Materials and methods
Study protocol
The study protocol and the procedures were approved
by the Ethics Committee of China Medical University (Shenyang,
China) and fully informed consent was obtained from the parents or
legal guardians of all subjects.
Study population
A total of 5,556 Chinese elementary and secondary
school students aged 5–18 years were recruited from 12 rural public
schools using multistage cluster sampling in this cross-sectional
study between July 2010 and January 2011 in Shenyang (China). The
following exclusion criteria and processes were enforced: i) 28
students who had any history of heart diseases, diabetes mellitus,
chronic renal diseases or thyroid diseases were excluded; ii) 91
students who had abnormal ECGs, including atrial rhythm, premature
beat, ventricular tachycardia, pre-excitation wave, right bundle
branch block or apparent first degree atrioventricular block, were
excluded. Therefore, the final study group consisted of 5,437
students (2,952 males and 2,485 females). Clinical data (age,
gender, ethnicity, height, weight, WC and blood pressure) and
standard 12-lead ECG was collected for each participant in this
study.
Anthropometric measurements
Body weight, height and WC measurements were all
performed by well-trained personnel (cardiologists, doctors of
internal medicine and pediatricians) using the standard protocols.
Body weight and height were measured while the participants were
barefoot and in light underclothes, to the nearest 0.1 kg and 0.5
cm, respectively. WC was measured to the nearest 0.5 cm at
umbilicus level following a normal expiration using a non-elastic
tape (29). BMI was calculated
using the following formula: Weight (kg)/height2
(m2). Overweight and obesity were defined by the
recommended BMI cutoff values (through BMI of 25 and 30
kg/m2 at 18 years of age) by the International Obesity
Task Force, according to age and gender (30). The age and gender-specific 90th
percentile WC cutoffs newly developed by the Working Group on
Obesity in China were used to define central obesity (31).
Blood pressure measurements
Blood pressure was measured in all subjects in this
study by well-trained personnel using a mercury sphygmomanometer
and appropriate size cuffs. The subjects were advised to avoid
coffee, tea and exercise for ≥30 min and had rested for ≥5 min
prior to the measurement. Systolic blood pressure (SBP) and
diastolic blood pressure (DBP) were measured twice in the right arm
in the supine position with the arm level with the heart. The
average of the two blood pressure measurements, SBP and DBP, was
used in the analysis. According to the Fourth Report on the
Diagnosis, Evaluation and Treatment of High Blood Pressure in
Children and Adolescents, hypertension was defined as having SBP
and/or DBP levels above the 95th percentile for gender, age and
height (32).
ECG variable measurements
Standard simultaneous 12-lead resting ECGs were
recorded for participants in a supine position at a 1,000-Hz
sampling rate with the use of a PC-based acquisition and analysis
system (CV200 ECG Work Station; Vales and Hills Biomedical Tech.
Ltd., Beijing, China) and stored in a personal computer as separate
files for subsequent processing. All recordings were performed by
well-trained technicians and all digital ECGs were measured and
interpreted on the computer by the same well-trained cardiologist.
Cases with apparent disturbances or lack of one or more leads were
excluded from the study population. In the CV200 ECG Work Station,
temporally aligned superimposed ECG leads, at a magnification of
five-fold for paper speed (125 mm/sec) and four-fold for amplitude
(40 mm/mV), were made available in order to facilitate the
measurement of variables and to validate the onset and end points
of the intervals, in accordance with the American Heart
Association/American College of Cardiology/Heart Rhythm Society
(AHA/ACCF/HRS) recommendations (33). The key points were identified
manually and then the values of intervals and frontal axes were
calculated automatically by the computer. Detailed definitions of
each interval in this study were as follows: HR, calculated by a
computer, average heart beats within 20 sec; PR interval, interval
from the earliest onset of P wave to the earliest onset of QRS
complex among 12 leads; QRS duration, interval from the earliest
onset to the latest offset of QRS complex among 12 leads; QT
interval, interval from the earliest onset of the QRS complex to
the latest offset of the T wave among 12 leads; and QTc interval,
calculated using Bazett’s formula: QTc = QT/(RR
interval)1/2.
Statistical analysis
Continuous variables are expressed as mean ±
standard deviation (SD). Categorical data are presented as
frequencies and percentages. Differences between the groups were
compared using the two-tailed, non-paired Student’s t-test or
one-way analysis of variance for continuous variables, where
appropriate. Comparisons of categorical variables between groups
were performed using the χ2 test. Pearson’s correlation
coefficients were used to explore the correlation between ECG
variables and obesity-associated measurements, including BMI, WC
and WHtR. The linear associations between variables were further
examined using the multivariate linear regression analysis. All
tests of statistical significance were two-sided and P<0.05 was
considered to indicate a statistically significant difference. The
statistical analyses were conducted with SPSS 17.0 (SPSS, Inc.,
Chicago, IL, USA).
Results
Demographic and clinical
characteristics
The final study sample consisted of 5,437
participants (2,952 males and 2,485 females) with a mean age of
10.9±2.7 years. Of the study population, 16.8% were presented as
overweight (male, 18.4%; female, 14.9%) and 7.3% as obese (male,
10.2%; female, 3.9%). Abdominal obesity was found in 502 males
(17.0%) and 339 females (13.6%) with an overall prevalence of
15.5%. The prevalence of abdominal obesity increased significantly
with BMI categories (normal weight, 1.9%; overweight, 43.8%;
obesity, 90.7%).
The baseline characteristics of the participants
enrolled in this study according to BMI category are presented in
Table I. The mean ages among the
three groups were similar. However, the constituent ratio of the
male subjects was significantly higher than those of the female
subjects in the overweight and obese group with the male subject
ratio at 59.5 and 75.6%, respectively. Among the participants, an
increased ratio of Manchu ethnicity and a decreased ratio of Han
ethnicity with BMI categories were also present. Body weight,
height, WC and WHtR were positively associated with the degree of
overall obesity. The mean levels of SBP and DBP in the overweight
or obese groups were significantly higher than the normal weight
group and increased with BMI categories.
 | Table IDemographic, anthropometric and blood
pressure characteristics of the study sample, classified by
BMI. |
Table I
Demographic, anthropometric and blood
pressure characteristics of the study sample, classified by
BMI.
| Variables | Normal weight
(n=4,126) | Overweight
(n=913) | Obese (n=398) | P-value |
|---|
| Age, years | 10.9±2.7 | 10.8±2.7 | 10.7±2.7 | 0.202 |
| Male gender, n
(%) | 2,108 (51.1) | 543 (59.5) | 301 (75.6) | <0.001 |
| Han/Manchu/other
ethnicity, % | 82.1/9.8/8.1 | 80.6/11.0/8.4 | 76.2/15.2/8.6 | 0.033 |
| Weight, kg | 36.7±10.9 | 48.7±14.8 | 61.5±19.5 | <0.001 |
| Height, cm | 143.1±15.1 | 145.5±15.2 | 147.7±16.0 | <0.001 |
| WC, cm | 59.0±7.5 | 70.8±10.1 | 82.8±12.4 | <0.001 |
| WHtR | 0.413±0.035 | 0.486±0.039 | 0.560±0.049 | <0.001 |
| BMI,
kg/m2 | 17.4±2.1 | 22.3±2.6 | 27.3±3.8 | <0.001 |
| SBP, mmHg | 106.8±12.6 | 112.9±14.6 | 119.2±15.3 | <0.001 |
| DBP, mmHg | 65.9±9.7 | 68.7±11.0 | 71.6±10.5 | <0.001 |
| Abdominal obesity,
n (%) | 80 (1.9) | 400 (43.8) | 361 (90.7) | <0.001 |
Differences in ECG variables associated
with overall obesity
The differences in electrocardiographic intervals
and axes among normal weight, overweight and obese groups are
listed in Table II. The mean
levels of variables are presented for various weight groups and
stratified by blood pressure. Compared with the normal weight
group, longer PR interval, wider QRS duration and leftward shift of
frontal QRS axis were apparent in the overweight and obese groups
within normotensive and hypertensive subjects. Obese participants
had a 4.2-msec longer PR interval, 4.0-msec wider QRS duration and
9.6° leftward shift of frontal QRS axis than the normal weight
group within normotensive subjects, while the differences within
hypertension subjects were 4.2 msec, 4.8 msec and 10.0°,
respectively. A higher HR, with an average increase of 3.1
beats/min, existed in the obese group compared with normal weight
within normotensive subjects while the difference among the three
groups within hypertensive subjects was not significant. The
frontal P-wave axis presented a leftward shift trend along with
aggravation of obesity, but the difference was significant only
between obese and normal weight groups within hypertensive
subjects. A significant leftward shift in the frontal T-wave axis
was presented in the overweight and obese groups compared with the
normal weight group within normotensive subjects; while a
significant change was presented only in the obese group within
hypertensive subjects. However, no significant differences were
noted in the QTc interval among the three groups within
normotensive or hypertensive subjects.
| Table IIDifferences in electrocardiographic
intervals and axes among overall weight groups by BMI, stratified
by blood pressure. |
Table II
Differences in electrocardiographic
intervals and axes among overall weight groups by BMI, stratified
by blood pressure.
| Normotension
(n=4,341) | Hypertension
(n=1,096) |
|---|
|
|
|
|---|
| Variables | Normal weight
(n=3,491) | Overweight
(n=641) | Obese (n=209) | P-value | Normal weight
(n=635) | Overweight
(n=272) | Obese (n=189) | P-value |
|---|
| HR, beats/min | 85.2±13.2 | 85.9±13.8 |
88.3±13.1b,c | 0.002 | 88.2±13.9 | 89.1±14.6 | 86.8±13.8 | 0.240 |
| PR interval,
msec | 134.5±16.3 |
136.8±17.8a |
138.7±17.5b | <0.001 | 135.3±17.9 |
138.0±17.8a |
139.5±17.4b | 0.007 |
| QRS duration,
msec | 84.5±8.9 |
86.3±9.1a |
88.5±9.3b,c | <0.001 | 84.7±9.6 |
87.4±9.2a |
89.5±9.9b,c | <0.001 |
| QTc interval,
msec | 427.2±20.7 | 426.9±20.0 | 427.8±21.5 | 0.862 | 429.3±21.0 | 429.9±20.1 | 429.2±19.7 | 0.923 |
| P-wave axis, ° | 39.4±29.4 | 37.1±26.7 | 36.5±25.3 | 0.084 | 42.2±30.2 | 39.9±29.9 |
34.8±26.5b | 0.010 |
| QRS axis, ° | 68.3±26.8 |
64.0±25.5a |
58.7±23.7b,c | <0.001 | 69.2±25.7 |
61.9±25.6a |
59.2±23.0b | <0.001 |
| T-wave axis, ° | 43.0±16.8 |
40.2±17.0a |
37.4±16.1b,c | <0.001 | 41.3±17.8 | 38.9±16.3 |
38.7±13.8b | <0.050 |
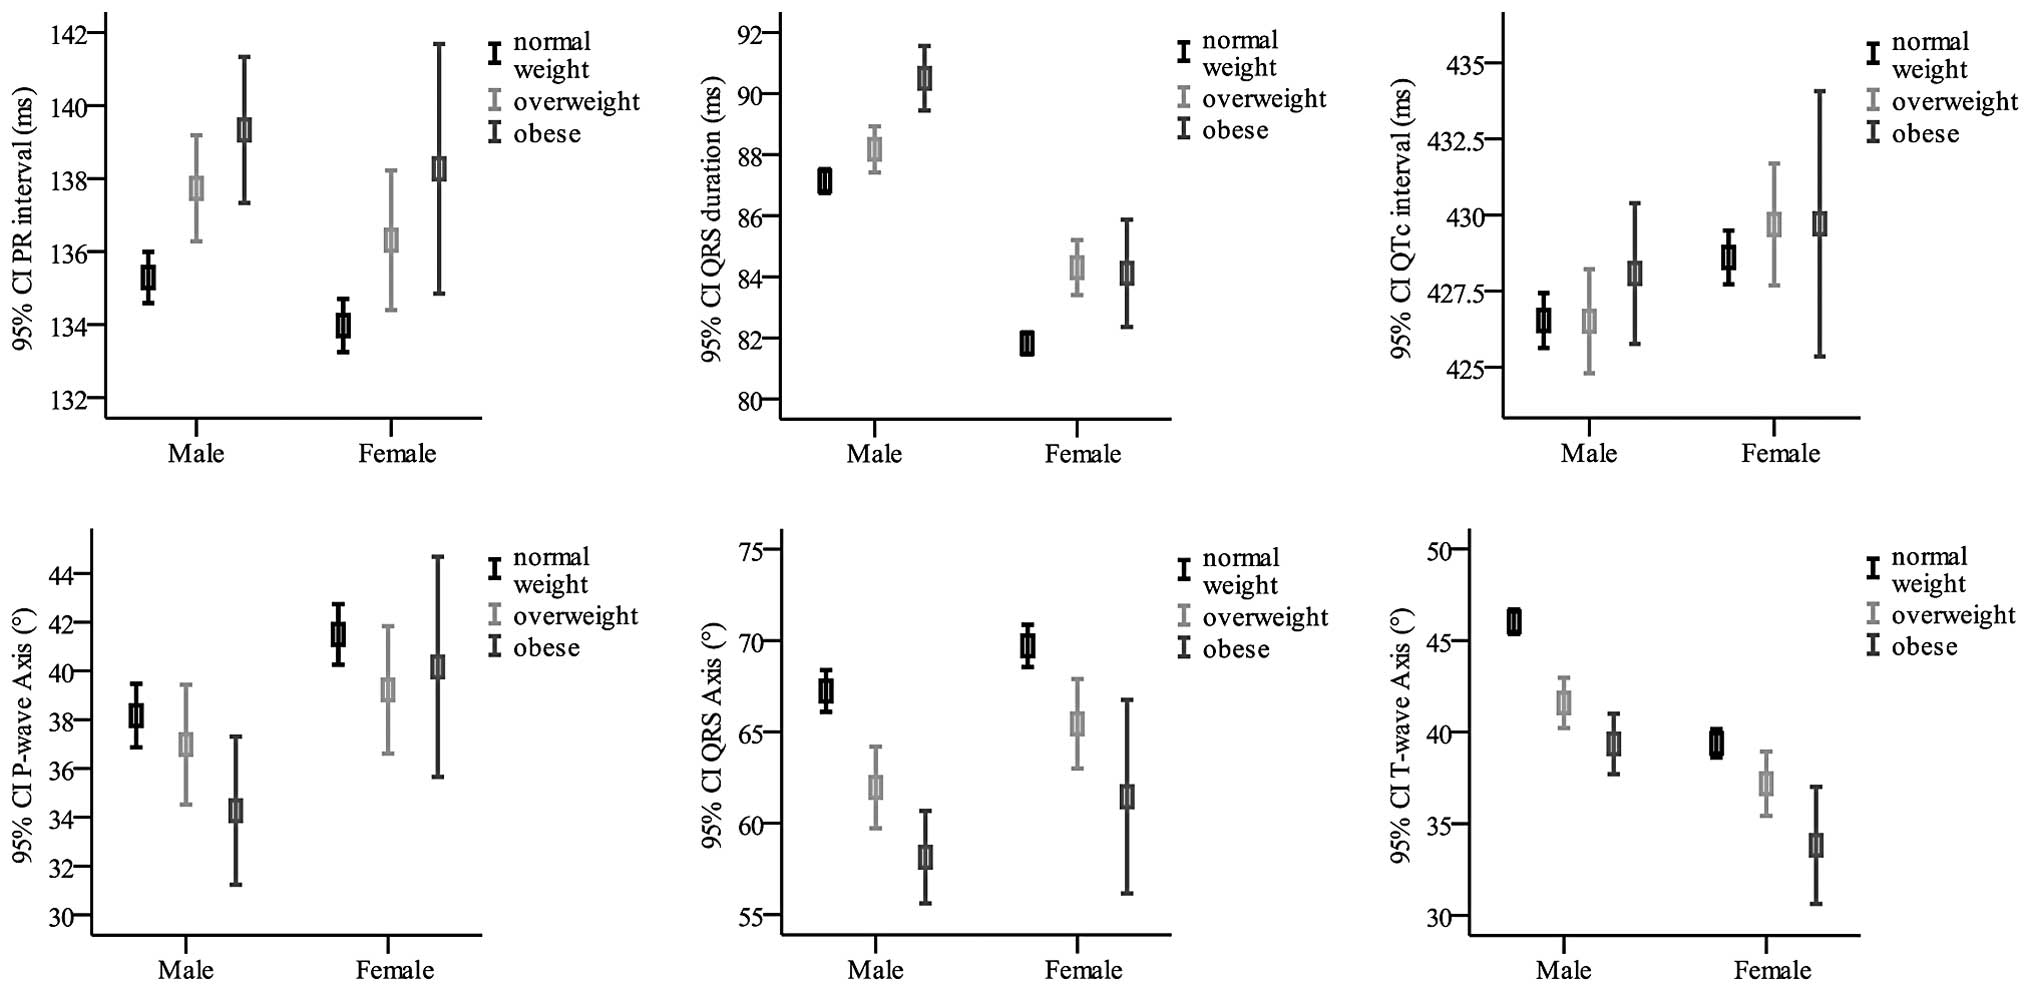
Furthermore, detailed differences of
electrocardiographic intervals and axes among normal weight,
overweight and obese groups stratified by gender are presented in
Fig. 1. The results from males and
females showed similar trends in ECG changes associated with
obesity, and gender itself was a factor affecting ECG
variables.
Differences in ECG variables associated
with abdominal obesity
The differences in electrocardiographic intervals
and axes between abdominal obesity and normal WC, stratified by
blood pressure, are listed in Table
III. Compared with the normal WC group, the abdominal obese
group had significantly longer PR interval, wider QRS duration,
leftward shifts of frontal P-wave axis and QRS axis. The
differences in normotensive subjects aforementioned were 3.9 msec,
2.1 msec, 2.8° and 7.4°, respectively. These differences were
larger in hypertensive subjects with values of 5.5 msec, 3.5 msec,
4.4° and 8.2°, respectively. The frontal T-wave axis showed 5.2°
leftward shift in the abdominal obese group compared with the
normal WC group in normotensive subjects (P<0.001); however, the
difference in hypertensive subjects was not significant (38.8±15.4
versus 40.9±17.4; P=0.056). No significant differences were noted
in HR and QTc interval between the two groups in normotensive or
hypertensive subjects.
| Table IIIDifferences in electrocardiographic
intervals and axes between abdominal obese and normal WC group,
stratified by blood pressure. |
Table III
Differences in electrocardiographic
intervals and axes between abdominal obese and normal WC group,
stratified by blood pressure.
| Normotensive
(n=4,341) | Hypertensive
(n=1,096) |
|---|
|
|
|
|---|
| Variables | Normal WC
(n=3,822) | Abdominal obese
(n=519) | P-value | Normal WC
(n=744) | Abdominal obese
(n=322) | P-value |
|---|
| HR, beats/min | 85.4±13.3 | 85.9±13.3 | 0.433 | 88.1±14.0 | 88.4±14.3 | 0.809 |
| PR interval,
msec | 134.6±16.5 | 138.5±17.2 | <0.001 | 135.1±17.7 | 140.6±17.8 | <0.001 |
| QRS duration,
msec | 84.7±9.0 | 86.8±9.2 | <0.001 | 85.1±9.4 | 88.6±10.1 | <0.001 |
| QTc interval,
msec | 427.3±20.6 | 426.3±20.5 | 0.263 | 429.3±20.7 | 429.8±20.2 | 0.693 |
| P-wave axis, ° | 39.2±29.2 | 36.4±26.1 | 0.023 | 41.6±29.2 | 37.2±30.3 | 0.025 |
| QRS axis, ° | 68.1±26.7 | 60.7±25.2 | <0.001 | 68.1±25.2 | 59.9±25.5 | <0.001 |
| T-wave axis, ° | 43.0±16.7 | 37.8±17.4 | <0.001 | 40.9±17.4 | 38.8±15.4 | 0.056 |
Correlations with BMI, WC and WHtR
Pearson correlation coefficients between ECG
variables and measures of obesity are presented in Table IV. Although the correlation
coefficients decreased following adjustment for age, gender,
ethnicity, SBP and DBP, electrocardiographic intervals, including
PR interval and QRS duration, still correlated positively with the
three measures of obesity (PR interval, BMI r=0.076, WC r=0.081,
WHtR r=0.043, each P<0.001; QRS duration, BMI r=0.101, WC
r=0.099, WHtR r=0.063, each P<0.001). Despite the fact that the
associations between P-wave axis, BMI and WC prior to adjustment
were not significant, electrocardiographic axes, including P-wave,
QRS and T-wave axes correlated negatively with measures of obesity
following adjustment (P-wave axis, BMI r=−0.048, WC r=−0.062, WHtR
r=−0.067, each P≤0.001; QRS axis, BMI r=−0.103, WC r=−0.097, WHtR
r=−0.103, each P<0.001; T-wave axis, BMI r=−0.125, WC r=−0.116,
WHtR r=−0.124, each P<0.001). No significant correlation was
found with BMI or WC in HR and QTc intervals. HR correlated
positively with WHtR (r=0.029; P<0.05).
| Table IVPearson’s correlation coefficients
between electrocardiographic variables and BMI, WC and WHtR. |
Table IV
Pearson’s correlation coefficients
between electrocardiographic variables and BMI, WC and WHtR.
| BMI | BMIa | WC | WCa | WHtR | WHtRa |
|---|
|
|
|
|
|
|
|
|---|
| Variables | r | P-value | r | P-value | r | P-value | r | P-value | r | P-value | r | P-value |
|---|
| HR | −0.037 | 0.006 | 0.028 | 0.061 | −0.080 | <0.001 | 0.012 | 0.398 | 0.031 | 0.024 | 0.029 | 0.049 |
| PR interval | 0.160 | <0.001 | 0.076 | <0.001 | 0.185 | <0.001 | 0.081 | <0.001 | 0.057 | <0.001 | 0.043 | 0.003 |
| QRS duration | 0.161 | <0.001 | 0.101 | <0.001 | 0.174 | <0.001 | 0.099 | <0.001 | 0.127 | <0.001 | 0.063 | <0.001 |
| QTc duration | 0.011 | 0.409 | −0.002 | 0.897 | 0.004 | 0.771 | −0.012 | 0.432 | −0.016 | 0.231 | −0.015 | 0.317 |
| P-wave axis | −0.013 | 0.331 | −0.048 | 0.001 | −0.014 | 0.296 | −0.062 | <0.001 | −0.067 | <0.001 | −0.067 | <0.001 |
| QRS axis | −0.119 | <0.001 | −0.103 | <0.001 | −0.117 | <0.001 | −0.097 | <0.001 | −0.119 | <0.001 | −0.103 | <0.001 |
| T-wave axis | −0.106 | <0.001 | −0.125 | <0.001 | −0.088 | <0.001 | −0.116 | <0.001 | −0.091 | <0.001 | −0.124 | <0.001 |
Considering differences in baseline characteristics
among various weight groups may have possible impacts on the study
results, multivariate linear regression analysis was performed to
explore the linear association between ECG variables and obesity.
Multivariate linear regression data are listed in Table V.
| Table VMultivariate linear regression
analysis for the association between body habitus and
electrocardiographic intervals and axes. |
Table V
Multivariate linear regression
analysis for the association between body habitus and
electrocardiographic intervals and axes.
| BMI | WC | WHtR |
|---|
|
|
|
|
|---|
| Variables | β (95% CI) | P-value | β (95% CI) | P-value | β (95% CI) | P-value |
|---|
| HR | 0.112 (−0.005,
0.228) | 0.061 | 0.019 (−0.025,
0.062) | 0.398 | 6.959 (0.038,
13.880) | 0.049 |
| PR interval | 0.390 (0.243,
0.537) | <0.001 | 0.155 (0.100,
0.210) | <0.001 | 13.024 (4.286,
21.762) | 0.003 |
| QRS duration | 0.273 (0.195,
0.350) | <0.001 | 0.099 (0.070,
0.128) | <0.001 | 10.183 (5.567,
14.799) | <0.001 |
| QTc duration | −0.012 (−0.195,
0.170) | 0.897 | −0.027 (−0.095,
0.041) | 0.432 | −5.523 (−16.354,
5.308) | 0.317 |
| P-wave axis | −0.430 (−0.689,
−0.172) | 0.001 | −0.208 (−0.304,
−0.112) | <0.001 | −35.743 (−51.080,
−20.407) | <0.001 |
| QRS axis | −0.842 (−1.076,
−0.608) | <0.001 | −0.296 (−0.383,
−0.209) | <0.001 | −50.098 (−63.991,
−36.205) | <0.001 |
| T-wave axis | −0.649 (−0.797,
−0.501) | <0.001 | −0.224 (−0.279,
−0.169) | <0.001 | −38.230 (−47.011,
−29.448) | <0.001 |
Discussion
The prevalence of overweight and obese children is a
growing global health concern according to the World Health
Organization (34). A previous
study indicated that WC and WHtR, measures of abdominal obesity,
were more efficient risk factor predictors of cardiovascular
disease than BMI in children (28). In the present study, the prevalence
of general obesity and abdominal obesity in children and
adolescents was reported, using the recommended BMI and WC
percentiles. It was found that being overweight and obese is common
among rural Chinese children, with 16.8% overweight and 7.3% obese.
Comparing the collected data with the prevalence rate of obesity
among urban Chinese children, based on the data published by the
sixth Chinese National Survey on Students Constitution and Health
in 2010 (35), a slightly lower
prevalence (0.8%) in obesity among rural Chinese individuals was
observed. Higher prevalence of obesity in males was also found, in
accordance with the sixth Chinese National Survey. The overall
prevalence of abdominal obesity among the rural public school
subjects was 15.5% and similar gender differences were observed
with higher prevalence in males than females (17.0 versus
13.6%).
Obesity in adults is closely associated with a wide
variety of ECG changes, including high resting HR, prolongation of
PR interval and QRS duration and leftward shifts of
electrocardiographic axes. However, the effect of obesity on QTc
intervals is controversial in children and adults. Significant
positive associations between BMI and ECG intervals, including PR
interval and QRS duration, were reported in this cross-sectional
study. Furthermore, these associations were linear and independent
of age, gender, ethnicity and blood pressure (20). Significant negative associations
were noted between BMI and electrocardiographic axes (P-wave, QRS
and T-wave) in the results, which were consistent with previous
studies (18,20). The difference in HR between the
normal weight and obese groups within normotensive subjects was
significant. However, no significant differences existed within
hypertensive subjects and the correlation between HR and BMI was
also insignificant following adjustment for age, gender, ethnicity,
SBP and DBP. The results were inconsistent with previous studies
(19,20,36),
which may be due to the effect of other factors. The results in the
present study showed that the QTc interval was not associated with
obesity which was similar to the result by Leotta et al in a
healthy young population (23).
Abdominal obesity is an independent cardiovascular
risk factor; however, the association between abdominal obesity and
ECG variables has not been examined previously in large-scale
populations. Differences in ECG intervals and axes between normal
WC and abdominal obesity in rural Chinese children and adolescents
were explored in this study. Abdominal obesity was associated with
longer PR intervals, wider QRS duration and leftward shifts in
frontal P-wave and QRS axes compared with the normal WC. Leftward
shift of frontal T-wave axis was also apparent, although the
difference within hypertensive participants was not significant.
The ECG variables, including PR interval, QRS duration, frontal
P-wave axis, QRS axis and T-wave axis, correlated with WC and WHtR
following adjustment. Furthermore, these associations were linear
and independent of age, gender, ethnicity and blood pressure. In
general, the effects of abdominal obesity on ECG were in agreement
with general obesity.
In measuring ECG values, this study differed in two
ways from the others. Firstly, a combination of manual locations
and computer-based calculations was used in the evaluation of the
ECG variables, as described previously, while the majority of
previous studies used computer-generated calculations. Manual
operation may reduce mistakes in measurements made by the computer
(37). Secondly, the measurements
were based on the simultaneously recorded 12-lead ECGs and
temporally aligned superimposed ECG leads were made available as an
optional display under the CV200 ECG Work Station to validate the
onset and end points of the intervals according to the AHA/ACCF/HRS
recommendations (38). The
measurements in the majority of previous studies were based on
other ECG leads.
There were certain limitations to the present study.
As a cross-sectional study, the associations between obesity and
ECG intervals and axes were explored; however, the long-term
interaction between obesity and ECG variables was not elucidated.
Furthermore, the electrocardiographic changes were relatively small
and all within normal limits. Therefore, whether these differences
had clinical significance was unclear. These issues require more
investigation and further follow-up studies.
In conclusion, ECG variables were examined and a
novel result was reported from a large-scale cross-sectional study
among children and adolescents in rural Liaoning in Northeast
China. In addition, general and abdominal obesity in children and
adolescents was revealed to be associated with longer PR intervals,
wider QRS duration and leftward shifts in frontal P-wave, QRS and
T-wave axes. Gender itself was a possible factor affecting the ECG
variables. In addition, these associations with BMI, WC and WHtR
were linear and independent of age, gender, ethnicity and blood
pressure.
Acknowledgements
The authors would like to thank the subjects for
their participation. This study was supported by a grant from the
National Basic Research Program of China (973 Program; no.
2010CB535011).
Abbreviations:
|
ECG
|
electrocardiography
|
|
HR
|
heart rate
|
|
AF
|
atrial fibrillation
|
|
HF
|
heart failure
|
|
QTc
|
corrected QT interval
|
|
CHD
|
coronary heart disease
|
|
BMI
|
body mass index
|
|
WC
|
waist circumference
|
|
WHtR
|
waist-to-height ratio
|
|
SBP
|
systolic blood pressure
|
|
DBP
|
diastolic blood pressure
|
References
|
1
|
O’Neil BJ, Hoekstra J, Pride YB, et al:
Incremental benefit of 80-lead electrocardiogram body surface
mapping over the 12-lead electrocardiogram in the detection of
acute coronary syndromes in patients without ST-elevation
myocardial infarction: Results from the Optimal Cardiovascular
Diagnostic Evaluation Enabling Faster Treatment of Myocardial
Infarction (OCCULT MI) trial. Acad Emerg Med. 17:932–939. 2010.
|
|
2
|
Okamura T, Hayakawa T, Kadowaki T, et al:
Resting heart rate and cause-specific death in a 16.5-year cohort
study of the Japanese general population. Am Heart J.
147:1024–1032. 2004.PubMed/NCBI
|
|
3
|
Palatini P, Casiglia E, Julius S and
Pessina AC: High heart rate: a risk factor for cardiovascular death
in elderly men. Arch Intern Med. 159:585–592. 1999. View Article : Google Scholar : PubMed/NCBI
|
|
4
|
Magnani JW, Wang N, Nelson KP, et al;
Aging, and Body Composition Study. Electrocardiographic PR interval
and adverse outcomes in older adults: the Health, Aging, and Body
Composition study. Circ Arrhythm Electrophysiol. 6:84–90. 2013.
View Article : Google Scholar : PubMed/NCBI
|
|
5
|
Cheng S, Keyes MJ, Larson MG, et al:
Long-term outcomes in individuals with prolonged PR interval or
first-degree atrioventricular block. JAMA. 301:2571–2577. 2009.
View Article : Google Scholar : PubMed/NCBI
|
|
6
|
Chan YH, Siu CW, Yiu KH, et al:
Prolongation of PR interval is associated with endothelial
dysfunction and activation of vascular repair in high-risk
cardiovascular patients. J Interv Card Electrophysiol. 37:55–61.
2013. View Article : Google Scholar : PubMed/NCBI
|
|
7
|
Ilkhanoff L, Liu K, Ning H, et al:
Association of QRS duration with left ventricular structure and
function and risk of heart failure in middle-aged and older adults:
the Multi-Ethnic Study of Atherosclerosis (MESA). Eur J Heart Fail.
14:1285–1292. 2012. View Article : Google Scholar : PubMed/NCBI
|
|
8
|
Dhingra R, Ho Nam B, Benjamin EJ, et al:
Cross-sectional relations of electrocardiographic QRS duration to
left ventricular dimensions: the Framingham Heart Study. J Am Coll
Cardiol. 45:685–689. 2005. View Article : Google Scholar : PubMed/NCBI
|
|
9
|
Cheng S, Larson MG, Keyes MJ, et al:
Relation of QRS width in healthy persons to risk of future
permanent pacemaker implantation. Am J Cardiol. 106:668–672. 2010.
View Article : Google Scholar : PubMed/NCBI
|
|
10
|
Nagaya T, Yoshida H, Takahashi H and Kawai
M: Heart rate-corrected QT interval in resting ECG predicts the
risk for development of type-2 diabetes mellitus. Eur J Epidemiol.
25:195–202. 2010. View Article : Google Scholar : PubMed/NCBI
|
|
11
|
Mukerji R, Petruc M, Fresen JL, Terry BE,
Govindarajan G and Alpert MA: Effect of weight loss after bariatric
surgery on left ventricular mass and ventricular repolarization in
normotensive morbidly obese patients. Am J Cardiol. 110:415–419.
2012. View Article : Google Scholar : PubMed/NCBI
|
|
12
|
Perez MV, Dewey FE, Marcus R, Ashley EA,
Al-Ahmad AA, Wang PJ and Froelicher VF: Electrocardiographic
predictors of atrial fibrillation. Am Heart J. 158:622–628. 2009.
View Article : Google Scholar : PubMed/NCBI
|
|
13
|
Chhabra L, Sareen P, Perli D, Srinivasan I
and Spodick DH: Vertical P-wave axis: the electrocardiographic
synonym for pulmonary emphysema and its severity. Indian Heart J.
64:40–42. 2012. View Article : Google Scholar : PubMed/NCBI
|
|
14
|
Kors JA, de Bruyne MC, Hoes AW, et al: T
axis as an indicator of risk of cardiac events in elderly people.
Lancet. 352:601–605. 1998. View Article : Google Scholar : PubMed/NCBI
|
|
15
|
Poirier P, Giles TD, Bray GA, et al;
American Heart Association and Obesity Committee of the Council on
Nutrition and Physical Activity, and the Metabolism. Obesity and
cardiovascular disease: pathophysiology, evaluation, and effect of
weight loss: an update of the 1997 American Heart Association
Scientific Statement on Obesity and Heart Disease from the Obesity
Committee of the Council on Nutrition, Physical Activity, and
Metabolism. Circulation. 113:898–918. 2006.
|
|
16
|
Artham SM, Lavie CJ, Milani RV and Ventura
HO: Obesity and hypertension, heart failure, and coronary heart
disease-risk factor, paradox, and recommendations for weight loss.
Ochsner J. 9:124–132. 2009.PubMed/NCBI
|
|
17
|
Kim HK, Kim CH, Ko KH, Park SW, Park JY
and Lee KU: Variable association between components of the
metabolic syndrome and electrocardiographic abnormalities in Korean
adults. Korean J Intern Med. 25:174–180. 2010. View Article : Google Scholar : PubMed/NCBI
|
|
18
|
Fraley MA, Birchem JA, Senkottaiyan N and
Alpert MA: Obesity and the electrocardiogram. Obes Rev. 6:275–281.
2005. View Article : Google Scholar
|
|
19
|
Piwońska A, Piotrowski W, Broda G, et al:
The relationship between resting heart rate and atherosclerosis
risk factors. Kardiol Pol. 66:1069–1075. 2008.PubMed/NCBI
|
|
20
|
Frank S, Colliver JA and Frank A: The
electrocardiogram in obesity: statistical analysis of 1,029
patients. J Am Coll Cardiol. 7:295–299. 1986. View Article : Google Scholar : PubMed/NCBI
|
|
21
|
Arslan E, Yiğiner O, Yavasoğlu I, Ozcelik
F, Kardesoğlu E and Nalbant S: Effect of uncomplicated obesity on
QT interval in young men. Pol Arch Med Wewn. 120:209–213.
2010.PubMed/NCBI
|
|
22
|
Alpert MA, Terry BE, Hamm CR, et al:
Effect of weight loss on the ECG of normotensive morbidly obese
patients. Chest. 119:507–510. 2001. View Article : Google Scholar : PubMed/NCBI
|
|
23
|
Leotta G, Maule S, Rabbia F, et al:
Relationship between QT interval and cardiovascular risk factors in
healthy young subjects. J Hum Hypertens. 19:623–627. 2005.
View Article : Google Scholar : PubMed/NCBI
|
|
24
|
Güven A, Özgen T, Güngör O, Aydin M and
Baysal K: Association between the corrected QT interval and carotid
artery intima-media thickness in obese children. J Clin Res Pediatr
Endocrinol. 2:21–27. 2010.PubMed/NCBI
|
|
25
|
Fukushige T, Yoshinaga M, Shimago A, et
al: Effect of age and overweight on the QT interval and the
prevalence of long QT syndrome in children. Am J Cardiol.
89:395–398. 2002. View Article : Google Scholar : PubMed/NCBI
|
|
26
|
Mason JW, Ramseth DJ, Chanter DO, Moon TE,
Goodman DB and Mendzelevski B: Electrocardiographic reference
ranges derived from 79,743 ambulatory subjects. J Electrocardiol.
40:228–234. 2007. View Article : Google Scholar : PubMed/NCBI
|
|
27
|
Mansi IA and Nash IS: Ethnic differences
in electrocardiographic intervals and axes. J Electrocardiol.
34:303–307. 2001. View Article : Google Scholar : PubMed/NCBI
|
|
28
|
Savva SC, Tornaritis M, Savva ME, Kourides
Y, Panagi A, Silikiotou N, Georgiou C and Kafatos A: Waist
circumference and waist-to-height ratio are better predictors of
cardiovascular disease risk factors in children than body mass
index. Int J Obes Relat Metab Disord. 24:1453–1458. 2000.
View Article : Google Scholar : PubMed/NCBI
|
|
29
|
Daniels SR, Khoury PR and Morrison JA:
Utility of different measures of body fat distribution in children
and adolescents. Am J Epidemiol. 152:1179–1184. 2000. View Article : Google Scholar : PubMed/NCBI
|
|
30
|
Cole TJ, Bellizzi MC, Flegal KM and Dietz
WH: Establishing a standard definition for child overweight and
obesity worldwide: international survey. BMJ. 320:1240–1243. 2000.
View Article : Google Scholar : PubMed/NCBI
|
|
31
|
Ji CY, Yt Sung R, Ma GS, Ma J, He ZH and
Chen TJ: Waist circumference distribution of Chinese school-age
children and adolescents. Biomed Environ Sci. 23:12–20. 2010.
View Article : Google Scholar
|
|
32
|
National High Blood Pressure Education
Program Working Group on High Blood Pressure in Children and
Adolescents. The fourth report on the diagnosis, evaluation, and
treatment of high blood pressure in children and adolescents.
Pediatrics. 114(2 Suppl 4th Report): 555–576. 2004. View Article : Google Scholar
|
|
33
|
Kligfield P, Gettes LS, Bailey JJ, et al;
American Heart Association Electrocardiography and Arrhythmias
Committee, Council on Clinical Cardiology, American College of
Cardiology Foundation and Heart Rhythm Society. Recommendations for
the standardization and interpretation of the electrocardiogram:
part I: the electrocardiogram and its technology a scientific
statement from the American Heart Association Electrocardiography
and Arrhythmias Committee, Council on Clinical Cardiology; the
American College of Cardiology Foundation; and the Heart Rhythm
Society endorsed by the International Society for Computerized
Electrocardiology. J Am Coll Cardiol. 49:1109–1127. 2007.
|
|
34
|
No authors listed. Obesity: preventing and
managing the global epidemic. Report of a WHO consultation. (World
Health Organ Tech Rep Ser 894). i–xii. 1–253. 2000.PubMed/NCBI
|
|
35
|
Song Y, Wang HJ, Ma J and Wang Z: Secular
trends of obesity prevalence in urban Chinese children from 1985 to
2010: gender disparity. PLoS One. 8:e530692013. View Article : Google Scholar : PubMed/NCBI
|
|
36
|
Rautaharju PM, Surawicz B, Gettes LS, et
al; American Heart Association Electrocardiography and Arrhythmias
Committee, Council on Clinical Cardiology, American College of
Cardiology Foundation and Heart Rhythm Society. AHA/ACCF/HRS
recommendations for the standardization and interpretation of the
electrocardiogram: part IV: the ST segment, T and U waves, and the
QT interval: a scientific statement from the American Heart
Association Electrocardiography and Arrhythmias Committee, Council
on Clinical Cardiology; the American College of Cardiology
Foundation; and the Heart Rhythm Society: endorsed by the
International Society for Computerized Electrocardiology.
Circulation. 119:e241–e250. 2009.
|
|
37
|
Rautaharju PM, Surawicz B, Gettes LS, et
al; American Heart Association Electrocardiography and Arrhythmias
Committee, Council on Clinical Cardiology, American College of
Cardiology Foundation and Heart Rhythm Society. AHA/ACCF/HRS
recommendations for the standardization and interpretation of the
electrocardiogram: part IV: the ST segment, T and U waves, and the
QT interval: a scientific statement from the American Heart
Association Electrocardiography and Arrhythmias Committee, Council
on Clinical Cardiology; the American College of Cardiology
Foundation; and the Heart Rhythm Society. Endorsed by the
International Society for Computerized Electrocardiology. J Am Coll
Cardiol. 53:982–991. 2009.
|
|
38
|
Kligfield P, Gettes LS, Bailey JJ, et al;
American Heart Association Electrocardiography and Arrhythmias
Committee, Council on Clinical Cardiology, American College of
Cardiology Foundation and Heart Rhythm Society. Recommendations for
the standardization and interpretation of the electrocardiogram:
part I: The electrocardiogram and its technology: a scientific
statement from the American Heart Association Electrocardiography
and Arrhythmias Committee, Council on Clinical Cardiology; the
American College of Cardiology Foundation; and the Heart Rhythm
Society: endorsed by the International Society for Computerized
Electrocardiology. Circulation. 115:1306–1324. 2007.
|