Introduction
Cerebral infarction, also known as ischemic stroke,
seriously impairs the health of individuals (1). It is ischemic necrosis of an area of
the brain due to blocked blood vessels. The disease is one of the
significant causes of mortality and disability in older individuals
(2). Ischemia of the brain tissue
is in a reversible stage 6 h after stroke. Thrombolytic treatment
is able to restore blood flow perfusion in this time, to reduce
neurological damage and save the ischemic penumbra (3). Routine computed tomography (CT) and
magnetic resonance imaging (MRI) play important roles in the
diagnosis of cerebral infarction, and are used to elucidate the
pathophysiological characteristics of brain infarcts and define the
extent of tissue damage (4), but
are less sensitive for diagnosing acute cerebral infarction.
Clinically, CT and routine MRI are commonly used to assess the
swelling of ischemic nerve cells and changes of the tissue
structure caused by necrosis to determine the occurrence of
cerebral infarction. Tissue changes often occur during the first
few hours after a stroke and serious metabolic disorders of
neurocytes may be observed (5,6).
When signal changes are identified by CT, cells often have already
undergone ischemic necrosis (6,7).
As a result of the development of proton magnetic
resonance spectroscopy (1H-MRS), it is now possible to
obtain further information concerning the spatial distribution of a
spectroscopically visible metabolite in normal and ischemic human
brain (8). 1H-MRS is
able to monitor the metabolic changes that reflect the state of
substance and energy metabolism in nerve cells by determining
levels of certain metabolites in brain tissue. A recent study has
observed that certain neurometabolic changes occur following
stroke, but there is a lack of 1H-MRS studies of
patients with acute cerebral infarction (9).
1H-MRS may be used to obtain noninvasive
and in vivo determinations of the concentration of numerous
intracellular metabolites and to analyze the tissue metabolic state
based on the levels of these metabolites. N-acetylaspartic acid
(NAA) is a marker of neuronal density that is synthesized by
neuronal mitochondria and then distributed in the neuronal cell
bodies; it also directly reflects the functional state of neurons.
The inhibition of neuronal metabolism causes a significant
reduction in the level of NAA in cerebral ischemia, and depletion
of NAA when the infarction is irreversible (10). Thrombolytic therapy within 6 h
after the stroke is of significant importance for restoring
neurological function, and improving the survival and quality of
life of the patient (5), thus
early diagnosis and treatment are of great significance.
The purpose of this study was to analyze the
advantages of spectroscopic imaging in acute cerebral infarction.
Spectroscopic imaging permits evaluation of the entire extent of a
pathological lesion and comparison with contralateral brain tissue.
Of particular interest is the extent to which such spectroscopic
changes correspond to ‘conventional’ imaging findings, and whether
spectroscopic data allow allocation of different regions within
large infarcts to different extents of brain alterations.
Materials and methods
Clinicopathological data
A retrospective analysis of the medical records of
47 patients (27 males and 20 females; aged 37–72 years; mean age,
57.0±8.9 years) with cerebral infarction, who were admitted to the
Department of Neurology, Fifth Affiliated Hospital of Zhengzhou
University (Zhengzhou, China) from April 2010 to March 2012 was
performed. The time of stroke onset was within 12 h of symptom
occurrence. Clinical symptoms included headache, dizziness,
hemidysesthesia, hemiplegia, slurred speech and vision disturbance.
The patients had MRI examinations using an Achieva 3.0T scanner,
which has pre-1H-MRS detection analysis software and a
standard head coil (Philips, Amsterdam, The Netherlands) and
1H-MRS examination. Once the diagnosis of cerebral
infarction had been made, according to Chinese treatment guidelines
of the acute ischemic stroke 2010 (11), thrombolytic therapy was
administered to patients with indications for thrombolytic
treatment and consent of their families was obtained as soon as
possible, while the remaining patients underwent regular medical
treatments (including anticoagulant, improvement of blood
circulation, antiplatelet and cerebral protection). There were 43
patients reviewed who underwent 1H-MRS within 1–2 months
after stroke.
1H-MRS detection and analysis
procedures
The patients were managed by regular emergency
treatment (patients were examined to assure stable vital signs,
including blood pressure, which was controlled below 180/110 mmHg)
following admission, and underwent head CT scanning to exclude
intracranial hemorrhage and large area lesions as promptly as
possible. The patients who met the inclusion criteria underwent
1H-MRS when their vital signs were stable and as soon as
they could be removed from the electrocardiogram (ECG) and were
able to withstand ~30 min of MRI inspection. The inclusion criteria
were as follows: sudden headache, dizziness, hemidysesthesia,
hemiplegia, slurred speech and vision disturbance. The patients
were examined with CT to exclude intracranial hemorrhage and then
examined via MRI to confirm the occurrence of infarction. The
examinations were completed within 12 h. The patients were attended
to during MRI examinations by neurologists.
All patients underwent routine MRI and
1H-MRS scans. Routine MRI sequences included axial,
sagittal T1-weighted imaging (T1WI),
T2WI and diffusion-weighted imaging (DWI); layer
thickness was 5 mm in order to determine the pathological
conditions of cerebral tissue. The sequence of axial
T2WI or DWI identified the infarct lesions and positions
for 1H-MRS. The volume of a single voxel was 2×1×1 cm.
Water signals were suppressed by the chemical shift saturation
method. The sequence of S2DSI-144 was applied to collect
spectrum, imaging parameters were as follows: repetition time (TR)
was 2,000 msec, echo time (TE) was 144 msec and number of
excitations (NEX) was 16 times. FuncTool Spectroscopy-2D Brain
analysis software (Philips Signa Workstation 4.0, Philips,
Asterdam, The Netherlands) was used to analyze and calculate the
integral peak area of the corresponding chemical shift of NAA,
total creatine (creatine + phosphocreatine) (Cr), choline compounds
(Cho), and lactate (Lac) automatically, which provided a relative
quantitative value of the concentration of these compounds. The
values of the NAA/Cr, Cho/Cr, NAA/Cho, and Lac/Cr ratios were
calculated and analyzed.
Two senior experienced MRI diagnostic and operating
physicians, with 20 years of combined experience in imaging
analysis, performed independent diagnoses and made the final
decisions. Discussions were used to determine the decision when
conflicting opinions arose.
Statistical analysis
The measurement data are expressed as mean ±
standard deviation. The differences between the identical voxels
located in the two different brain hemispheres of the group of
patients and the same voxels tested at different times were
analyzed using the paired Student’s t-test. Comparisons of two
independent samples were performed by using the Student’s t-test.
All statistical analyses were performed using SPSS 13.0 software
(SPSS, Inc., Chicago, IL, USA). P<0.05 was considered to
indicate a statistically significant result.
Results
Routine MRI findings
Seventy-two lesions (61 supratentorial lesions and
11 infratentorial lesions) were observed in 47 patients. On
T2WI there was a slightly increased signal focus in 58
lesions with fuzzy boundaries and uniform signals in the other 14
lesions. Sixty-nine lesions showed a high signal on fluid
attenuated inversion recovery (FLAIR) and the boundaries were
clearer than those on T2WI. Three lesions showed a
uniform signal. All 72 lesions showed a clearly highlighted signal
in DWI.
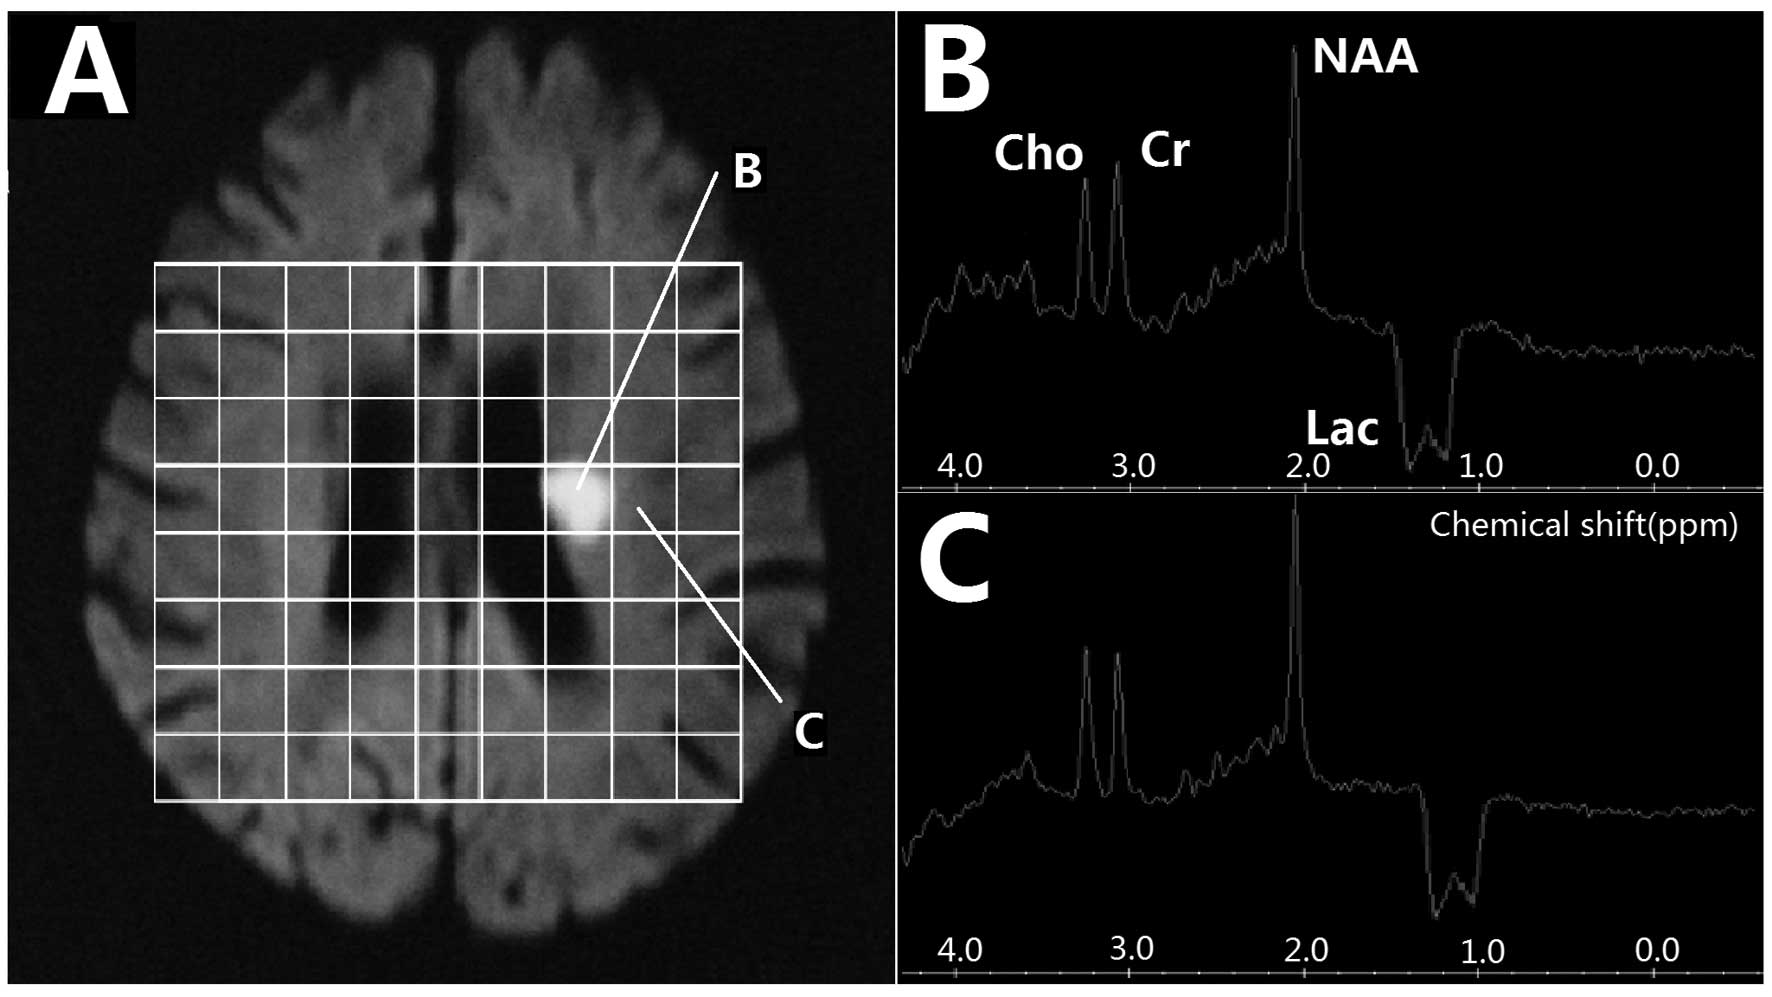
1H-MRS findings in the acute
phase
All 72 lesions on 1H-MRS images showed a
visible inverted Lac peak at 1.3 ppm, which included 52 bimodal and
20 single peaks. At the center of the lesion, NAA/Cho was
significantly higher in the <6 h group than in the 6–12 h group,
while the Lac/Cr was notably lower in the <6 h group than in the
6–12 h group (t=2.593, P=0.011; t=2.630, P=0.010; t=5.478,
P<0.001, respectively). However, in the border region, the
NAA/Cr and NAA/Cho ratios were only slightly decreased and an
inverted Lac peak was present (Fig.
1 and Table I). Of the 47
patients, 21 (29 lesions) underwent the first 1H-MRS
examination within 6 h after stroke and 26 (43 lesions) underwent
1H-MRS between 6–12 h afterwards. At the center of the
lesion, NAA and Lac were decreased in the <6 h group compared
with those in the 6–12 h group. However, the differences between
the <6 h and 6–12 h groups were not statistically significant at
the infarction border region. The comparison of MRS values in the
central and border region of lesions at different time points are
presented in Table II.
 | Table IComparison of metabolites among
different areas of lesion and control in the acute stage of
cerebral infarction (<12 h). |
Table I
Comparison of metabolites among
different areas of lesion and control in the acute stage of
cerebral infarction (<12 h).
| | Infarction
center | Infarction border
region |
|---|
| |
|
|
|---|
| Group | n | NAA/Cr | Cho/Cr | NAA/Cho | Lac/Cr | NAA/Cr | Cho/Cr | NAA/Cho | Lac/Cr |
|---|
| Infarction
center | 72 | 1.64±0.41a | 0.99±0.21 | 1.65±0.45a | −1.34±0.37b | 1.76±0.59 | 0.92±0.27 | 1.91±0.34 | −0.76±0.09b |
| Contralateral
side | 72 | 1.84±0.51 | 0.97±0.17 | 1.89±0.63 | −0.08±0.03 | 1.85±0.47 | 0.89±0.16 | 2.07±0.61 | −0.15±0.18 |
| Table IIComparison of metabolites in two areas
at different time windows in the cerebral infarction acute
stage. |
Table II
Comparison of metabolites in two areas
at different time windows in the cerebral infarction acute
stage.
| | Infarction
center | Infarction border
region |
|---|
| |
|
|
|---|
| Group | n | NAA/Cr | Cho/Cr | NAA/Cho | Lac/Cr | NAA/Cr | Cho/Cr | NAA/Cho | Lac/Cr |
|---|
| <6 h | 29 | 1.68±0.29 | 0.96±0.17 | 1.75±0.49a | −1.29±0.27a | 1.79±0.24 | 0.91±0.09 | 1.97±0.29 | −0.73±0.26 |
| 6–12 h | 43 | 1.56±0.27 | 1.03±0.22 | 1.51±0.38 | −1.49±0.35 | 1.75±0.21 | 0.93±0.10 | 1.88±0.26 | −0.79±0.19 |
1H-MRS findings on
reexamination
Of the 47 patients, 43 were reexamined and 4 were
lost to follow-up. Sixty-nine lesions were identified at the
reexaminations and 61 were typical infarction lesions with long
T1 and T2 signals and clear boundaries.
Compared with the first DWI results, 45 lesions were enlarged,
eight had disappeared, five were reduced and 11 had no marked
change. At the center of the lesion, the NAA/Cr and NAA/Cho ratios
were decreased and the Lac/Cr value was reduced in the follow-up
(1–2 months group) group compared with those in the <12 h group,
and the differences were statistically significant (t=7.933,
P<0.001; t=3.962, P<0.001; t=6.531, P<0.001,
respectively). However, at the infarction border region, the only
difference observed between the <12 h and follow-up groups was
that the Lac/Cr ratio was decreased (t=9.875, P<0.001). A
comparison of the lesion center and border region metabolite values
between the cerebral infarction acute stage and 1–2 months after
stroke (median follow-up time, 1.4 months; range, 1.1–1.9 months)
is presented in Table III. At
the infarction center, no statistically significant differences
were identified between the NAA and Lac values in the thrombolysis
and non-thrombolysis groups. However, at the infarction border
region, the NAA/Cr and NAA/Cho values were lower in the
non-thrombolysis group compared with those in the thrombolysis
group. A comparison of follow-up MRS values between patients with
and without thrombolytic treatments is shown in Table IV.
| Table IIIComparison of metabolites in two areas
between the cerebral infarction acute stage (<12 h) and 1–2
months after stroke. |
Table III
Comparison of metabolites in two areas
between the cerebral infarction acute stage (<12 h) and 1–2
months after stroke.
| | Infarction
center | Infarction border
region |
|---|
| |
|
|
|---|
| Group | n | NAA/Cr | Cho/Cr | NAA/Cho | Lac/Cr | NAA/Cr | Cho/Cr | NAA/Cho | Lac/Cr |
|---|
| <12 h | 72 | 1.64±0.41a | 0.99±0.21b | 1.65±0.45a | −1.34±0.37a | 1.76±0.59 | 0.92±0.27 | 1.91±0.34 | −0.76±0.09a |
| 1–2 months | 69 | 0.43±0.12 | 0.69±0.17 | 0.62±0.14 | −0.07±0.11 | 1.62±0.43 | 0.89±0.22 | 1.82±0.29 | 0.03±0.01 |
| Table IVComparison of metabolites of two areas
between the early thrombolysis group and non-thrombolysis group 1–2
months following infarction. |
Table IV
Comparison of metabolites of two areas
between the early thrombolysis group and non-thrombolysis group 1–2
months following infarction.
| | Infarction
center | Infarction border
region |
|---|
| |
|
|
|---|
| Group | n | NAA/Cr | Cho/Cr | NAA/Cho | Lac/Cr | NAA/Cr | Cho/Cr | NAA/Cho | Lac/Cr |
|---|
| Thrombolysis | 21 | 0.52±0.44 | 0.73±0.37 | 0.71±0.42 | −0.08±0.07 | 1.77±0.61a | 0.86±0.22a | 2.05±0.31a | −0.02±0.05 |
|
Non-thrombolysis | 48 | 0.34±0.32 | 0.65±0.29 | 0.52±0.35 | −0.06±0.04 | 1.39±0.43 | 0.76±0.13 | 1.82±0.24 | −0.03±0.05 |
Discussion
The results of this study indicate the manner in
which 1H-MRS is able to supplement the better
resolution, but less specific morphological findings of MRI,
particularly as it provides information concerning the distribution
of NAA and Lac as markers of intact neuronal tissue. Compared with
single-volume spectroscopy, MRS imaging allows a more precise
definition of the center of the infarct since this imaging may be
analyzed retrospectively. In addition, 1H-MRS may be
used noninvasively and in vivo to determine the
concentrations of intracellular metabolite in the infarcted brain
that may predict the tissue viability of the brain structures
enclosing the infarcted area.
In this study, 72 lesions were tested by
1H-MRS examination. Within 6 h after stroke, it was
observed that Lac/Cr ratios in the infarction center and border
region decreased compared to the Lac/Cr ratios on the contralateral
side, which indicated brain tissue ischemia. In the infarction
center, NAA/Cr and NAA/Cho ratios significantly decreased compared
with those in the control side, while only a slight reduction of
the NAA/Cr and NAA/Cho ratios was observed in the infarction border
region, which indicated more serious anoxic damage of cells in the
infarction center. Lac is the end product of the anaerobic
metabolism of glucose. It is a marker of cell energy metabolism.
Under normal circumstances, the metabolism of the brain cell
(neuron) is mainly aerobic metabolism, so the level of lactic acid
is very low. Lac levels are elevated when the oxygen supply is
insufficient, which indicates ischemia in the territory of a blood
vessel to the brain (12).
Previous studies (13,14) showed that the oxygen consumption
rate of normal brain tissue is 20 ml/100 g/min. Lac is generated
when the metabolism of cerebral blood flow is below this value.
Thus the appearance of Lac is considered to be a sensitive marker
in the early stage of infarction and it appears before the routine
MRI examination shows abnormal changes. Cho includes glycerol
phosphate, choline, phosphorylcholine and phosphatidylcholine. Cho
is a marker of the cell membrane and sphingomyelin. Its peak is
determined by the concentration of choline existing in membrane
phospholipids and of acetylcholine used as a neurotransmitter.
Pathophysiological processes cause the decomposition of
sphingomyelin and an increase in the number of cells may lead Cho
levels to increase. Such processes are ischemia, cancer and brain
tumors (15). The Cr value
represents the total concentration of creatine and phosphocreatine.
Its content is relatively constant and uniform in different
metabolic conditions of the human brain, particularly the
pathological conditions. Therefore it is often used as an internal
standard to measure the levels of other metabolites (16). Our results indicate that Lac is a
sensitive marker of anaerobic metabolism following cerebral
ischemia, but the neuronal damage is secondary to cerebral ischemia
and the reduction of the level of NAA occurred after the level of
Lac increased. These results are in accordance with those in
previous reports (17,18), in which acute cerebral infarction
patients were studied, and it was observed that NAA levels were
decreased.
NAA is a marker of neuronal density and activity. In
addition, NAA is a specific marker that may reflect
infarction-related injury. Lac is a product of anaerobic
glycolysis. The increase in size of the Lac peak reflects the lack
of oxygen supply and indicates the presence of infarction, but not
necessarily the development of irreversible cerebral infarction
(19). The current study compared
MRS values between 6–12 h with values within 6 h, and the results
showed that the Lac/Cr ratio remained increased after 6 h of
infarction in the infarction center, but the NAA/Cho ratio was
decreased. There were only slight changes of MRS values in the
border region and the differences were not statistically
significant. This indicated that cerebral infarction has a
therapeutic time frame.
The ischemic penumbra is the main therapeutic target
in cerebral infarction, and also is the main target of the
treatment for the progressive development of acute cerebral
infarction. Our study results showed that in the border region, the
NAA/Cr, Cho/Cr and NAA/Cho ratios differed between the patients who
received thrombolytic therapy and those who did not, but there was
no significant difference in the Lac/Cr ratio. By contrast, in the
infarction center, the difference in each MRS value between the
thrombolysis and non-thrombolysis groups was not statistically
significant. This result suggests that the infarction border region
is the therapeutic target of cerebral infarction, and patients with
indications for thrombolysis should be provided with thrombolytic
therapy as soon as possible, and the monitoring of the NAA peak is
also an important indicator for assessing the effectiveness of
cerebral infarction treatment.
In the current study, a technical factor impacted
the multi-voxel 1H-MRS information collection from the
patients with cerebral infarction. The time span of the study was
relatively long and a drift in magnetic field often occurs after
magnetic resonance has been conducted for numerous hours.
Therefore, we adopted the MRS ratio rather than the absolute value
to reduce interference. In addition, the level of Cr reflects the
metabolic status of mitochondrial function and cellular energy.
Although the majority of studies consider that the content in the
body is relatively uniform and constant, the level of Cr often
changes slightly in areas of membrane damage, such as in cerebral
ischemia (20,21). This may also have certain impacts
on the study results.
In conclusion, important information for the
diagnosis and treatment of cerebral infarction may be provided by
the early neural metabolic changes in cerebral infarction patients.
An increased Lac/Cr ratio, as well as decreased NAA/Cr and NAA/Cho
ratios often indicate irreversible infarction, but if only the
Lac/Cr ratio is increased does this indicate the occurrence of
cerebral ischemia. The monitoring of the NAA peak may be considered
as an indicator for evaluating the effectiveness of treatment for
cerebral infarction. Thrombolytic therapy should be administered as
early as possible to patients who meet the thrombolytic
indications, since it is beneficial for saving tissue activity in
the border region between the infarction and normal tissue.
However, MRS examination is demanding due to the high strength of
the magnetic resonance field and there are numerous interference
factors. In addition, there is no unified standard MRS value for
the diagnosis of cerebral infarction. Therefore, further study and
improvements are required.
Acknowledgements
This study was supported by the The Basic and
Frontier Technology Research Project of Henan Province in China
(112300410294).
References
|
1
|
Hosomi N, Sueda Y, Masugata H, et al: The
optimal timing of antihypertensive medication administration for
morning hypertension in patients with cerebral infarction.
Hypertens Res. 35:720–724. 2012. View Article : Google Scholar : PubMed/NCBI
|
|
2
|
Vernino S, Brown RD Jr, Sejvar JJ, et al:
Cause-specific mortality after first cerebral infarction: a
population-based study. Stroke. 34:1828–1832. 2003. View Article : Google Scholar : PubMed/NCBI
|
|
3
|
Wardlaw JM, Zoppo G, Yamaguchi T and Berge
E: Thrombolysis for acute ischaemic stroke. Cochrane Database Syst
Rev. 3:CD0002132003.
|
|
4
|
Coutts SB, Modi J, Patel SK, et al: What
causes disability after transient ischemic attack and minor
stroke?: Results from the CT and MRI in the Triage of TIA and minor
Cerebrovascular Events to Identify High Risk Patients (CATCH)
Study. Stroke. 43:3018–3022. 2012. View Article : Google Scholar
|
|
5
|
Cvoro V, Marshall I, Armitage PA, et al:
MR diffusion and perfusion parameters: relationship to metabolites
in acute ischaemic stroke. J Neurol Neurosurg Psychiatry.
81:185–191. 2010. View Article : Google Scholar : PubMed/NCBI
|
|
6
|
Ledezma CJ, Fiebach JB and Wintermark M:
Modern imaging of the infarct core and the ischemic penumbra in
acute stroke patients: CT versus MRI. Expert Rev Cardiovasc Ther.
7:395–403. 2009. View
Article : Google Scholar : PubMed/NCBI
|
|
7
|
Kang SY and Kim JS: Anterior cerebral
artery infarction: stroke mechanism and clinical-imaging study in
100 patients. Neurology. 70(24 Pt 2): 2386–2393. 2008. View Article : Google Scholar : PubMed/NCBI
|
|
8
|
Maudsley AA, Hilal SK, Perman WH and Simon
HE: Spatially resolved high-resolution spectroscopy by
four-dimensional NMR. J Magn Reson. 51:147–152. 1983.
|
|
9
|
Li C, Ling X, Liu S, et al: Early
detection of secondary damage in ipsilateral thalamus after acute
infarction at unilateral corona radiata by diffusion tensor imaging
and magnetic resonance spectroscopy. BMC Neurol. 11:492011.
View Article : Google Scholar
|
|
10
|
Glodzik-Sobanska L, Li J, Mosconi L, et
al: Prefrontal N-acetylaspartate and poststroke recovery: a
longitudinal proton spectroscopy study. AJNR Am J Neuroradiol.
28:470–474. 2007.PubMed/NCBI
|
|
11
|
Chinese Medical Association Neurology
Branch Cerebrovascular Disease Study Group. Chinese treatment
guidelines of the acute ischemic stroke 2010. Chin J Neurol.
43:146–154. 2010.(In Chinese).
|
|
12
|
Cheng J, Feng G, Kong Q, et al: Study on
early ischemic cerebral infarction by using proton magnetic
resonance spectroscopy in rabbits. J Zhengzhou University (Med
Sci). 40:227–229. 2005.(In Chinese).
|
|
13
|
Ricci PE Jr: Proton MR spectroscopy in
ischemic stroke and other vascular disorders. Neuroimaging Clin N
Am. 8:881–900. 1998.PubMed/NCBI
|
|
14
|
Allen K, Busza AL, Crockard HA, et al:
Acute cerebral ischaemia: concurrent changes in cerebral blood
flow, energy metabolites, pH, and lactate measured with hydrogen
clearance and 31P and 1H nuclear magnetic resonance spectroscopy.
III Changes following ischaemia. J Cereb Blood Flow Metab.
8:816–821. 1988. View Article : Google Scholar
|
|
15
|
Li X, Wang B, Feng D, et al: Study of
diffuse axonal injury at early stage using proton magnetic
resonance spectroscopy. J Shanghai Jiaotong University (Med Sci).
29:1443–1446. 2009.(In Chinese).
|
|
16
|
Li X, Feng D and Ma Y: Current concepts:
role of magnetic resonance spectroscopy in diffuse axonal injury.
Chin J Neurosurg Dis Res. 8:92–94. 2009.(In Chinese).
|
|
17
|
Kim GE, Lee JH, Cho YP, et al: Metabolic
changes in the ischemic penumbra after carotid endarterectomy in
stroke patients by localized in vivo proton magnetic resonance
spectroscopy (1H-MRS). Cardiovasc Surg. 9:345–355. 2001. View Article : Google Scholar
|
|
18
|
Lanfermann H, Kugel H, Heindel W, et al:
Metabolic changes in acute and subacute cerebral infarctions:
findings at proton MR spectroscopic imaging. Radiology.
196:203–210. 1995. View Article : Google Scholar : PubMed/NCBI
|
|
19
|
Mader I, Rauer S, Gall P and Klose U:
1H-MR spectroscopy of inflammation, infection and
ischemia of the brain. Eur J Radiol. 67:250–257. 2008. View Article : Google Scholar
|
|
20
|
Vial F, Serriere S, Barantin L, et al: A
newborn piglet study of moderate hypoxic-ischemic brain injury by
1H-MRS and MRI. Magn Reson Imaging. 22:457–465. 2004.
View Article : Google Scholar : PubMed/NCBI
|
|
21
|
Walecki J, Barcikowska M, Ćwikła JB and
Gabryelewicz T: N-acetylaspartate, choline, myoinositol, glutamine
and glutamate (glx) concentration changes in proton MR spectroscopy
(1H MRS) in patients with mild cognitive impairment
(MCI). Med Sci Monit. 17:MT105–MT111. 2011. View Article : Google Scholar
|