Introduction
Myocardial hypertrophy is a normal adjustment in
response to wall stress resulting from an increased cardiac load
(1,2). The predominant characteristics of
myocardial hypertrophy include an increased cell volume, enhanced
protein synthesis and an upregulation of the expression of
embryonic genes. The predominant characteristics of the
histopathology include an expanded cell space, increased
intercellular muscle fibers as well as myocardial fibrosis and
dysfunction.
The increasing incidence and prevalence of heart
failure (HF) has been identified as one of the predominant causes
of morbidity and mortality in the elderly (3,4). The
pathogenesis of HF is complex and often associated with cardiac
remodeling, which involves cardiac myocyte hypertrophy,
re-expression of the fetal program and phenotypic changes within
the extracellular matrix (3–5).
Myocardial hypertrophy may occur as an adaptive response to a
pressure or volume overload as a result of decreasing wall stress,
whereas chronic left ventricle hypertrophy is strongly associated
with chronic HF and fatalities. Moreover, chronic left ventricle
hypertrophy is considered a maladaptive process, thereby inducing a
fetal gene program and pro-hypertrophic signaling pathways
(6–8). In an adult heart, hypertrophic growth
results from signals that are stimulated at the cell surface and
subsequently transmitted via receptors or channels, which activate
intracellular signaling cascades and affect nuclear cues, thereby
altering gene expression (9,10).
The molecular machinery that directs mechanical sensing in cardiac
myocytes is partially understood. In certain cases, the cell
surface adhesion receptors, termed N-cadherins, are significant
detectors of mechanical load.
Cadherins are Ca2+-dependent
transmembrane proteins, which form a large family of cell-to-cell
adhesion molecules. At present, >100 members of the cadherin
superfamily have been identified in invertebrates and vertebrates,
with the majority predominantly comprising extracellular,
transmembrane and cytoplasmic domains (11,12).
In addition, the optimally characterized cadherins were further
classified into epithelial (E), neural (N) and placental (P)
cadherins based on the tissue distribution that was initially
identified. The cadherin gene was identified by Yagi and Takeichi
(13) 30 years previously and the
function of cadherins has recently been demonstrated. This function
is not limited to mechanical adhesion, but is key in cellular
localization, proliferation and differentiation through the
cadherin-catenin-cytoskeleton complex, which transforms
extracellular stimuli into intracellular signals (12,13).
It has been demonstrated that the cardiomyocytes can be
mechanically joined through N-cadherin-mediated cell adhesion,
which simultaneously provides the anchor point for the
cytoskeleton. This mechanical cell adhesion maintains the
structural integrity and polarity of the tissues in the adult
organism (14,15). Clinical and experimental studies
have been conducted to explore the expression and function of
N-cadherin in tumors and cancer cells. However, few studies have
focused on the expression and function of N-cadherin in
cardiomyocytes following a myocardial hypertrophy-induced increase
in the intercellular space.
In the present study, the N-cadherin expression was
investigated based on a myocardial hypertrophy model established by
subcutaneously injecting isoprenaline (ISO) into rats. The
expression and distribution of N-cadherin in the myocardial tissue
were observed to provide morphological data, in addition to
investigating the signal transduction mechanisms of myocardial and
reverse myocardial hypertrophy.
Materials and methods
Establishment of a rat model of
myocardial hypertrophy
The rat model of myocardial hypertrophy was
established as previously described (16). Twenty healthy, adult Sprague-Dawley
rats (10 males and 10 females; weight, 200±20 g) were provided by
the Experimental Animal Center of Xinxiang Medical University
(Henan, China). The rats were randomly divided in two groups with
10 rats per group. The rats in the experimental group were
subcutaneously injected with 8 mg/kg/day ISO (Shanghai Harvest
Pharmaceutical Co. Ltd., Shanghai, China) twice a day for five
consecutive days and observed for 48 h. The rats in the control
group were subcutaneously injected with 2 ml/kg/day of
physiological saline according to the same procedure as the
experimental group. This study was conducted with approval from the
Ethics Committee of Xinxiang Medical University (Xinxiang,
China).
Determination of the myocardial
hypertrophy index
The body weight (BW) of the rats in the two groups
was measured immediately following the observation period. The rats
were narcotized via an intraperitoneal injection of 20% ethyl
carbamate solution (750 mg/kg) and supination and fixation were
performed. Regular shearing and disinfection were conducted and the
chests of the rats were opened to remove the heart. The heart was
subsequently washed with pre-cooled normal saline until the
flushing fluid was not red and clean filter paper was used to
absorb the moisture. The tissues and blood vessels surrounding the
heart were cut and the heart weight (HW) was measured. The left and
right atria, along the coronary artery groove, and the right
ventricular free wall, along the interventricular groove, were
removed and the left ventricular weight (LVW) was measured. HW/BW
and LVW/BW were calculated to determine the extent of myocardial
hypertrophy. Two myocardia (each weighing ~0.3 g) from the left
ventricle were obtained from the two groups of rats. One myocardium
was immediately placed in 4% neutral formaldehyde stationary
liquid, embedded with conventional paraffin, sectioned and
subjected to immunohistochemistry (IHC), hematoxylin and eosin
(H&E) staining and immunofluorescence. The second myocardium
was placed in liquid nitrogen.
H&E staining
The myocardial tissue was embedded in conventional
paraffin and sectioned. Following the standard process of H&E
staining (17), the specimens were
observed under a light microscope (Nikon E400; Shanghai Weihan
Optoelectronic Techonogy Company; Shanghai, China) and the ratio of
myocardial cells to capillaries, the diameter of cardiomyocytes,
cell density, capillary density, intracellular substance and
intercellular space were examined to evaluate the extent of
myocardial hypertrophy.
IHC staining method
The myocardial tissue was embedded in conventional
paraffin and sectioned using an SP-9001 IHC staining kit in
accordance with the manufacturer’s instructions. Primary antibodies
of N-cadherin (1:100; Wuhan Boster Biological Technology Ltd.,
Wuhan, China) were incubated overnight at 4°C and subsequently
incubated at 37°C for 30 min in biotin-labeled IgG and
streptavidin-biotin complex liquid. The specimens were stained with
3,3′-diaminobenzidine and re-dyed with hematoxylin.
Phosphate-buffered saline was used for the negative control
specimens. The specimens were observed under a light microscope and
photographed. Brown reaction granules observed in the cells
indicated a positive result. Six myocardial specimens were obtained
from each group of IHC results, five sections were selected per
specimen and four views were obtained from the selected sections,
which showed uniform myocardial tissue distribution and dyeing. The
results were quantitatively analyzed using a Motic BA400
pathological graphic analysis system (Motic China Group Company,
Guangdong, China; magnification, ×400). The positive expression
area and the average optical density were considered to be key
indicators of N-cadherin.
Immunofluorescence method
The myocardial tissue was embedded in conventional
paraffin and sectioned. Following incubation with 3%
H2O2, antigen microwave repair and serum were
incubated at 37°C for 30 min. The specimens were then incubated
with rabbit anti-rat N-cadherin polyclonal antibody at 37°C for 1
h. The specimens were subsequently incubated with fluorescein
isothiocyanate-labeled goat anti-rabbit IgG at 37°C for 1 h and
nuclear staining was conducted using 4′,6-diamidino-2-phenylindole
(DAPI) for 5–8 min. The specimens were then sealed with glycerol
and observed under an FV1000 confocal microscope (Olympus; Shanghai
Weihan Optoelectronic Techonogy Company).
Reverse transcription polymerase chain
reaction (RT-PCR)
The heart tissue was removed from the liquid
nitrogen and total RNA was extracted using an AxyPrep total RNA
preparation kit (Zhengzhou Baosai Biology Technology Company,
Zhengzhou, China) in accordance with the manufacturer’s
instructions. Ultraviolet (UV) absorbance at 260 and 280 nm was
determined using a UVmini-1240 UV spectrophotometer (Zhengzhou
Baosai Biology Technology Company, Zhengzhou China) and the RNA
integrity was detected by 1% agarose gel electrophoresis. The
N-cadherin primer sequences were designed using Primer 5 primer
design software (Table I).
 | Table IOligonucleotide primers of N-cadherin
and β-actin. |
Table I
Oligonucleotide primers of N-cadherin
and β-actin.
| Gene | Sense | Antisense | Product (bp) |
|---|
| N-cadherin |
tgttgctgcagaaaaccaag |
tttcacaagtctcggcctct | 460 |
| β-actin |
cacccgcgagtacaaccttc |
cccatacccaccatcacacc | 206 |
The primers were synthesized by the GeneGenius Agar
imaging analysis system (Syngene, Frederick, MD, USA), purified via
the PAGE method, dissolved in RNase-free water to 100 μmol/l and
preserved at −70°C for later use. First-strand cDNA was synthesized
using an M-MLV reverse transcription kit kit (Zhengzhou Baosai
Biology Technology Company) according to the manufacturer’s
instructions. The N-cadherin was amplified and the amplification
reaction was recorded in a single system using β-actin as an
internal reference. The reaction conditions used were initial
denaturation at 95°C for 5 min, loop degeneration at 94°C for 30
sec, renaturation at 55°C for 30 sec and extension at 72°C for 10
min. The PCR products were electrophoresed in 1.5% agarose gel
(containing ethidium bromide with a 0.5-mg/ml final concentration).
The GeneGenius Agar imaging analysis system (Syngene, Frederick,
MD, USA) and Gelworks 10 software were used to scan and record the
results. The gray value ratios of target fragment/β-actin were
calculated by semi-quantitative analysis.
Statistical analysis
Data were presented as mean ± standard deviation.
The gray value ratios of N-cadherin/β-actin were calculated and
analyzed in pairs using SPSS 14.0 (SPSS Inc., Chicago, IL, USA) via
variance analysis.
Results
Determination of the myocardial
hypertrophy index
The experimental group exhibited an increase in
HW/BW and LVW/BW based on the myocardial hypertrophy index
analysis, compared with the control group (P<0.05 and P<0.01;
Table II).
| Table IIIndex of the rat model of cardiac
hypertrophy (mean ± standard deviation). |
Table II
Index of the rat model of cardiac
hypertrophy (mean ± standard deviation).
| Groups | No. of rats | HW/BW (mg/g) | LVW/BW (mg/g) |
|---|
| Control | 10 | 6.150±0.619a | 4.309±0.482b |
| Experimental | 10 | 4.388±0.308 | 2.081±0.196 |
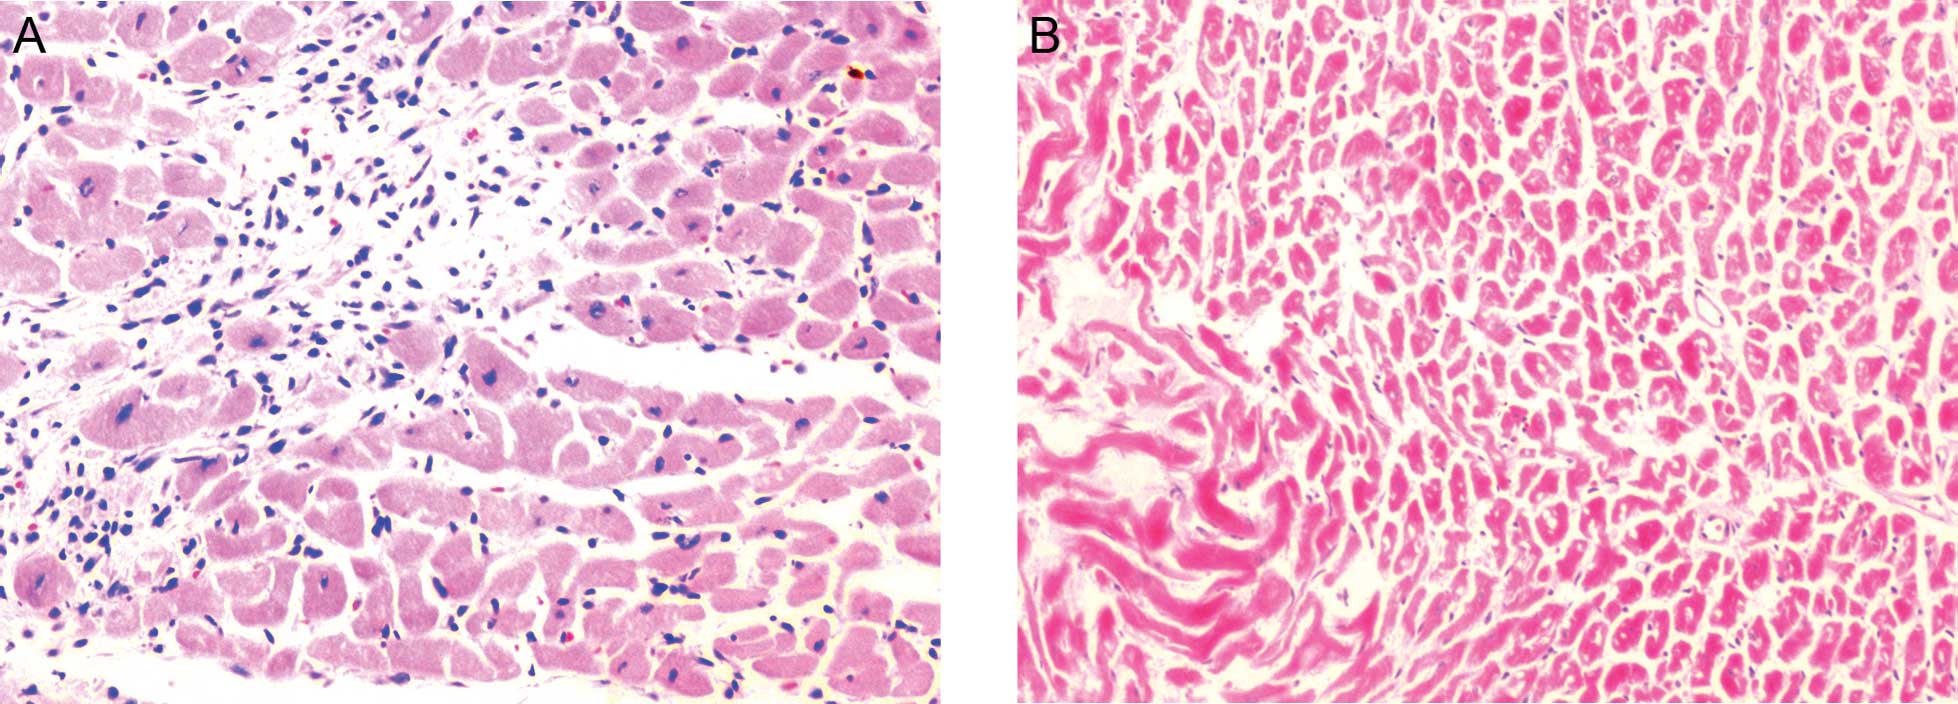
Myocardial histopathology results
Even staining of the cardiomyocytes was observed in
the control group specimens in addition to a neat arrangement with
clearly visible stripes. However, the cardiomyocytes in the
experimental group exhibited varying sizes and stained unevenly.
Furthermore, increases in the cell diameter, intercellular space
and nuclear size were observed, however, the density of the cell
and blood capillaries decreased, compared with the cardiomyocytes
in the control group. Nuclear vacuolation was also observed in the
experimental group (Fig. 1).
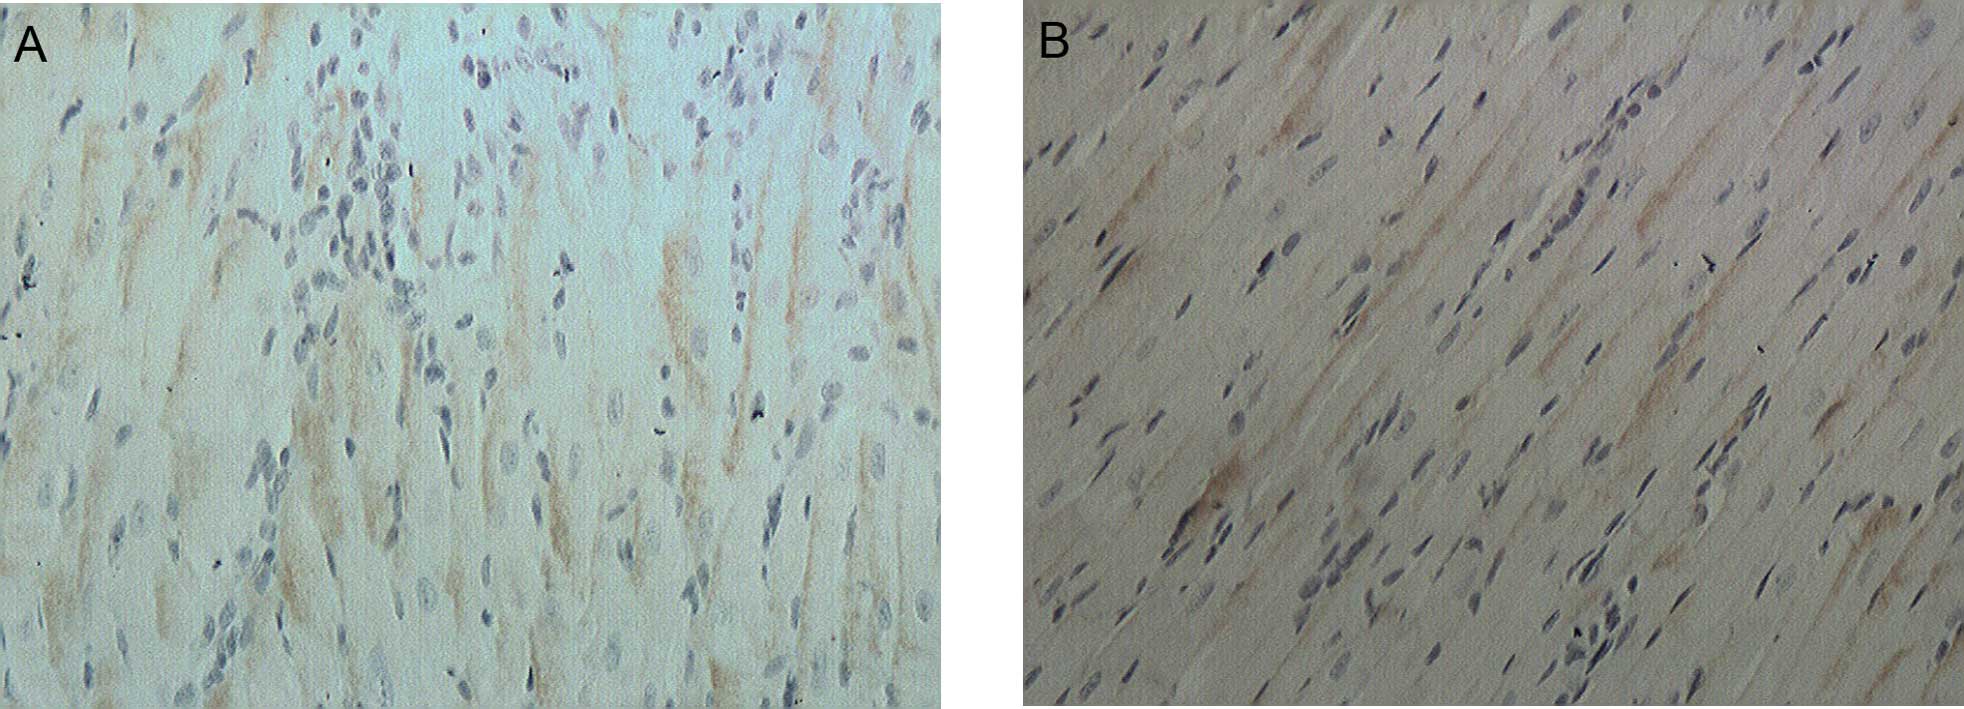
IHC results
The expression of N-cadherin in the intercellular
space of the myocardial cells was positive yet weak, and
understained brown stripes were observed in the control and
experimental groups (Fig. 2). No
statistically significant difference was identified between the
control and experimental groups in the positively expressed areas
and the average optical density of N-cadherin (Table III).
| Table IIIComparison of the average area and
brightness of N-cadherin expression in the myocardium (mean ±
standard deviation). |
Table III
Comparison of the average area and
brightness of N-cadherin expression in the myocardium (mean ±
standard deviation).
| Groups | No. of rats | Average
brightness | Average area |
|---|
| Experimental | 10 | 0.51±0.02a | 127±5a |
| Control | 10 | 0.48±0.02 | 122±6 |
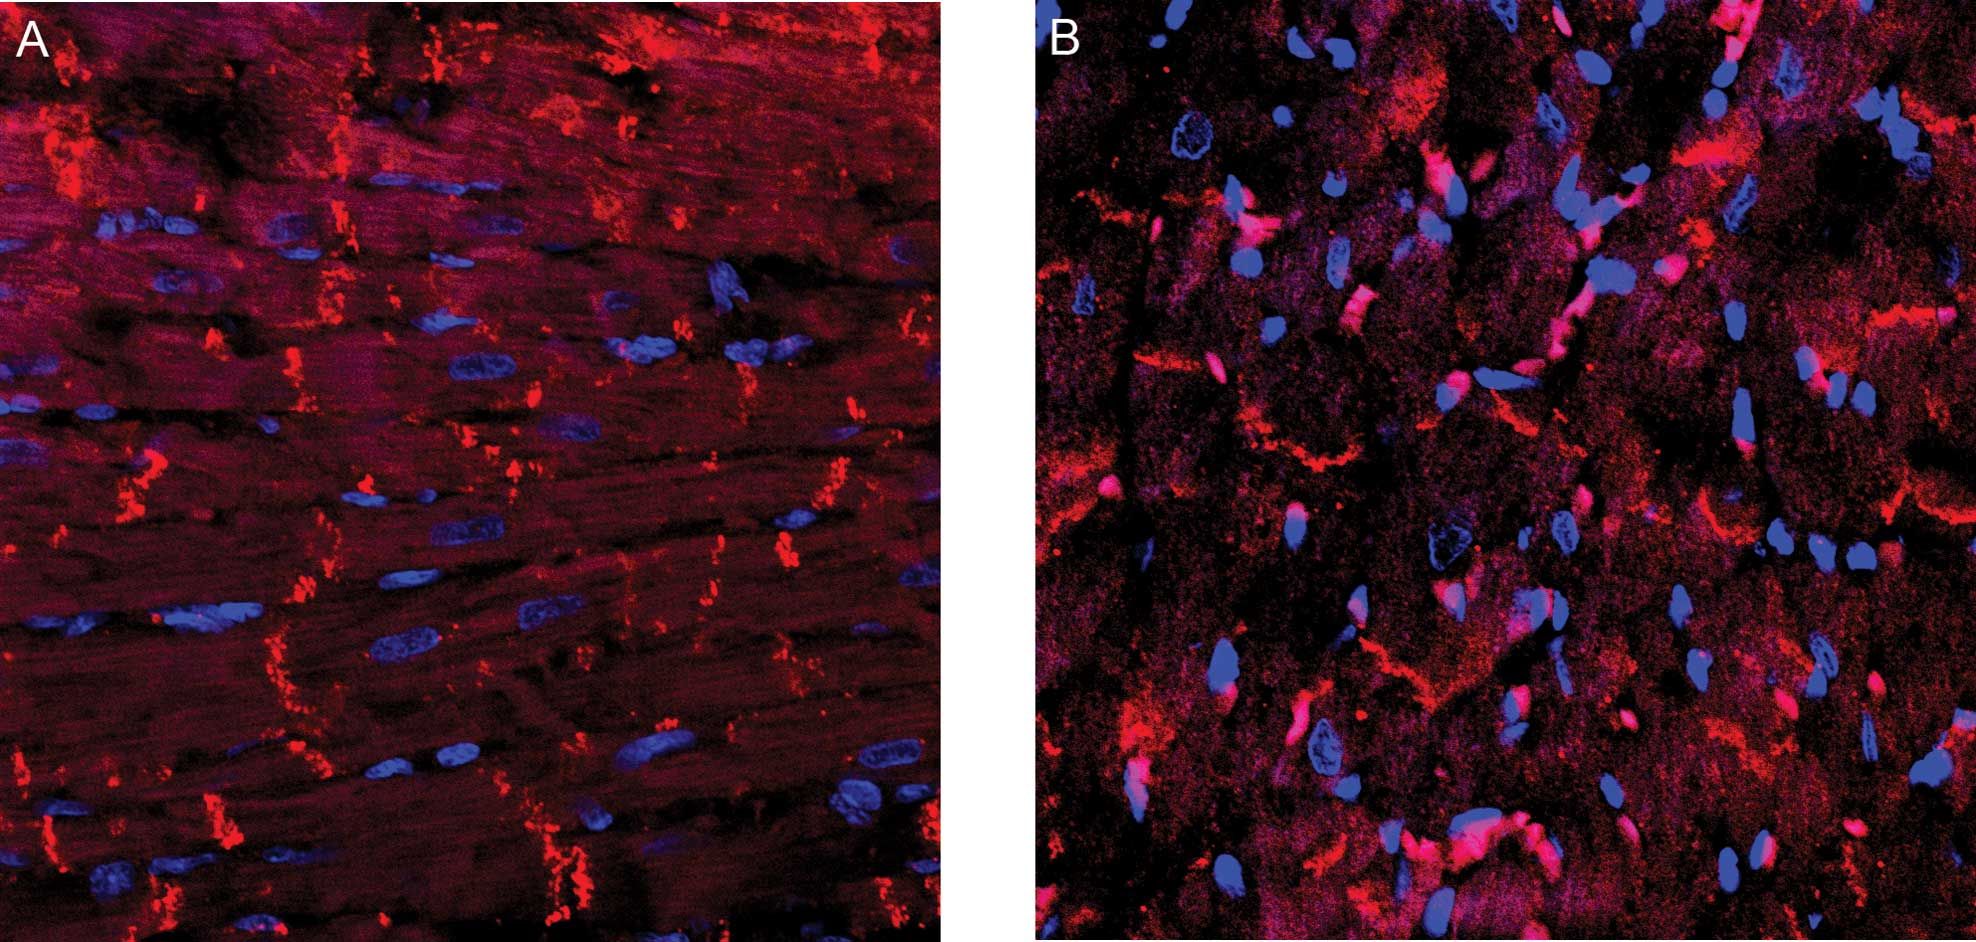
Immunofluorescence results
Following staining with Rabbit anti-rat N cadherin
(Beijing Zhongshan Jinqiao Biological Technology Company, Beijing,
China) and DAPI, the N-cadherin protein was labeled red and the
nucleus of the myocardial cells was stained blue. The results
showed that N-cadherin was predominantly expressed in the
intercalated disk of the myocardium, with a small number of cells
showing a positive expression and very few cells showing a strongly
positive expression (Fig. 3).
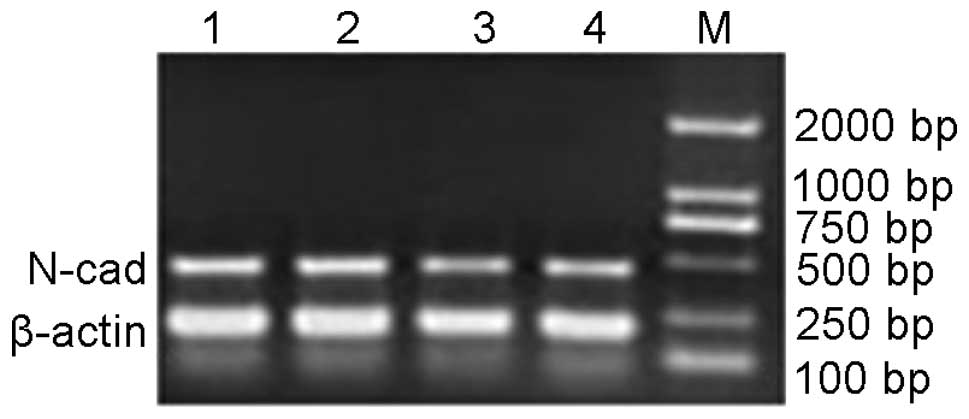
RT-PCR amplification of N-cadherin
Unique bands were observed at 400–500 bp in the
experimental and control groups (Fig.
4). The gray value ratios of N-cadherin/β-actin were calculated
and analyzed in pairs using SPSS 14.0 (SPSS Inc., Chicago, IL, USA)
via variance analysis. No statistically significant differences
were found between the control and experimental groups with regard
to the abundance of N-cadherin mRNA.
Discussion
Myocardial hypertrophy is a normal adjustment in
response to wall stress resulting from an increased cardiac load
(1,2). The pathogenesis of myocardial
hypertrophy has been a controversial topic in the study of
cardiovascular diseases (18,19).
However, no clear conclusions have been determined.
Cadherins are a superfamily of adhesion molecules
that mediate Ca2+-dependent cell-to-cell adhesion in all
of the solid tissues of an organism. The recent increase in genomic
sequencing of the DNA of various animals has revealed novel
information regarding the diversity of the cadherin superfamily
(11–15). In humans, >80 members of the
cadherin superfamily have been sequenced (20). The analysis of proteins and cDNA
sequences has revealed that different cadherins are comparable in
their overall primary structure; their mature forms consist of
723–748 amino acids and have a single transmembrane domain, which
divides the molecules into the N-terminal extracellular domain and
the C-terminal cytoplasmic domain. The cytoplasmic domain of
cadherins is associated with cytoplasmic protein catenins, which
serve as intermediate links between the cadherins and the actin
filaments (21,22).
Currently, the analysis of cadherins emphasizes the
similarities between embryonic and neural morphogenesis. Cadherins
have emerged as the predominant group of cell-to-cell adhesion
molecules involved in embryonic morphogenesis, determining cell and
tissue architecture in addition to controlling the dynamic changes
in cell shape and position (13,23,24).
However, the role of N-cadherin in myocardial hypertrophy remains
to be determined. Therefore, in the present study, an ISO-induced
myocardial hypertrophy model was established. IHC,
immunofluoresence and RT-PCR were performed to investigate the
changes of distribution, protein expression and the abundance of
N-cadherin mRNA.
In conclusion, the IHC and immunofluorescence
results indicated that there was no statistically significant
difference between the experimental and control groups in the
positive expression of N-cadherin. Furthermore, mRNA expression of
N-cadherin within the myocardial tissues of rats was consistent
with the IHC and immunofluorescence results. Based on these
results, it was hypothesized that the N-cadherin adhesion molecule
may enhance cell-to-cell contact and provide a sufficient membrane
connection area between cells, which enables the heart to maintain
its physical structure and mechanical function. N-cadherin may,
therefore, be essential to the survival of the heart.
Acknowledgements
The present study was supported by the Science and
Technology Foundation (Henan, China; grant nos. 122102310195,
12A180022 and 09S081).
References
|
1
|
de Simone G, Devereux RB, Celentano A and
Roman MJ: Left ventricular chamber and wall mechanics in the
presence of concentric geometry. J Hypertens. 17:1001–1006.
1999.PubMed/NCBI
|
|
2
|
de Simone G, Greco R, Mureddu G, Romano C,
Guida R, Celentano A and Contaldo F: Relation of left ventricular
diastolic properties to systolic function in arterial hypertension.
Circulation. 101:152–157. 2000.PubMed/NCBI
|
|
3
|
Swynghedauw B, Delcayre C, Samuel JL,
Mebazaa A and Cohen-Solal A: Molecular mechanisms in evolutionary
cardiology failure. Ann N Y Acad Sci. 1188:58–67. 2010. View Article : Google Scholar : PubMed/NCBI
|
|
4
|
Ashrafian H, Frenneaux MP and Opie LH:
Metabolic mechanisms in heart failure. Circulation. 116:434–448.
2007. View Article : Google Scholar
|
|
5
|
Yan L, Wei X, Tang QZ, et al:
Cardiac-specific mindin overexpression attenuates cardiac
hypertrophy via blocking AKT/GSK3β and TGF-β1-Smad signalling.
Cardiovasc Res. 92:85–94. 2011.PubMed/NCBI
|
|
6
|
Frey N, Katus HA, Olson EN and Hill JA:
Hypertrophy of the heart: a new therapeutic target? Circulation.
109:1580–1589. 2004. View Article : Google Scholar : PubMed/NCBI
|
|
7
|
Levy D, Garrison RJ, Savage DD, Kannel WB
and Castelli WP: Prognostic implications of echocardiographically
determined left ventricular mass in the Framingham Heart Study. N
Engl J Med. 322:1561–1566. 1990. View Article : Google Scholar : PubMed/NCBI
|
|
8
|
Satoh M, Ogita H, Takeshita K, Mukai Y,
Kwiatkowski DJ and Liao JK: Requirement of Rac1 in the development
of cardiac hypertrophy. Proc Natl Acad Sci USA. 103:7432–7437.
2006. View Article : Google Scholar : PubMed/NCBI
|
|
9
|
Olson EN and Schneider MD: Sizing up the
heart: development redux in disease. Genes Dev. 17:1937–1956. 2003.
View Article : Google Scholar : PubMed/NCBI
|
|
10
|
Molkentin JD and Dorn GW II: Cytoplasmic
signaling pathways that regulate cardiac hypertrophy. Annu Rev
Physiol. 63:391–426. 2001. View Article : Google Scholar : PubMed/NCBI
|
|
11
|
Gumbiner BM: Cell adhesion: the molecular
basis of tissue architecture and morphogenesis. Cell. 84:345–357.
1996. View Article : Google Scholar : PubMed/NCBI
|
|
12
|
Ivanov DB, Philippova MP and Tkachuk VA:
Structure and functions of classical cadherins. Biochemistry
(Mosc). 66:1174–1186. 2001. View Article : Google Scholar : PubMed/NCBI
|
|
13
|
Yagi T and Takeichi M: Cadherin
superfamily genes: functions, genomic organization, and neurologic
diversity. Genes Dev. 14:1169–1180. 2000.PubMed/NCBI
|
|
14
|
Tepass U: Genetic analysis of cadherin
function in animal morphogenesis. Curr Opin Cell Biol. 11:540–548.
1999. View Article : Google Scholar : PubMed/NCBI
|
|
15
|
Zhong Y, Brieher WM and Gumbiner BM:
Analysis of C-cadherin regulation during tissue morphogenesis with
an activating antibody. J Cell Biol. 144:351–359. 1999. View Article : Google Scholar : PubMed/NCBI
|
|
16
|
Langeggen H, Berge KE, Johnson E and
Hetland G: Human umbilical vein endothelial cells express
complement receptor 1 (CD35) and complement receptor 4 (CD11c/CD18)
in vitro. Inflammation. 26:103–110. 2002. View Article : Google Scholar : PubMed/NCBI
|
|
17
|
de Carvalho HF and Taboga SR: Fluorescence
and confocal laser scanning microscopy imaging of elastic fibers in
hematoxylin-eosin stained sections. Histochem Cell Biol.
106:587–592. 1996.PubMed/NCBI
|
|
18
|
Sommers CL: The role of cadherin-mediated
adhesion in breast cancer. J Mammary Gland Biol Neoplasia.
1:219–229. 1996. View Article : Google Scholar : PubMed/NCBI
|
|
19
|
Chaklader M, Pan A, Law A, Chattopadhayay
S, Chatterjee R and Law S: Differential remodeling of cadherins and
intermediate cytoskeletal filaments influence microenvironment of
solid and ascitic sarcoma. Mol Cell Biochem. 382:293–306. 2013.
View Article : Google Scholar
|
|
20
|
Tepass U, Truong K, Godt D, Ikura M and
Peifer M: Cadherins in embryonic and neural morphogenesis. Nat Rev
Mol Cell Biol. 1:91–100. 2000. View
Article : Google Scholar
|
|
21
|
Rosales C and Juliano RL: Signal
transduction by cell adhesion receptors in leukocytes. J Leukoc
Biol. 57:189–198. 1995.PubMed/NCBI
|
|
22
|
Suzuki ST: Structural and functional
diversity of cadherin superfamily: are new members of cadherin
superfamily involved in signal transduction pathway? J Cell
Biochem. 61:531–542. 1996. View Article : Google Scholar
|
|
23
|
Takeichi M: Cadherin cell adhesion
receptors as a morphogenetic regulator. Science. 251:1451–1455.
1991. View Article : Google Scholar : PubMed/NCBI
|
|
24
|
Uemura T: The cadherin superfamily at the
synapse: more members, more missions. Cell. 93:1095–1098. 1998.
View Article : Google Scholar : PubMed/NCBI
|