Introduction
Gastrointestinal stromal tumors (GISTs), a type of
common gastrointestinal mesenchymal tumor, account for 1–4% of
gastroenteric tumors and 60% of GISTs occur in the stomach.
Clinical features, pathology, immunophenotype and genetic features
of GISTs have been elucidated, but the pathogenesis, biological
behaviors and treatment remain unclear (1). Therefore, the control of tumor
invasion and metastasis remains a major challenge in the treatment
of GIST (2,3).
Tissue factor pathway inhibitor-2 (TFPI-2)
expression is downregulated in a variety of tumors, and is
associated with tumor invasion and metastasis (4,5). In
the present study, TFPI-2 expression was detected in gastric
stromal tumors using immunohistochemistry, RT-PCR and western
blotting, and the correlation of TFPI-2 expression with the
invasion and metastasis of gastric stromal tumors was explored. The
results are likely to provide novel insight into the treatment of
gastric stromal tumors.
Materials and methods
All study methods were approved by the Ethics
Committee of the First Affiliated Hospital, Liaoning Medical
University (Jinzhou, China). All the subjects enrolled into the
study provided written formal consent prior to participation.
Clinical data
Between January 2006 and April 2012, 72 patients
presenting with gastric stromal tumors were enrolled in this study.
Of the 72 patients, 35 were men and 37 were women, with a median
age of 56.4 years (range, 33–78 years). During surgery, 72 samples
of tumor tissue, peritumoral tissue (within 3 cm of the tumor edge)
and gastric normal tissue (3 cm from the tumor edge) were collected
from the 72 patients and stored at −80°C for future use. The
diagnostic criteria for gastric stromal tumor were as follows: i)
Conventional morphology is in line with GIST characteristics and
immunohistochemical analysis indicates positive CD117 staining; ii)
conventional morphology is in line with CIST characteristics,
although CD117 is negative, there is c-kit or PDGFRA gene mutation;
iii) conventional morphology is in line with CIST characteristics,
although CD117 is negative and there is no c-kit or PDGFRA gene
mutation, other tumors including smooth muscle tumor, fibromatosis
and neurogenic tumor may be excluded (6). Gastric stromal tumors in this study
were evaluated according to NIH grading standards established by
Fletcher et al(7) based on
GIST biological behaviors. Tumors with a diameter of <2 cm and
karyokinesis ≤5/50 high power fields (HPF) were classed as a very
low-invasion risk (grade I); tumors with a diameter of ≥2,<5 cm
and karyokinesis ≤5/50 HPF were classed as a low-invasion risk
(grade II); tumors with a diameter of ≥5,<10 cm and karyokinesis
≤5/50 HPF or tumors with a diameter <5 cm and karyokinesis of
6–10/50 HPF were classed as a moderate-invasion risk (grade III);
tumors with a diameter ≥5 cm and karyokinesis >5/50 HPF or
tumors with a diameter ≥10 cm or karyokinesis >10/50 HPF were
classified as a high-invasion risk (grade IV).
Detection of TFPI-2 protein expression by
immunohistochemistry
The samples were embedded in paraffin, sectioned at
a thickness of 4 μm and stained with immunohistochemistry S-P kit
provided by Beijing Bioss Biosynthesis Biotechnology Co., Ltd. The
primary antibody of TFPI-2, provided by Beijing Biosynthesis
Biotechnology Co., Ltd., was diluted to 1:400. The scoring for the
immunostaining intensity of positive cells was as follows: 0,
colorless; 1, light yellow; and 2, brown-yellow or brown. The
scoring for the percentage of positive cells was as follows: 0,
<5%; 1, 5–9%; 2, 10–19%; 3, 20–49%; and 4, ≥50%.
Immunohistochemical staining index = score from the rate of
positive cells × score from staining intensity of positive cells.
Immunohistochemical staining index scores of ≤2 were regarded as
negative (−) and scores of ≥3 as positive (+).
RNA extraction
The tissue was made into powders and then placed in
an Eppendorf tube. TRIzol fluid was added at a ratio of 1 ml
(trizol fluid) : 100 mg (tissue). After homogenization, 0.2 ml of
chloroform was added followed by centrifugation at 3,800 × g for 15
min. The supernatant was placed in another Eppendorf tube and then
0.5 ml of isopropanol was added. Ten minutes later, the tube
underwent centrifugation at 3,800 × g for 15 min followed by
removal of supernatant.
Detection of TFPI-2 mRNA expression by
RT-PCR
Total RNA was extracted from each sample and 2 μg
total RNA was used in RT-PCR. The upstream and downstream primers
of TFPI-2 and β-actin were synthesized by Sangon Co., Ltd
(Shanghai, China). The upstream and downstream primers of TFPI-2
were 5′-TCTGCCAATGTGACTCGCTAT-3′ and 5′-TATTGTCATTCCCTCCACAGC-3′,
respectively, with a synthetic product length of 88 bp. The
upstream and downstream primers of β-actin were
5′-CTGGGACGACATGGAGAAAA-3′ and 5′-AAGGAAGGCTGGAAGAGTGC-3′,
respectively, with a synthetic product length of 216 bp. RT-PCR
conditions were as follows: reverse transcription at 50°C for 30
min, inactivation of reverse transcriptase at 94°C for 2 min,
denaturing at 94°C for 30 sec, reannealing at 56°C for 30 sec and
elongation at 72°C for 1 min, 30 cycles. Finally, the PCR products
were subjected to 2% agarose gel electrophoresis.
Detection of TFPI-2 protein expression by
western blotting
The samples (200 mg) were placed into a homogenizer
and cut into small pieces. Thirty minutes after the addition of 400
μl protein lysate, the sample was centrifuged at 3,800 × g for 5
min. The supernatant was placed in a 0.5-ml centrifuge tube and
boiled for 5 min following the addition of buffer. The supernatant
underwent SDS-PAGE (stacking gel with 80 V and separating gel with
150 V) and was transferred onto a 0.45 μm-PVDF membrane followed by
sealing with 5% dried skimmed milk for one hour. Rabbit anti-human
TFPI-2 and β-actin antibodies (Beijing Bioss Biosynthesis
Biotechnology Co., Ltd.; Beijing, China) were added at 4°C
overnight. After washing the membrane, horseradish
peroxidase-labeled secondary antibodies (1:1,000; Beijing Bioss
Biosynthesis Biotechnology Co., Ltd.) were added at room
temperature for 60 min. The membrane was then washed, and
coloration was performed. Coloration was performed with an enhanced
chemiluminescence detection kit purchase from BestBio (Shanghai,
China). The levels of protein expression were quantified through
the fluorescent scanning for blotting membrane and analysis of
molecular weights and optical density values of target bands with
gel image processing system (Syngene, Frederick, MD, USA).
Statistical analysis
Statistical analysis was performed with SPSS version
16.0 software (SPSS, Inc., Chicago, IL, USA). Measurement data were
expressed as mean ± SD. A Student’s t-test was used in comparisons
between two groups and one-factor analysis of variance was used in
comparisons among multiple groups. A χ2 test was used in
comparisons between enumeration data. P<0.05 was considered to
indicate a statistically significant result.
Results
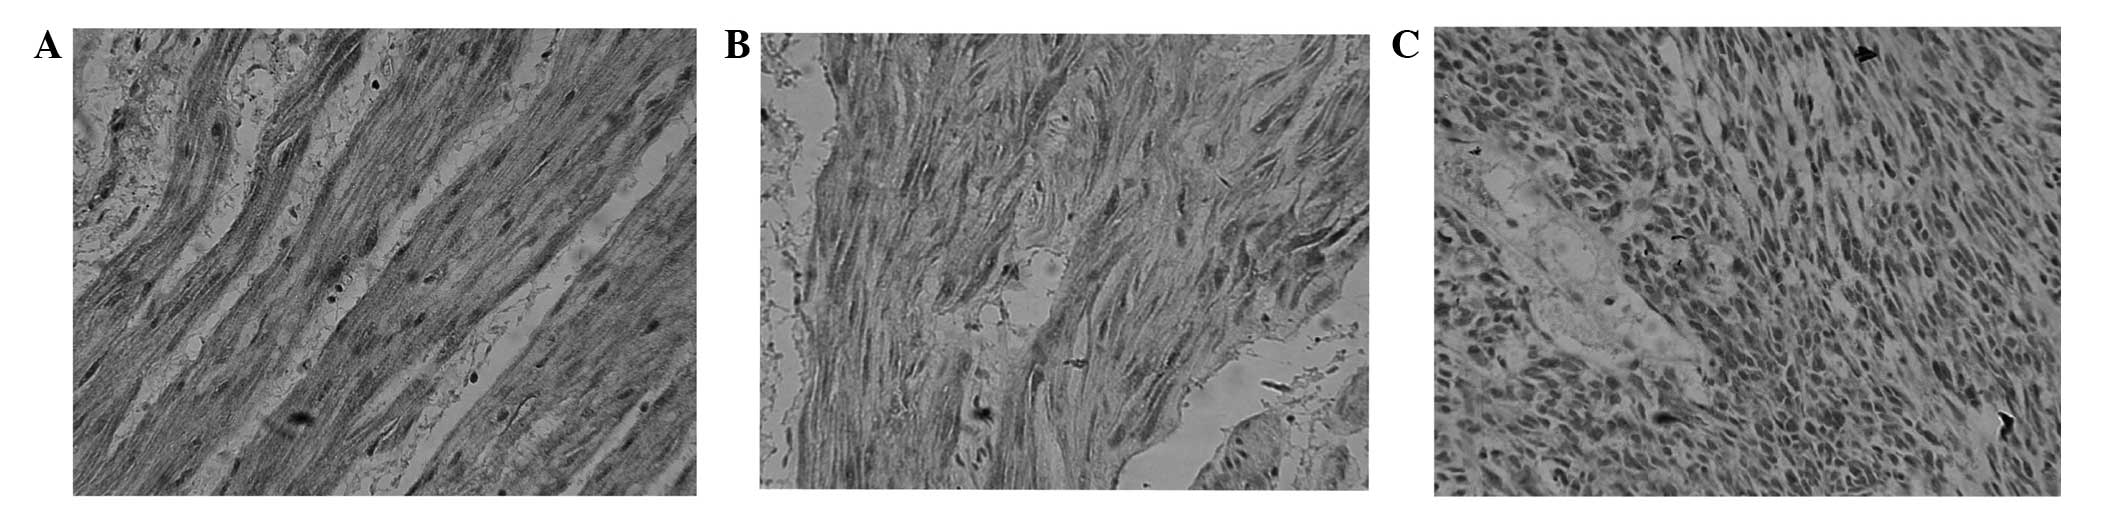
Immunohistochemical staining
TFPI-2 protein was mainly located in the cytoplasm
as brown or yellow stained particles. TFPI-2 protein expression was
present in the tumor, peritumoral and gastric normal tissues, but
TFPI-2 protein expression was stronger in gastric normal tissue
than in peritumoral tissue and tumor tissue, and stronger in
peritumoral tissue than in gastric normal tissue (Fig. 1). No significant difference was
identified in the frequency of a negative TFPI-2
immunohistochemical staining result between male and female
patients or between different age groups, but there was a
statistically significant difference between the patients with and
without tumor invasion or metastasis (P<0.05, Table I).
 | Table ICorrelation between TFPI-2 protein
expression and clinical features of gastric stromal tumor. |
Table I
Correlation between TFPI-2 protein
expression and clinical features of gastric stromal tumor.
| | TFPI-2 protein
expression, n (%) | | |
|---|
| |
| | |
|---|
| Characteristics | n | Negative | Positive | χ2 | P-value |
|---|
| Gender |
| Male | 35 | 23 (65.71) | 12 (34.29) | 0.45 | 0.50 |
| Female | 37 | 27 (72.97) | 10 (27.03) | | |
| Age (years) |
| <55 | 27 | 20 (74.07) | 7 (25.93) | 0.44 | 0.51 |
| ≥55 | 45 | 30 (66.67) | 15 (33.33) | | |
| Invasion or
metastasis |
| Yes | 20 | 18 (90.00) | 2 (10.00)a | 5.51 | 0.02 |
| No | 52 | 32 (61.54) | 20 (38.46) | | |
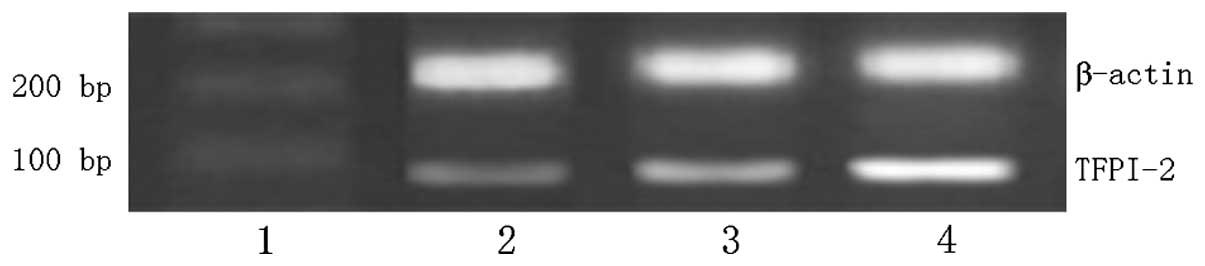
TFPI-2 mRNA expression
The expression level of TFPI-2 mRNA was
significantly increased in gastric normal tissue and peritumoral
tissue compared with that in tumor tissue (P<0.01; Fig. 2 and Table II). As the NIH grade increased,
TFPI-2 mRNA expression was downregulated (P<0.01). No
statistically significant difference was identified in TFPI-2 mRNA
expression between male and female patients, or between different
age groups. However, there was a statistically significant
difference in the level of TFPI-2 mRNA expression between the
patients with and without tumor invasion or metastasis (P<0.05;
Table III).
| Table IImRNA and protein expression of TFPI-2
in tumor, peritumoral and gastric normal tissues. |
Table II
mRNA and protein expression of TFPI-2
in tumor, peritumoral and gastric normal tissues.
| Tissue (n=72) | TFPI-2 mRNA
expression (relative OD value) | F-value | P-value | TFPI-2 protein
expression (relative OD value) | F-value | P-value |
|---|
| Tumor | 0.3943±0.1046a,b | 18.15 | <0.01 | 0.2363±0.0890a,b | 17.56 | <0.01 |
| Peritumoral | 0.5479±0.0871a | | | 0.3795±0.0494a | | |
| Normal | 0.6386±0.1023 | | | 0.4927±0.0606 | | |
| Table IIICorrelation of TFPI-2 expression in
tumor tissue with clinicopathologic characteristics. |
Table III
Correlation of TFPI-2 expression in
tumor tissue with clinicopathologic characteristics.
| Characteristics | n | TFPI-2 mRNA
expression (relative OD value) | t- or F-value | P-value | TFPI-2 protein
expression (relative OD value) | t- or F-value | P-value |
|---|
| Gender |
| Male | 35 | 0.3698±0.1246 | 1.027 | 0.32 | 0.2189±0.0899 | 0.837 | 0.41 |
| Female | 37 | 0.4175±0.0753 | | | 0.2528±0.0844 | | |
| Age (years) |
| <55 | 27 | 0.4038±0.1151 | 0.303 | 0.76 | 0.2642±0.0880 | 1.146 | 0.27 |
| ≥55 | 45 | 0.3886±0.1026 | | | 0.2196±0.0879 | | |
| NIH grade |
| I | 20 | 0.5231±0.0581 | 15.418 | <0.01 | 0.3438±0.0482 | 14.706 | <0.01 |
| II | 12 | 0.4429±0.0599 | | | 0.2961±0.0381 | | |
| III | 9 | 0.3705±0.0764a,b | | | 0.2020±0.0453a,b | | |
| IV | 31 | 0.2993±0.0437a,c | | | 0.1538±0.0466a,c | | |
| Invasion or
metastasis |
| Yes | 20 | 0.3236±0.0627d | 2.779 | 0.01 | 0.1825±0.0472d | 2.368 | 0.03 |
| No | 52 | 0.4215±0.1012 | | | 0.2570±0.0968 | | |
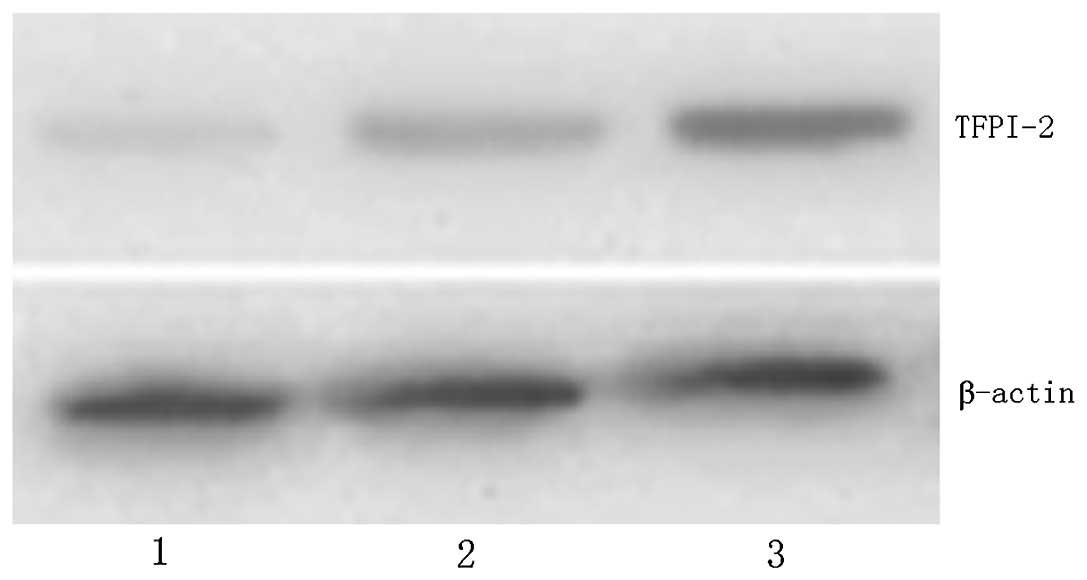
TFPI-2 protein expression
The expression level of TFPI-2 protein was
significantly increased in gastric normal and peritumoral tissues
compared with that in tumor tissue, (P<0.01; Fig. 3 and Table II). With the increase in NIH
grade, TFPI-2 protein expression was downregulated (P<0.01). No
statistically significant difference was identified in TFPI-2
protein expression between male and female patients, or between
different age groups. However, there was a statistically
significant difference in the level of TFPI-2 protein expression
between the patients with and without tumor invasion or metastasis
(P<0.05; Table III).
Discussion
At present, the evaluation of the degree of
malignancy in GIST is mainly based on tumor size and the number of
karyokineses. In the present study, according to the GIST grading
scheme established by Fletcher et al(7), gastric stromal tumors were divided
into the categories of very low-invasion risk (grade I),
low-invasion risk (grade II), moderate-invasion risk (grade III)
and high-invasion risk (grade IV). The results indicated that there
was a significant difference in TFPI-2 expression between tumor,
peritumoral and gastric normal tissues, and between tumors of
different grades. TFPI-2 expression was observed to be
significantly decreased in the patients with tumor invasion or
metastasis.
TFPI-2, a type of serine proteinase inhibitor,
effectively inhibits the activities of numerous proteolytic
enzymes, including matrix metalloproteinases, fibrinogenase,
trypsin, chymotrypsin and cathepsin. TFPI-2 is able to inhibit the
growth, invasion and metastasis of glioma (8), lung cancer (9), prostate cancer (10), laryngeal cancer (11) and pancreatic cancer (12).
The results of the present study indicate that
TFPI-2 expression was inhibited in the gastric tumor and
peritumoral tissues, suggesting that the inhibition of TFPI-2
expression may decrease the stability of the extracellular matrix.
The results also indicated that as the NIH grade increased, the
level of TFPI-2 expression was decreased, and a statistically
significant difference was identified in TFPI-2 expression levels
between tumors with and without invasion or metastasis. This
suggests that low expression of TFPI-2 may promote the growth,
invasion or metastasis of gastric stromal tumors with a poor
prognosis. A possible mechanism of action for TFPI-2 protein, the
TFPI-2 gene expression product, is inhibition of the activities of
numerous proteolytic enzymes and a subsequent reduction of their
damaging effects on the extracellular matrix. Proteolytic enzymes
secreted by tumor cells are involved in the degradation of the
extracellular matrix, which is the key step of tumor invasion or
metastasis. A previous study indicated that TFPI-2 gene expression
inhibits the growth of choriocarcinoma by inducing choriocarcinoma
cell apoptosis (13). The
mechanism by which TFPI-2 expression inhibits gastric stromal
tumors requires further study.
In summary, the TFPI-2 gene may play an important
role in the invasion and metastasis of gastric stromal tumors. This
finding is likely to prompt novel ideas for judging the degree of
malignancy of gastric stromal tumors, predicting invasion or
metastasis and evaluating the prognosis of patients with gastric
stromal tumors.
Acknowledgements
This study was supported by a Project of the Young
Science and Technology Foundation from the First Clinical College
of Liaoning Medical College (FY2011-09).
References
|
1
|
Chen G: New research progress in
gastrointestinal stromal tumors. Medical Recapitulate.
16:2152–2155. 2010.(In Chinese).
|
|
2
|
Wei Z-G, Han C and Li J-D: Diagnosis and
treatment of gastrointestinal stromal tumors. World Chinese Journal
of Digestology. 18:65–69. 2010.(In Chinese).
|
|
3
|
Shi Y-Q: Status of surgical treatment in
recurrent and metastatic gastrointestinal stromal tumors. Chinese
Journal of Practical Surgery. 30:257–259. 2010.(In Chinese).
|
|
4
|
Nobeyama Y, Okochi-Takada E, Furuta J, et
al: Silencing of tissue factor pathway inhibitor-2 gene in
malignant melanomas. Int J Cancer. 121:301–307. 2007. View Article : Google Scholar : PubMed/NCBI
|
|
5
|
Yanamandra N, Kondraganti S, Gondi CS, et
al: Recombinant adeno-associated virus (rAAV) expressing TFPI-2
inhibits invasion, angiogenesis and tumor growth in a human
glioblastoma cell line. Int J Cancer. 115:998–1005. 2005.
View Article : Google Scholar
|
|
6
|
GIST Group in China. Experts consensus of
standard diagnosis and treatment in GIST in China (version 2008).
Chinese Clinical Oncology. 14:746–754. 2009.(In Chinese).
|
|
7
|
Fletcher CD, Berman JJ, Corless C, et al:
Diagnosis of gastrointestinal stromal tumors: a consensus approach.
Int J Surg Pathol. 10:81–89. 2002. View Article : Google Scholar : PubMed/NCBI
|
|
8
|
Gessler F, Voss V, Seifert V, et al:
Knockdown of TFPI-2 promotes migration and invasion of glioma
cells. Neurosci Lett. 497:49–54. 2011. View Article : Google Scholar : PubMed/NCBI
|
|
9
|
Gaud G, Iochmann S, Guillon-Munos A, et
al: TFPI-2 silencing increases tumour progression and promotes
metalloproteinase 1 and 3 induction through tumour-stromal cell
interactions. J Cell Mol Med. 15:196–208. 2011. View Article : Google Scholar : PubMed/NCBI
|
|
10
|
Ma S, Chan YP, Kwan PS, et al:
MicroRNA-616 induces androgen-independent growth of prostate cancer
cells by suppressing expression of tissue factor pathway inhibitor
TFPI-2. Cancer Res. 71:583–592. 2011. View Article : Google Scholar
|
|
11
|
Sun Y-N, Liu M, Jin D-J and Xiao Y-L:
Correlation of TFPI-2 gene expression with invasion, metastasis,
and prognosis of supraglottic carcinoma. Tumor. 28:40–43. 2008.(In
Chinese).
|
|
12
|
Tang Z, Geng G, Huang Q, et al: Expression
of tissue factor pathway inhibitor 2 in human pancreatic carcinoma
and its effect on tumor growth, invasion, and migration in vitro
and in vivo. J Surg Res. 167:62–69. 2011. View Article : Google Scholar : PubMed/NCBI
|
|
13
|
Zhou Q, Xiong Y, Chen Y, et al: Effects of
tissue factor pathway inhibitor-2 expression on biological behavior
of BeWo and JEG-3 cell lines. Clin Appl Thromb Hemost. 18:526–533.
2012. View Article : Google Scholar : PubMed/NCBI
|