Introduction
The etiology of diabetic cardiomyopathy (DC) can not
be explained by hypertensive, coronary or valvular heart disease,
or other cardiac lesions. There is a lack of consensus regarding
the pathogenesis and diagnosis of DC, and a standard treatment has
yet to be established. Factors that are recognized to be involved
in the pathogenesis of DC include metabolic disorders, myocardial
fibrosis, microvascular disease, autonomic disorders and insulin
resistance (IR) (1). Among these
factors, IR is the main indicator across the various metabolic
diseases. Furthermore, IR is involved in the pathophysiology of
diabetes, hypertension, hyperlipidemia and other metabolic
diseases. IR is also one of the most important factors to promote
the development of DC.
Adiponectin (APN), a fat cell factor secreted by
myocardial cells, regulates cardiac function and myocardial
metabolism through autocrine and paracrine signaling. The effects
of APN depend on its interaction with the APN receptor (2). The binding of APN to the APN
receptor, which is mediated by a series of biological mechanisms,
induces anti-inflammatory, antidiabetic and antiatherogenic
properties. In addition, it regulates glucolipid metabolism,
increasing fatty acid oxidation and glucose uptake and enhancing
insulin sensitivity (3). However,
the association between APN and DC, and the importance of APN in
the development of IR in patients with DC has yet to be
elucidated.
The purpose of this study was to observe the changes
in serum and cardiac levels of APN in a rat model of DC.
Furthermore, the mRNA and protein expression of the cardiac APN
receptor 1 (AdipoR1), as well as the association between APN,
AdipoR1 and IR, were investigated. The results may provide a
theoretical basis for the clinical use of either APN or drugs
targeted to the APN pathway to reduce IR and treat DC.
Materials and methods
Experimental animals
Male Sprague Dawley rats (weight, 200–220 g; age,
4–6 weeks; n=61) were obtained from the Experimental Animal Center
of Anhui Medical University (Hefei, China). The rats were housed
with five to six rats per cage in the animal laboratory of Anhui
Medical University under the following conditions: Room
temperature, 18–22°C; relative humidity, 30–70%; light/dark, 12/12
h; free access to water and food. After one week of feeding, the
rats were randomly divided into type 2 diabetes mellitus (T2DM)
(n=40) and control (n=20) groups. The control group was fed a
standard diet (64% carbohydrate, 23% protein and 13% fat) and the
T2DM group was fed a high-fat, high-sugar diet (59% routine feed,
18% lard, 20% sucrose and 3% egg yolk powder). After four weeks,
the T2DM group received an intraperitoneal injection of
streptozotocin (STZ; 30 mg/kg), while the control group received an
intraperitoneal injection of an equal volume of citrate buffer.
Assessment was performed during week 14. One day prior to
assessment, the rats underwent a 12–14-h fast. Body weights (BWs)
were recorded and the rats were anesthetized with 10% chloral
hydrate (0.3 ml/100 g BW). The anesthetized rats were placed on the
operating table, tail blood glucose levels were measured with a
glucose meter (Roche Diagnostics GmbH, Mannheim, Germany) and blood
samples were collected.
Assessment of cardiac function
An arterial catheter was inserted into the common
carotid artery of each rat. The maximum rate of left
intraventricular isovolumic systolic pressure increase
(+dp/dtmax) and decrease (−dp/dtmax) was
measured. Biological signals were collected and analyzed with an
electronic BL-410 biological and functional experimental system
(Chengdu Taimeng Science And Technology Co., Ltd., Chengdu,
China).
Analysis of blood lipid and insulin
levels and insulin sensitivity
Aortic blood samples were collected, centrifuged at
2,800 × g for 10 min at 4°C, and the supernatants were preserved at
−70°C. Triglyceride (TG) levels were measured using the
glycerol-3-phosphate oxidase-peroxidase method (BoAoSen BioCompany,
Beijing, China), total cholesterol (TC) levels were determined by
an enzyme-linked colorimetric assay and insulin levels were
measured with a radioimmunoassay (YuanZi Science Biocompany,
Beijing, China). Calculations were performed to determine the
insulin sensitivity index (ISI, expressed in its natural logarithm)
and the homeostasis model assessment-estimated IR (HOMA-IR) index
as follows: ISI=1/[fasting plasma glucose (FPG) × fasting insulin
(FINS)]; HOMA-IR index=FPG × FINS/22.5.
Specimen collection
The hearts were separated from the heart artery
roots, rinsed with physiological saline, weighed and blotted with
filter paper. The heart blood vessels and connective tissue were
removed and the left apex was dissected in an ice bath into pieces
weighing 100 mg each. Subsequently, the specimens were wrapped in
tin foil, frozen with liquid nitrogen and stored at −70°C in
preparation for the analysis of myocardial APN and AdipoR1
levels.
A sample of the left ventricular tissue was fixed in
4% paraformaldehyde at 4°C for 48 h. Paraffin-embedded 4-μm tissue
sections were then prepared for immunohistochemical analysis and
the pathological observation of the immunostained tissues using
hematoxylin and eosin staining.
Assessment of serum and myocardial levels
of APN
APN levels were measured using a double-antibody
sandwich ELISA (Beijing Boaosen Biotechnology Co. Ltd., Beijing,
China). The sample protein concentration was calculated by
recording the absorbance as optical density (OD) at a wavelength of
450 nm.
Assessment of cardiac AdipoR1 protein
expression
A streptavidin-biotin-peroxidase complex kit (Zymed
Laboratories, Inc., South San Francisco, CA, USA) and anti-AdipoR1
antibody (Beijing Boaosen Biotechnology Co. Ltd.) were used to
monitor the expression of cardiac AdipoR1. Semi-quantitative
analyses were performed based on the area and intensity of staining
using an MIAS-2000 color image processing system (Micro image
analysis system-2000; Zhisheng Software Company, Chengdu, China).
In each sample, five high-power fields (magnification, ×400) were
randomly selected and the mean OD value was calculated.
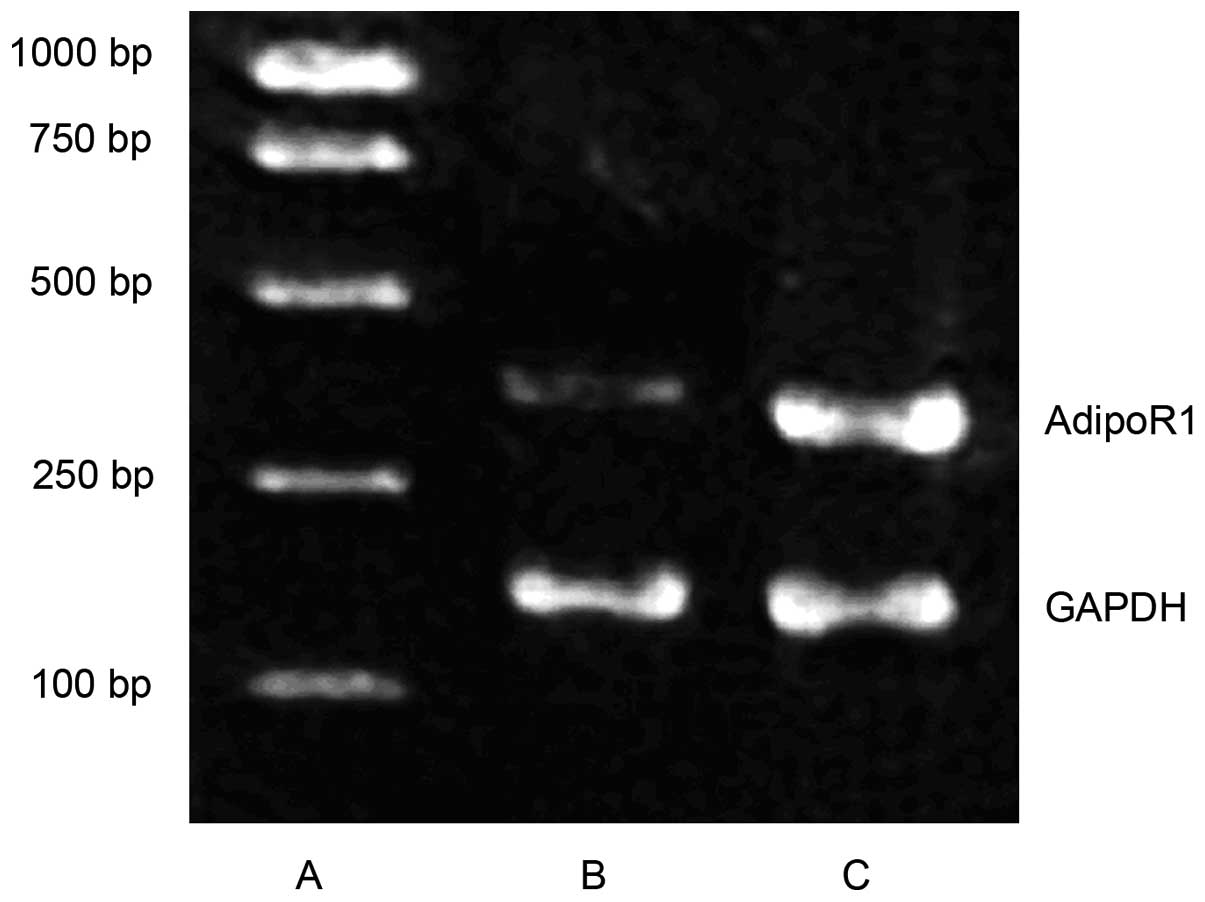
Expression of myocardial AdipoR1
mRNA
Levels of myocardial AdipoR1 mRNA expression were
assessed with the reverse transcription polymerase chain reaction
(RT-PCR). Primer sequences for AdipoR1 were:
5′-AACTGGACTATFCAGGGA-3′ (upstream primer) and
5-′TGGTPCCAGTCTCATCAG-3′ (downstream primer). The amplification
fragment length was 398 base pairs. Primer sequences for the
control, GAPDH, were: 5′-ATGGTGAAGGTCGGTGTG-3′ (upstream primer)
and 5′-AACTTGCCGTGGGTAGAG-3′ (downstream primer). The amplification
fragment length was 161 base pairs. Results of the electrophoresis
gels were analyzed with an imaging system (Biosens Gel 750;
Shanghai Shanfu Scientific Instrument Company, Shanghai, China).
The relative content of AdipoR1 mRNA was represented by the ratio
of the OD of the AdipoR1 band and the GAPDH band.
Statistical analysis
SPSS 13.0 statistical software (SPSS, Inc., Chicago,
IL, USA) was used to analyze the data. A t-test was used to compare
the normally distributed data in the two groups. Data are expressed
as the mean ± standard deviation. HOMA-IR indices showed a skewed
distribution. Pearson’s coefficient was used for two-variable
correlation analysis. P<0.05 was considered to indicate a
statistically significant difference.
Results
Biochemical indices
FPG, TG, TC and FINS levels, and the HOMA-IR index
were significantly higher in the T2DM group compared with the
control group (all P<0.05) (Table
I).
 | Table IBiochemical indices in the control and
T2DM groups. |
Table I
Biochemical indices in the control and
T2DM groups.
| Group | n | FPG (mmol/l) | TG (mmol/l) | TC (mmol/l) | FINS (mU/l) | HOMA-IR (ln)
(mmol/mIU/l2) |
|---|
| Control | 20 | 5.20±0.67 | 0.69±0.04 | 1.34±0.09 | 11.45±1.06 | 0.48±0.07 |
| T2DM | 32 | 17.60±2.45a | 1.67±0.11a | 3.15±0.14a | 20.70±1.12a | 1.32±0.02a |
BW, heart weight (HW) and cardiac
function
Prior to STZ injection, the BWs of rats in the T2DM
group were not significantly different from those of the rats in
the control group. However, polyphagia, polydipsia, polyuria and
gradual weight gain were observed in the T2DM group following STZ
injection. Significant differences in BW were identified between
the two groups (P<0.05). In addition, there were significant
differences in HW and −dp/dtmax between the T2DM and the
control group (both P<0.05) (Table
II).
| Table IIBW, HW, HW/BW, −dp/dtmax
and +dp/dtmax in the control and T2DM groups. |
Table II
BW, HW, HW/BW, −dp/dtmax
and +dp/dtmax in the control and T2DM groups.
| Group | n | BW (g) | HW (g) | HW/BW (g/kg) |
−dp/dtmax |
+dp/dtmax |
|---|
| Control | 20 | 508.4±34.7 | 0.89±0.05 | 1.74±0.06 | 6037±296 | 7430±215 |
| T2DM | 32 | 427.8±24.6a | 1.31±0.12a | 3.10±0.11a | 4178±129a | 7149±189 |
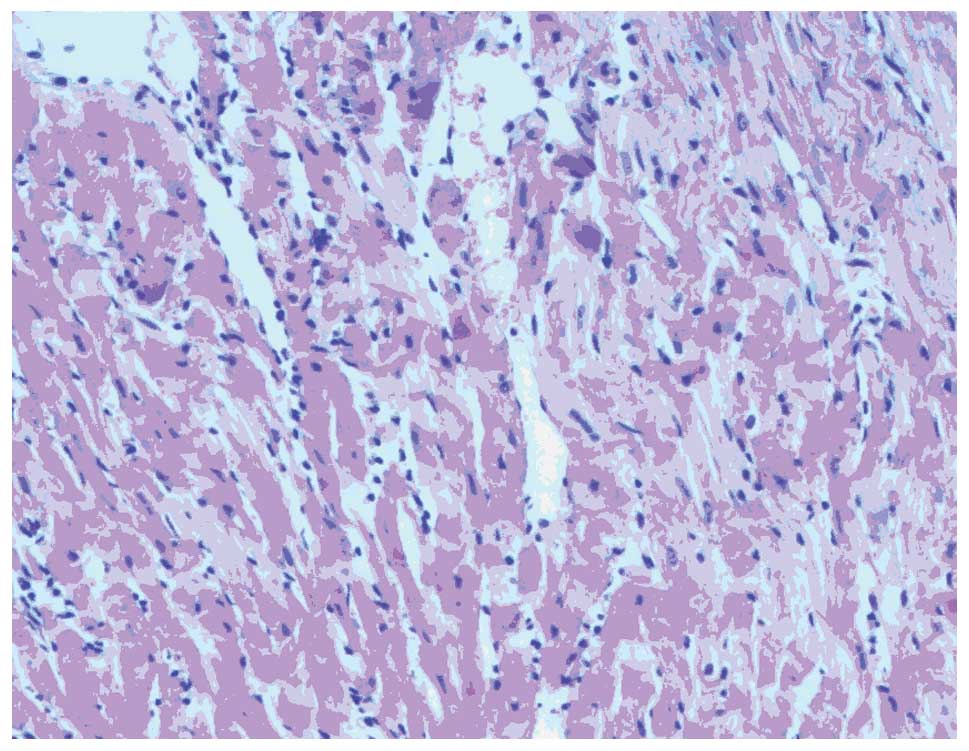
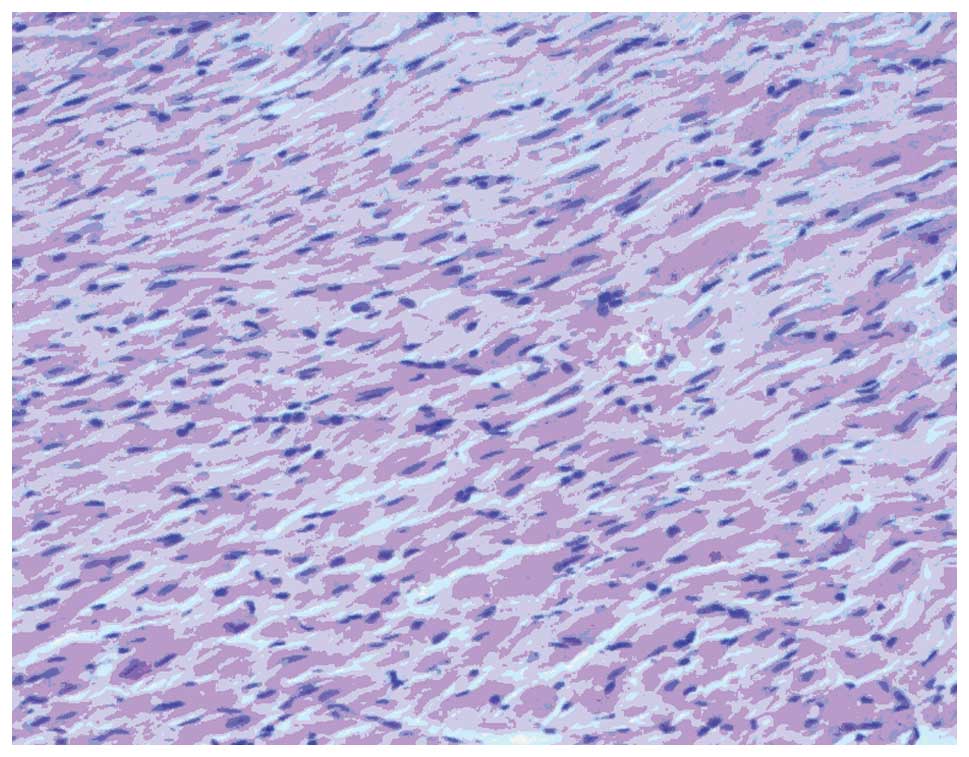
Morphological changes in the myocardia of
rats
Myocardial hypertrophy, cytoplasm was loose,
reticulated and translucent, a disordered cell arrangement and
nuclear size irregularities were observed in T2DM group rats under
the light microscope. In the control group, myocardial cells were
arranged in neat rows, the size of nuclei was consistent and
cytoplasmic staining was uniform (Figs. 1 and 2).
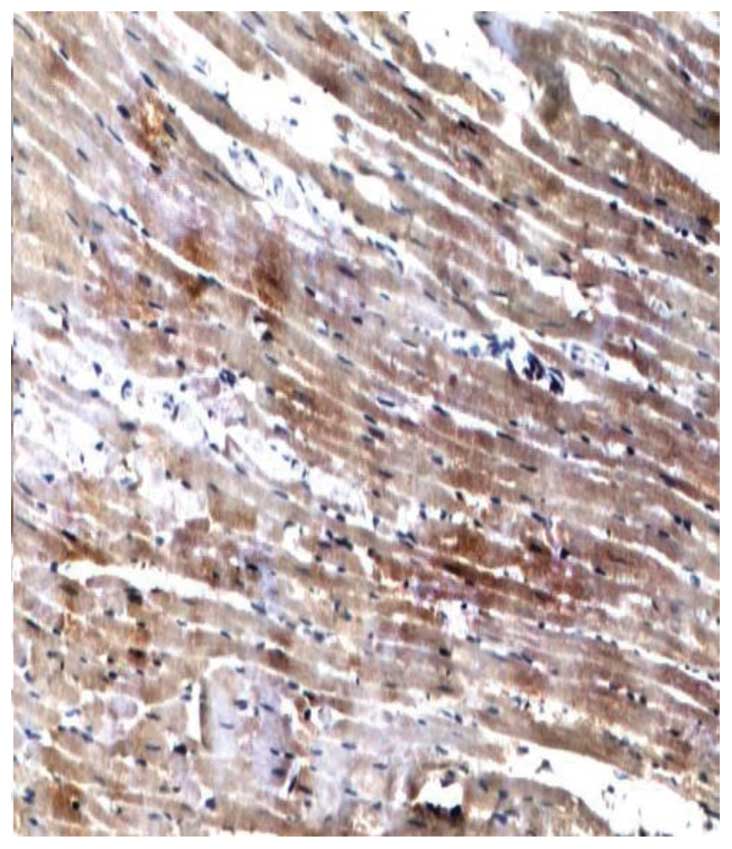
Expression of serum and myocardial APN
and myocardial AdipoR1
Levels of serum APN and myocardial APN were
significantly lower in the T2DM group compared with the control
group (both P<0.05). RT-PCR showed that AdipoR1 mRNA expression
was significantly reduced in the T2DM group compared with the
control group (P<0.05). Furthermore, immunohistochemical
staining showed that the AdipoR1 protein was mainly located in the
cytoplasm. The expression of myocardial AdipoR1 protein was
significantly lower in the T2DM group compared with the control
group (Table III, Figs. 3–5).
| Table IIISerum APN, myocardial APN and AdipoR1
expression in the control and T2DM groups. |
Table III
Serum APN, myocardial APN and AdipoR1
expression in the control and T2DM groups.
| Group | n | Serum APN
(μg/ml) | Myocardial APN
(μg/mg) | AdipoR1/GAPDH | AdipoR1 protein
(OD) |
|---|
| Control | 20 | 1.94±0.14 | 0.23±0.03 | 0.70±0.10 | 1274.19±34.86 |
| T2DM | 32 | 1.09±0.05a | 0.12±0.01a | 0.39±0.02a | 679.44±15.13a |
Correlation analyses of serum APN and
FPG, TG, TC, FINS and HOMA-IR in rats with T2DM
Correlation analyses of serum APN and FPG, TG, TC,
FINS and HOMA-IR in the T2DM group showed that serum APN levels
were negatively correlated with FPG, TG, TC, FINS and HOMA-IR
(r=−0.721, −0.582, −0.549, −0.613 and −0.637, respectively; all
P<0.05) (Table IV).
| Table IVCorrelation analyses between serum APN
and FPG, TG, TC, FINS and HOMA-IR in the T2DM group. |
Table IV
Correlation analyses between serum APN
and FPG, TG, TC, FINS and HOMA-IR in the T2DM group.
| Variable | FPG | TG | TC | FINS | HOMA-IR |
|---|
| Serum APN
(r-values) | −0.721a | −0.582a | −0.549a | −0.613a | −0.637a |
Correlation analyses of AdipoR1 protein
expression and myocardial APN, FINS and HOMA-IR in rats with
T2DM
Correlation analyses were conducted on myocardial
AdipoR1 protein expression and myocardial APN, FINS and HOMA-IR in
rats with T2DM. Expression of the AdipoR1 protein was positively
correlated with myocardial APN (r=0.890, P<0.05) and negatively
correlated with FINS and HOMA-IR (r=−0.697, and −0.593,
respectively; both P<0.05) (Table
V).
| Table VCorrelation analyses between AdipoR1
protein and myocardial APN, FINS and HOMA-IR in the T2DM group. |
Table V
Correlation analyses between AdipoR1
protein and myocardial APN, FINS and HOMA-IR in the T2DM group.
| Variable | Myocardial APN | FINS | HOMA-IR |
|---|
| AdipoR1 protein
(r-values) | 0.890a | −0.697a | −0.593a |
Discussion
The pathogenesis of DC has yet to be fully
elucidated. The etiology of the disease includes metabolic
dysfunction, IR, autonomic nervous system disorders, and myocardial
fiber necrosis and apoptosis (1,4).
Early symptoms of DC are not obvious and mainly manifest as
ventricular diastolic dysfunction. However, aggravation of DC
eventually leads to heart failure, malignant arrhythmia and sudden
mortality (5).
APN, which is secreted by adipose cells, circulates
in the blood and organs. Yamauchi et al (6) were the first group to clone human and
mouse AdipoR1 and AdipoR2 cDNAs. APN and its receptor have been
found to affect metabolic regulation and improve IR and oxidative
stress (7). Furthermore, the
function of APN in patients with diabetes mellitus has received
increasing focus (7). Further
study of APN and its receptors may provide novel strategies for the
prevention and treatment of DC.
In the present study, FPG and FINS levels were
elevated in the rats with T2DM compared with the control group,
while serum APN levels were significantly decreased. APN
correlation analyses revealed a strong correlation between serum
APN and FPG levels. This study showed that the HOMA-IR index
increased significantly in the T2DM group relative to the control
group, and was negatively correlated with serum APN levels.
Therefore, it may be concluded that decreased APN and abnormal
glucose metabolism are interrelated, and have an important role in
glucose metabolism dysfunction in patients with DC. Furthermore, IR
may lead to reduced secretion of APN; therefore, increased insulin
sensitivity may improve APN secretion, which is expected to become
a therapeutic target for the prevention and treatment of DC.
Aberrant lipid metabolism is one of the
manifestations of DC. APN is independently associated with TG, TC
and low-density lipoprotein cholesterol levels. In healthy,
non-diabetic individuals, APN was negatively correlated with TG, TC
and low-density lipoprotein cholesterol levels (8). The present study showed that TG and
TC levels were higher in the T2DM group than the control group.
Correlation analyses showed that APN was negatively correlated with
TG and TC levels, suggesting that APN levels and lipid metabolism
are closely associated with one another. Therefore, decreased APN
levels represent one cause of dyslipidemia in DC.
The present study suggests that the decline in APN
levels was directly or indirectly involved in the occurrence of IR
in rats with DC, and that changes in AdipoR1 expression also
contribute to IR. The results showed that expression levels of
myocardial AdipoR1 mRNA and protein in rats with T2DM were
significantly lower than those in the control group. Therefore,
reduced AdipoR1 expression is involved in IR and represents one of
the mechanisms of IR in DC. In addition, protein levels of AdipoR1
were positively correlated with myocardial APN, which suggests that
APN regulates the expression of the APN receptor gene.
Based on these results, the causes of IR in DC may
be a decrease in APN levels, which leads to decreased binding of
APN to AdipoR1. Reduced APN signal transmission subsequently
downregulates the sensitivity of insulin and causes IR. The reduced
expression of AdipoR1 in heart muscle affects the binding of APN to
AdipoR1, thereby influencing the role of APN in regulating glucose
metabolism, which leads to IR.
At present, the mechanism of APN receptor activation
is not fully understood. Elucidation of the specific sites at which
AdipoR1 is activated is likely to contribute to an enhanced
understanding of the mechanism underlying the action of APN.
Acknowledgements
This study was supported by grants from the Key
Program of the Natural Science Foundation of Education
Administration of Anhui Province (no. KJ2011A162) and the Annual
Plan Project of the Science and Technology Department of Anhui
Province (no. 12070403069).
References
|
1
|
Nakano Y, Tobe T, Choi-Miura NH, Mazda T
and Tomita M: Isolation and characterization of GBP28, a novel
gelatin-binding protein purified from human plasma. J Biochem.
120:803–812. 1996. View Article : Google Scholar
|
|
2
|
Takahashi M, Arita Y, Yamagata K,
Matsukawa Y, Okutomi K, Horie M, Shimomura I, Hotta K, Kuriyama H,
Kihara S, et al: Genomic structure and mutations in
adipose-specific gene, adiponectin. Int J Obes Relat Metab Disord.
24:861–868. 2000. View Article : Google Scholar : PubMed/NCBI
|
|
3
|
Stumvoll M, Tschritter O, Fritsche A,
Staiger H, Renn W, Weisser M, Machicao F and Häring H: Association
of the T-G polymorphism in adiponectin (exon 2) with obesity and
insulin sensitivity: interaction with family history of type 2
diabetes. Diabetes. 51:37–41. 2002. View Article : Google Scholar : PubMed/NCBI
|
|
4
|
Li CL, Gong YP, Tian H, Lu JM, Li M, Xiao
HJ, Mu YM and Pan CY: Distribution and expression of adiponectin
receptors in different tissues of normal Wistar rats. Jie Fang Jun
Yi Xue Za Zhi. 30:718–719. 2005.(In Chinese).
|
|
5
|
Halleux CM, Takahashi M, Delporte ML,
Detry R, Funahashi T, Matsuzawa Y and Brichard SM: Secretion of
adiponectin and regulation of apM1 gene expression in human
visceral adipose tissue. Biochem Biophys Res Commun. 288:1102–1107.
2001. View Article : Google Scholar : PubMed/NCBI
|
|
6
|
Yamauchi T, Kamon J, Ito Y, Tsuchida A,
Yokomizo T, Kita S, Sugiyama T, Miyagishi M, Hara K, Tsunoda M, et
al: Cloning of adiponectin receptors that mediate antidiabetic
metabolic effects. Nature. 423:762–769. 2003. View Article : Google Scholar : PubMed/NCBI
|
|
7
|
Liu BH, Wang PH, Wang YC, Cheng WM,
Mersmann HJ and Ding ST: Fasting regulates the expression of
adiponectin receptors in young growing pigs. J Anim Sci.
86:3377–3384. 2008. View Article : Google Scholar : PubMed/NCBI
|
|
8
|
Kutter D, Devaquet P, Vanderstocken G,
Paulus JM, Marchal V and Gothot A: Consequences of total and
subtotal myeloperoxidase deficiency: risk or benefit? Acta
Haematol. 104:10–15. 2000. View Article : Google Scholar : PubMed/NCBI
|