Introduction
Esophageal cancer (EC) is the third most common type
of gastrointestinal malignancy and has been considered as a leading
cause for cancer-induced mortality worldwide. As with other tumors,
the outcome for patients with EC has been hypothesized to be
strongly associated with the stage at initial diagnosis (1). A five-year survival rate of 57–78%
has been reported in patients with early-stage EC, however, for
patients with locally advanced EC, a lower five-year survival rate
of <15% has been reported, despite attempts to treat the cancer
by resection (2).
Recent studies have been conducted with regard to
the screening of tumor biomarkers in the pathogenesis and prognosis
of various types of carcinomas. For instance,
ribonucleoside-diphosphate reductase (RRM1), which encodes the
regulatory subunit of ribonucleotide reductase, is hypothesized to
be involved in the pathogenesis and development of carcinomas.
Furthermore, low expression of RRM1 is associated with a poor
survival rate among patients with non-small-cell lung cancer
(NSCLC) (3). The excision repair
cross complementing 1 (ERCC1) gene encodes the nucleotide excision
repair protein, which is involved in the repair of radiation- and
chemotherapy-induced DNA damage. According to previous studies,
ERCC1 mRNA expression levels are associated with non-response
and/or survival rates of patients with colon cancer and NSCLC
(4,5). TYMS, the gene that encodes
thymidylate synthase, has been demonstrated to be an independent
prognostic biomarker of patients that have undergone 5-fluorouracil
chemotherapy for the treatment of gastrointestinal tumors (6). Class III β-tubulin (TUBB3) encodes a
neuron-specific protein and is considered to be a marker of cancer
severity. In addition, high expression levels of TUBB3 have been
shown to correlate with low response rates in patients with NSCLC
(7). The topoisomerase IIα (TOP2A)
gene encodes an enzyme that is involved in DNA replication, and is
associated with the sensitivity to anthracycline therapy in various
carcinomas. In a number of studies, associations between a
combination of two or more biomarkers and the pathogenesis of
carcinomas have been investigated (3,8).
However, to the best of our knowledge no study has been conducted
using ERCC1, TYMS, TUBB3, RRM1 and TOP2A simultaneously in
esophageal squamous cell carcinoma (ESCC).
Therefore, in the present study, the expression
levels of ERCC1, TYMS, TUBB3, RRM1 and TOP2A were analyzed in
patients with ESCC, with the aim of investigating the correlation
between these five biomarkers and the pathogenesis and development
of ESCC.
Patients and methods
Patients
A total of 29 male ESCC patients admitted to the
Department of Thoracic Surgery at the General Hospital of Chengdu
Military Region of People’s Liberation Army (Chengdu, China)
between December 2011 and December 2012 were included in the study.
The patients were aged between 40.5 and 69.3 years (median age,
54.9 years). Only three patients (10.34%) reported a history of
smoking. Patients with ESCC who were suitable for surgical
resection and had not received systematic treatment prior to
resection were included in the study. Patients were also required
to volunteer to participate in the gene test. All the patients
provided written informed consent and the study was approved by the
Ethics Committee of the General Hospital of Chengdu Military Region
of People’s Liberation Army.
Sample collection
Prior to the sample collection, a thoracotomy was
conducted under general anesthetic using cisatracurium besilate
(Tianjin Elong Co., Ltd, Tianjin, China), fentanyl injection
(Jiangsu Nhwa pharmaceutical corporation, Xuzhou, China) or
midazolam hydrochloride (3B Scientific Corporation, Wuhan, China).
In total, 29 samples were obtained from the central region of each
tumor mass. The samples were fixed for 16–24 h using 10% formalin
and were labelled according to the ID numbers of the patients,
which were designated as 1–29.
MicroRNA expression profiling
analysis
Total RNA was extracted using an RNA isolation kit
(Qiagen, Inc., Valencia, CA, US), according to the manufacturer’s
instructions. The RNA integrity number was calculated to analyze
RNA integration using an Agilent Bioanalyzer 2100 (Agilent
Technologies, Santa Clara, CA, USA). All the microRNA microarray
experiments were conducted using an Agilent Human miRNA microarray
kit (version 16.0; Agilent Technologies). Subsequently, 100 ng
total RNA was hybridized for each sample and processed according to
the manufacturer’s instructions. The microRNA arrays were scanned
using a G2565BA scanner (Agilent Technologies) and the images were
analyzed using Agilent Feature Extraction software (version 10.7).
Raw data were normalized using the Quantile algorithm function of
the Gene Spring Software 11.0 (Agilent Technologies).
Statistical analysis
SAS 9.2 software (SAS Institute, Inc., Cary, NC,
USA) was used to perform data analysis. Spearman’s rank correlation
analysis was used to determine the strength of the associations
between the expression levels of the biomarkers and the
pathogenesis of ESCC. Fisher’s exact test was conducted to
determine the contingency of the data, where P<0.05 was
considered to indicate a statistically significant difference.
Results
Patient characteristics
Invasion evaluation was performed, which revealed
that ~76% of the patients were diagnosed with a level two or three
depth of invasion (Table I). In
addition, levels one and two lymph-node metastasis were identified
in 14 patients (48.28%). According to the clinical stages
classified by the Union for International Cancer Control (UICC),
the numbers of patients in a UICC stage II (A/B) or III (A/B) were
21 (72.41%) and 8 (27.59%), respectively.
 | Table IClinical features of the patients. |
Table I
Clinical features of the patients.
| Clinical feature | Cases, n (%) |
|---|
| Depth of
invasion |
| Level 1 | 5 (17.24) |
| Level 2 | 10 (34.48) |
| Level 3 | 12 (41.38) |
| Level 4 | 2 (6.90) |
| Lymphatic
metastasis |
| Level 0 | 15 (51.72) |
| Level 1 | 11 (37.93) |
| Level 2 | 3 (10.34) |
| Clinical
stagea |
| IIA | 5 (17.24) |
| IIB | 16 (55.17) |
| IIIA | 7 (24.14) |
| IIIB | 1 (3.45) |
Expression of the biomarkers
High expression levels of TYMS and TOP2A were
observed in 24.14% of the samples, while high expression levels of
TUBB3 and RRM1 were observed in 6.9% of the samples (Table II). Only low and moderate
expression levels of ERCC1 were observed in the samples; high
expression was not identified.
| Table IIGene expression levels interpreted
from the microarray analysis. |
Table II
Gene expression levels interpreted
from the microarray analysis.
| Gene | Low | Low to moderate | Moderate | Moderate to high | High |
|---|
| ERCC1, n (%) | 14 (48.28) | 5 (17.24) | 8 (27.59) | 2 (6.90) | 0 (0.00) |
| TYMS, n (%) | 4 (13.79) | 8 (27.59) | 6 (20.69) | 4 (13.79) | 7 (24.14) |
| TUBB3, n (%) | 10 (34.48) | 8 (27.59) | 3 (10.34) | 6 (20.69) | 2 (6.90) |
| RRM1, n (%) | 16 (55.17) | 3 (10.34) | 4 (13.79) | 4 (13.79) | 2 (6.90) |
| TOP2A, n (%) | 6 (20.69) | 7 (24.14) | 7 (24.14) | 2 (6.90) | 7 (24.14) |
Correlation analysis
Spearman’s rank correlation analysis was performed
to investigate the correlation between the expression levels of the
biomarkers and the clinical features of the patients. The results
indicated that the expression of ERCC1 positively correlated with
the severity of tumor invasion (r=0.47, P=0.0102). In addition, the
expression level of ERCC1 was negatively associated with lymphatic
metastasis (r=−0.39, P=0.0357). The expression level of TYMS
exhibited a negative correlation with tumor invasion (r=−0.47,
P=0.0098) and the clinical stage of carcinoma (r=−0.43, P=0.0191).
With regard to TUBB3 expression levels, a negative association was
observed with lymphatic metastasis (r=−0.42, P=0.0231). No
significant correlation was identified between the expression
levels of TOP2A and RRM1 with the clinical features of the patients
(Table III).
| Table IIISpearman’s rank correlation analysis
of gene expression levels and clinical features. |
Table III
Spearman’s rank correlation analysis
of gene expression levels and clinical features.
| Clinical feature | ERCC1 | TYMS | TUBB3 | TOP2A | RRM1 |
|---|
| Depth of tumor
invasion | 0.4692 | −0.4718 | 0.2293 | −0.2498 | −0.0776 |
| P-value | 0.0102 | 0.0098 | 0.2315 | 0.1911 | 0.6888 |
| Lymphatic
metastasis | −0.392 | 0.0127 | −0.4205 | 0.0039 | −0.1716 |
| P-value | 0.0357 | 0.9481 | 0.0231 | 0.9838 | 0.3733 |
| Clinical stage | 0.0376 | −0.4305 | −0.1729 | −0.2975 | −0.2832 |
| P-value | 0.8463 | 0.0197 | 0.3696 | 0.1170 | 0.1365 |
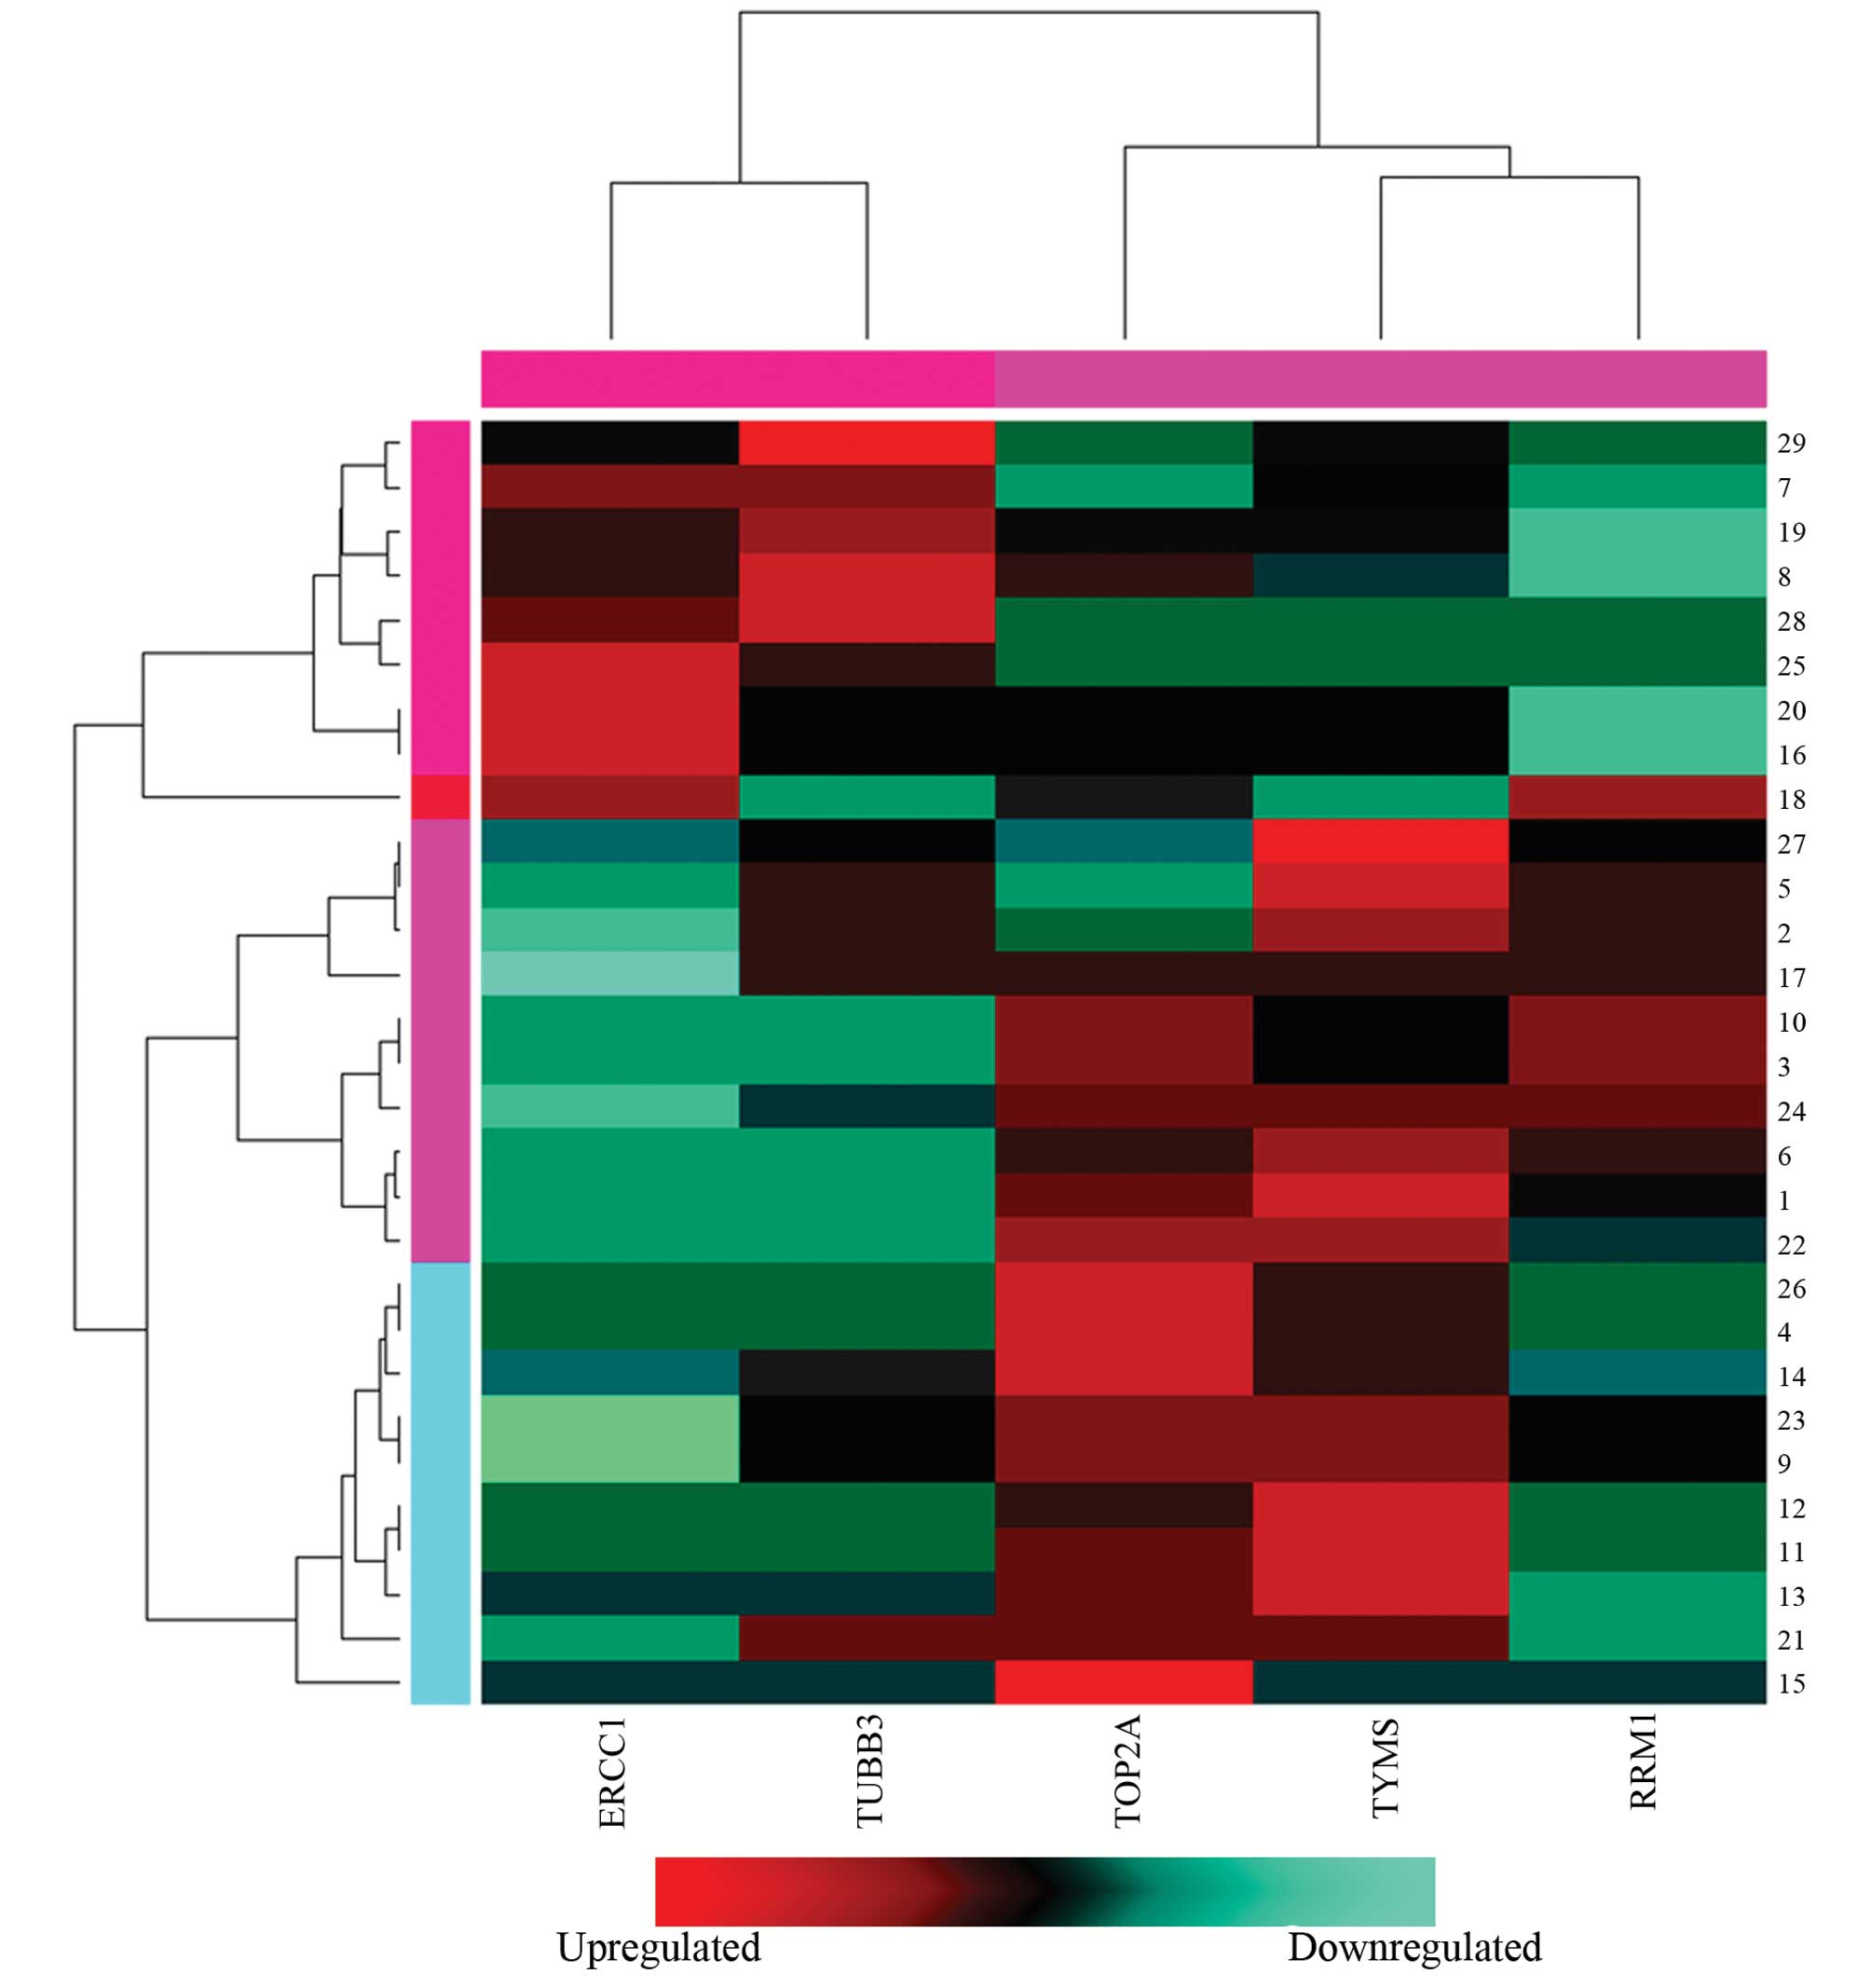
Cluster analysis of gene expression
levels
To investigate the association between the gene
expression levels of the biomarkers and the clinical features of
the patients, cluster analysis was performed on ERCC1, TYMS, TUBB3,
RRM1 and TOP2A. High expression levels of ERCC1 and TUBB3 were
identified in the samples with an ID of 6, 7, 15, 18–20, 25, 28 and
29, while low expression levels of ERCC1 and TUBB3 were observed in
these samples (Fig. 1). With
regard to the other samples, comparatively high expression levels
of TYMS, RRM1 and TOP2A were demonstrated, while low expression
levels of ERCC1 and TUBB3 were identified. Based on these results,
the samples were divided into two groups. Group 1 patients
exhibited low expression levels of TYMS, RRM1 and TOP2A and high
expression levels of ERCC1 and TUBB3, while group 2 exhibited low
expression levels of ERCC1 and TUBB3 and high expression levels of
TYMS, RRM1 and TOP2A. Subsequently, Fisher’s exact test was
conducted to analyze the expression levels of the biomarkers in
these groups, which revealed a statistically significant difference
in the severity of carcinoma invasion between the two groups
(P<0.05, Table IV). However,
no significant differences were identified between groups 1 and 2
with regard to clinical stage or lymphatic metastasis
(P>0.05).
| Table IVAnalysis between biomarker expression
levels and clinical features using Fisher’s exact test. |
Table IV
Analysis between biomarker expression
levels and clinical features using Fisher’s exact test.
| Clinical feature | Group 1, n (%) | Group 2, n (%) | P-value |
|---|
| Depth of
invasion | | | 0.02 |
| Level 1 | 0 (0) | 5 (25) | |
| Level 2 | 1 (11.11) | 9 (45) | |
| Level 3 | 7 (77.78) | 5 (25) | |
| Level 4 | 1 (11.11) | 1 (5) | |
| Lymphatic
metastasis | | | 1 |
| Level 0 | 5 (55.56) | 10 (50) | |
| Level 1 | 3 (33.33) | 8 (40) | |
| Level 2 | 1 (11.11) | 2 (10) | |
| Clinical
stagea | | | 0.19 |
| IIA | 0 (0) | 5 (25) | |
| IIB | 5 (55.56) | 11 (55) | |
| IIIA | 3 (33.33) | 4 (20) | |
| IIIB | 1 (11.11) | 0 (0) | |
Discussion
ESCC, a disease prevalent in China, has been
reported to be a consequence of polymorphisms of multiple
interacting genes and gene-environment interactions. However, to
the best of our knowledge, no study has been conducted
investigating the expression of ERCC1, TYMS, TUBB3, RRM1 and TOP2A
in patients with ESCC. In the present study, the expression levels
of ERCC1, TYMS, TUBB3, RRM1 and TOP2A were evaluated
simultaneously. The results indicated that the expression levels of
ERCC1, TYMS, TUBB3, RRM1 and TOP2A were closely associated with the
clinical characteristics observed in patients with ESCC.
Increasing evidence has demonstrated that the
expression levels of ERCC1, TYMS, TUBB3, RRM1 and TOP2A are closely
correlated with the pathogenesis of carcinomas. For example, the
aberrant regulation of ERCC1, TYMS, TUBB3, RRM1 and TOP2A is
associated with the abnormal proliferation of cancer cells,
according to the hallmarks of cancer that were proposed previously
(9). Furthermore, Zhang et
al (10) identified that the
polymorphism and aberrant expression of TYMS may be associated with
a susceptibility to ESCC and gastric cardiac adenocarcinoma. In
addition, increased expression of ERCC1 has been hypothesized to be
closely associated with a reduced survival rate in patients with
ESCC. In a review that evaluated the biomarkers for predicting the
response and/or prognosis of ESCC patients treated with neoadjuvant
chemoradiation therapy, expression levels of ERCC1 were considered
to be an independent risk factor for poor outcomes (11). With regard to the expression levels
of TUBB3 in carcinomas, Levallet et al (12) demonstrated that TUBB3 expression
was associated with nonsquamous cell carcinoma. A previous study
investigated the association between RRM1 expression levels and
sensitivity to gemcitabine in ESCC cell lines, and a close
correlation was identified (13).
Hanagiri et al (14)
observed high expression of TOP2A in 55.2% of the tumor specimens
that were analyzed. However, the expression of TOP2A exhibited no
correlation with the clinical features of the specimens, including
the differentiation, depth of tumor invasion and lymph node
metastasis.
Single gene analysis indicated that ERCC1 and TYMS
expression levels were associated with the depth of tumor invasion,
while TUBB3 expression was associated with the lymphatic metastasis
of ESCC. However, single gene analysis has certain disadvantages in
predicting the association between biomarker expression levels and
the pathogenesis of ESCC, specifically with regard to neglecting
gene interactions. Therefore, the association between ERCC1, TYMS,
RRM1, TUBB3 and TOP2A expression levels with the pathogenesis and
development of ESCC was investigated using a clustered analysis in
terms of tumor invasion and lymphatic and distal metastasis. From
the results, it was possible to divide the samples into two groups.
Group 1 exhibited low expression levels of TYMS, RRM1 and TOP2A and
high expression levels of ERCC1 and TUBB3. By contrast, group 2
specimens had low expression levels of ERCC1 and TUBB3 and high
expression levels of TYMS, RRM1 and TOP2A. Fisher’s exact test
revealed a statistically significant difference in the severity of
carcinoma invasion between the two groups (P<0.05). However, no
statistically significant differences were observed with regard to
the clinical stages and lymphatic metastasis (P>0.05).
In conclusion, hierarchical clustering analysis of
the biomarkers revealed low expression levels of TYMS, RRM1 and
TOP2A and high expression levels of ERCC1 and TUBB3 in certain
individuals. By contrast, low expression levels of ERCC1 and TUBB3
and high expression levels of TYMS, RRM1 and TOP2A were observed in
other patients. Therefore, these observations indicated that the
expression levels of ERCC1, TYMS, TUBB3, RRM1 and TOP2A were
closely associated with the clinical characteristics of patients
with ESCC.
References
|
1
|
Kim TJ, Kim HY, Lee KW and Kim MS:
Multimodality assessment of esophageal cancer: preoperative staging
and monitoring of response to therapy. Radiographics. 29:403–421.
2009. View Article : Google Scholar : PubMed/NCBI
|
|
2
|
Kobori O, Kirihara Y, Kosaka N and Hara T:
Positron emission tomography of esophageal carcinoma using
(11)C-choline and (18)F-fluorodeoxyglucose: a novel method of
preoperative lymph node staging. Cancer. 86:1638–1648. 1999.
View Article : Google Scholar : PubMed/NCBI
|
|
3
|
Zheng Z, Chen T, Li X, Haura E, Sharma A
and Bepler G: DNA synthesis and repair genes RRM1 and ERCC1 in lung
cancer. N Engl J Med. 356:800–808. 2007. View Article : Google Scholar : PubMed/NCBI
|
|
4
|
Lord RV, Brabender J, Gandara D, Alberola
V, Camps C, et al: Low ERCC1 expression correlates with prolonged
survival after cisplatin plus gemcitabine chemotherapy in non-small
cell lung cancer. Clin Cancer Res. 8:2286–2291. 2002.PubMed/NCBI
|
|
5
|
Shirota Y, Stoehlmacher J, Brabender J,
Xiong YP, Uetake H, et al: ERCC1 and thymidylate synthase mRNA
levels predict survival for colorectal cancer patients receiving
combination oxaliplatin and fluorouracil chemotherapy. J Clin
Oncol. 19:4298–4304. 2001.
|
|
6
|
Lenz HJ, Leichman CG, Danenberg KD,
Danenberg PV, Groshen S, et al: Thymidylate synthase mRNA level in
adenocarcinoma of the stomach: a predictor for primary tumor
response and overall survival. J Clin Oncol. 14:176–182.
1996.PubMed/NCBI
|
|
7
|
Sève P, Reiman T, Lai R, Hanson J, Santos
C, et al: Class III beta-tubulin is a marker of paclitaxel
resistance in carcinomas of unknown primary site. Cancer Chemother
Pharmacol. 60:27–34. 2007.PubMed/NCBI
|
|
8
|
Huang CL, Kadota K, Liu D, Ueno M,
Nakasima N, et al: Expression of ERCC1 and class III β-tubulin is
associated with the survival of resected stage III non-small cell
lung cancer patients treated with induction chemoradiotherapy using
carboplatin-taxane. Exp Ther Med. 1:445–451. 2010.
|
|
9
|
Hanahan D and Weinberg RA: Hallmarks of
cancer: the next generation. Cell. 144:646–674. 2011. View Article : Google Scholar : PubMed/NCBI
|
|
10
|
Zhang J, Cui Y, Kuang G, Li Y, Wang N, et
al: Association of the thymidylate synthase polymorphisms with
esophageal squamous cell carcinoma and gastric cardiac
adenocarcinoma. Carcinogenesis. 25:2479–2485. 2004. View Article : Google Scholar : PubMed/NCBI
|
|
11
|
Joshi MB, Shirota Y, Danenberg KD, Conlon
DH, Salonga DS, et al: High gene expression of TS1, GSTP1, and
ERCC1 are risk factors for survival in patients treated with
trimodality therapy for esophageal cancer. Clin Cancer Res.
11:2215–2221. 2005. View Article : Google Scholar : PubMed/NCBI
|
|
12
|
Levallet G, Bergot E, Antoine M, Creveuil
C, Santos AO, et al; Intergroupe Francophone de Cancérologie
Thoracique (IFCT). High TUBB3 expression, an independent prognostic
marker in patients with early non-small cell lung cancer treated by
preoperative chemotherapy, is regulated by K-Ras signaling pathway.
Mol Cancer Ther. 11:1203–1213. 2012. View Article : Google Scholar : PubMed/NCBI
|
|
13
|
Luo Y, Lin C, Zhang XY, Liang X, Fu M and
Feng FY: Relationship between the level of RRM1 expression and the
sensitivity to gemcitabine in the esophageal squamous cell
carcinoma cell lines. Zhonghua Zhong Liu Za Zhi. 31:660–663.
2009.(In Chinese).
|
|
14
|
Hanagiri T, Ono K, Kuwata T, Takenaka M,
Oka S, et al: Evaluation of topoisomerase I/topoisomerase IIalpha
status in esophageal cancer. J UOEH. 33:205–216. 2011.PubMed/NCBI
|