Introduction
Acute cerebral infarction is ischaemic necrosis or
softening of the brain tissue that is caused by blood circulation
disorders and ischaemia-hypoxia of the brain. The pathogenesis of
acute cerebral infarction is associated with atherosclerosis,
vascular endothelial cell injury, artery stenosis and the formation
of a primary thrombus. The core of acute cerebral infarction is
atherosclerotic occlusion or thrombosis. Vascular endothelial cell
injury and platelet activation are involved in thrombogenesis. Von
Willebrand factor antigen (vWF:Ag), released by injured vascular
endothelial cells, is the key factor in regulating platelet
adhesion and promoting thrombus formation. vWF:Ag is regarded as a
marker for vascular endothelial cell injury (1). D-dimer (D-D), the final degradation
product of cross-linked fibrin, has been demonstrated to have
increased concentrations in several acute thrombotic disorders,
with high sensitivity and negative predictive values (2). D-D is used as a marker for
hypercoagulable states and hyperfibrinolysis, including deep vein
thrombosis and pulmonary embolism, with negative predictive values
(3). Fibrinogen/fibrin degradation
products (FDPs) are protein fragments generated by the action of
plasmin on fibrin and fibrinogen and are associated with the
activation of fibrinolytic systems. Previous studies have shown
that vWF:Ag, D-D and FDP are associated with acute cerebral
infarction (4–6), with concentrations being associated
with clinical neurological deficits. However, the use of vWF:Ag,
D-D and FDP concentrations as risk factors for acute cerebral
infarction requires further investigation. Limited clinical
assessments with large sample multiangle analyses have been
conducted. However, the present study used receiver operating
characteristic (ROC) curves of 94 patients with acute cerebral
infarction, retrospectively analysing and evaluating the
concentrations of vWF:Ag, D-D and FDP with neurological deficits to
determine the diagnostic value of the markers for acute cerebral
infarction.
Materials and methods
Clinical data
A total of 94 cases were selected from patients that
had been admitted to the Department of Neurology in Suzhou
Municipal Hospital (Suzhou, China) between April 2011 and April
2012. The patients had been diagnosed with acute cerebral
infarction within 72 h of onset, as confirmed by computed
tomography (CT) or magnetic resonance imaging (MRI) scans. The
patients had no history of stroke, mechanical prosthetic valve,
warfarin therapy, serious liver and renal dysfunction,
inflammation, blood diseases, cancer or autoimmune system diseases.
The disease group included 56 males and 38 females aged between 35
and 85 years (average, 68.7±9.8 years). A total of 120 normal age-
and gender-matched subjects admitted during the same period were
used as the control group. These control subjects included 68 males
and 52 females aged between 44 and 83 years (average, 66.3±9.1
years). Prospective participants who had been administered
anticoagulant drugs or stypticum were excluded. The study was
conducted in accordance with the Declaration of Helsinki and with
approval from the Ethics Committee of Suzhou Municipal Hospital.
Written informed consent was provided by all the participants.
Methods
Associations between NIHSS scores and plasma levels
of vWF:Ag, D-D (Siemens Healthcare, Erlangen, Germany) and FDP
(Sekisui Chemical Co., Ltd., Osaka, Japan) were retrospectively
analysed in the two groups. The effect of acute cerebral infarction
was evaluated in terms of the levels of consciousness, language,
visual-field loss, extraocular movement, ataxia, dysarthria and
sensory loss using the NIHSS scores (15 item neurological
impairment scale). Ages and genders of the two groups were
recorded. Fasting serum was collected using a 109 mmol/l sodium
citrate silicon small capacity (2.7 ml) thick double-walled vacuum
heparin tube (no dead space). Plasma samples were separated by
centrifugation at 1,760 × g for 10 min and the immune scattering
turbidimetric method was used to determine the concentrations of
vWF:Ag, D-D and FDP.
Statistical analysis
SPSS 17.0 software (SPSS, Inc., Chicago, IL, USA)
was used for statistical analysis. Pearson’s χ2 test was
used to compare the interclass rate and the results are expressed
as the mean ± standard deviation for normal or approximately normal
distribution data. Groups were compared using an independent
samples t-test and variance analysis, while Pearson’s linear
correlation was used for correlation analysis. ROC curves of the
results were plotted to calculate the area under the curve and the
standard error. Logistic regression was used to analyse independent
risk factors. P<0.05 was considered to indicate a statistically
significant difference.
Results
Clinical data
The mean age did not significantly differ between
the two groups (P>0.05). The male to female ratio in the
infarction group was 1.47, whereas in the control group, the ratio
was 1.31; thus, gender did not significantly differ between the two
groups and the χ2 test showed no statistically
significant differences (χ2=0.18
<χ20.05; P>0.05). These results
indicate that the two groups had comparable ages and gender
distributions (Table I).
 | Table ILevels of vWF:Ag, D-D and FDP in
patients with acute cerebral infarction. |
Table I
Levels of vWF:Ag, D-D and FDP in
patients with acute cerebral infarction.
| Groups | Cases, n | vWF:Ag, % | D-D, μg/l DDU | FDP, mg/l |
|---|
| Disease | 94 | 196.73±58.19 | 274.38±142.43 | 4.53±9.20 |
| Control | 120 | 111.19±40.43 | 133.05±94.38 | 2.58±3.36 |
| P-values | | <0.001 | <0.001 | 0.054 |
vWF:Ag, D-D and FDP level
vWF:Ag and D-D levels were significantly higher in
the acute cerebral infarction patients when compared with the
controls (P<0.001), whereas no statistically significant
difference in FDP concentration was observed between the groups
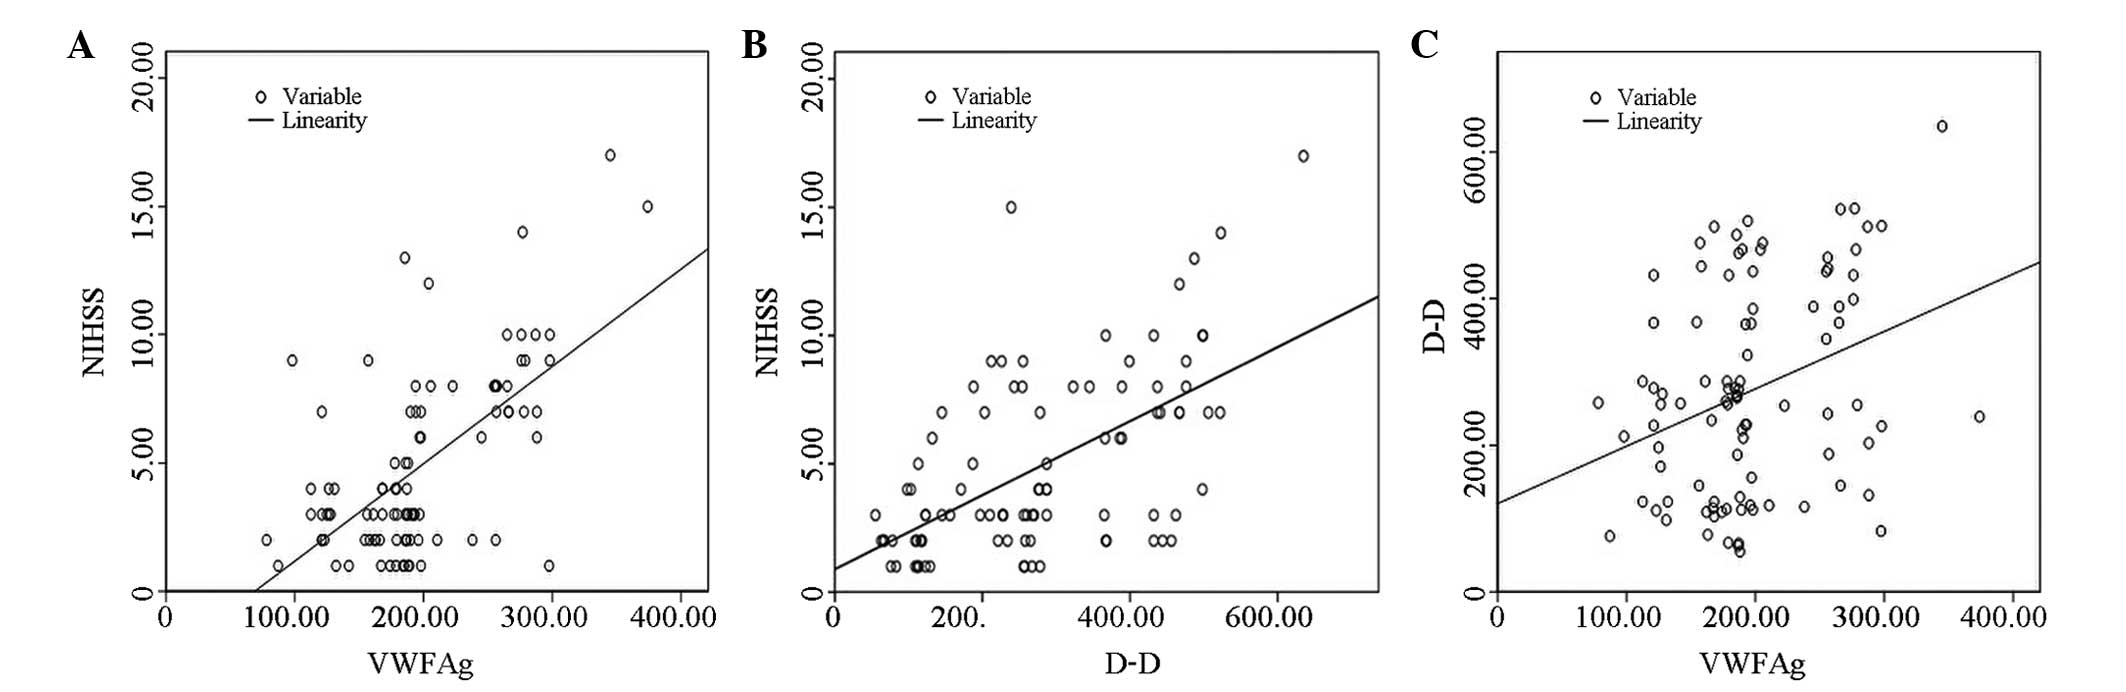
(P>0.05). The results correlated with the NIHSS scores (Fig. 1).
vWF:Ag and D-D concentrations significantly
correlated with the NIHSS scores (r=0.625 and 0.582, respectively;
P<0.01). In addition, there was a significant positive
correlation between vWF:Ag and D-D concentrations (r=0.320;
P<0.01). However, FDP did not correlate with D-D, vWF:Ag or the
NIHSS scores (r=0.172, 0.188 and 0.065, respectively; P>0.05)
(Fig. 1).
Comprehensive evaluation of the
diagnostic values
Threshold values for vWF:Ag, D-D and FDP in
diagnosing acute cerebral infarction were determined using the ROC
curves (vWF:Ag, >137%; D-D, >256 μg/l; FDP, >5 mg/l). The
sensitivity, specificity and accuracy levels of vWF:Ag were
significantly superior compared with D-D and FDP. In addition, the
misdiagnosis and missed diagnosis rates of vWF:Ag were lower
compared with D-D and FDP (Table
II).
| Table IIDiagnostic value of vWF:Ag, D-D and
FDP for acute cerebral infarction. |
Table II
Diagnostic value of vWF:Ag, D-D and
FDP for acute cerebral infarction.
| Test variables | Sensitivity, % | Specificity, % | Accuracy, % | Misdiagnosis rate,
% | Missed diagnosis
rate, % |
|---|
| vWF:Ag >137% | 84 | 78 | 80 | 22 | 16 |
| D-D >256 μg/l | 51 | 76 | 65 | 24 | 49 |
| FDP >5 mg/l | 19 | 90 | 58 | 10 | 81 |
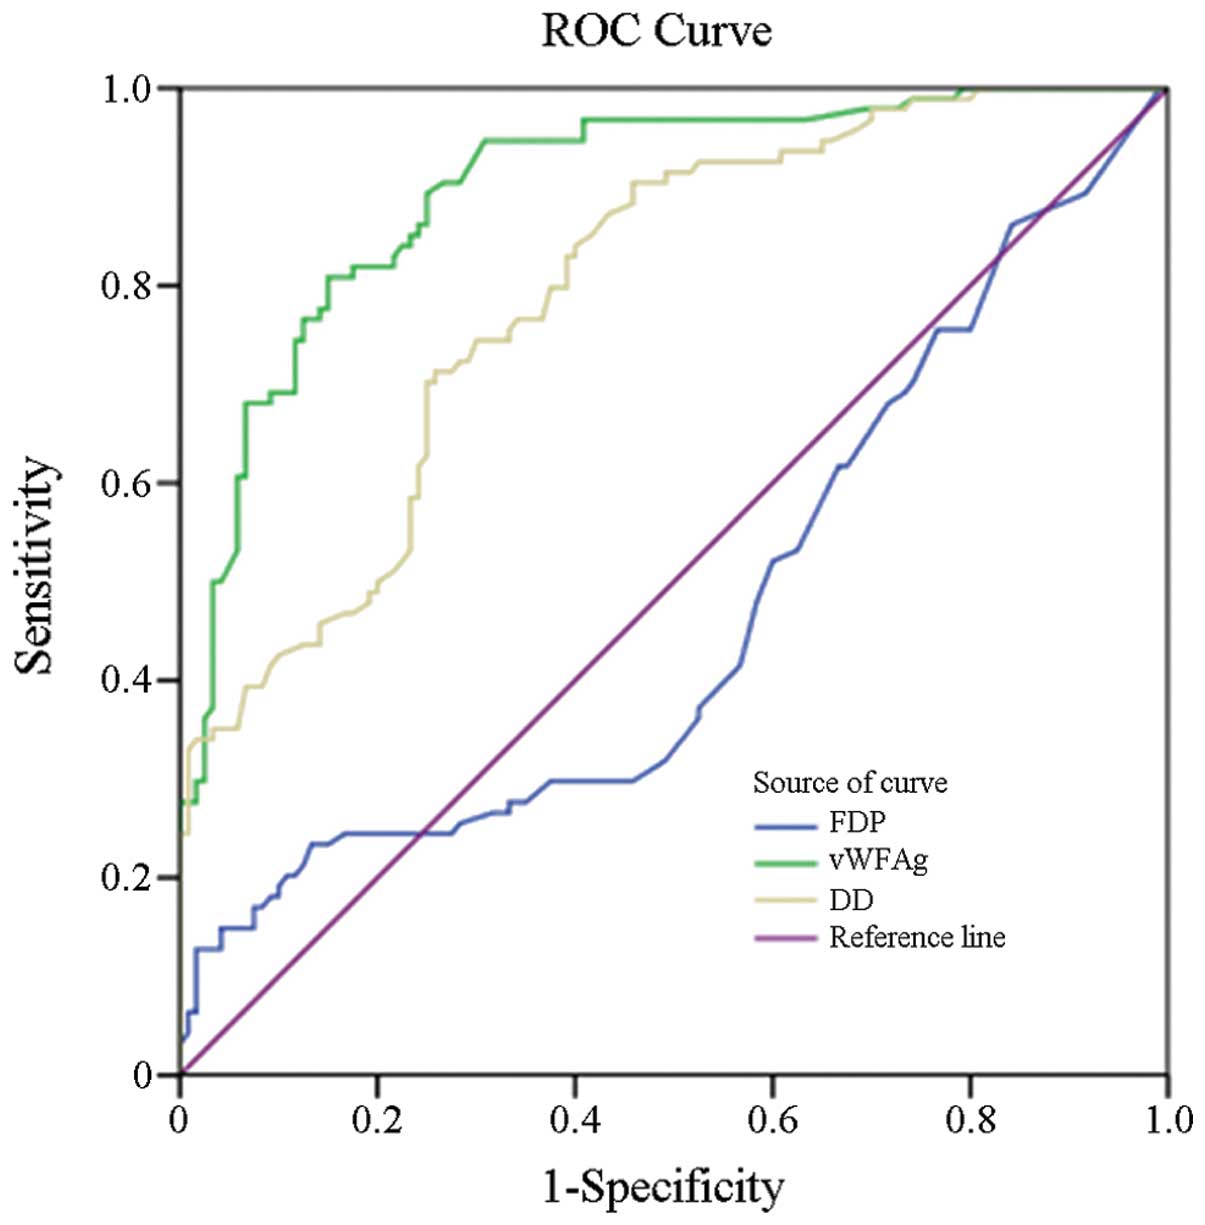
Logistic regression analysis
Areas under the ROC curve using vWF:Ag, D-D and FDP
concentrations as diagnostic markers were 0.900, 0.795 and 0.465,
respectively, in patients with acute cerebral infarction (Fig. 2). The 95% confidence intervals of
vWF:Ag, D-D and FDP were 0.85–0.94, 0.73–0.85 and 0.38–0.54,
respectively (Table III).
Therefore, the results demonstrate that the diagnostic value of
vWF:Ag was good, however, the diagnostic values of D-D and FDP were
generally poor.
| Table IIIArea under the ROC curve, standard
error, P-values and 95% CI for the test variables. |
Table III
Area under the ROC curve, standard
error, P-values and 95% CI for the test variables.
| Test variables | Area under the
curve | Standard error | P-values | 95% CI |
|---|
| vWF:Ag | 0.900 | 0.021 | <0.001 | 0.858–0.941 |
| D-D | 0.795 | 0.030 | <0.001 | 0.736–0.853 |
| FDP | 0.469 | 0.041 | 0.438 | 0.389–0.549 |
Logistic regression analysis revealed that the odds
ratio (OR) for vWF:Ag was 16.727 and the OR for D-D was 2.324,
which were statistically significant (P<0.001 and 0.023,
respectively). Therefore, high levels of vWF:Ag and D-D are risk
factors in acute cerebral infarction (P<0.05; Table IV).
| Table IVLogistic regression analysis of the
risk factors. |
Table IV
Logistic regression analysis of the
risk factors.
| Variable | Regression
coefficients | Standard error | Wald
χ2 | P-values | OR | 95% CI |
|---|
| Constant | −2.174 | 0.322 | 45.726 | <0.001 | 0.114 | |
| vWF:Ag | 2.817 | 0.365 | 59.435 | <0.001 | 16.727 | 8.173–34.232 |
| D-D | 0.843 | 0.371 | 5.156 | 0.023 | 2.324 | 1.122–4.811 |
| FDP | 0.712 | 0.518 | 1.888 | 0.169 | 2.039 | 0.738–5.633 |
Discussion
Using blood markers is an ideal method for rapidly
diagnosing acute cerebral infarction (7). A number of blood markers can be used
to predict acute cerebral infarction, although their specificity
does not compare with MRI and CT scans. However, the results can
complement each other.
vWF:Ag is a glycoprotein that is predominantly
synthesised by vascular endothelial cells and megakaryocytes. This
glycoprotein is stored in the α-particles of platelets and
Weibel-Palade bodies of endothelial cells. Under physiological
conditions, vascular endothelial cells exhibit a natural
antithrombotic ability, releasing prostacyclin and nitrogen
monoxidum to inhibit platelet activation. When vascular endothelial
cells are injured, reflex contraction occurs to slow the blood flow
and enhance platelet adhesion and aggregation. The factors released
by injured endothelial cells are also associated with thrombus
formation (8). vWF:Ag is a marker
for injury to vascular endothelial cells and the initiating factor
for atherosclerosis and thrombosis. A previous study reported that
vWF:Ag is one of the risk factors for acute cerebral infarction
(9). However, previous studies
based on enzyme-linked immunosorbent assay results (10) have shown that the rare large sample
multiangle immune turbidimetric method can be used for the
emergency care of vWF:Ag-associated acute cerebral infarction
(11).
Detecting vWF:Ag, D-D and FDP concentrations using
an automatic coagulation analyser by the monoclonal immune
turbidimetric method is simple, fast and reliable. Considering
vWF:Ag levels are affected by a number of factors, the present
study excluded patients with infections and blood diseases. Gender,
age and blood collection times of the two groups were recorded.
These control measures reduced the effects of confounding factors
on the vWF:Ag concentration. The results of the present study
demonstrated that vWF:Ag concentrations were significantly higher
in cerebral infarction patients as compared with the controls
(P<0.01), which is in accordance with the results of previous
studies on various populations (12,13).
Therefore, vWF:Ag levels reflect vascular endothelial cell injury
in patients with acute cerebral infarction.
D-D is the final degradation product of cross-linked
fibrin. Levels have been shown to be elevated in several acute
thrombotic disorders, with high sensitivity and negative predictive
values. D-D reagents from various manufacturers have different
normal values. Manufacturers prepare different D-D molecular weight
degradation fragments with various monoclonal antibodies, thus, D-D
has highly variable weights, ranging between 50 and >228,000 Da
(14). In the present study, D-D
concentrations were shown to be significantly higher in patients
with acute cerebral infarction as compared with the controls
(P<0.01). This result indicates that more fibrin is present in
the thrombus of acute cerebral infarction patients, thus, D-D
levels contribute to the clinical diagnosis of acute cerebral
infarction. Studies by Hollestelle et al and Chuang et
al reached the same conclusion (15,16).
FDPs are protein fragments generated by the action
of plasmin on fibrin and fibrinogen, and are associated with the
activation of fibrinolytic systems, including fibrinogen
degradation product, non-cross-linked fibrin and cross-linked
fibrin degradation product. Increasing vascular endothelial cell
damage and exposure of the subendothelial matrix and collagen
fibres causes increased fibrin thrombus formation, activation of
the fibrinolytic system, blood hypercoagulability and the incidence
of acute cerebral infarction. In the current study, a reference
range of <5 mg/l was used. FDP levels reflect fibrinolytic
hyperthyroidism. The results demonstrated that the acute cerebral
infarction group had higher FDP levels, but no statistical
significant difference was observed in FDP between the groups
(P>0.05). A recent study by Hirano et al (17) revealed that FDP levels were
significantly higher in patients with acute cerebral infarction
when compared with the controls (P<0.01). However, their results
differ to those of the current study. This discrepancy may be due
to differences in sample size, detection methods, study design and
the use of anticoagulant drugs.
Previous studies have shown that patients with acute
cerebral infarction exhibit increasing vWF:Ag levels with the
progression of the disease (18).
Levels of vWF:Ag and D-D significantly correlated with the NIHSS
scores, and vWF:Ag and D-D concentrations also exhibited a
significant correlation. However, FDP did not correlate with D-D or
vWF:Ag concentrations or the NIHSS scores. Therefore, increasing
vascular endothelial cell damage and exposure of the subendothelial
matrix and collagen fibres causes increased fibrin thrombus
formation, activation of the fibrinolytic system, blood
hypercoagulability and the incidence of acute cerebral
infarction.
The area under the ROC curve is widely used for
measuring the performance of classification and diagnostic
criteria. Theoretically, the area under the curve is 0.5≤AUC≤1,
with higher areas indicating increasing diagnostic values. In the
present study, the area under the ROC curve using vWF:Ag as a
diagnostic marker for acute cerebral infarction was 0.900, while
for D-D and FDP the areas were 0.795 and 0.465, respectively. These
observations indicate that the accuracy of the markers for
diagnosing acute cerebral infarction is in the following order:
vWF:Ag>D-D>FDP. Thus, the diagnostic value of vWF:Ag was
satisfactory, but better compared with D-D.
Logistic regression was used to analyse the
significance of independent risk factors. The results demonstrated
that high levels of vWF:Ag and D-D were risk factors for acute
cerebral infarction. In addition, logistic regression analysis
revealed that the ORs of vWF:Ag and D-D were highly significant.
Thus, vWF:Ag and D-D are risk factors for acute cerebral
infarction.
In conclusion, the present study firstly
demonstrated that vWF:Ag and D-D levels linearly correlate with
NIHSS scores. Secondly, diagnosing acute cerebral infarction using
vWF:Ag via immune turbidimetry is more accurate than using D-D
concentration, however, D-D is more accurate compared with FDP.
Thirdly, vWF:Ag has a high negative predictive value and can be
used as a diagnosis marker for acute cerebral infarction. The
sensitivity and specificity values for diagnosing acute cerebral
infarction with vWF:Ag were 84% and 78%, respectively. Finally,
vWF:Ag levels are a risk factor for acute cerebral infarction.
Atherosclerosis occlusion and thrombosis are associated with acute
cerebral infarction, vascular endothelial cell injury and platelet
activation. Early disease detection of acute cerebral infarction
using plasma vWF:Ag and D-D levels can protect vascular endothelial
cells from further damage and improve the level of treatment and
patient prognosis.
Acknowledgements
The study was supported by a grant from the Suzhou
Science and Education Promotion Health Youth Technology Project
(no. SWKQ1023).
References
|
1
|
Moriguchi-Goto S, Yamashita A, Tamura N,
et al: ADAMTS-13 attenuates thrombus formation on type I collagen
surface and disrupted plaques under flow conditions.
Athersclerosis. 203:409–416. 2009. View Article : Google Scholar : PubMed/NCBI
|
|
2
|
Prisco D and Grifoni E: The role of
D-dimer testing in patients with suspected venous thromboembolism.
Semin Thromb Hemost. 35:50–59. 2009. View Article : Google Scholar : PubMed/NCBI
|
|
3
|
Park YW, Koh EJ and Choi HY: Correlation
between serum D-dimer level and volume in acute ischemic stroke. J
Korean Neurosurg Soc. 50:89–94. 2011.PubMed/NCBI
|
|
4
|
Bongers TN, de Bruijne EL, Dippel DW, et
al: Lower levels of ADAMTS13 are associated with cardiovascular
disease in young patients. Atherosclerosis. 207:250–254. 2009.
View Article : Google Scholar : PubMed/NCBI
|
|
5
|
Meng R, Ji X, Li B, Zhou J, Li W and Ding
Y: Dynamical levels of plasma F(1+2) and D-dimer in patients with
acute cerebral infarction during intravenous urokinase
thrombolysis. Neurol Res. 31:367–370. 2009.PubMed/NCBI
|
|
6
|
Isenegger J, Meier N, Lämmle B, et al:
D-dimers predict stroke subtype when assessed early. Cerebrovasc
Dis. 29:82–86. 2010. View Article : Google Scholar : PubMed/NCBI
|
|
7
|
Dougu N, Takashima S, Sasahara E, et al:
Predictors of poor outcome in patients with acute cerebral
infarction. J Clin Neurol. 7:197–202. 2011. View Article : Google Scholar : PubMed/NCBI
|
|
8
|
Szotowski B, Antoniak S, Poller W,
Schultheiss HP and Rauch U: Procoagulant soluble tissue factor is
released from endothelial cells in response to inflammatory
cytokines. Circ Res. 96:1233–1239. 2005. View Article : Google Scholar : PubMed/NCBI
|
|
9
|
Bongers TN, de Maat MP, van Goor ML, et
al: High von Willebrand factor levels increase the risk of first
ischemic stroke: influence of ADAMTS13, inflammation, and genetic
variability. Stroke. 37:2672–2677. 2006. View Article : Google Scholar : PubMed/NCBI
|
|
10
|
Schutte R, Schutte AE, Van Rooyen JM, et
al: Von Willebrand factor as marker of vascular function in South
African women: the POWIRS Study. Am J Hypertens. 21:1298–1303.
2008. View Article : Google Scholar : PubMed/NCBI
|
|
11
|
Cambronero F, Vilchez JA, García-Honrubia
A, et al: Plasma levels of von Willebrand factor are increased in
patients with hypertrophic cardiomyopathy. Thromb Res. 126:e46–e50.
2010. View Article : Google Scholar : PubMed/NCBI
|
|
12
|
Kleinschnitz C, De Meyer SF, Schwarz T, et
al: Deficiency of von Willebrand factor protects mice from ischemic
stroke. Blood. 113:3600–3603. 2009. View Article : Google Scholar : PubMed/NCBI
|
|
13
|
Andersson HM, Siegerink B, Luken BM, et
al: High VWF, low ADAMTS13, and oral contraceptives increase the
risk of ischemic stroke and myocardial infarction in young women.
Blood. 119:1555–1560. 2012. View Article : Google Scholar : PubMed/NCBI
|
|
14
|
Wakabayashi S, Ishikawa S,
Hirota-Kawadobora M, et al: Analysis of antibody reactivity for FDP
D-dimer fragments by western blotting. Rinsho Byori. 56:449–454.
2008.(In Japanese).
|
|
15
|
Hollestelle MJ, Lai KW, van Deuren M,
Lenting PJ, de Groot PG, Sprong T and Bovenschen N: Cleavage of von
Willebrand factor by granzyme M destroys its factor VIII binding
capacity. PloS One. 6:e242162011. View Article : Google Scholar : PubMed/NCBI
|
|
16
|
Chuang SY, Bai CH, Chen WH, Lien LM and
Pan WH: Fibrinogen independently predicts the development of
ischemic stroke in a Taiwanese population: CVDFACTS study. Stroke.
40:1578–1584. 2009. View Article : Google Scholar : PubMed/NCBI
|
|
17
|
Hirano K, Takashima S, Dougu N, et al:
Study of hemostatic biomarkers in acute ischemic stroke by clinical
subtype. J Stroke Cerebrovasc Dis. 21:404–410. 2012. View Article : Google Scholar : PubMed/NCBI
|
|
18
|
Hu HT, Fen F and Ding MP: Effects of
puerarin with aspirin on the markers of damaged vascular
endothelial cells in patients with acute cerebral infarction.
Zhongguo Zhong Yao Za Zhi. 33:2827–2829. 2008.(In Chinese).
|