Evaluating the diagnostic value of vWF:Ag, D-D and FDP in patients with acute cerebral infarction using ROC curves

  • Authors:
    • Dongmin Shi
    • Ting Xia
    • Hongxuan Feng
    • Qingzhang Cheng
  • View Affiliations

  • Published online on: April 3, 2014     https://doi.org/10.3892/etm.2014.1665
  • Pages: 1573-1577
Metrics: Total Views: 0 (Spandidos Publications: | PMC Statistics: )
Total PDF Downloads: 0 (Spandidos Publications: | PMC Statistics: )


Abstract

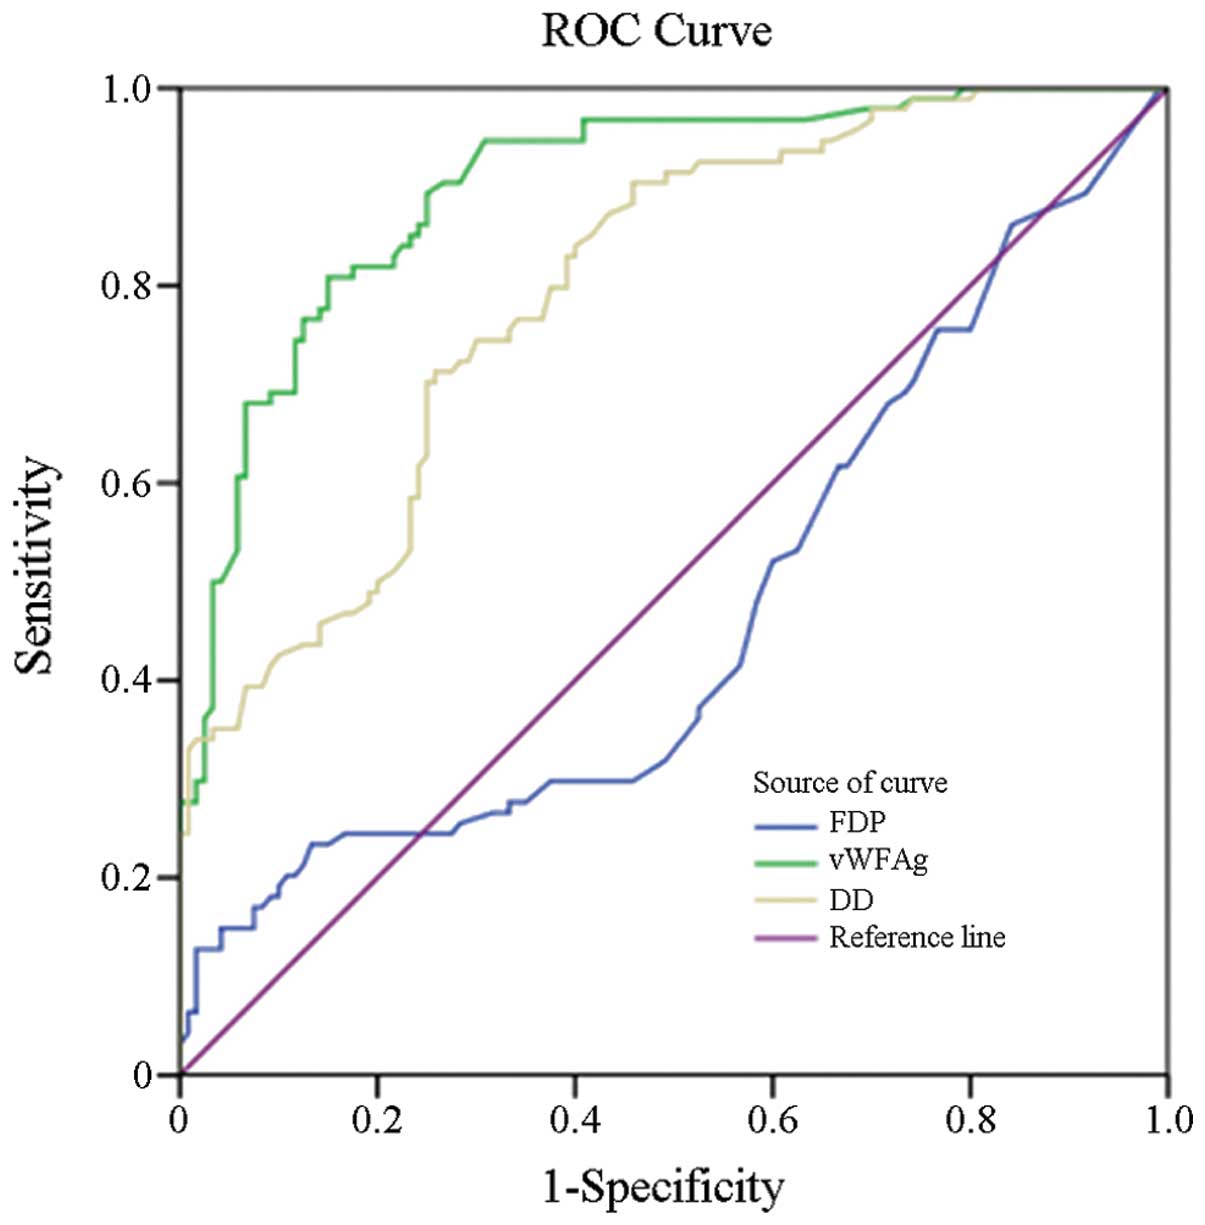
Cerebral infarction is usually associated with arteriosclerosis, vascular endothelial cell injury and blood flow through the vascular system. The diagnostic value of markers, including von Willebrand factor antigen (vWF:Ag), D‑dimer (D‑D) and fibrinogen/fibrin degradation product (FDP), have not been studied in patients with acute cerebral infarction. Thus, the aim of the present study was to use receiver operating characteristic (ROC) curves to evaluate the diagnostic significance of vWF:Ag, D‑D and FDP in 94 cases of acute cerebral infarction. The results revealed that vWF:Ag and D‑D concentrations were significantly higher in acute cerebral infarction patients as compared with the normal controls (P<0.01), whereas no statistically significant difference in FDP was observed between the groups (P>0.01). Plasma vWF:Ag and D‑D concentrations significantly correlated with the National Institute of Health Stroke Scale (NIHSS) scores (r=0.625 and 0.582, respectively; P<0.01). In addition, the vWF:Ag concentration significantly correlated with the D‑D concentration (r=0.320; P<0.01), whereas FDP concentration did not correlate with D‑D or vWF:Ag concentrations or the NIHSS scores (r=0.172, 0.188 and 0.065, respectively; P>0.05). The area under the ROC curve using vWF:Ag as a diagnostic marker in patients with acute cerebral infarction was 0.900, while for D‑D the area was 0.795 and for FDP the area was 0.465. Logistic regression analysis revealed that the odds ratios of vWF:Ag and D‑D were 16.727 and 2.324, respectively, which were statistically significant (P<0.001 and 0.023, respectively). These results indicated that using vWF:Ag as a diagnostic marker is likely to significantly improve the sensitivity of diagnosing patients with acute cerebral infarction. The diagnostic value of vWF:Ag concentration was significantly higher compared with D‑D and FDP levels.
View Figures
View References

Related Articles

Journal Cover

June-2014
Volume 7 Issue 6

Print ISSN: 1792-0981
Online ISSN:1792-1015

Sign up for eToc alerts

Recommend to Library

Copy and paste a formatted citation
x
Spandidos Publications style
Shi D, Xia T, Feng H and Cheng Q: Evaluating the diagnostic value of vWF:Ag, D-D and FDP in patients with acute cerebral infarction using ROC curves. Exp Ther Med 7: 1573-1577, 2014
APA
Shi, D., Xia, T., Feng, H., & Cheng, Q. (2014). Evaluating the diagnostic value of vWF:Ag, D-D and FDP in patients with acute cerebral infarction using ROC curves. Experimental and Therapeutic Medicine, 7, 1573-1577. https://doi.org/10.3892/etm.2014.1665
MLA
Shi, D., Xia, T., Feng, H., Cheng, Q."Evaluating the diagnostic value of vWF:Ag, D-D and FDP in patients with acute cerebral infarction using ROC curves". Experimental and Therapeutic Medicine 7.6 (2014): 1573-1577.
Chicago
Shi, D., Xia, T., Feng, H., Cheng, Q."Evaluating the diagnostic value of vWF:Ag, D-D and FDP in patients with acute cerebral infarction using ROC curves". Experimental and Therapeutic Medicine 7, no. 6 (2014): 1573-1577. https://doi.org/10.3892/etm.2014.1665