Introduction
Non-alcoholic fatty liver disease (NAFLD) is defined
as the presence of fat accumulation in the liver, detected by
imaging or histology, with no causes of secondary fat accumulation,
including significant alcohol consumption (1,2).
NAFLD is associated with obesity, diabetes and hyperlipidemia, and
can be subcategorized into non-alcoholic fatty liver and
non-alcoholic steatohepatitis (NASH). NASH is differentiated by the
presence of hepatocyte injury (1).
The survival rate of NAFLD patients is lower than that of the
general population standardized mortality ratio resulting from
cardiovascular disease and hepatocellular carcinoma (3–5).
Thus, it is important for NAFLD to be diagnosed and treated
(6). The diagnosis of NAFLD is
based on an assessment of fat accumulation in the liver by imaging
or liver biopsy. Abdominal ultrasound (US) is the least complicated
of the diagnostic imaging modalities, which include magnetic
resonance imaging and computed tomography (7). Elastography, an advanced form of
abdominal US, is a new method of diagnosing NASH by evaluating
fibrosis (8). One of the
limitations of elastography is that the examination is expensive
and not widely available. Liver biopsy is the most accurate
diagnostic method and is considered the gold standard, but harbors
limitations due to the invasiveness of the technique. Abdominal US
is the first-line test for fat accumulation in the liver (9). However, it is not practical to
perform abdominal US in all patients to screen for NAFLD. The
ability to triage patients with suspected NAFLD and selectively
perform abdominal US is desirable. The thresholds of waist
circumference for the diagnosis of NAFLD are 85.0 cm in males and
80.0 cm in females (2). However,
despite the determination of waist circumference being simple and
requiring no equipment, the examination is not accurate due to
operator dependency.
Blood examinations are performed widely, and
laboratory data are quantitative and reliable. However, laboratory
data with regard to NAFLD remain controversial. NAFLD patients have
been shown to have higher levels of alkaline phosphatase (ALP),
aspartate aminotransferase (AST), alanine aminotransferase (ALT)
and γ-glutamyl transpeptidase (γ-GTP) (10). By contrast, Chalasani et al
reported that laboratory data of patients with NAFLD and NASH can
be within the normal ranges (1).
Therefore, in the present study, the association
between laboratory data and NAFLD was investigated with the aim of
identifying thresholds for the diagnosis of NAFLD.
Materials and methods
Inclusion criteria
Patients that had undergone abdominal US between
April 2013 and August 2013, and that had laboratory data available
on the date of abdominal US, were enrolled in the study. Patient
records were analyzed retrospectively. Patients were divided into
two groups: Non-NAFLD patients (NF; n=94) and NAFLD patients (F;
n=80). The study protocol was submitted to the Institutional
Ethical Committee of the National Hospital Organization Shimoshizu
Hospital (Yotsukaidō, Japan), and the study was determined to not
be a clinical trial since it was performed as part of routine
clinical practice. Written informed patient consent was obtained
from the patient/ or the patient’s family. Patient anonymity was
preserved throughout the study.
Exclusion criteria
Patients were excluded from the study if laboratory
data from the day of the US were not available. Patients were also
excluded if they tested positive for the hepatitis B virus surface
antigen or anti-hepatitis C virus antibody. The presence of liver
cirrhosis, primary biliary cirrhosis, autoimmune hepatitis or high
alcohol consumption also excluded patients from the study due to
the potentially elevated liver enzymes (11,12).
In addition, patients with muscular dystrophy or dermatomyositis
were excluded due to the potentially elevated AST or lactate
dehydrogenase (LDH) levels. Patients were also excluded if they had
been prescribed prednisolone, which can cause NAFLD (13), or if they had been prescribed
methotrexate due to the potential of this drug in inducing liver
toxicity (14).
Abdominal US
Diagnosis of NAFLD was determined using abdominal US
with standardized criteria (15,16).
Briefly, NAFLD was diagnosed when a bright liver or hepatorenal
echo contrast was observed on the abdominal US scans. Abdominal US
was performed by Senior Fellows of the Japan Society of Ultrasonics
in Medicine with an SSA-700A instrument (Toshiba Medical Systems
Corporation, Ohtawara, Japan) using a 3.75 MHz curved-array probe
(PVT-375BT; Toshiba Medical Systems Corporation) in the US unit.
Abdominal US was performed by Board Certified Fellows of the Japan
Society of Ultrasonics in Medicine. Operators were blinded to the
clinical and laboratory data.
Laboratory data
Analyzed laboratory parameters included ALP, AST,
ALT, γ-GTP, LDH, high-density lipoprotein cholesterol (HDL),
low-density lipoprotein cholesterol (LDL), triglycerides (TG) and
total cholesterol (T-chol) levels.
Statistical analysis
Receiver operating characteristic (ROC) curves were
created using JMP 10.0.2 software (SAS Institute, Cary, NC, USA).
Parameters, including the patient age and the levels of ALP, AST,
ALT, γ-GTP, LDH, HDL, LDL, TG and T-chol, were investigated on the
day of abdominal US. The area under the curve (AUC) was used as a
measure of diagnostic efficacy. The threshold value was determined
as the highest sensitivity and specificity values, and was
calculated automatically using software that determined the
location where a line with a slope of 45° contacted the ROC curve.
The Wilcoxon signed-rank test was used for the comparison of
variables between the NF and F groups. In addition, Fisher’s exact
probability test was used to compare the sensitivity of using ALT
levels of >19 IU/l and TG levels of >101 mg/dl for the
diagnosis of NAFLD. P<0.05 was considered to indicate a
statistically significant difference.
Results
Laboratory data
A total of 80 NAFLD and 94 non-NAFLD patients were
enrolled in the study. The laboratory data of each group are
presented in Table I. Levels of
AST, ALT, HDL, LDL, TG and T-chol were higher in the F group
compared with the NF group.
 | Table IComparison of variables between the
non-NAFLD and NAFLD patients. |
Table I
Comparison of variables between the
non-NAFLD and NAFLD patients.
| Variables | NF group | F group | P-value |
|---|
| Age (years) | 67.7±1.5 | 66.0±1.5 | 0.4049 |
| ALP (IU/l) | 254.9±18.1 | 278.9±15.1 | 0.3126 |
| AST (IU/l) | 12.8±3.2 | 38.5±2.9 | 0.0077 |
| ALT (IU/l) | 20.6±4.0 | 44.5±3.6 | <0.0001 |
| γ-GTP (IU/l) | 52.8±17.0 | 76.7±14.0 | 0.2815 |
| LDH (IU/l) | 198.7±5.6 | 202.2±7.3 | 0.6948 |
| HDL (mg/dl) | 63.2±2.2 | 54.0±2.3 | 0.0046 |
| LDL (mg/dl) | 109.8±3.3 | 121.9±3.5 | 0.0126 |
| TG (mg/dl) | 96.1±6.8 | 163.1±7.4 | <0.0001 |
| T-chol (mg/dl) | 193.1±4.4 | 211.7±4.6 | 0.0042 |
ROC analysis
Fig. 1 shows the
ROC analysis of the variables for the diagnosis of NAFLD. The AUC,
sensitivity and specificity values of each variable are presented
in Table II. The AUC for ALT was
0.743, and the threshold of ALT for the diagnosis of NAFLD was 19.0
IU/l. Sensitivity and specificity values at this threshold were
80.0 and 63.5%, respectively. The AUC for TG was 0.778, and the
threshold of TG for the diagnosis of NAFLD was 101 mg/dl.
Sensitivity and specificity values at this threshold were 78.4 and
64.3%, respectively. The sensitivities of these two variables were
~80%, however, the specificity values were <65%, which was
low.
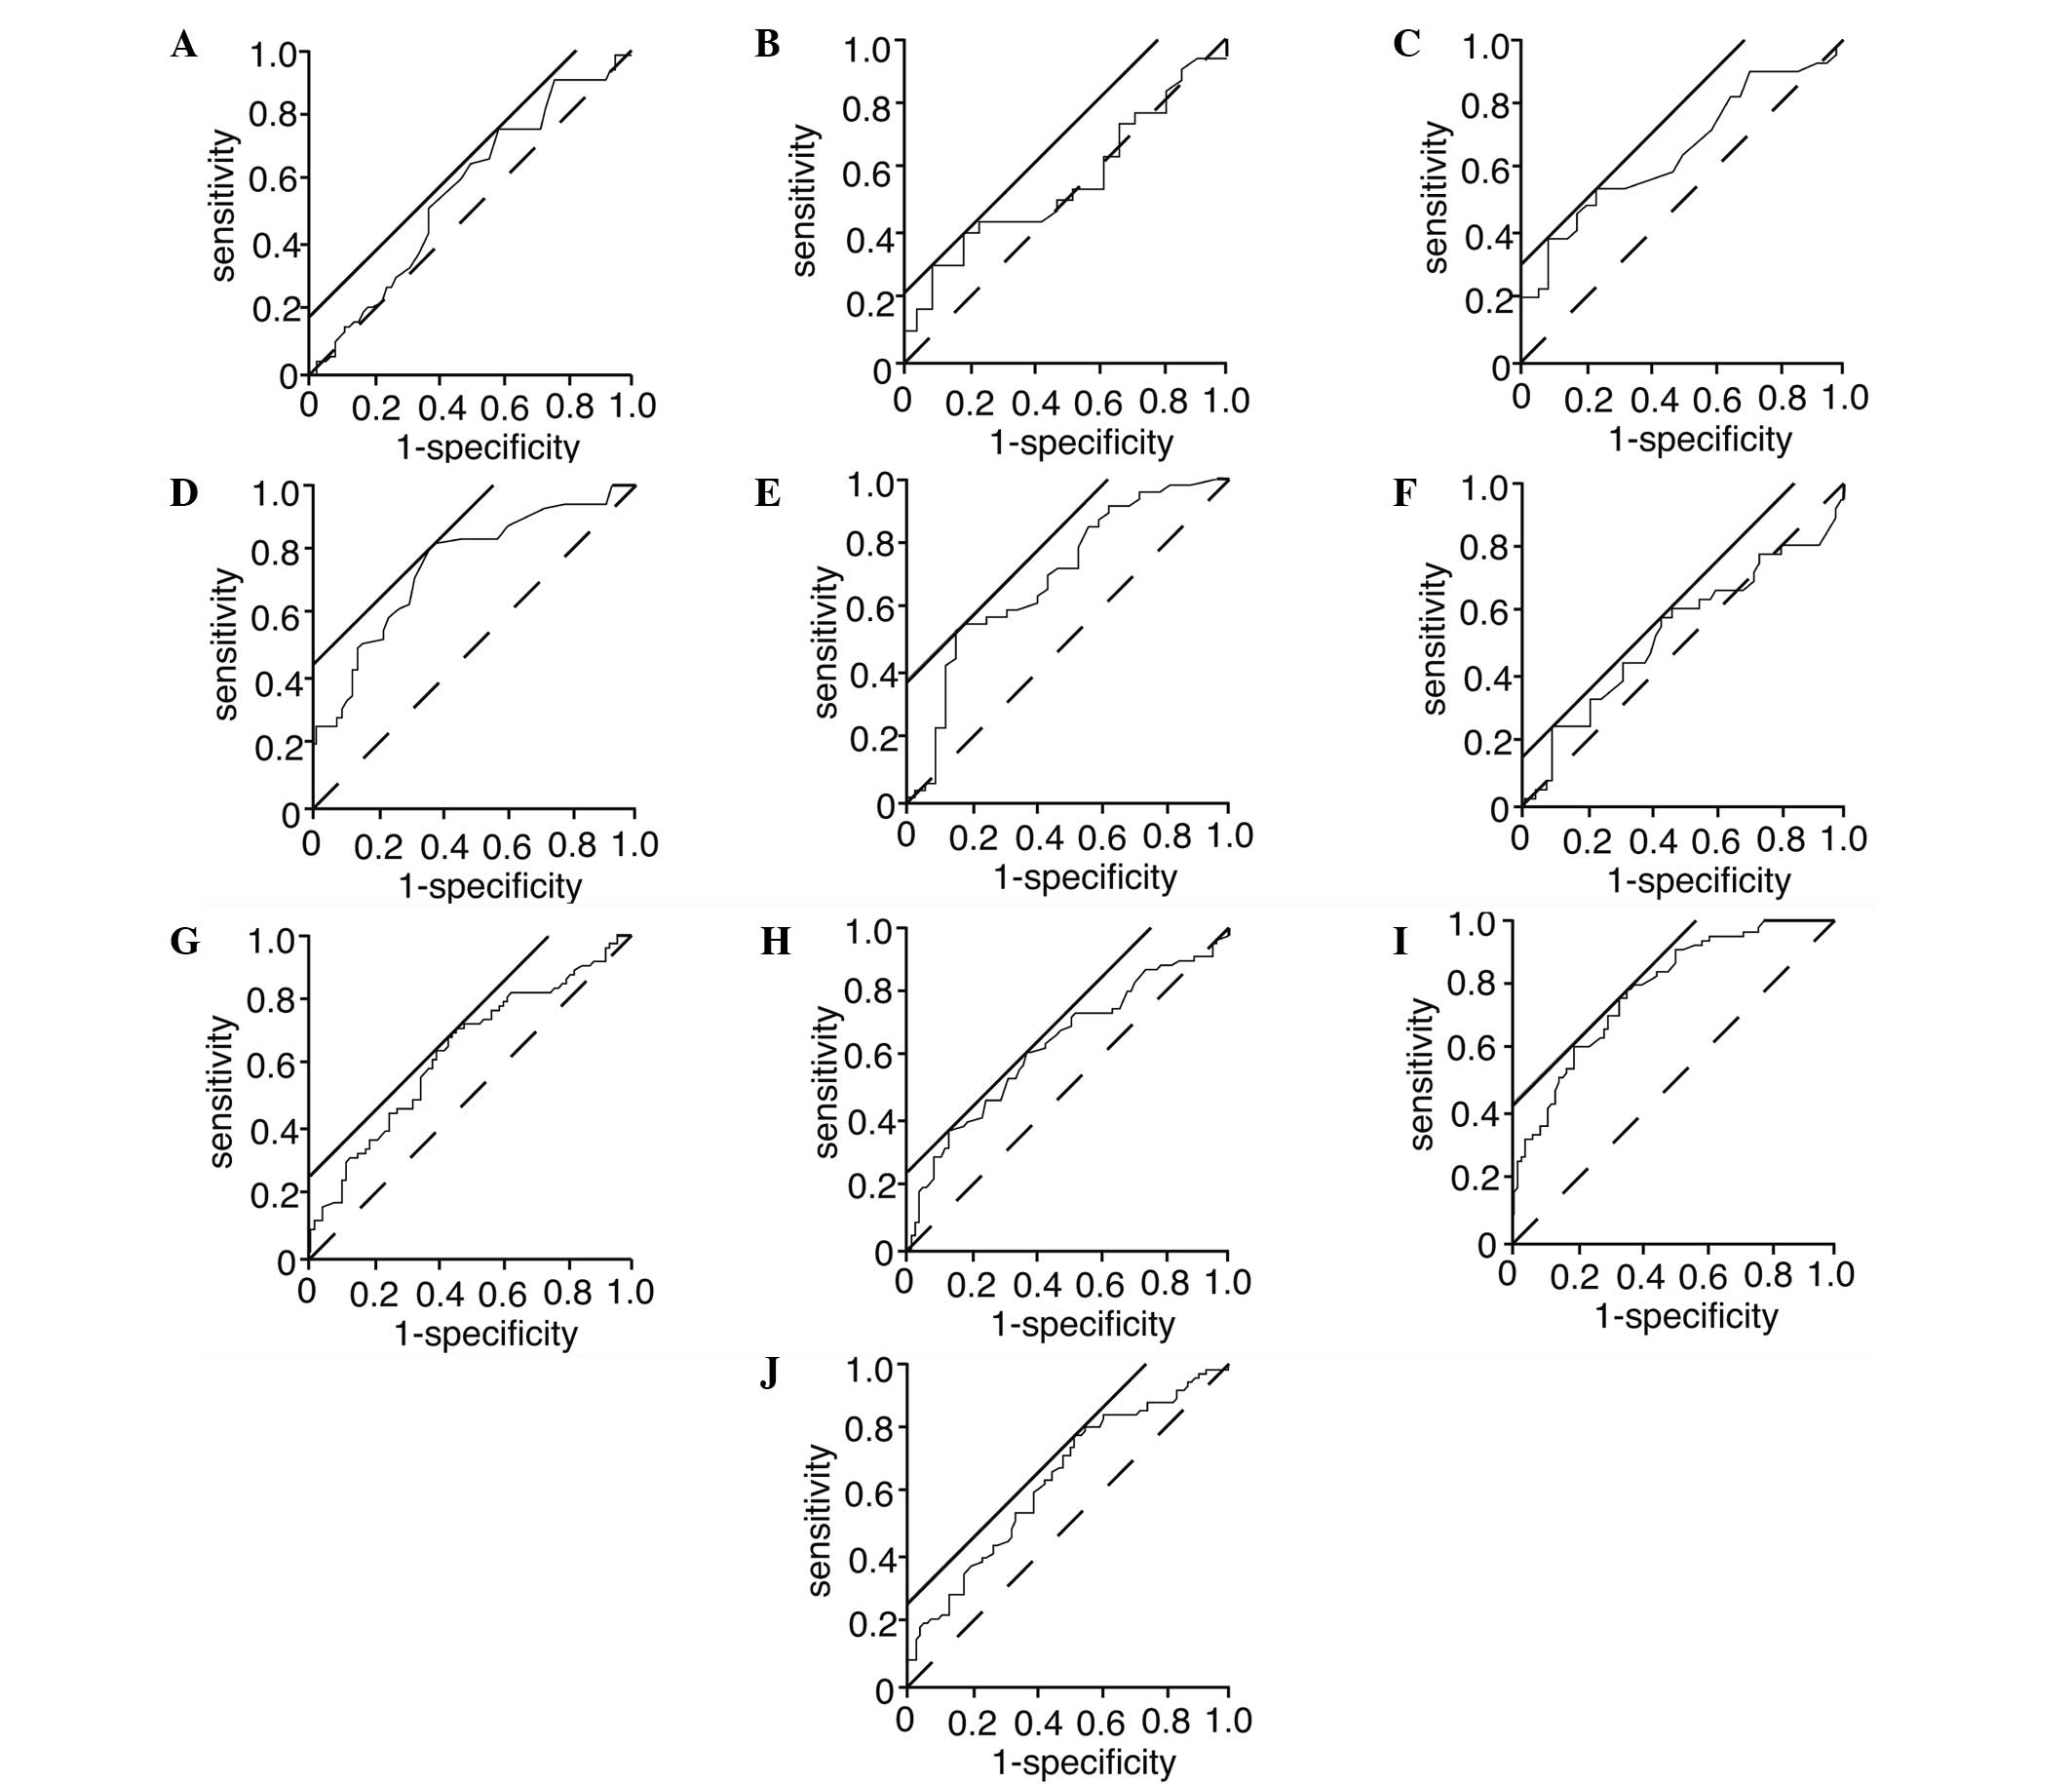 | Figure 1ROC curves of the results from the
blood examinations conducted on the day of the abdominal US.
Analyzed data included (A) patient age and levels of (B) ALP, (C)
AST, (D) ALT, (E) γ-GTP, (F) LDH, (G) HDL, (H) LDL, (I) TG and (J)
T-chol. The solid straight line (with a slope of 45°) was used to
calculate the threshold value using JMP 8.0.2 software. The broken
line was used as a reference. ROC, receiver operating
characteristic; US, ultrasound; ALP, alkaline phosphatase; AST,
aspartate aminotransferase; ALT, alanine aminotransferase; γ-GTP,
γ-glutamyl transpeptidase; LDH, lactate dehydrogenase; HDL,
high-density lipoprotein cholesterol; LDL, low-density lipoprotein
cholesterol; TG, triglycerides; T-chol, total cholesterol. |
| Table IIAUC, thresholds, sensitivity and
specificity values for the variables. |
Table II
AUC, thresholds, sensitivity and
specificity values for the variables.
| Variables | AUC | Threshold | Sensitivity (%) | Specificity (%) |
|---|
| Age (years) | 0.566 | 72.0 | 75.8 | 41.4 |
| ALP (IU/l) | 0.550 | 300 | 40.0 | 81.0 |
| AST (IU/l) | 0.654 | 30.0 | 53.9 | 76.5 |
| ALT (IU/l) | 0.743 | 19.0 | 80.0 | 63.5 |
| γ-GTP (IU/l) | 0.698 | 48.0 | 53.1 | 84.3 |
| LDH (IU/l) | 0.536 | 194 | 58.3 | 56.7 |
| HDL (mg/dl) | 0.635 | 61.1 | 71.2 | 54.2 |
| LDL (mg/dl) | 0.632 | 118 | 61.3 | 62.5 |
| TG (mg/dl) | 0.778 | 101 | 78.4 | 64.3 |
| T-chol (mg/dl) | 0.638 | 192 | 77.5 | 48.3 |
To improve the diagnostic accuracy, a combination of
the thresholds of ALT and TG was analyzed for the diagnosis of
NAFLD. Patients were divided into two groups according to the
levels of ALT and TG. Patients with ALT levels of >19 IU/l and
TG levels of >101 mg/dl were categorized as ‘positive’, while
the remaining patients were categorized as ‘negative’. Table III shows a two-contingency table
according to the diagnosis of fatty liver or non-fatty liver with
the combined threshold value of ALT >19 IU/l and TG >101
mg/dl. For this threshold combination, the sensitivity,
specificity, positive predictive value and negative predictive
value were 67.5% [95% confidence interval (CI), 60.0–73.7], 80.9%
(95% CI, 74.5–86.2), 75.0% (95% CI, 66.7–81.9) and 74.5% (95% CI,
68.7–79.4), respectively. Each value was calculated based on
Table III.
| Table IIIDiagnosis of fatty liver (number of
patients). |
Table III
Diagnosis of fatty liver (number of
patients).
| Subgroup | F group | NF group | Total |
|---|
| Positive | 54 | 18 | 72 |
| Negative | 26 | 76 | 102 |
| Total | 80 | 94 | 174 |
Discussion
Elevated ALT levels are associated with NAFLD
clinically and histologically (10,17).
The levels of ALT reflect the eating habits of the patient, with
decreased levels observed following the consumption of a diet high
in vegetables and low in animal-based protein (18). In the present study, the threshold
value of ALT for the diagnosis of NAFLD was 19.0 IU/l. Notably, the
threshold value was within the normal limits. In the study by Wu
et al, the upper normal limit of ALT was analyzed (19). The authors enrolled 34,346 subjects
who completed a health check-up, and excluded subjects with risk
factors associated with elevated ALT levels, including high body
mass index, high waist circumference, high glucose levels, high
cholesterol levels, low levels of HDL, high levels of TG, hepatitis
B virus surface antigen, anti-hepatitis C virus antibody and NAFLD.
The threshold of ALT selected in the present study was within the
normal limit of 27 IU/l. It has been hypothesized that a slight
elevation in the levels of ALT is indicative of NAFLD (20). This hypothesis is supported by
previous studies that have reported that a slight elevation in the
levels of ALT and γ-GTP within the normal limits indicates NAFLD
(21,22).
TG levels are more commonly associated with NAFLD,
as compared with LDL and HDL levels (23). In the present study, TG
consistently exhibited the highest AUC. In addition, the present
study found that the threshold of TG for the diagnosis of NAFLD was
101 mg/dl. To the best of our knowledge, these results are the
first with regard to the threshold of TG. The observations of the
current study clearly demonstrate that ALT and TG levels were
useful for the diagnosis of NAFLD, as reported previously (24).
In the present study, the individual thresholds of
ALT and TG for the diagnosis of NAFLD exhibited low specificity.
Thus, a combination of ALT and TG thresholds was investigated with
the aim of improving the NAFLD diagnostic capability. The
specificity and positive predictive value, when using the combined
thresholds of ALT levels of >19 IU/l and TG levels of >101
mg/dl, were 80.9 and 75.0%, respectively. Therefore, using the
combination of ALT and TG thresholds was useful for the diagnosis
of NAFLD.
In conclusion, ALT levels of >19 IU/l or TG
levels of >101 mg/dl were useful markers for the screening of
NAFLD. However, a stronger marker for the diagnosis of NAFLD was
the combination of ALT levels of >19 IU/l and TG levels of
>101 mg/dl.
References
|
1
|
Chalasani N, Younossi Z, Lavine JE, et al:
The diagnosis and management of non-alcoholic fatty liver disease:
practice Guideline by the American Association for the Study of
Liver Diseases, American College of Gastroenterology, and the
American Gastroenterological Association. Hepatology. 55:2005–2023.
2012. View Article : Google Scholar
|
|
2
|
Abe N, Honda S and Jahng D: Evaluation of
waist circumference cut-off values as a marker for fatty liver
among Japanese workers. Saf Health Work. 3:287–293. 2012.
View Article : Google Scholar : PubMed/NCBI
|
|
3
|
Adams LA, Lymp JF, St Sauver J, et al: The
natural history of nonalcoholic fatty liver disease: a
population-based cohort study. Gastroenterology. 129:113–121. 2005.
View Article : Google Scholar : PubMed/NCBI
|
|
4
|
Dunn W, Xu R, Wingard DL, et al: Suspected
nonalcoholic fatty liver disease and mortality risk in a
population-based cohort study. Am J Gastroenterol. 103:2263–2271.
2008. View Article : Google Scholar : PubMed/NCBI
|
|
5
|
Ascha MS, Hanouneh IA, Lopez R, et al: The
incidence and risk factors of hepatocellular carcinoma in patients
with nonalcoholic steatohepatitis. Hepatology. 51:1972–1978. 2010.
View Article : Google Scholar : PubMed/NCBI
|
|
6
|
Chatrath H, Vuppalanchi R and Chalasani N:
Dyslipidemia in patients with nonalcoholic fatty liver disease.
Semin Liver Dis. 32:22–29. 2012. View Article : Google Scholar : PubMed/NCBI
|
|
7
|
Musso G, Gambino R, Cassader M and Pagano
G: Meta-analysis: natural history of non-alcoholic fatty liver
disease (NAFLD) and diagnostic accuracy of non-invasive tests for
liver disease severity. Ann Med. 43:617–649. 2011. View Article : Google Scholar : PubMed/NCBI
|
|
8
|
von Volkmann HL, Havre RF, Løberg EM, et
al: Quantitative measurement of ultrasound attenuation and
hepato-renal index in non-alcoholic fatty liver disease. Med
Ultrason. 15:16–22. 2013.PubMed/NCBI
|
|
9
|
Festi D, Schiumerini R, Marzi L, et al:
Review article: the diagnosis of non-alcoholic fatty liver disease
- availability and accuracy of non-invasive methods. Aliment
Pharmacol Ther. 37:392–400. 2013. View Article : Google Scholar : PubMed/NCBI
|
|
10
|
Neuschwander-Tetri BA, Clark JM, Bass NM,
et al: NASH Clinical Research Network: Clinical, laboratory and
histological associations in adults with nonalcoholic fatty liver
disease. Hepatology. 52:913–924. 2010. View Article : Google Scholar
|
|
11
|
Alvarez F, Berg PA, Bianchi FB, et al:
International Autoimmune Hepatitis Group Report: review of criteria
for diagnosis of autoimmune hepatitis. J Hepatol. 31:929–938. 1999.
View Article : Google Scholar : PubMed/NCBI
|
|
12
|
Lindor KD, Gershwin ME, Poupon R, et al:
American Association for Study of Liver Diseases: Primary biliary
cirrhosis. Hepatology. 50:291–308. 2009. View Article : Google Scholar : PubMed/NCBI
|
|
13
|
Matsumoto T, Yamasaki S, Arakawa A, et al:
Exposure to a high total dosage of glucocorticoids produces
non-alcoholic steatohepatits. Pathol Int. 57:388–389. 2007.
View Article : Google Scholar : PubMed/NCBI
|
|
14
|
Khan N, Abbas AM, Whang N, et al:
Incidence of liver toxicity in inflammatory bowel disease patients
treated with methotrexate: a meta-analysis of clinical trials.
Inflamm Bowel Dis. 18:359–367. 2012. View Article : Google Scholar : PubMed/NCBI
|
|
15
|
Sanyal AJ: American Gastroenterological
Association: AGA technical review on nonalcoholic fatty liver
disease. Gastroenterology. 123:1705–1725. 2002. View Article : Google Scholar : PubMed/NCBI
|
|
16
|
Bedogni G, Miglioli L, Masutti F, et al:
Prevalence of and risk factors for nonalcoholic fatty liver
disease: the Dionysos nutrition and liver study. Hepatology.
42:44–52. 2005. View Article : Google Scholar : PubMed/NCBI
|
|
17
|
Anty R, Iannelli A, Patouraux S, et al: A
new composite model including metabolic syndrome, alanine
aminotransferase and cytokeratin-18 for the diagnosis of
non-alcoholic steatohepatitis in morbidly obese patients. Aliment
Pharmacol Ther. 32:1315–1322. 2010. View Article : Google Scholar
|
|
18
|
Iwamoto M, Yagi K, Yazumi K, et al: Eating
a healthy lunch improves serum alanine aminotransferase activity.
Lipids Health Dis. 12:1342013. View Article : Google Scholar : PubMed/NCBI
|
|
19
|
Wu WC, Wu CY, Wang YJ, et al: Updated
thresholds for serum alanine aminotransferase level in a
large-scale population study composed of 34 346 subjects. Aliment
Pharmacol Ther. 36:560–568. 2012. View Article : Google Scholar : PubMed/NCBI
|
|
20
|
Verma S, Jensen D, Hart J and Mohanty SR:
Predictive value of ALT levels for non-alcoholic steatohepatitis
(NASH) and advanced fibrosis in non-alcoholic fatty liver disease
(NAFLD). Liver Int. 33:1398–1405. 2013. View Article : Google Scholar : PubMed/NCBI
|
|
21
|
Xia MF, Yan HM, Lin HD, et al: Elevation
of liver enzymes within the normal limits and metabolic syndrome.
Clin Exp Pharmacol Physiol. 38:373–379. 2011. View Article : Google Scholar : PubMed/NCBI
|
|
22
|
Nomura K, Yano E, Shinozaki T and Tagawa
K: Efficacy and effectiveness of liver screening program to detect
fatty liver in the periodic health check-ups. J Occup Health.
46:423–428. 2004. View Article : Google Scholar : PubMed/NCBI
|
|
23
|
Hu X, Huang Y, Bao Z, et al: Prevalence
and factors associated with nonalcoholic fatty liver disease in
Shanghai work-units. BMC Gastroenterol. 12:1232012. View Article : Google Scholar : PubMed/NCBI
|
|
24
|
Simental-Mendía LE, Rodríguez-Hernández H,
Rodríguez-Morán M and Guerrero-Romero F: The alanine
aminotransferase to triglycerides ratio as a marker to identify
nonalcoholic fatty liver disease. Eur J Gastroenterol Hepatol.
24:1173–1177. 2012.PubMed/NCBI
|


