Introduction
Iron is one of the most important trace elements
found in the human body. As with all cells, bone cells require iron
for numerous aspects of their physiology. A number of studies have
indicated that bone metabolism is closely associated with iron
metabolism. In particular, iron overload and iron deficiency may
lead to osteopenia or even osteoporosis (1–3).
Iron chelation therapy has been demonstrated to improve
osteoporosis in ovariectomized rats (4,5). In
addition, hepcidin (a peptide hormone that decreases iron levels in
the body) has also been investigated for the treatment of
osteoporosis in peri- and post-menopausal females (6). These studies indicate that iron plays
an important role in bone metabolism. Therefore, research into the
mechanisms underlying the iron balance in bone cells is crucial to
improve the understanding of the pathogenesis and treatment of
iron-associated bone disease.
In vitro studies have previously revealed
that iron excess inhibits osteoblastic metabolism due to the damage
caused by oxidative stress (7–9),
while iron deficiency can inhibit osteoblastogenesis due to the
decreased activity of ribonucleotide reductase (10,11).
Ferroportin 1 (FPN1), which contributes to iron release from cells
and the maintenance of iron homeostasis, is currently the only iron
exporter to be identified in mammals (12–14).
The exporter is highly expressed in macrophages, enterocytes and
hepatocytes (15,16). A recent study demonstrated that
FPN1 is also expressed in human osteoblasts (17). The expression of FPN1 in
macrophages (18–20), enterocytes (21,22),
hepatocytes (23) and cardiocytes
(24) has been reported to be
regulated by iron concentration; however, the association between
FPN1 and iron ion levels in osteoblasts is yet to be fully
elucidated. In the present study, the human osteoblast cell line
hFOB 1.19 was treated with ferric ammonium citrate (FAC) or
desferrioxamine (DFO) of various concentrations. The intracellular
levels of iron ions were measured using confocal laser scanning
microscopy (CLSM). In addition, the mRNA and protein expression
levels of FPN1 were detected by quantitative polymerase chain
reaction (qPCR), western blot analysis and immunofluorescence. The
aim of the present study was to provide further information to
improve the understanding of the role that FPN1 plays in
osteoblastic iron metabolism.
Materials and methods
Cell cultures and treatments
The hFOB 1.19 cell line (Shanghai Institute of
Biochemistry and Cell Biology, Shanghai, China) was maintained in
Dulbecco’s modified Eagle’s medium-F12, supplemented
with 10% fetal bovine serum and 3% G418 disulfate solution, in a
humidified atmosphere of 5% CO2 in air at 34°C. The
medium was replenished every 2–3 days. After reaching 70–80%
confluence, the cells were passaged by treatment with 0.05%
trypsin. For CLSM, qPCR and western blot analysis, FAC (Sinopharm
Chemical Reagent Co. Ltd., Shanghai, China) and DFO (Novartis
Pharma Schweiz AG, Rotkreuz, Switzerland) were added to the medium
at final concentrations of 50, 100 and 200 μmol/l for FAC as
treatment in the iron excess group and 5, 10 and 20 μmol/l for DFO
as treatment in the iron deficiency group. For immunofluorescence
FPN1 analysis, 50 μmol/l FAC and 10 μmo/l DFO were added for the
iron excess and iron deficiency groups, respectively. In the
control, the same amount of medium without FAC or DFO was used.
Cells were incubated with FAC and DFO for 20 h.
Confocal microcopy measurements
The hFOB 1.19 cells were seeded on coverslips for
the analysis of iron ions by fluorescence quenching. Briefly,
following treatment with FAC and DFO for 20 h, the hFOB 1.19 cells
were washed twice with phosphate-buffered saline (PBS) and
incubated with Phen Green FL (Molecular Probes, Eugene, OR, USA)
away from light at 34°C in a humidified atmosphere containing 5%
CO2 for 30 min. Next, the cells were washed twice with
PBS to remove the unbound fluorescent indicator, and then incubated
with the culture medium for an additional 15 min. CLSM model
TCS-SP2 (Leica, Wetzlar, Germany) was used to measure the green
fluorescence of Phen Green FL when excited at 488 nm and emitted at
521 nm.
qPCR analysis
Total RNA was extracted from the hFOB 1.19 cells
following treatment using TRIzol reagent (Invitrogen Life
Technologies, Carlsbad, CA, USA) and single-stranded cDNA was
synthesized using a reverse transcription kit purchased from
Promega Corporation (Madison, WI, USA), according to the
manufacturer’s instructions. qPCR was performed using a real-time
PCR system (Applied Biosystems Step One; Thermo Fisher Scientific,
Waltham, MA, USA). Amplification reactions were conducted in a
20-μl volume using SYBR-Green I dye under the following
amplification conditions: 30 cycles of 94°C for 30 sec, 50°C for 30
sec and 72°C for 30 sec. Primers were designed to specifically
amplify 176 bp of human FPN1 cDNA (forward,
5′-CTACTTGGGGAGATCGGATGT-3′ and reverse,
5′-CTGGGCCACTTTAAGTCTAGC-3′); and 306 bp of human β-actin cDNA
(forward, 5′-TCCTGTGGCATC CACGAAACT-3′ and reverse,
5′-GAAGCATTTGCGGTG GACGAT-3′). The mRNA/cDNA abundance of each gene
was calculated relative to the expression of the housekeeping gene,
β-actin. Relative quantification was calculated using the
2−ΔΔCT method and analysis was performed using Step One™
Software V 2.1 (Thermo Fisher Scientific).
Western blot analysis
Total protein was extracted from the hFOB 1.19 cells
following treatment using radioimmunoprecipitation assay buffer,
and separated on 6% SDS gel prior to transfer onto polyvinylidene
difluoride membranes. The membranes were blocked in 5% (m/v) milk
dissolved in Tris-buffered saline with 0.05% (w/v) Tween-20 (TBS-T)
and incubated overnight at 4°C with rabbit anti-ferroportin,
(1:200) or anti-β-actin (1:500; Abcam, Cambridge, MA, USA) primary
antibodies. Following washing three times with TBS-T at room
temperature, the membranes were incubated for 1 h with goat
peroxidase-labeled anti-rabbit immunoglobulin (1:500), and
visualized with enhanced chemiluminescence (Amersham Biosciences
Corporation, Piscataway, NJ, USA). The images were analyzed with
ImageJ software (National Institutes of Health, Bethesda, MD,
USA).
Immunofluorescence analysis
Cells were seeded on glass coverslips for
immunofluorescence analysis. Following treatment, the cells were
fixed with 4% paraformaldehyde for 15 min and washed twice with
PBS. The cells were then incubated in a blocking solution (5%
bovine serum albumin) for 30 min at room temperature, followed by
incubation with primary antibodies (rabbit anti-ferroportin 1;
1:50; Abcam) in a humid chamber at 4°C overnight. Following washing
three times with PBS, the cells were incubated with a fluorescein
isothiocyanate-conjugated goat anti-rabbit antibody (1:1,000;
Jackson ImmunoResearch Laboratories, Inc., West Grove, PA, USA) at
room temperature for 30 min. Coverslips were then washed three
times with PBS, mounted and observed using a fluorescent microscope
(Axio Observer A1; Carl Zeiss AG, Oberkochen, Germany).
Statistical analysis
Data are expressed as the mean ± standard deviation,
and were analyzed with one-way analysis of variance with post-hoc
analysis using SPSS version 15.01 for Windows (SPSS, Inc., Chicago,
IL, USA). P<0.05 was considered to indicate a statistically
significant difference.
Results
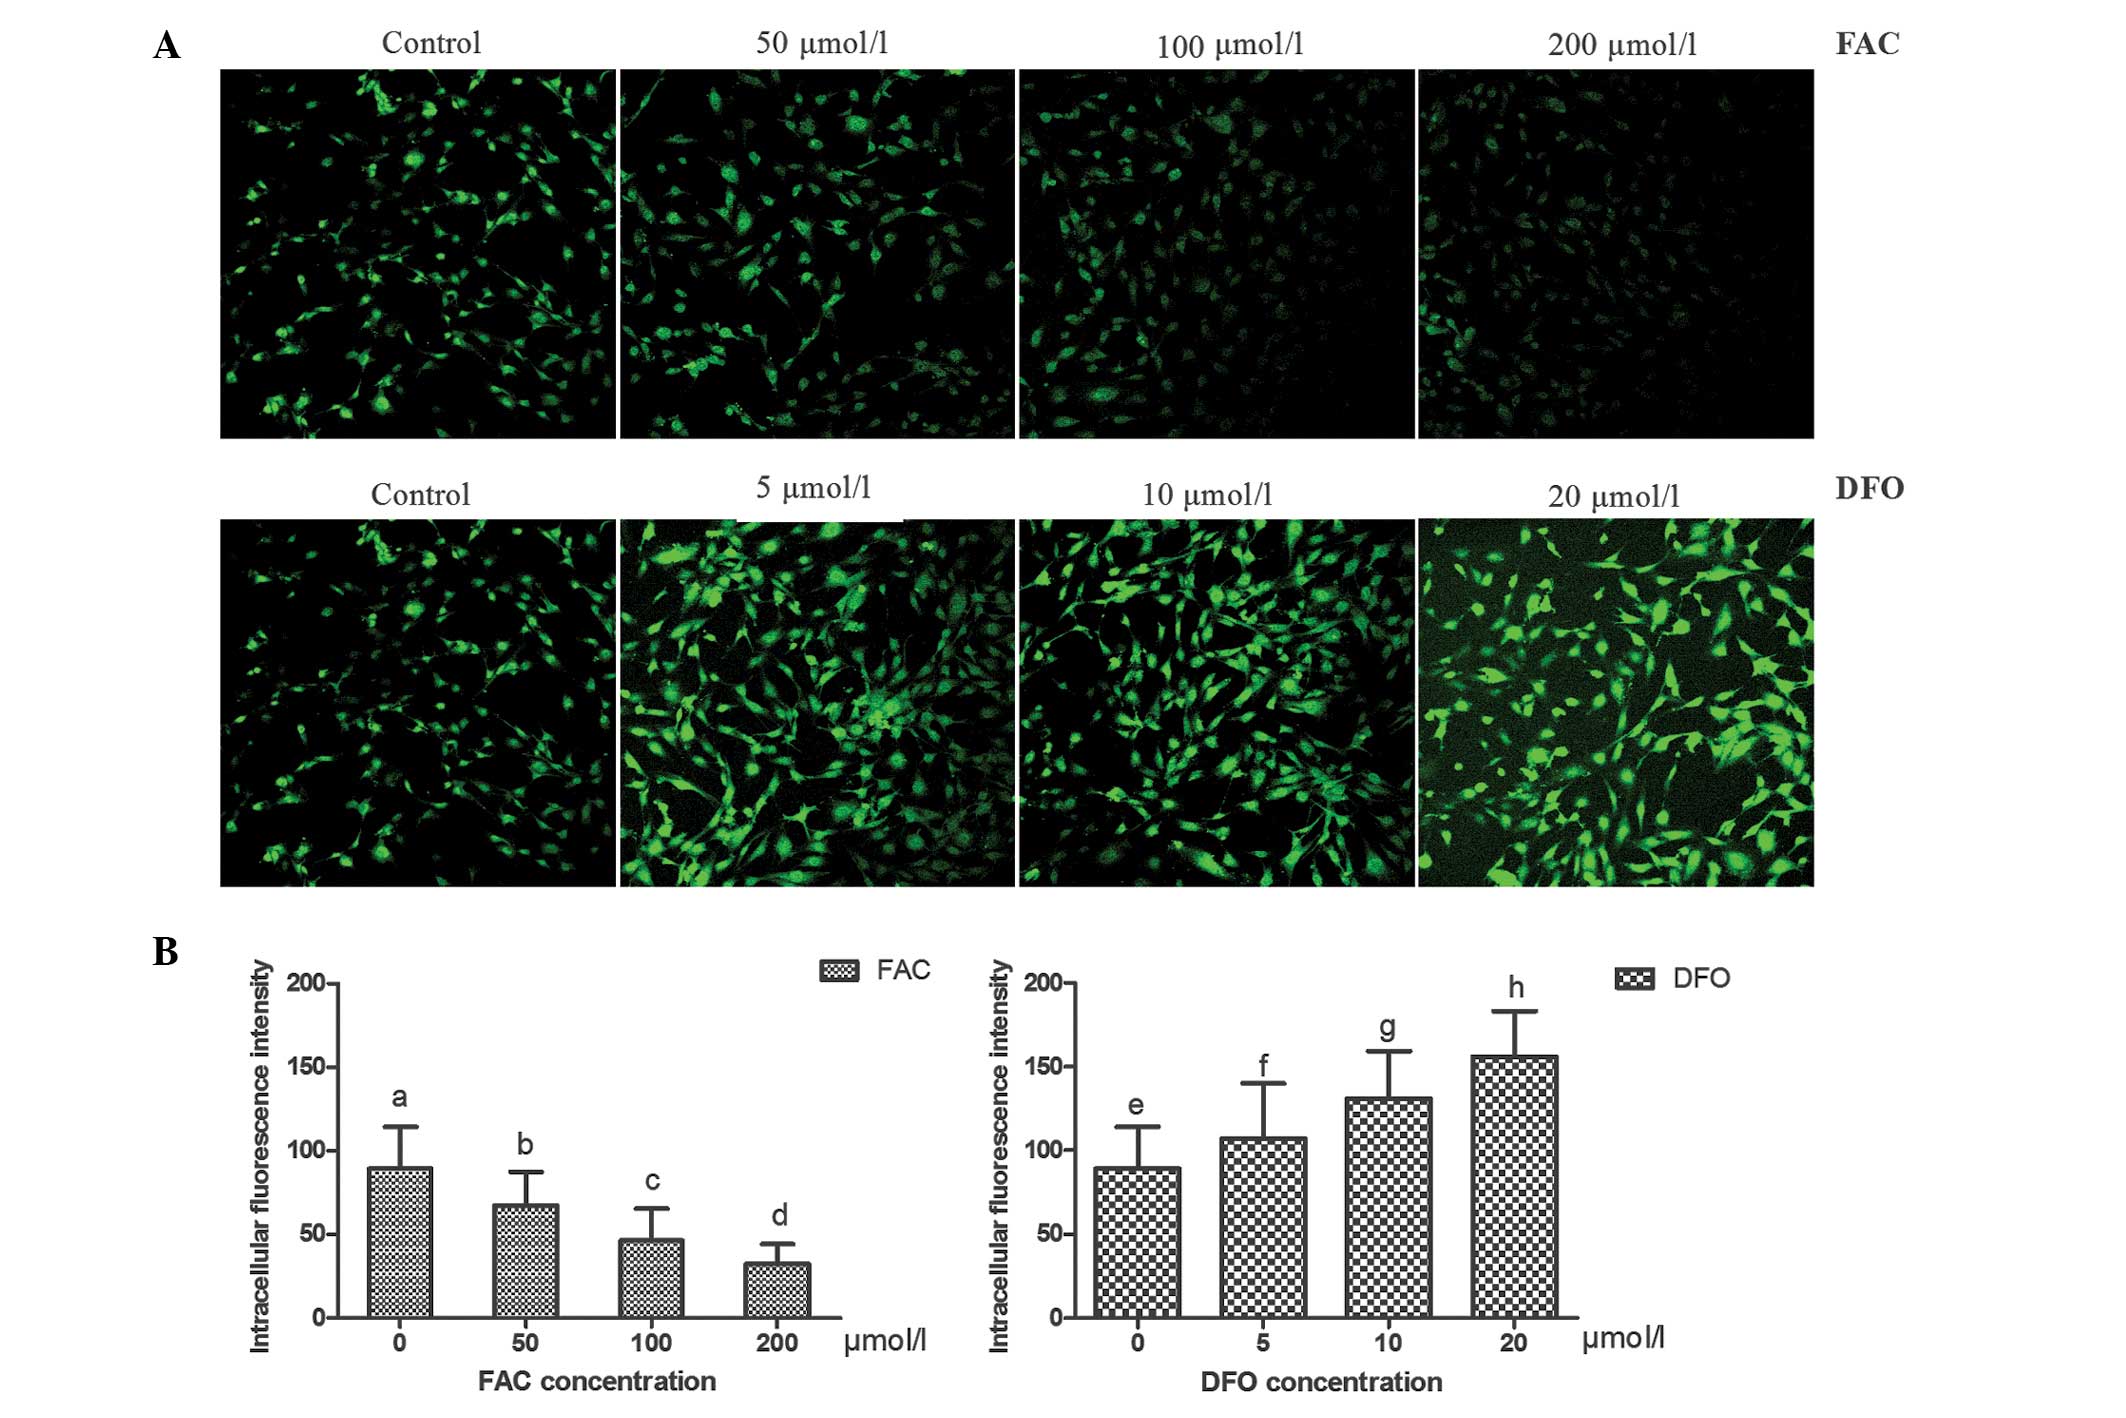
Intracellular fluorescence quenching by
iron following treatment with FAC and DFO
The hFOB 1.19 cells in culture exhibited typical
spindle and polygon shapes. Following exposure to various
concentrations of FAC and DFO for 20 h, a correlation between the
fluorescence intensity in the hFOB 1.19 cells and the intracellular
iron concentration was observed; the fluorescence intensity
significantly weakened with increasing FAC concentrations, but was
enhanced with increasing DFO concentrations (P<0.05 for all
comparisons; Fig. 1). These
observations indicate that FAC effectually increased the
intracellular iron concentration, while DFO effectually decreased
the intracellular iron levels.
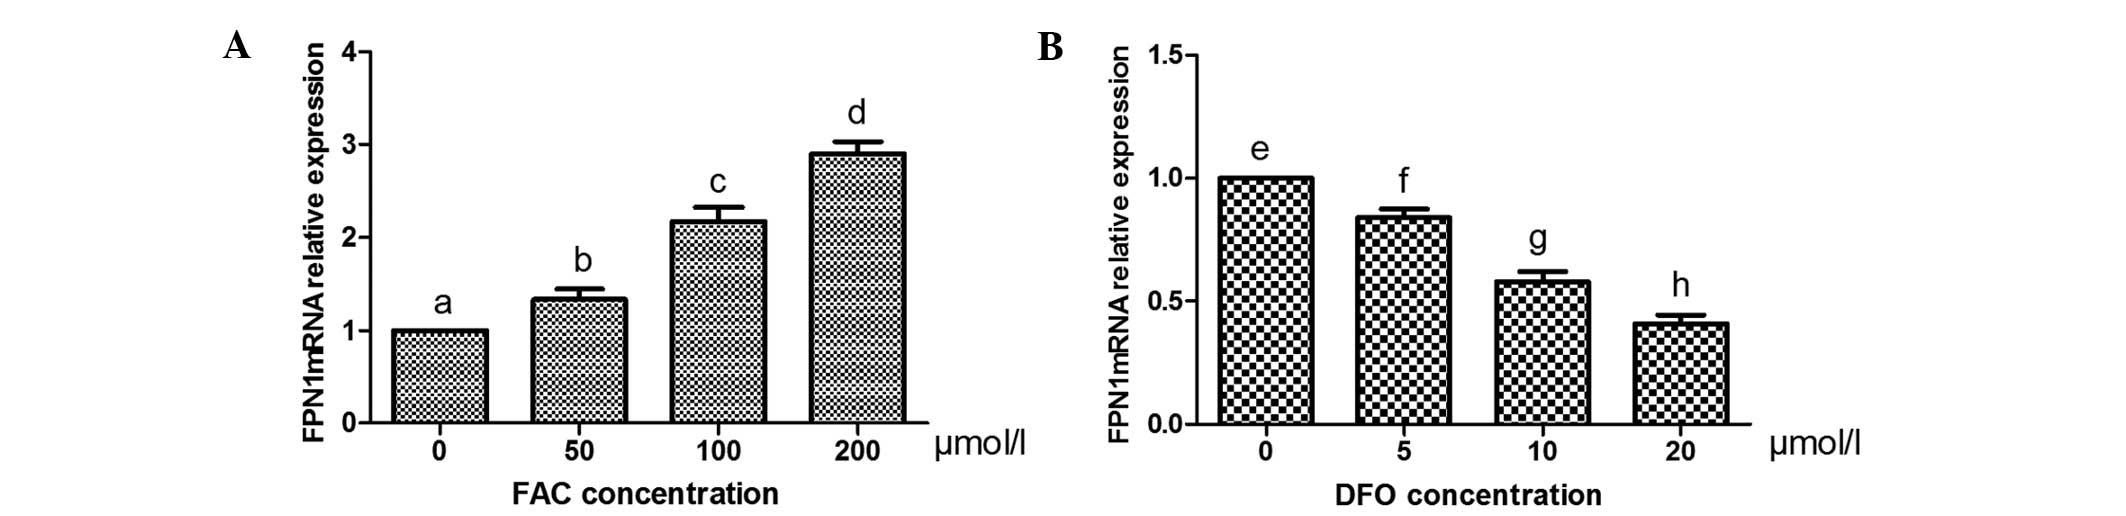
mRNA and protein expression levels of
FPN1 following treatment with FAC and DFO
qPCR revealed that the mRNA expression levels of
FPN1 in osteoblasts increased with increasing concentrations of FAC
in a concentration-dependent manner, whereas they decreased with
increasing concentrations of DFO in a concentration-dependent
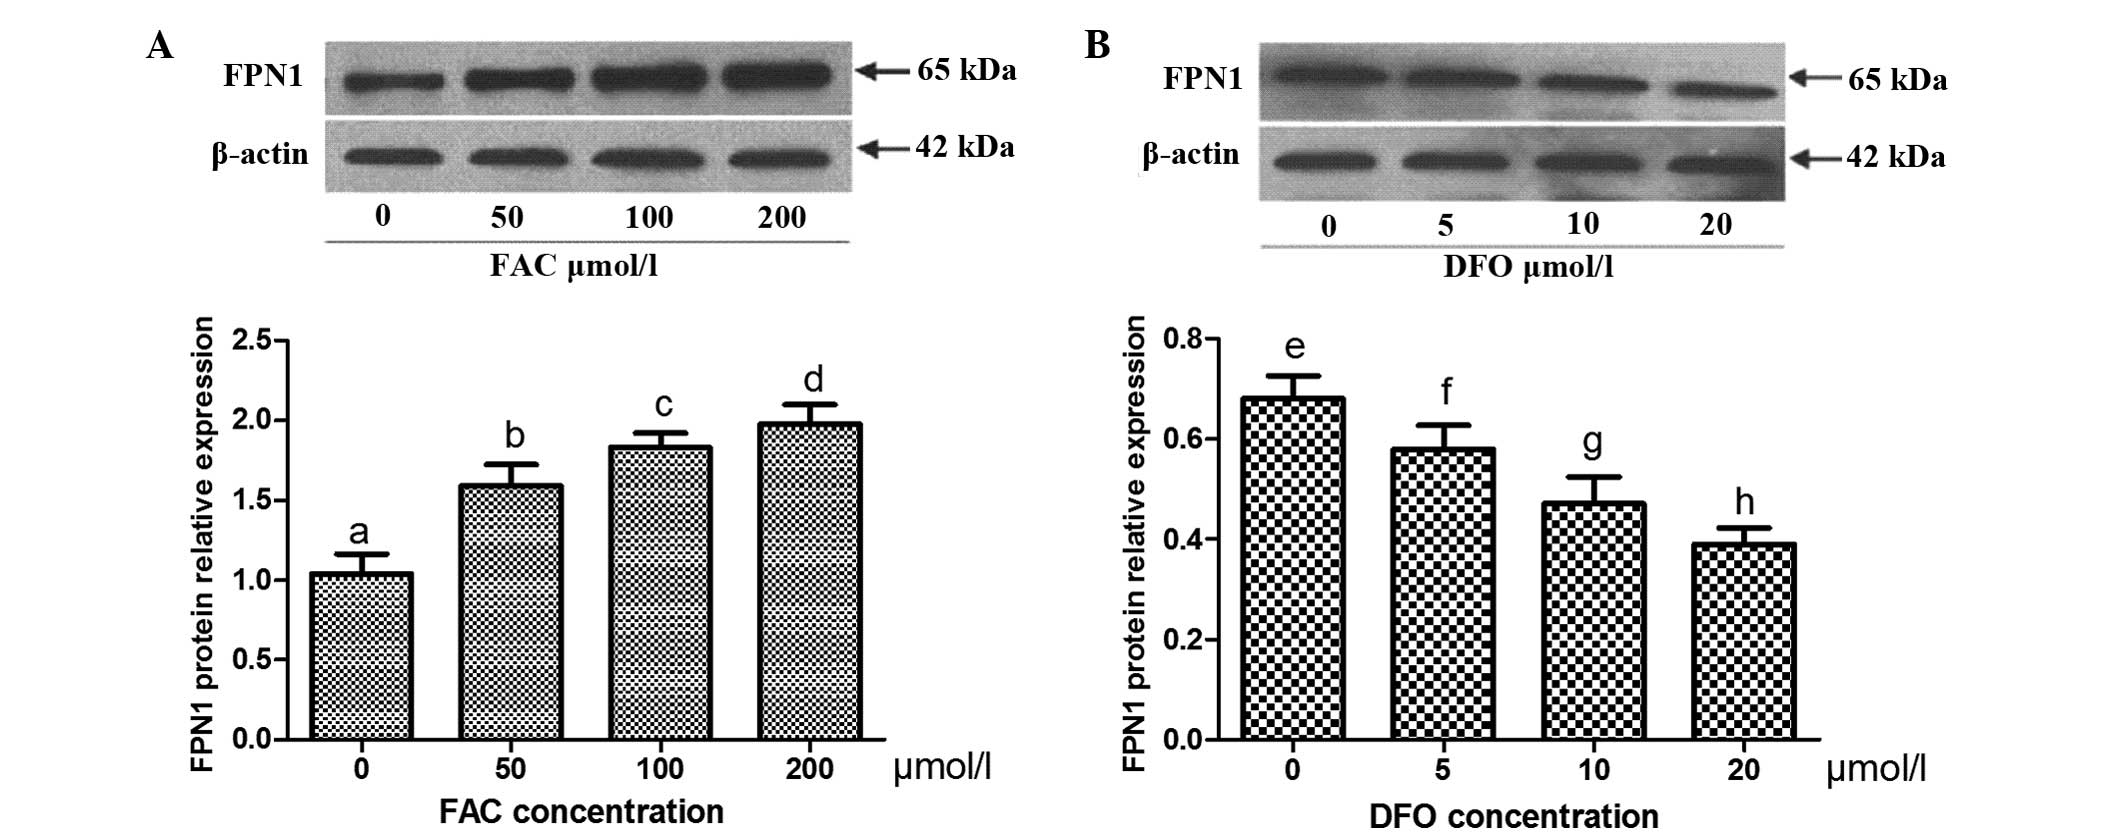
manner (P<0.05 for all comparisons; Fig. 2). Western blot analysis
demonstrated the same pattern of FPN1 expression at the protein
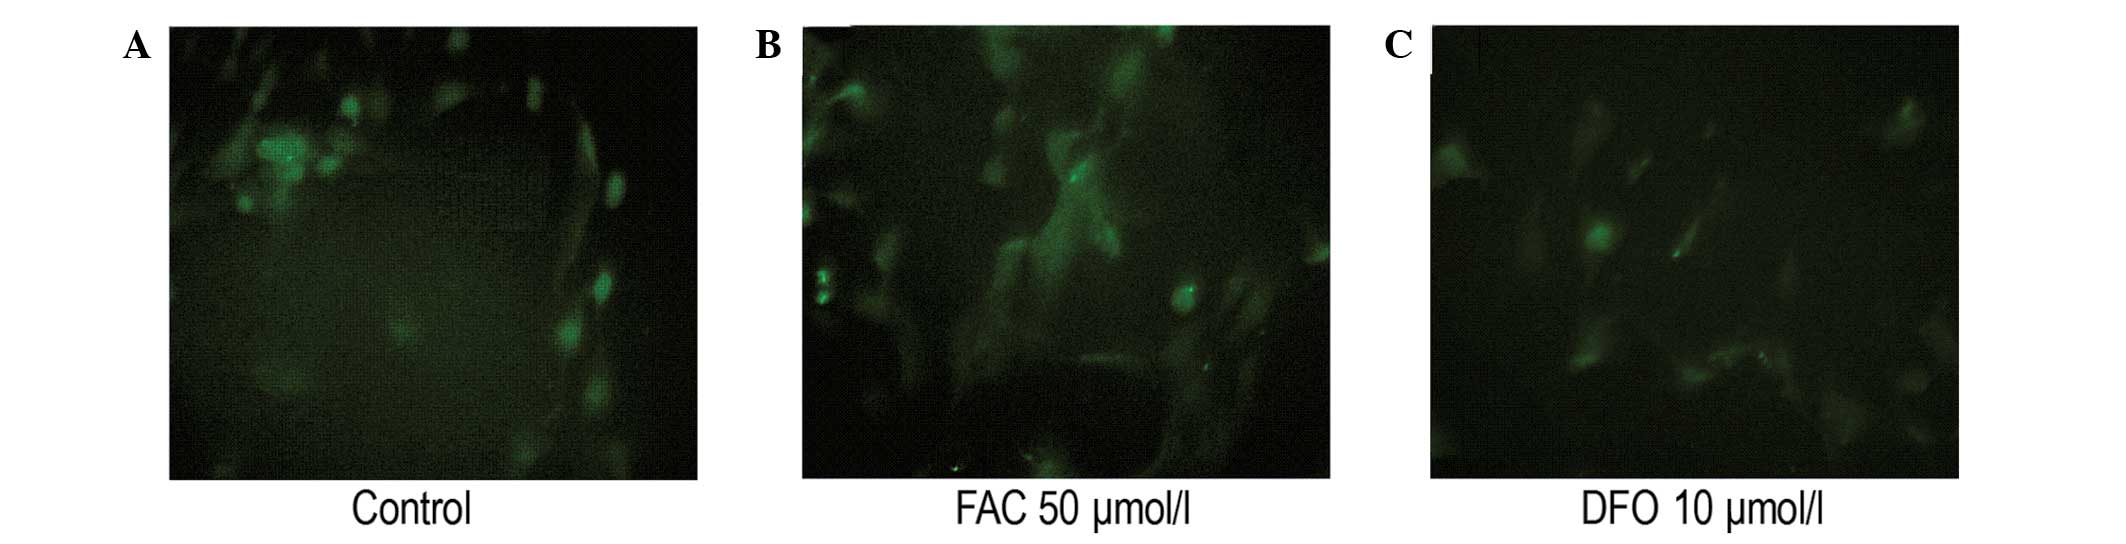
level (Fig. 3). Immunofluorescence
analysis revealed that the intensity of FPN1 fluorescence in the
cells treated with 50 μmol/l FAC was significantly increased when
compared with that of the control. In addition, the fluorescence
intensity in the cells treated with 10 μmol/l DFO was significantly
decreased when compared with that of the control (Fig. 4).
Discussion
Previous studies have demonstrated that the
expression of intracellular FPN1 may be regulated by iron levels in
a number of cell types. In 2002, Yang et al (25) found that the mRNA expression of
FPN1 was significantly increased in human lung macrophages treated
with excessive iron using in situ hybridization. In 2003,
Knutson et al (18)
reported that iron excess increased the mRNA expression levels of
FPN1, while iron deficiency decreased the mRNA expression levels of
FPN1 in murine J744 macrophages. Furthermore, this effect was
completely inhibited by actinomycin D, an inhibitor of RNA
polymerase. The results of these studies indicated that the
regulation of FPN1 by iron occurs at a transcriptional level in
macrophages. In the present study, iron ions were added to the
medium in the form of FAC, and a chelator of iron ions was added in
the form of DFO. The iron content of the treated cells was measured
by CLSM and the results confirmed that iron excess or iron
deficiency was achieved in osteoblasts treated with FAC or DFO,
respectively. Iron excess was shown to increase the mRNA expression
of FPN1 in osteoblasts, while iron deficiency decreased the mRNA
expression of FPN1 in osteoblasts. These observations indicated
that the regulation of FPN1 by iron also occurs at a
transcriptional level in osteoblasts. The mechanism underlying
regulation at a transcriptional level has been demonstrated to be
associated with nuclear factor erythroid-derived 2-like 2 (Nrf2), a
transcriptional activator (26).
In the case of iron excess, oxidative stress was increased,
resulting in Nrf2 nuclear accumulation and the promotion of FPN1
mRNA transcription. In the case of iron deficiency, oxidative
stress was decreased, leading to a reduction in Nrf2 expression,
thereby the transcription of FPN1 mRNA was inhibited (27).
In recent years, a number of studies have
demonstrated that the 5′-untranslated region (UTR) of FPN1 mRNA
contains an iron responsive element (IRE). This structure indicates
that the regulation of FPN1 expression may occur at a translational
level, in a similar manner to ferritin and mitochondrial aconitase
(28,29). The presence of the IRE in the
5′-UTR of the mRNA functions as a negative regulator of
translation. When intracellular iron levels are high, the activity
levels of iron regulatory proteins (IRPs) decrease and, thus, are
unable to bind to the 5′-IRE, leading to increased translation of
FPN1 mRNA and a release of iron. By contrast, when intracellular
iron levels are low, IRPs bind to the 5′-IRE and inhibit the
translation of FPN1 mRNA, which results in the decreased release of
iron (30). The IRE of FPN1 mRNA
has been shown to be functional in a variety of cell types,
including the human monocytic cell line U937 (31), and the mouse macrophage cell line
RAW264.7 (32). Furthermore, the
expression of FPN1 has been shown to be unaffected by iron
treatment in HepG2 and Caco-2 cells with knockout IRE (31). The present study demonstrated that
with changes to the intracellular iron content, the expression of
PFN1 at the protein level also changes. Therefore, we hypothesized
that control of the level of translation may also be involved in
the regulation of FPN1 expression in osteoblasts. The regulation of
FPN1 at a transcriptional and translational level may be conductive
to the balance of intracellular iron. In addition, this process is
useful in decreasing iron-mediated oxidative stress to
osteoblasts.
In the present study, excessive iron was shown to
increase the expression of FPN1, while iron deficiency decreased
the expression of FPN1 in osteoblasts. Similar results have also
been observed in bronchial epithelial cells (25), macrophages (18–20),
cardiocytes (24) and hepatocytes
(23). However, the expression of
FPN1 exhibited opposite effects in enterocytes (21,22)
and placental syncytiotrophoblast cells (33), where excessive iron decreased the
expression of FPN1 and iron deficiency increased the expression of
FPN1. This difference may be associated with cell type. For
example, intestinal epithelial cells and placental cells are
responsible for the transportation of exogenous iron into plasma;
thus, the molecular mechanisms underlying iron metabolism may be
different from those of other cells. In addition, Marro et
al (34) reported that FAC
added in vitro did not affect the expression of FPN1 in the
mouse macrophage cell line RAW 264.7. However, the results of the
present study are not consistent with these observations, which may
be explained by differences in the concentrations of FAC. In the
previous study, 2 μmol/l FAC was applied; this concentration was
10–100 fold lower than that applied in the present study. The
normal serum iron concentration in the human body is 12.5–30
μmol/l, and in the case of an iron overload, the concentration can
increase to >50 μmol/l. Therefore, FAC at a higher concentration
may simulate iron overload in vivo more closely.
In conclusion, excessive iron increased the
expression of FPN1 in osteoblasts, while iron deficiency decreased
the expression of FPN1 in osteoblasts. The regulation of FPN1 in
osteoblasts by iron may occur at transcriptional and translational
levels. These observations indicate that FPN1 plays an important
role in iron metabolism in osteoblasts.
Acknowledgements
The study was partially supported by grants from the
National Natural Science Foundation of China (no. 81273090),
Jiangsu Provincial Grant (no. BK2012608), the Social Development
Fund of Jiangsu Province (no. BE2011605) and the Research and
Innovation Project for College Graduates of Jiangsu Province (no.
CXZZ12_0845).
References
|
1
|
Weinberg ED: Iron loading: a risk factor
for osteoporosis. Biometals. 19:633–635. 2006. View Article : Google Scholar : PubMed/NCBI
|
|
2
|
Weinberg ED: Role of iron in osteoporosis.
Pediatr Endocrinol Rev. 6(Suppl 1): 81–85. 2008.
|
|
3
|
Jian J, Pelle E and Huang X: Iron and
menopause: does increased iron affect the health of postmenopausal
women? Antioxid Redox Signal. 11:2939–2943. 2009. View Article : Google Scholar : PubMed/NCBI
|
|
4
|
Liu G, Men P, Kenner GH and Miller SC:
Age-associated iron accumulation in bone: implications for
postmenopausal osteoporosis and a new target for prevention and
treatment by chelation. Biometals. 19:245–251. 2006. View Article : Google Scholar : PubMed/NCBI
|
|
5
|
Liu G, Men P, Kenner GH and Miller SC:
Therapeutic effects of an oral chelator targeting skeletal tissue
damage in experimental postmenopausal osteoporosis in rats.
Hemoglobin. 32:181–190. 2008. View Article : Google Scholar : PubMed/NCBI
|
|
6
|
Li GF, Pan YZ, Sirois P, et al: Iron
homeostasis in osteoporosis and its clinical implications.
Osteoporos Int. 23:2403–2408. 2012. View Article : Google Scholar : PubMed/NCBI
|
|
7
|
Doyard M, Fatih N, Monnier A, et al: Iron
excess limits HHIPL-2 gene expression and decreases osteoblastic
activity in human MG-63 cells. Osteoporos Int. 23:2435–2445. 2012.
View Article : Google Scholar : PubMed/NCBI
|
|
8
|
Messer JG, Kilbarger AK, Erikson KM and
Kipp DE: Iron overload alters iron-regulatory genes and proteins,
down-regulates osteoblastic phenotype, and is associated with
apoptosis in fetal rat calvaria cultures. Bone. 45:972–979. 2009.
View Article : Google Scholar : PubMed/NCBI
|
|
9
|
Yamasaki K and Hagiwara H: Excess iron
inhibits osteoblast metabolism. Toxicol Lett. 191:211–215. 2009.
View Article : Google Scholar : PubMed/NCBI
|
|
10
|
Messer JG, Cooney PT and Kipp DE: Iron
chelator deferoxamine alters iron-regulatory genes and proteins and
suppresses osteoblast phenotype in fetal rat calvaria cells. Bone.
46:1408–1415. 2010. View Article : Google Scholar : PubMed/NCBI
|
|
11
|
Pattanapanyasat K, Webster HK, Tongtawe P,
et al: Effect of orally active hydroxypyridinone iron chelators on
human lymphocyte function. Br J Haematol. 82:13–19. 1992.
View Article : Google Scholar : PubMed/NCBI
|
|
12
|
Donovan A, Lima C and Andrews NC: Analysis
of iron homeostasis in mice with a targeted deletion of the gene
encoding the iron exporter Ferroportin 1. Blood. 102:157a2003.
|
|
13
|
Ganz T: Cellular iron: ferroportin is the
only way out. Cell Metab. 1:155–157. 2005. View Article : Google Scholar : PubMed/NCBI
|
|
14
|
Rice AE, Mendez MJ, Hokanson CA, et al:
Investigation of the biophysical and cell biological properties of
ferroportin, a multipass integral membrane protein iron exporter. J
Mol Biol. 386:717–732. 2009. View Article : Google Scholar : PubMed/NCBI
|
|
15
|
Canonne-Hergaux F, Donovan A, Delaby C, et
al: Comparative studies of duodenal and macrophage ferroportin
proteins. Am J Physiol Gastrointest Liver Physiol. 290:G156–G163.
2006. View Article : Google Scholar : PubMed/NCBI
|
|
16
|
Yang F, Liu XB, Quinones M, et al:
Regulation of reticuloendothelial iron transporter MTP1 (Slc11a3)
by inflammation. J Biol Chem. 277:39786–39791. 2002. View Article : Google Scholar : PubMed/NCBI
|
|
17
|
Xu Y, Zhang W, Zhang P, et al:
Downregulation of ferroportin 1 expression in hFOB1.19 osteoblasts
by hepcidin. Inflammation. 35:1058–1061. 2012. View Article : Google Scholar : PubMed/NCBI
|
|
18
|
Knutson MD, Vafa MR, Haile DJ and
Wessling-Resnick M: Iron loading and erythrophagocytosis increase
ferroportin 1 (FPN1) expression in J774 macrophages. Blood.
102:4191–4197. 2003. View Article : Google Scholar : PubMed/NCBI
|
|
19
|
Delaby C, Pilard N, Hetet G, et al: A
physiological model to study iron recycling in macrophages. Exp
Cell Res. 310:43–53. 2005. View Article : Google Scholar : PubMed/NCBI
|
|
20
|
Delaby C, Pilard N, Gonçalves AS, et al:
Presence of the iron exporter ferroportin at the plasma membrane of
macrophages is enhanced by iron loading and down-regulated by
hepcidin. Blood. 106:3979–3984. 2005. View Article : Google Scholar : PubMed/NCBI
|
|
21
|
Thomas C and Oates PS:
Ferroportin/IREG-1/MTP-1/SLC40A1 modulates the uptake of iron at
the apical membrane of enterocytes. Gut. 53:44–49. 2004. View Article : Google Scholar : PubMed/NCBI
|
|
22
|
Zoller H, Theurl I, Koch R, et al:
Mechanisms of iron mediated regulation of the duodenal iron
transporters divalent metal transporter 1 and ferroportin 1. Blood
Cells Mol Dis. 29:488–497. 2002. View Article : Google Scholar : PubMed/NCBI
|
|
23
|
Balusikova K, Neubauerova J,
Dostalikova-Cimburova M, et al: Differing expression of genes
involved in non-transferrin iron transport across plasma membrane
in various cell types under iron deficiency and excess. Mol Cell
Biochem. 321:123–133. 2009. View Article : Google Scholar
|
|
24
|
Qian ZM, Chang YZ, Leung G, et al:
Expression of ferroportin1, hephaestin and ceruloplasmin in rat
heart. Biochim Biophys Acta. 1772:527–532. 2007. View Article : Google Scholar : PubMed/NCBI
|
|
25
|
Yang F, Wang X, Haile DJ, et al: Iron
increases expression of iron-export protein MTP1 in lung cells. Am
J Physiol Lung Cell Mol Physiol. 283:L932–L939. 2002.PubMed/NCBI
|
|
26
|
Nairz M, Schleicher U, Schroll A, et al:
Nitric oxide-mediated regulation of ferroportin-1 controls
macrophage iron homeostasis and immune function in Salmonella
infection. J Exp Med. 210:855–873. 2013. View Article : Google Scholar : PubMed/NCBI
|
|
27
|
Harada N, Kanayama M, Maruyama A, et al:
Nrf2 regulates ferroportin 1-mediated iron efflux and counteracts
lipopolysaccharide-induced ferroportin 1 mRNA suppression in
macrophages. Arch Biochem Biophys. 508:101–109. 2011. View Article : Google Scholar : PubMed/NCBI
|
|
28
|
McKie AT, Marciani P, Rolfs A, et al: A
novel duodenal iron-regulated transporter, IREG1, implicated in the
basolateral transfer of iron to the circulation. Mol Cell.
5:299–309. 2000. View Article : Google Scholar : PubMed/NCBI
|
|
29
|
Donovan A, Brownlie A, Zhou Y, et al:
Positional cloning of zebrafish ferroportin1 identifies a conserved
vertebrate iron exporter. Nature. 403:776–781. 2000. View Article : Google Scholar : PubMed/NCBI
|
|
30
|
Eisenstein RS: Iron regulatory proteins
and the molecular control of mammalian iron metabolism. Annu Rev
Nutr. 20:627–662. 2000. View Article : Google Scholar : PubMed/NCBI
|
|
31
|
Lymboussaki A, Pignatti E, Montosi G, et
al: The role of the iron responsive element in the control of
ferroportin1/IREG1/MTP1 gene expression. J Hepatol. 39:710–715.
2003. View Article : Google Scholar : PubMed/NCBI
|
|
32
|
Liu XB, Hill P and Haile DJ: Role of the
ferroportin iron-responsive element in iron and nitric oxide
dependent gene regulation. Blood Cells Mol Dis. 29:315–326. 2002.
View Article : Google Scholar : PubMed/NCBI
|
|
33
|
Li YQ, Bai B, Cao XX, et al: Ferroportin 1
and hephaestin expression in BeWo cell line with different iron
treatment. Cell Biochem Funct. 30:249–255. 2012. View Article : Google Scholar : PubMed/NCBI
|
|
34
|
Marro S, Chiabrando D, Messana E, et al:
Heme controls ferroportin1 (FPN1) transcription involving Bach1,
Nrf2 and a MARE/ARE sequence motif at position −7007 of the FPN1
promoter. Haematologica. 95:1261–1268. 2010.PubMed/NCBI
|